
Modelling Maritime Pine (Pinus pinaster Aiton) Spatial Distribution and Productivity in Portugal: Tools for Forest Management

 ,
,  ,
,  , and
, and 
Abstract
:1. Introduction
2. Materials and Methods
2.1. Study Area
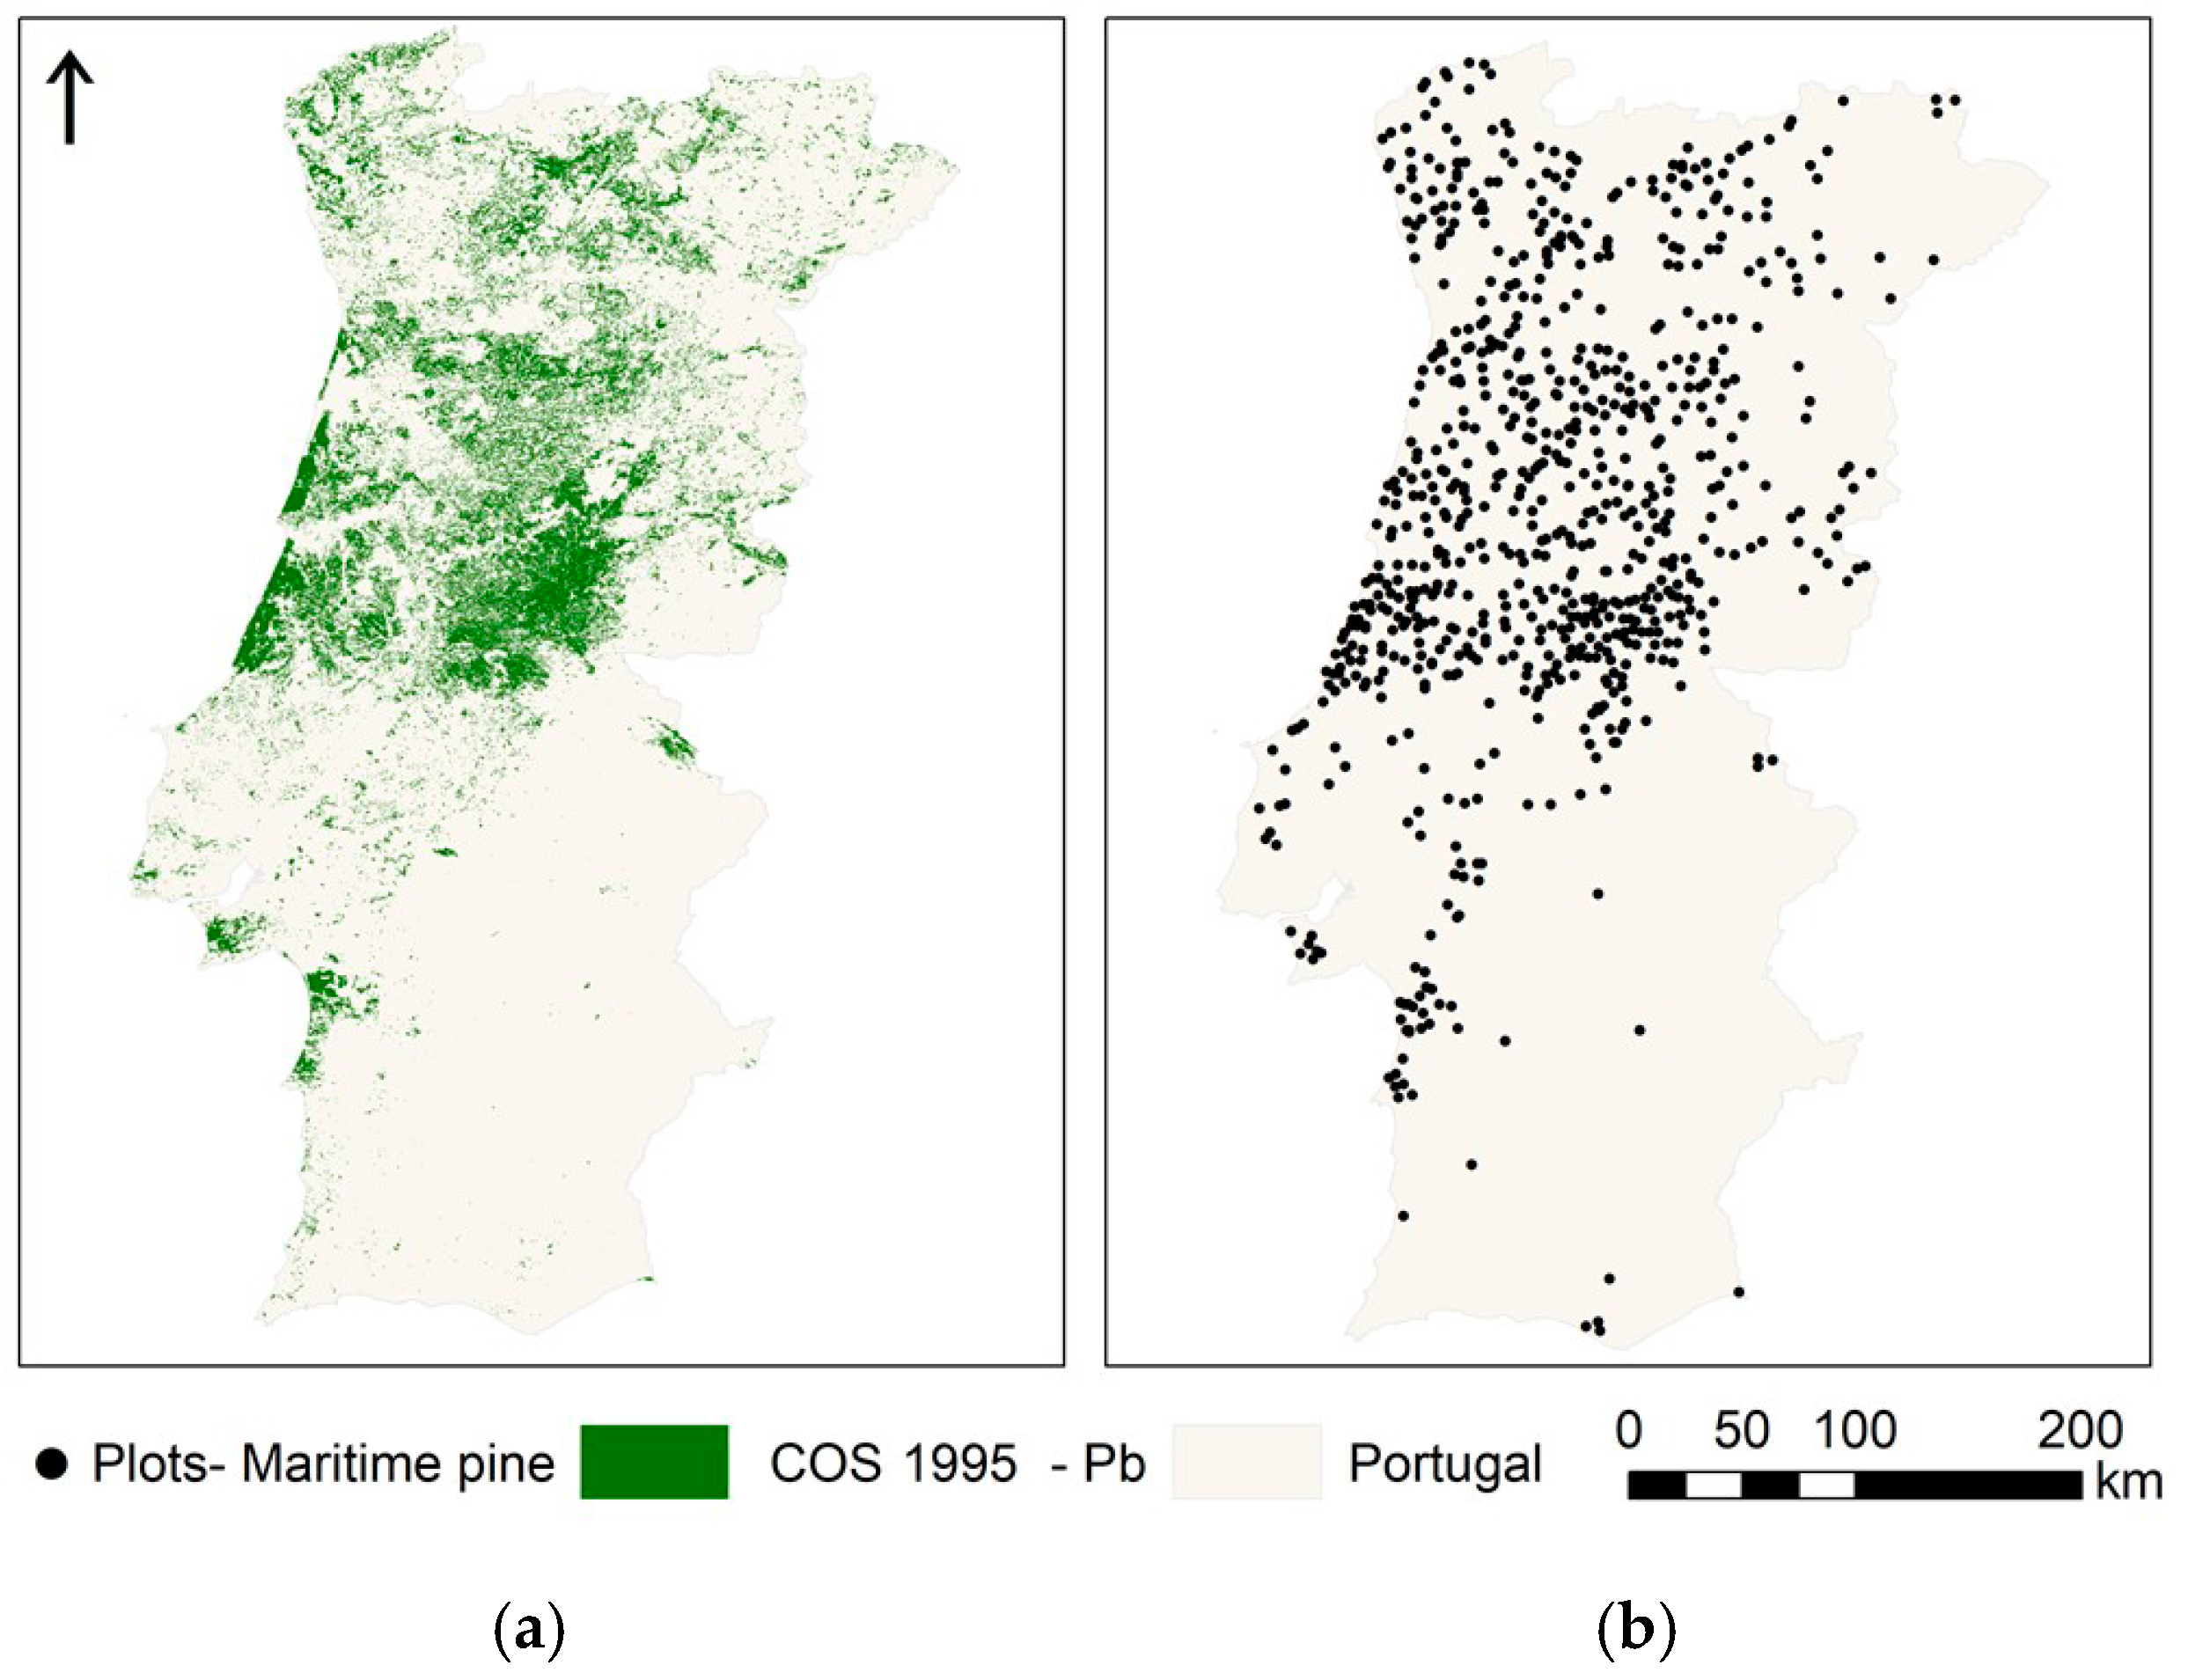
2.2. Hard Data—Land Cover and Forest Inventory
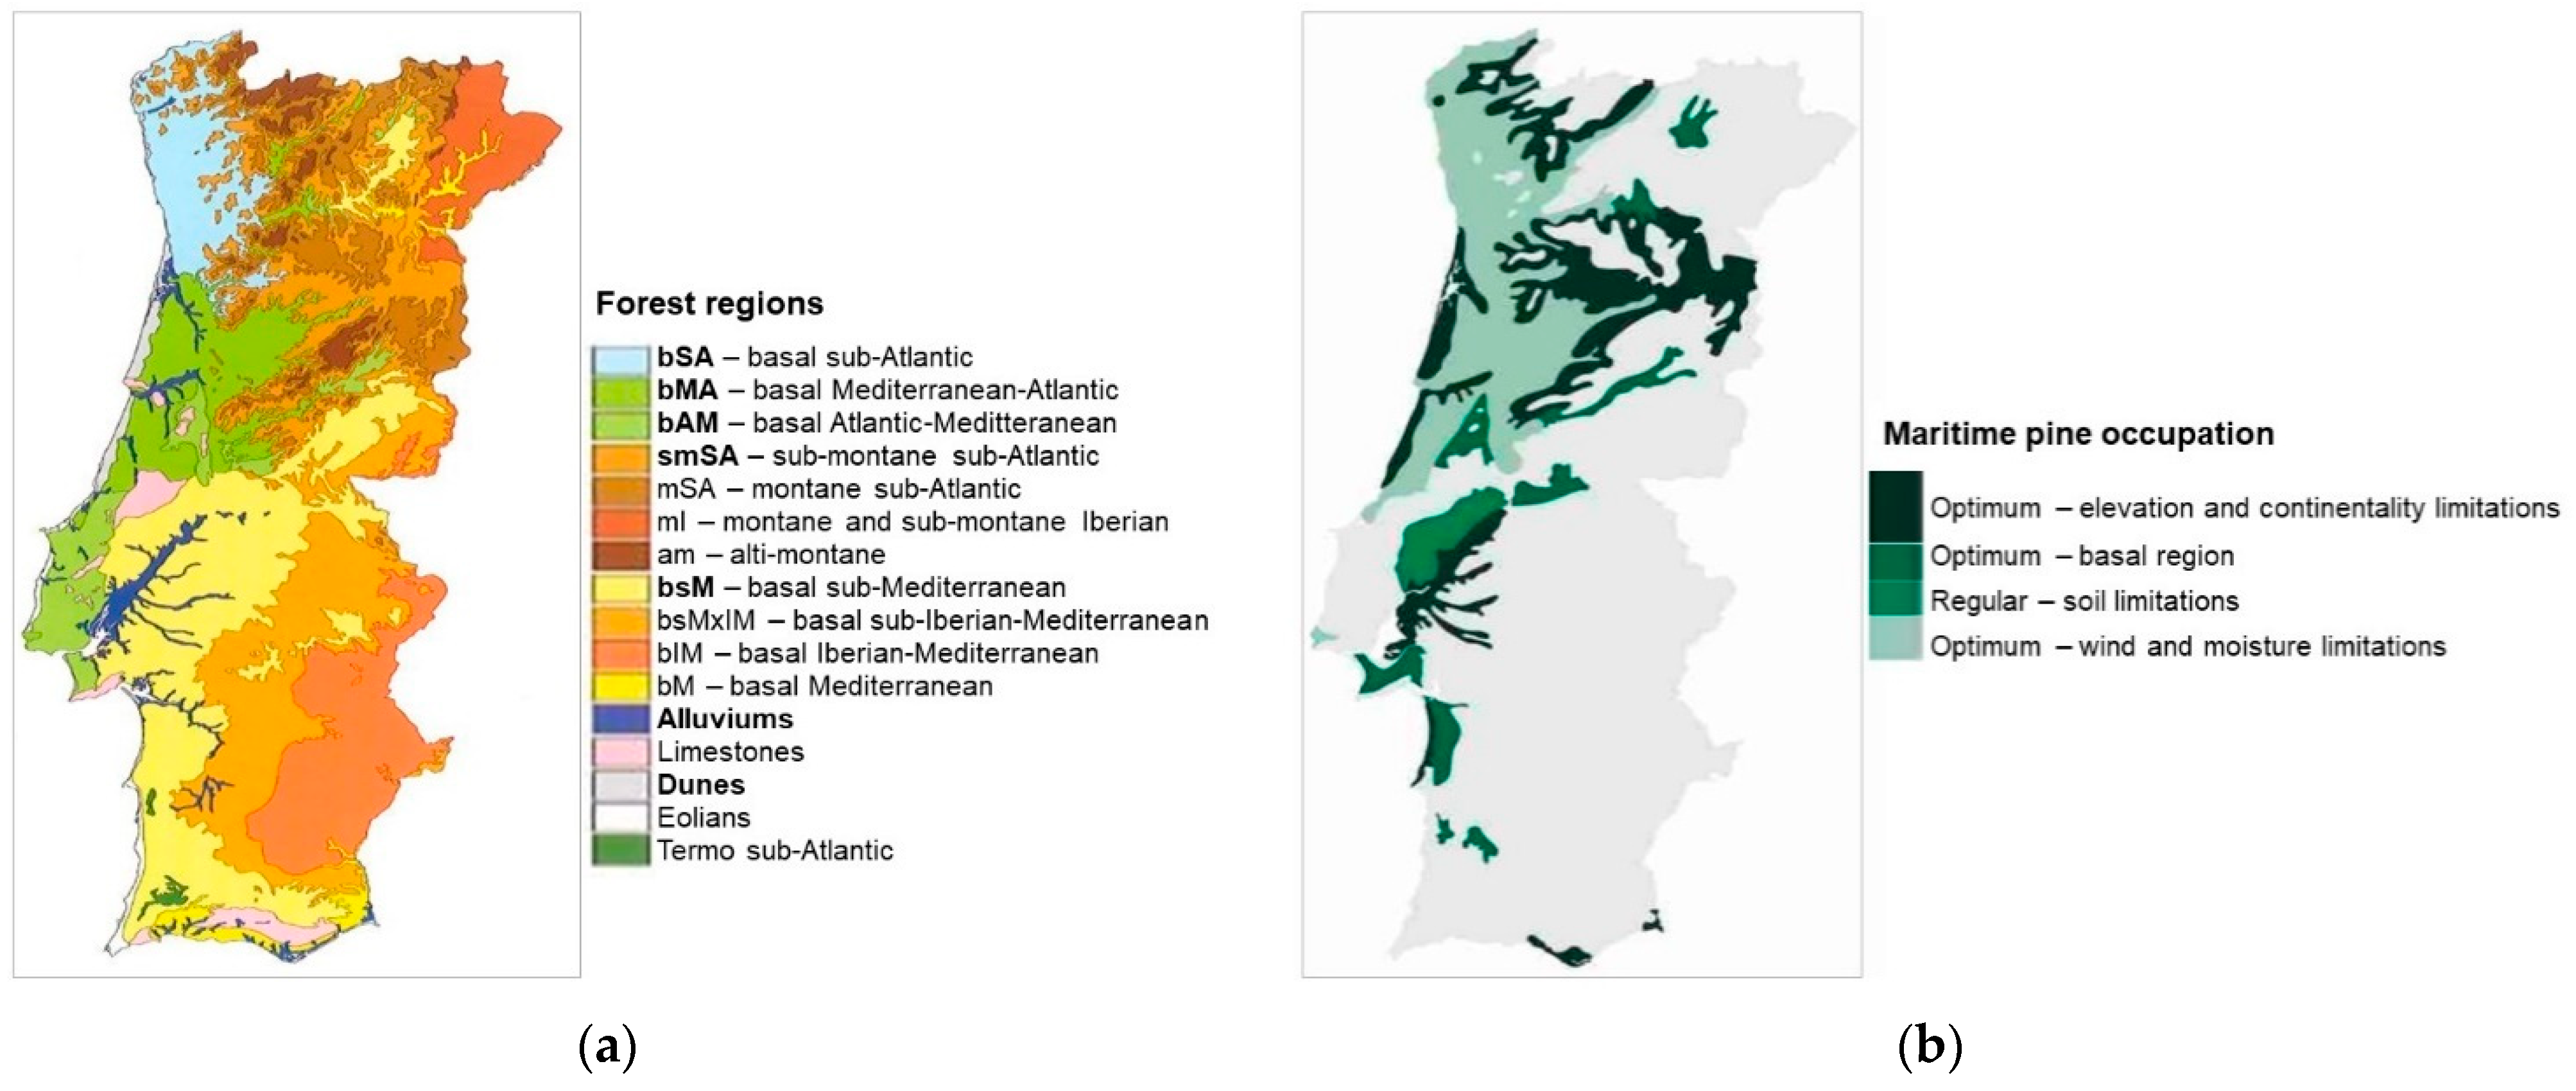
2.3. Soft Data—Climate, Topography, and Soil Attributtes
2.4. Methods
2.4.1. Species’ Distribution and Productivity Modeling—A Machine Learning Regression Approach
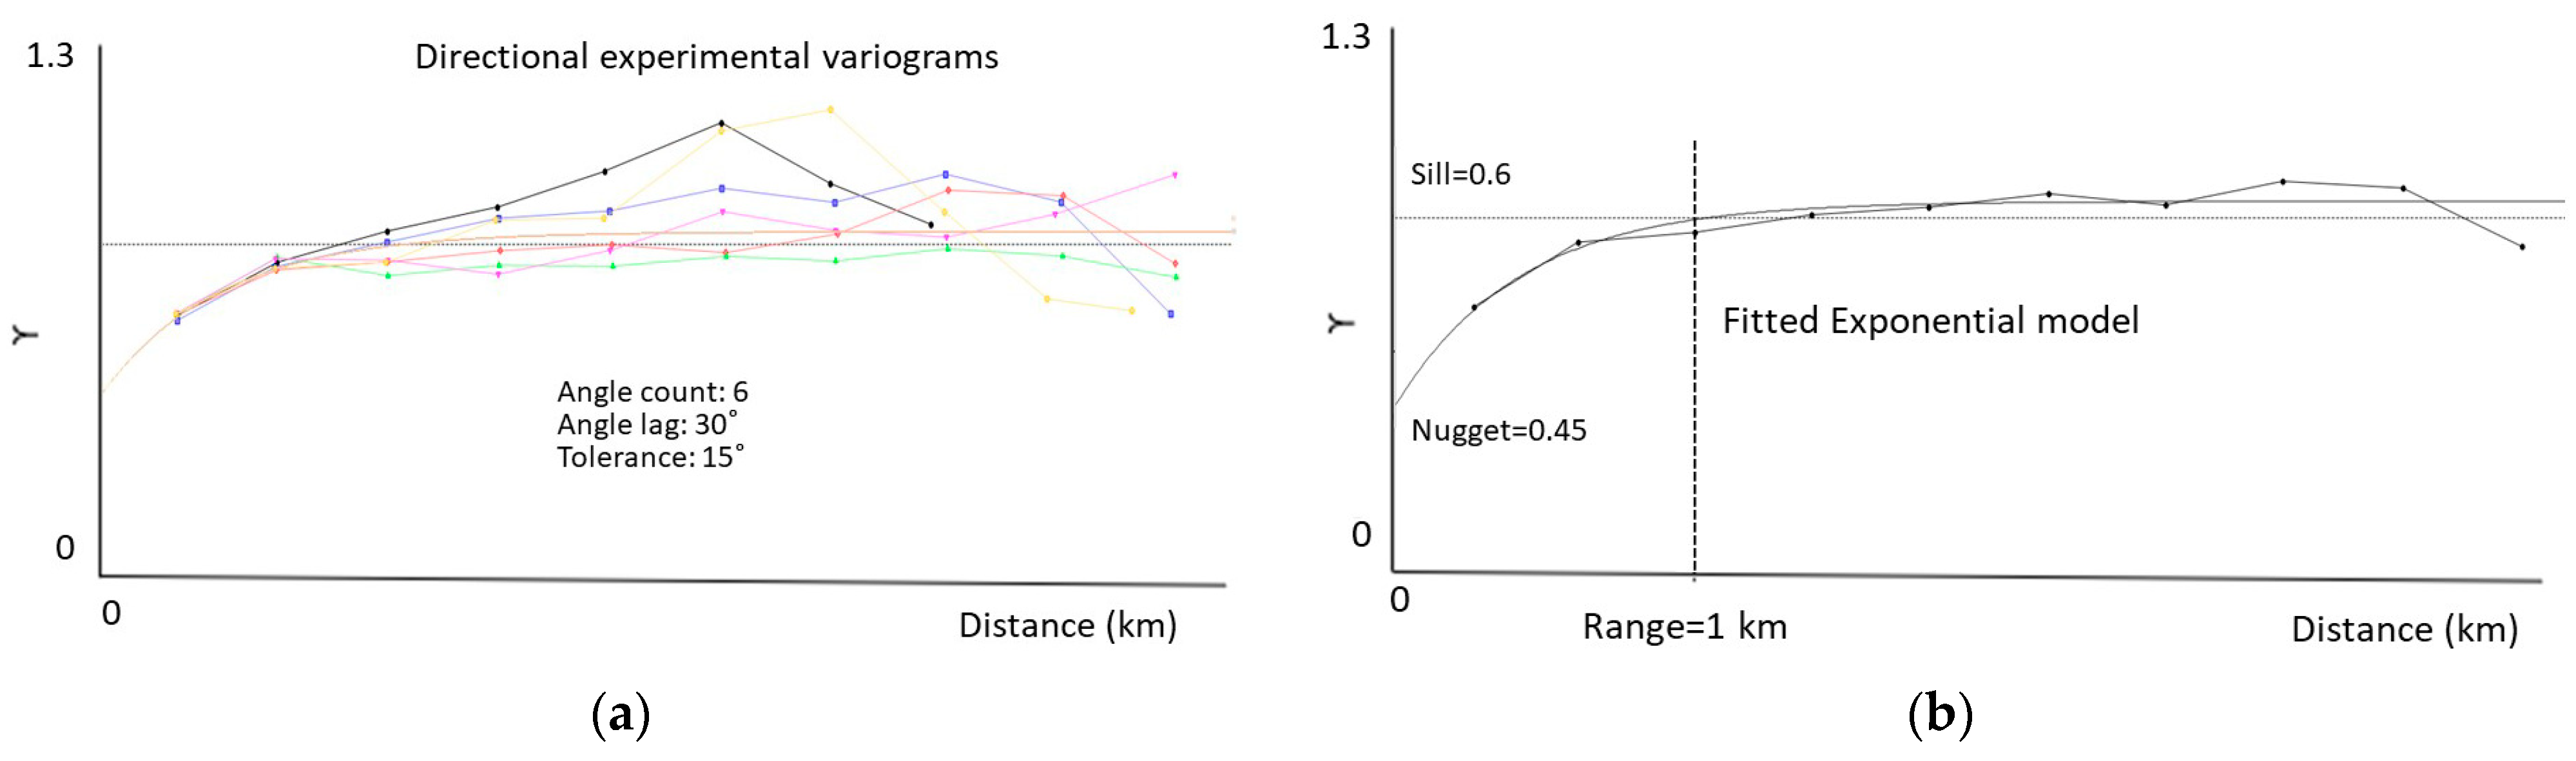
2.4.2. Species’ Productivity Modelling—A Sequential Gaussian Simulation Approach
2.4.3. Species’ Ecological Envelope—Potential Distribution
2.4.4. Species’ Afforestation and Management
3. Results
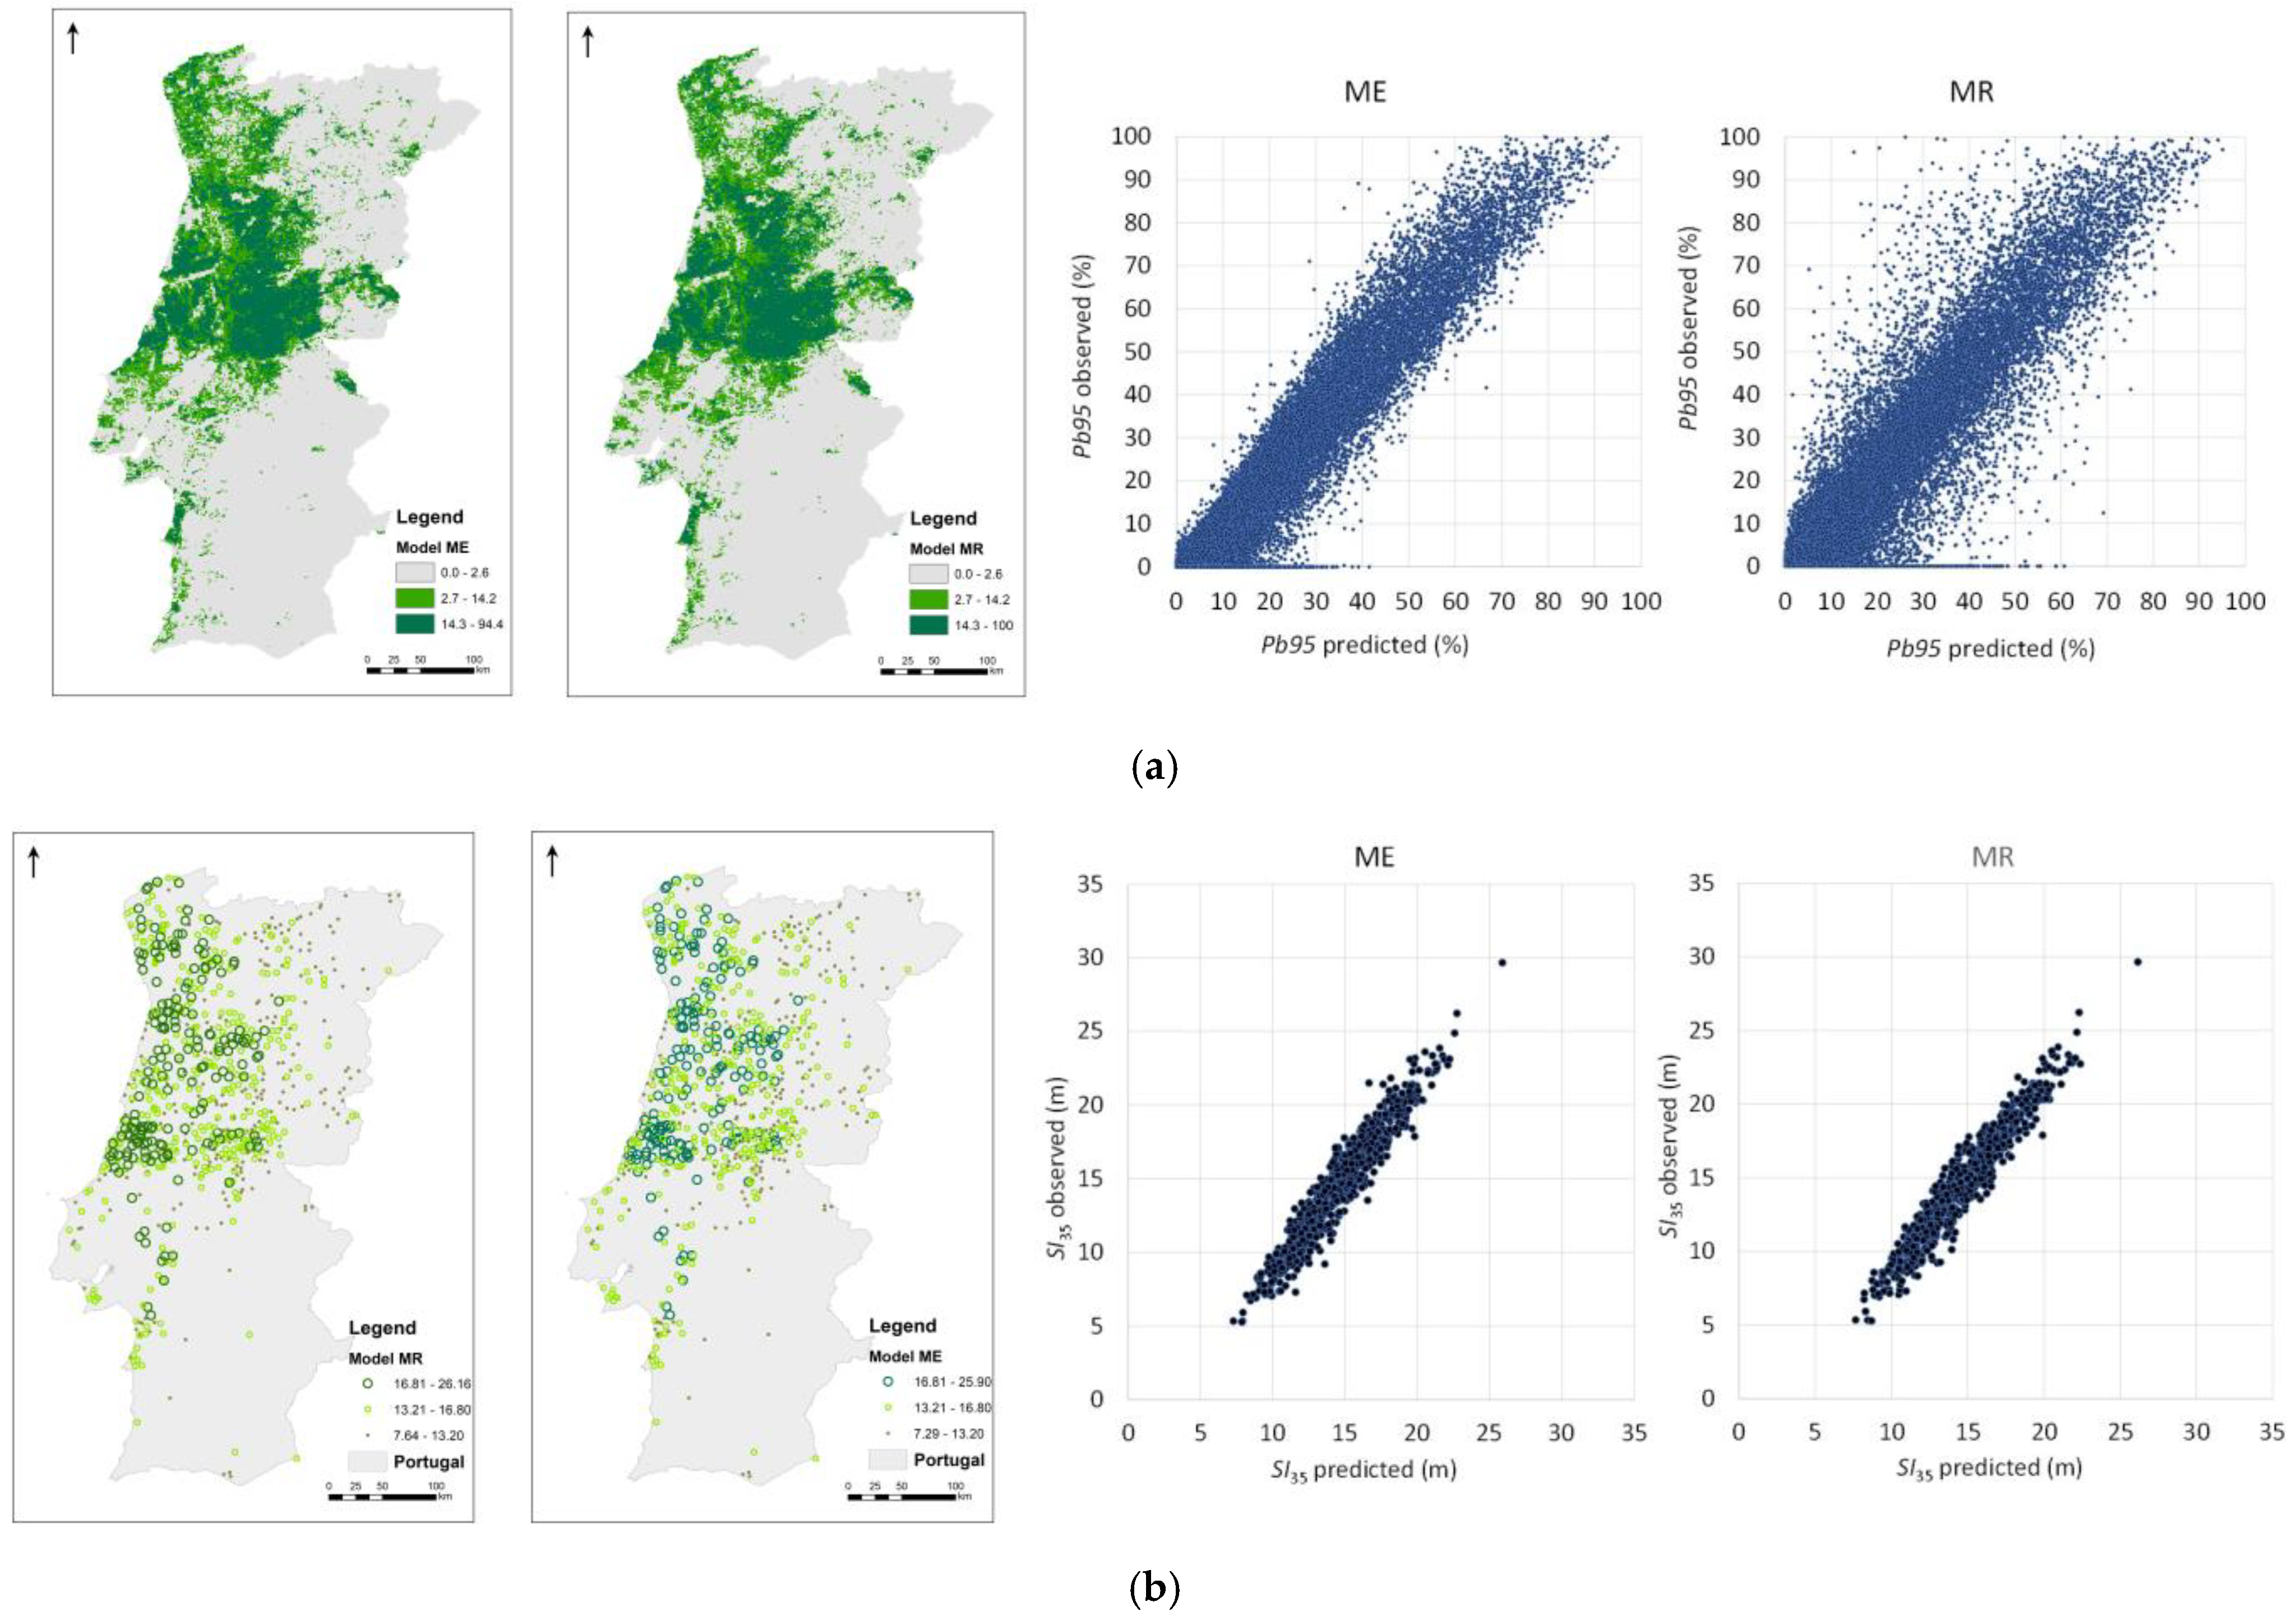
3.1. Species’ Distribution and Productivity Modelling—A Machine Learning Regression Approach
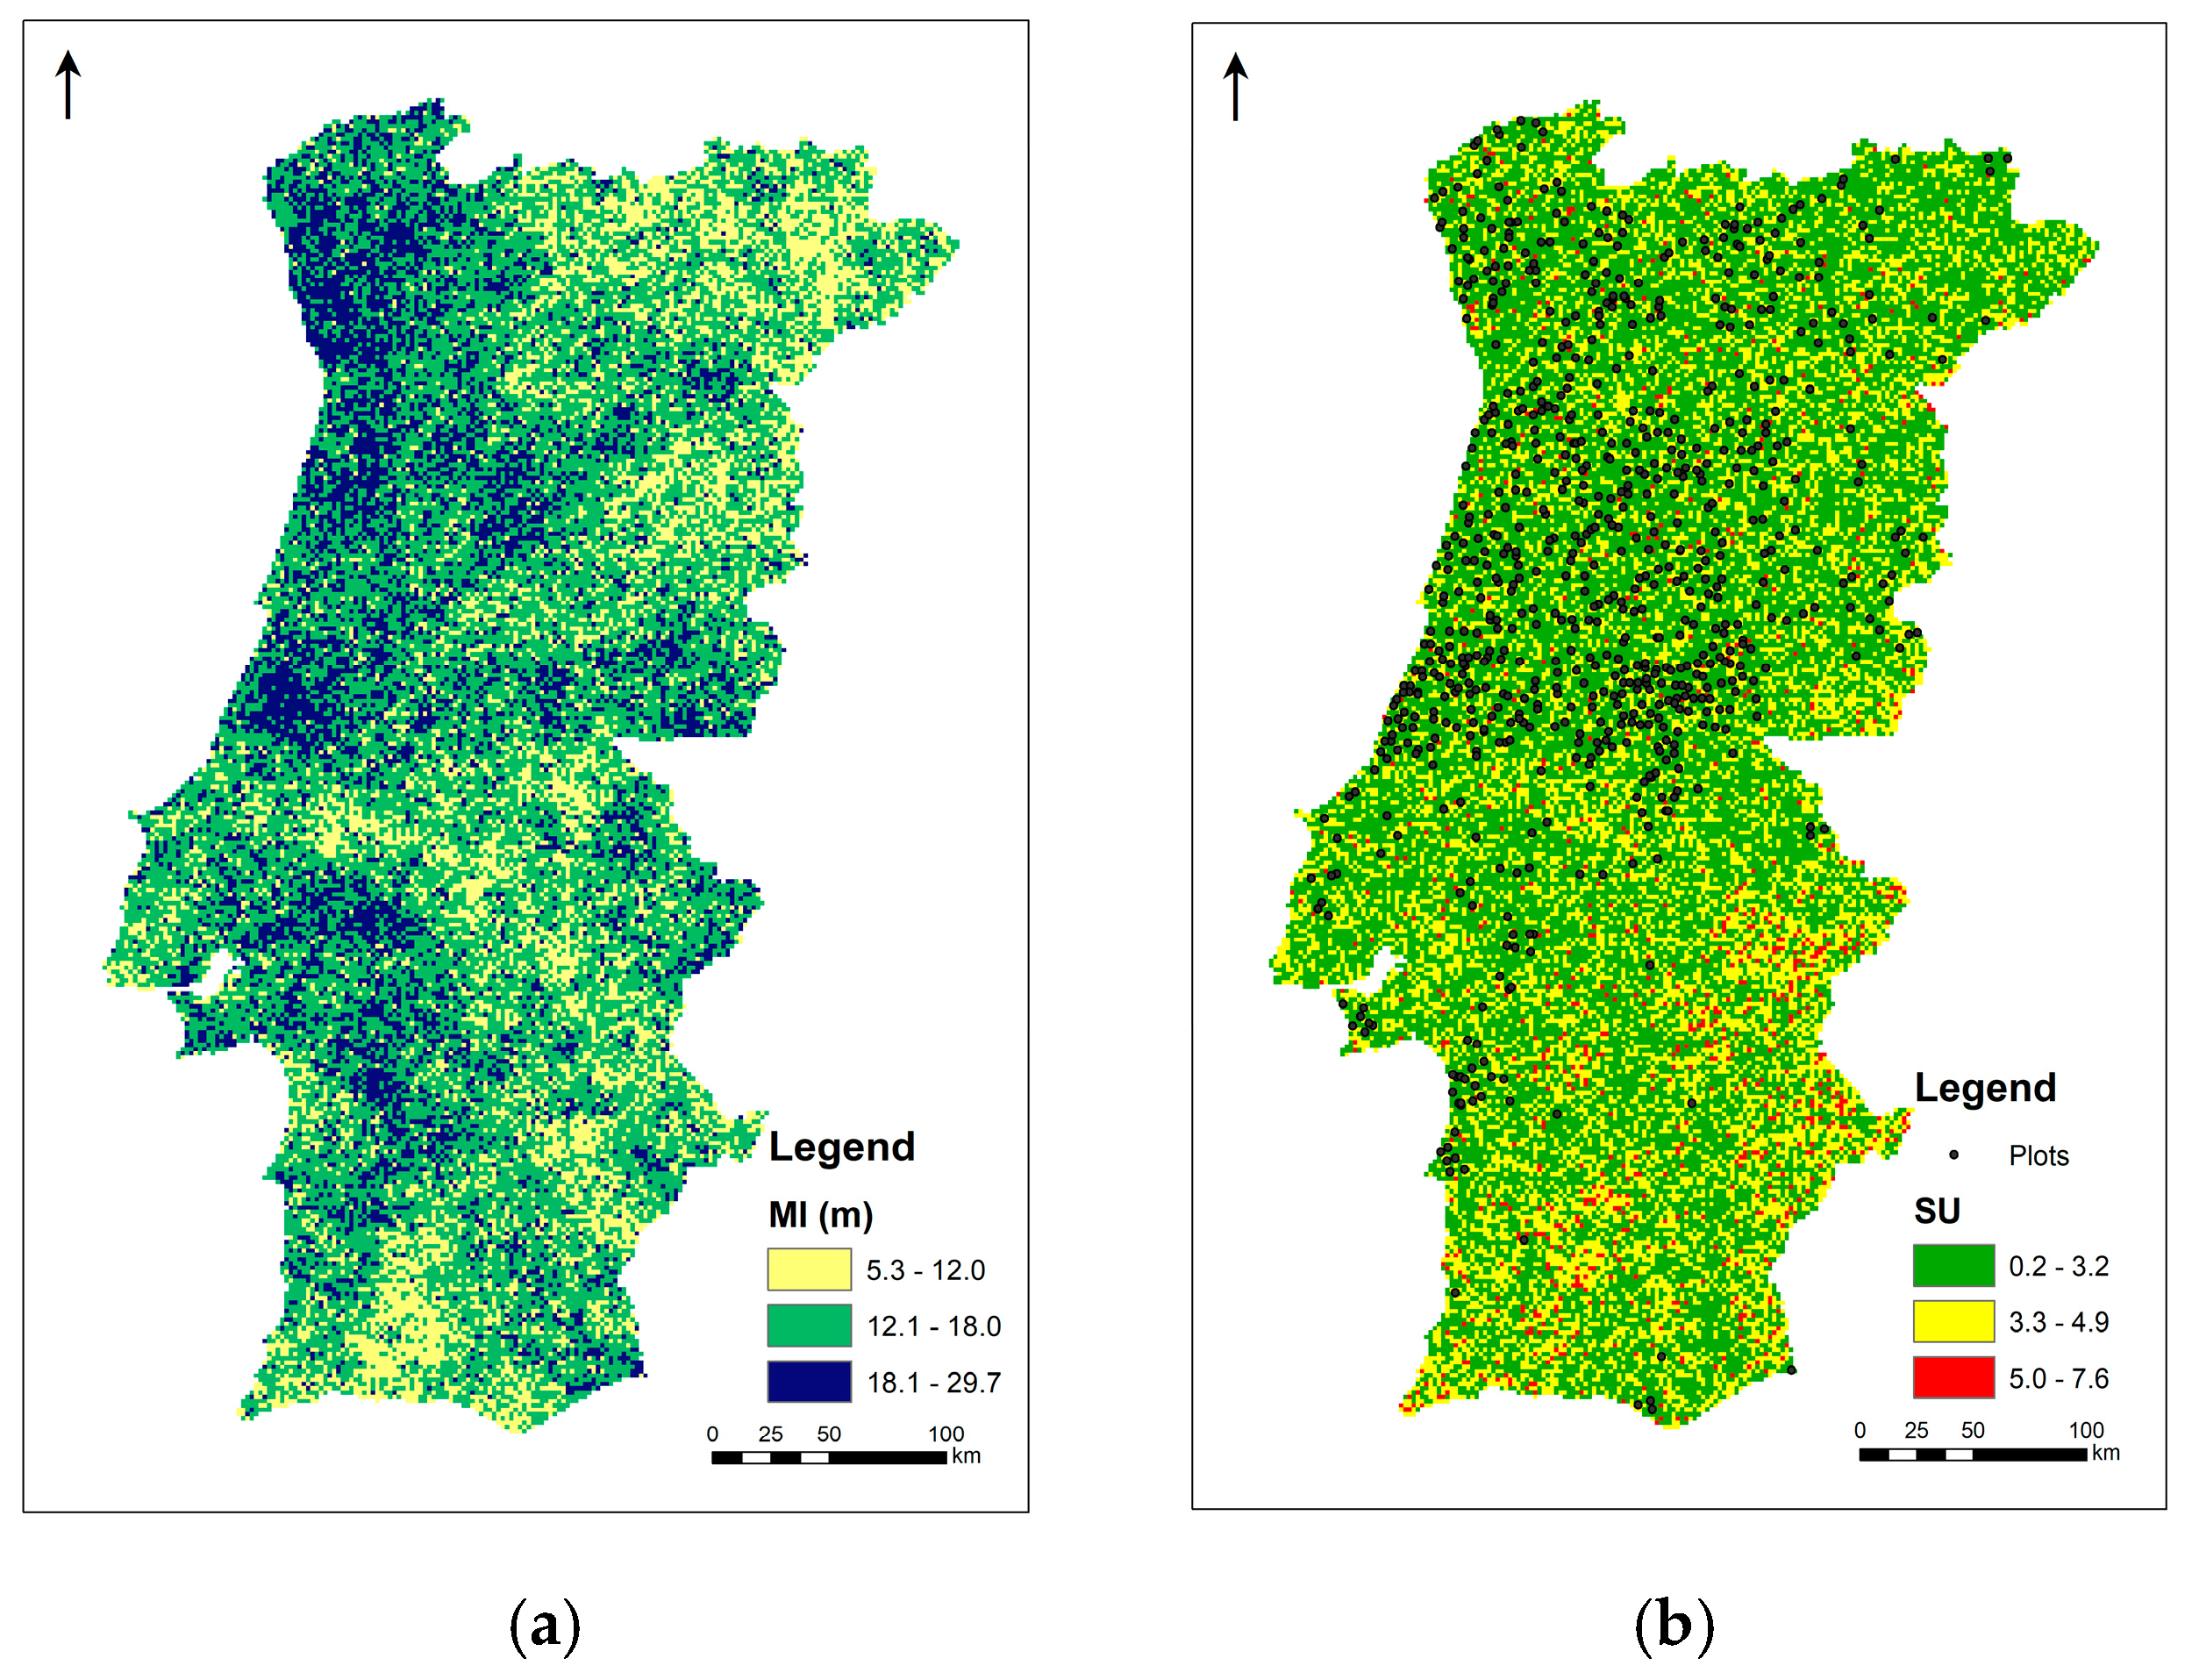
3.2. Species’ Productivity Modelling—A Sequential Gaussian Simulation Approach
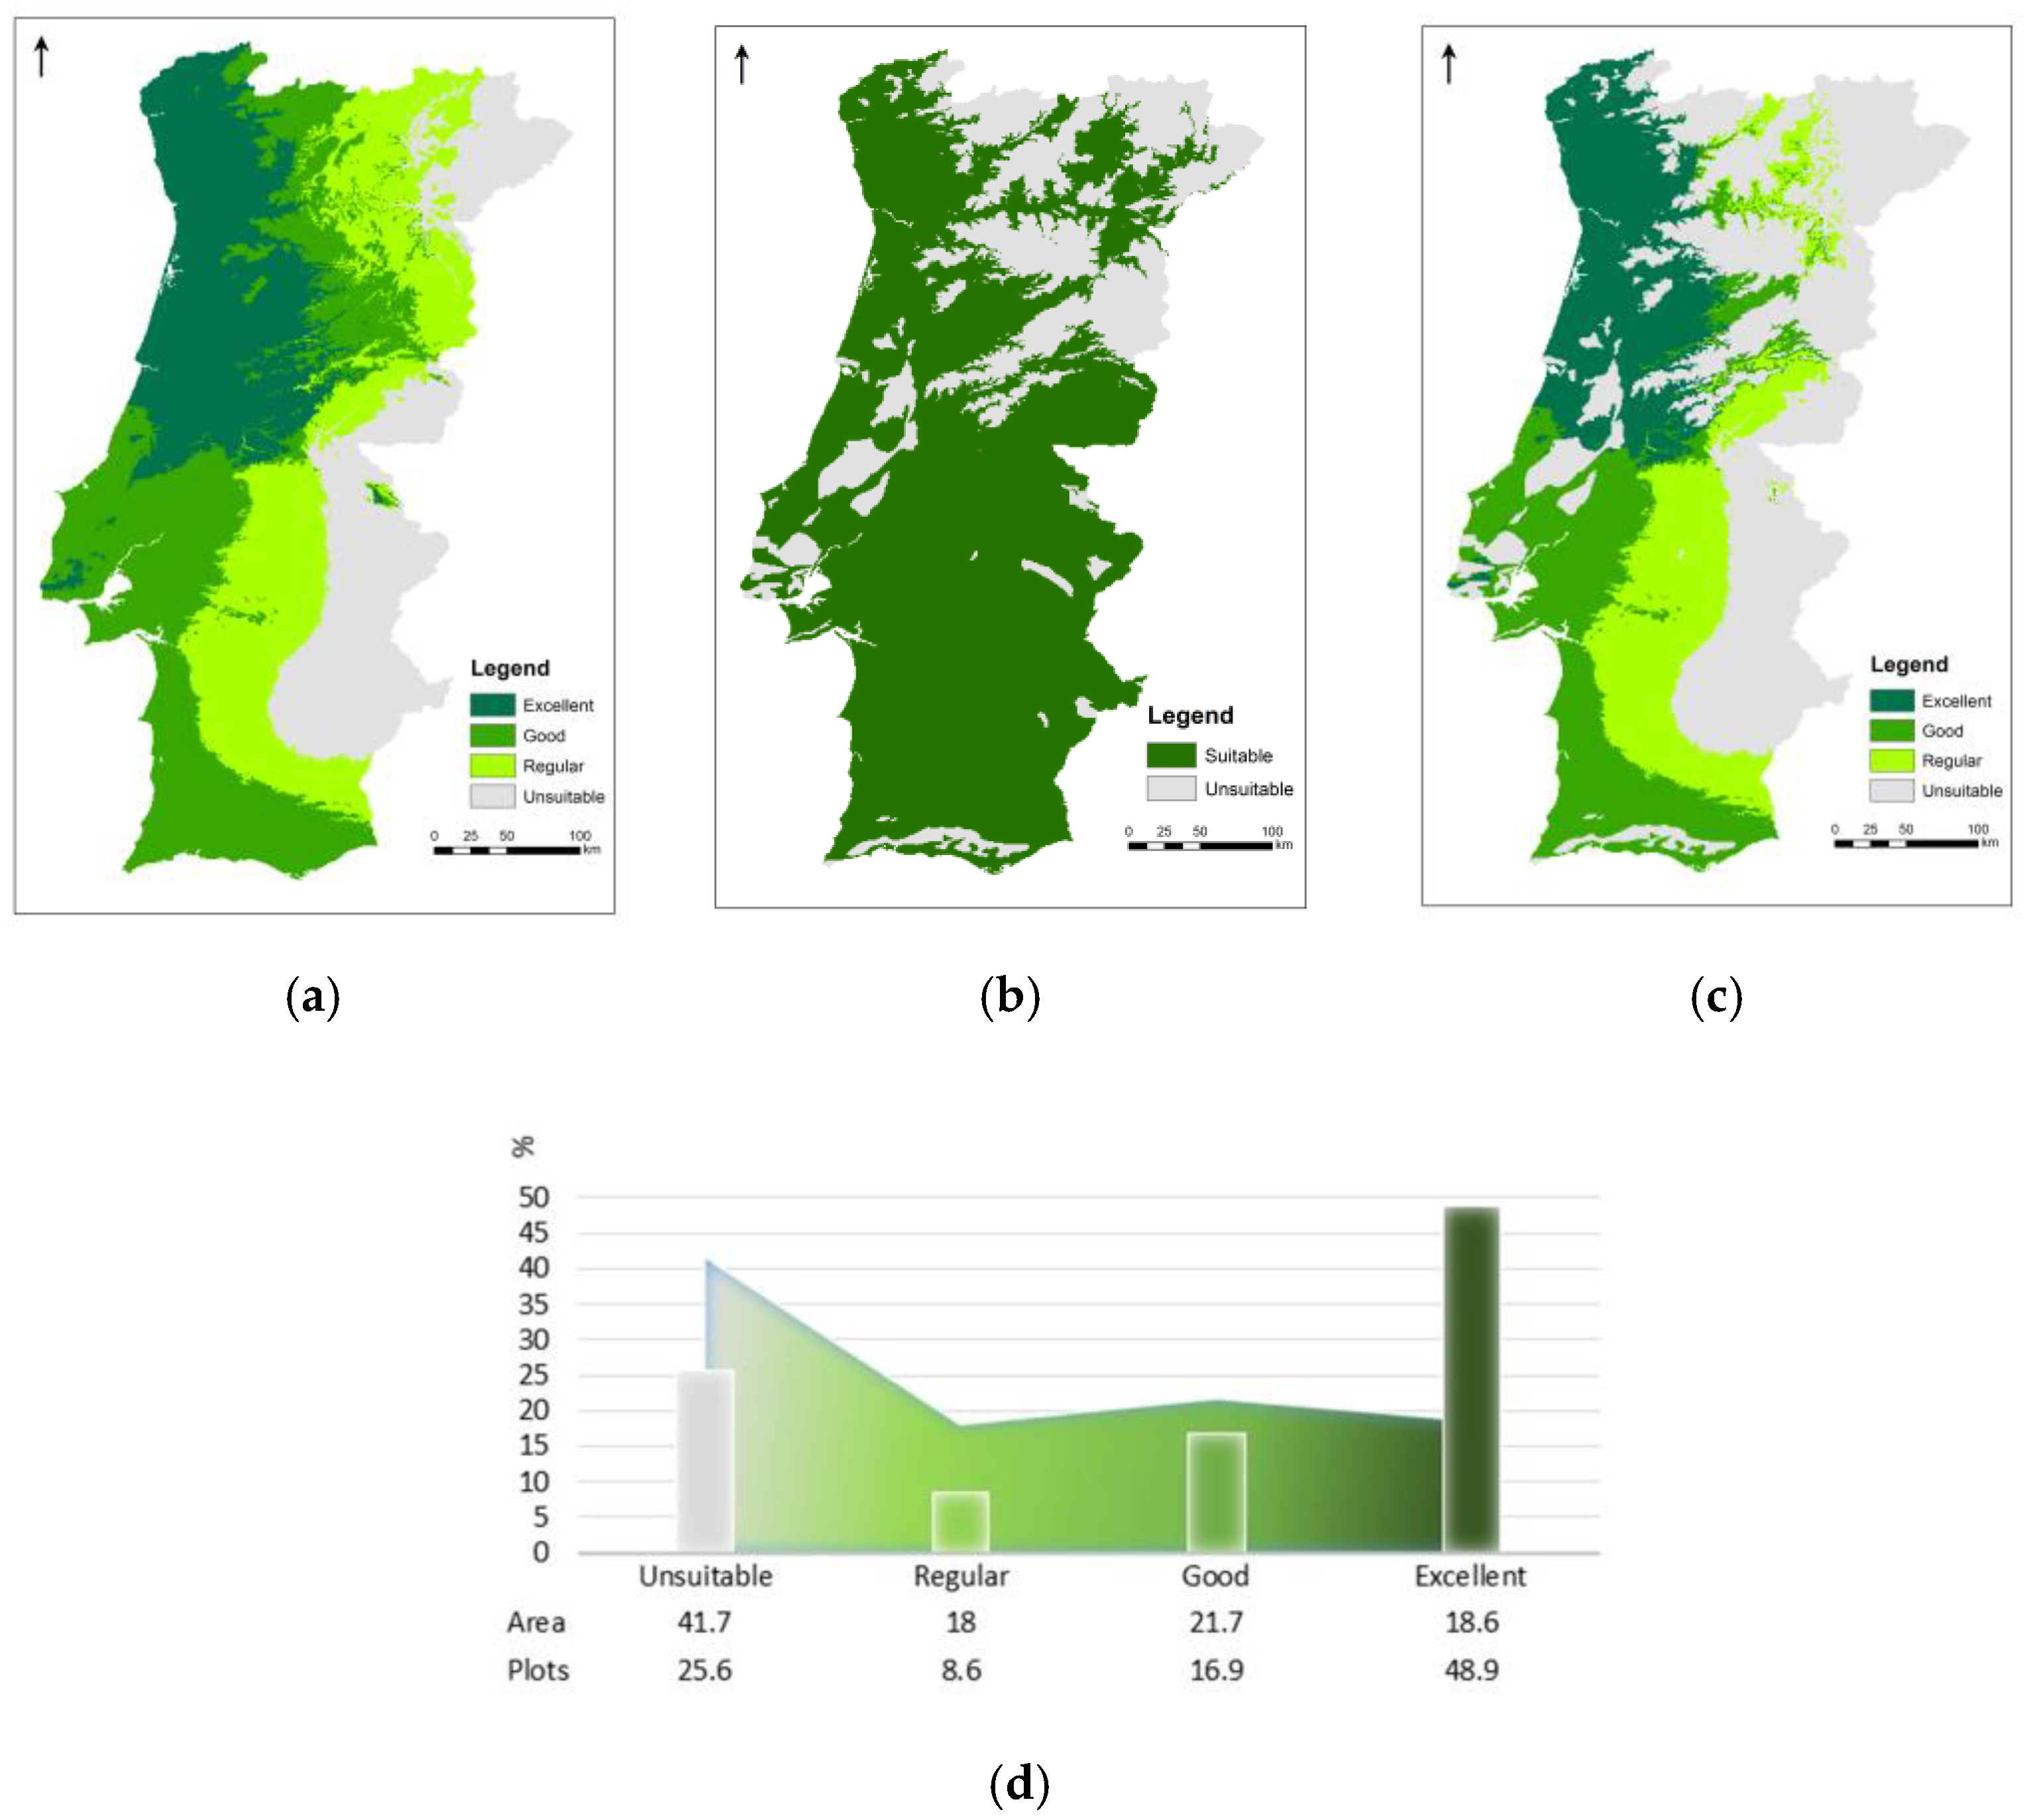
3.3. Species’ Ecological Envelope—Potential Distribution
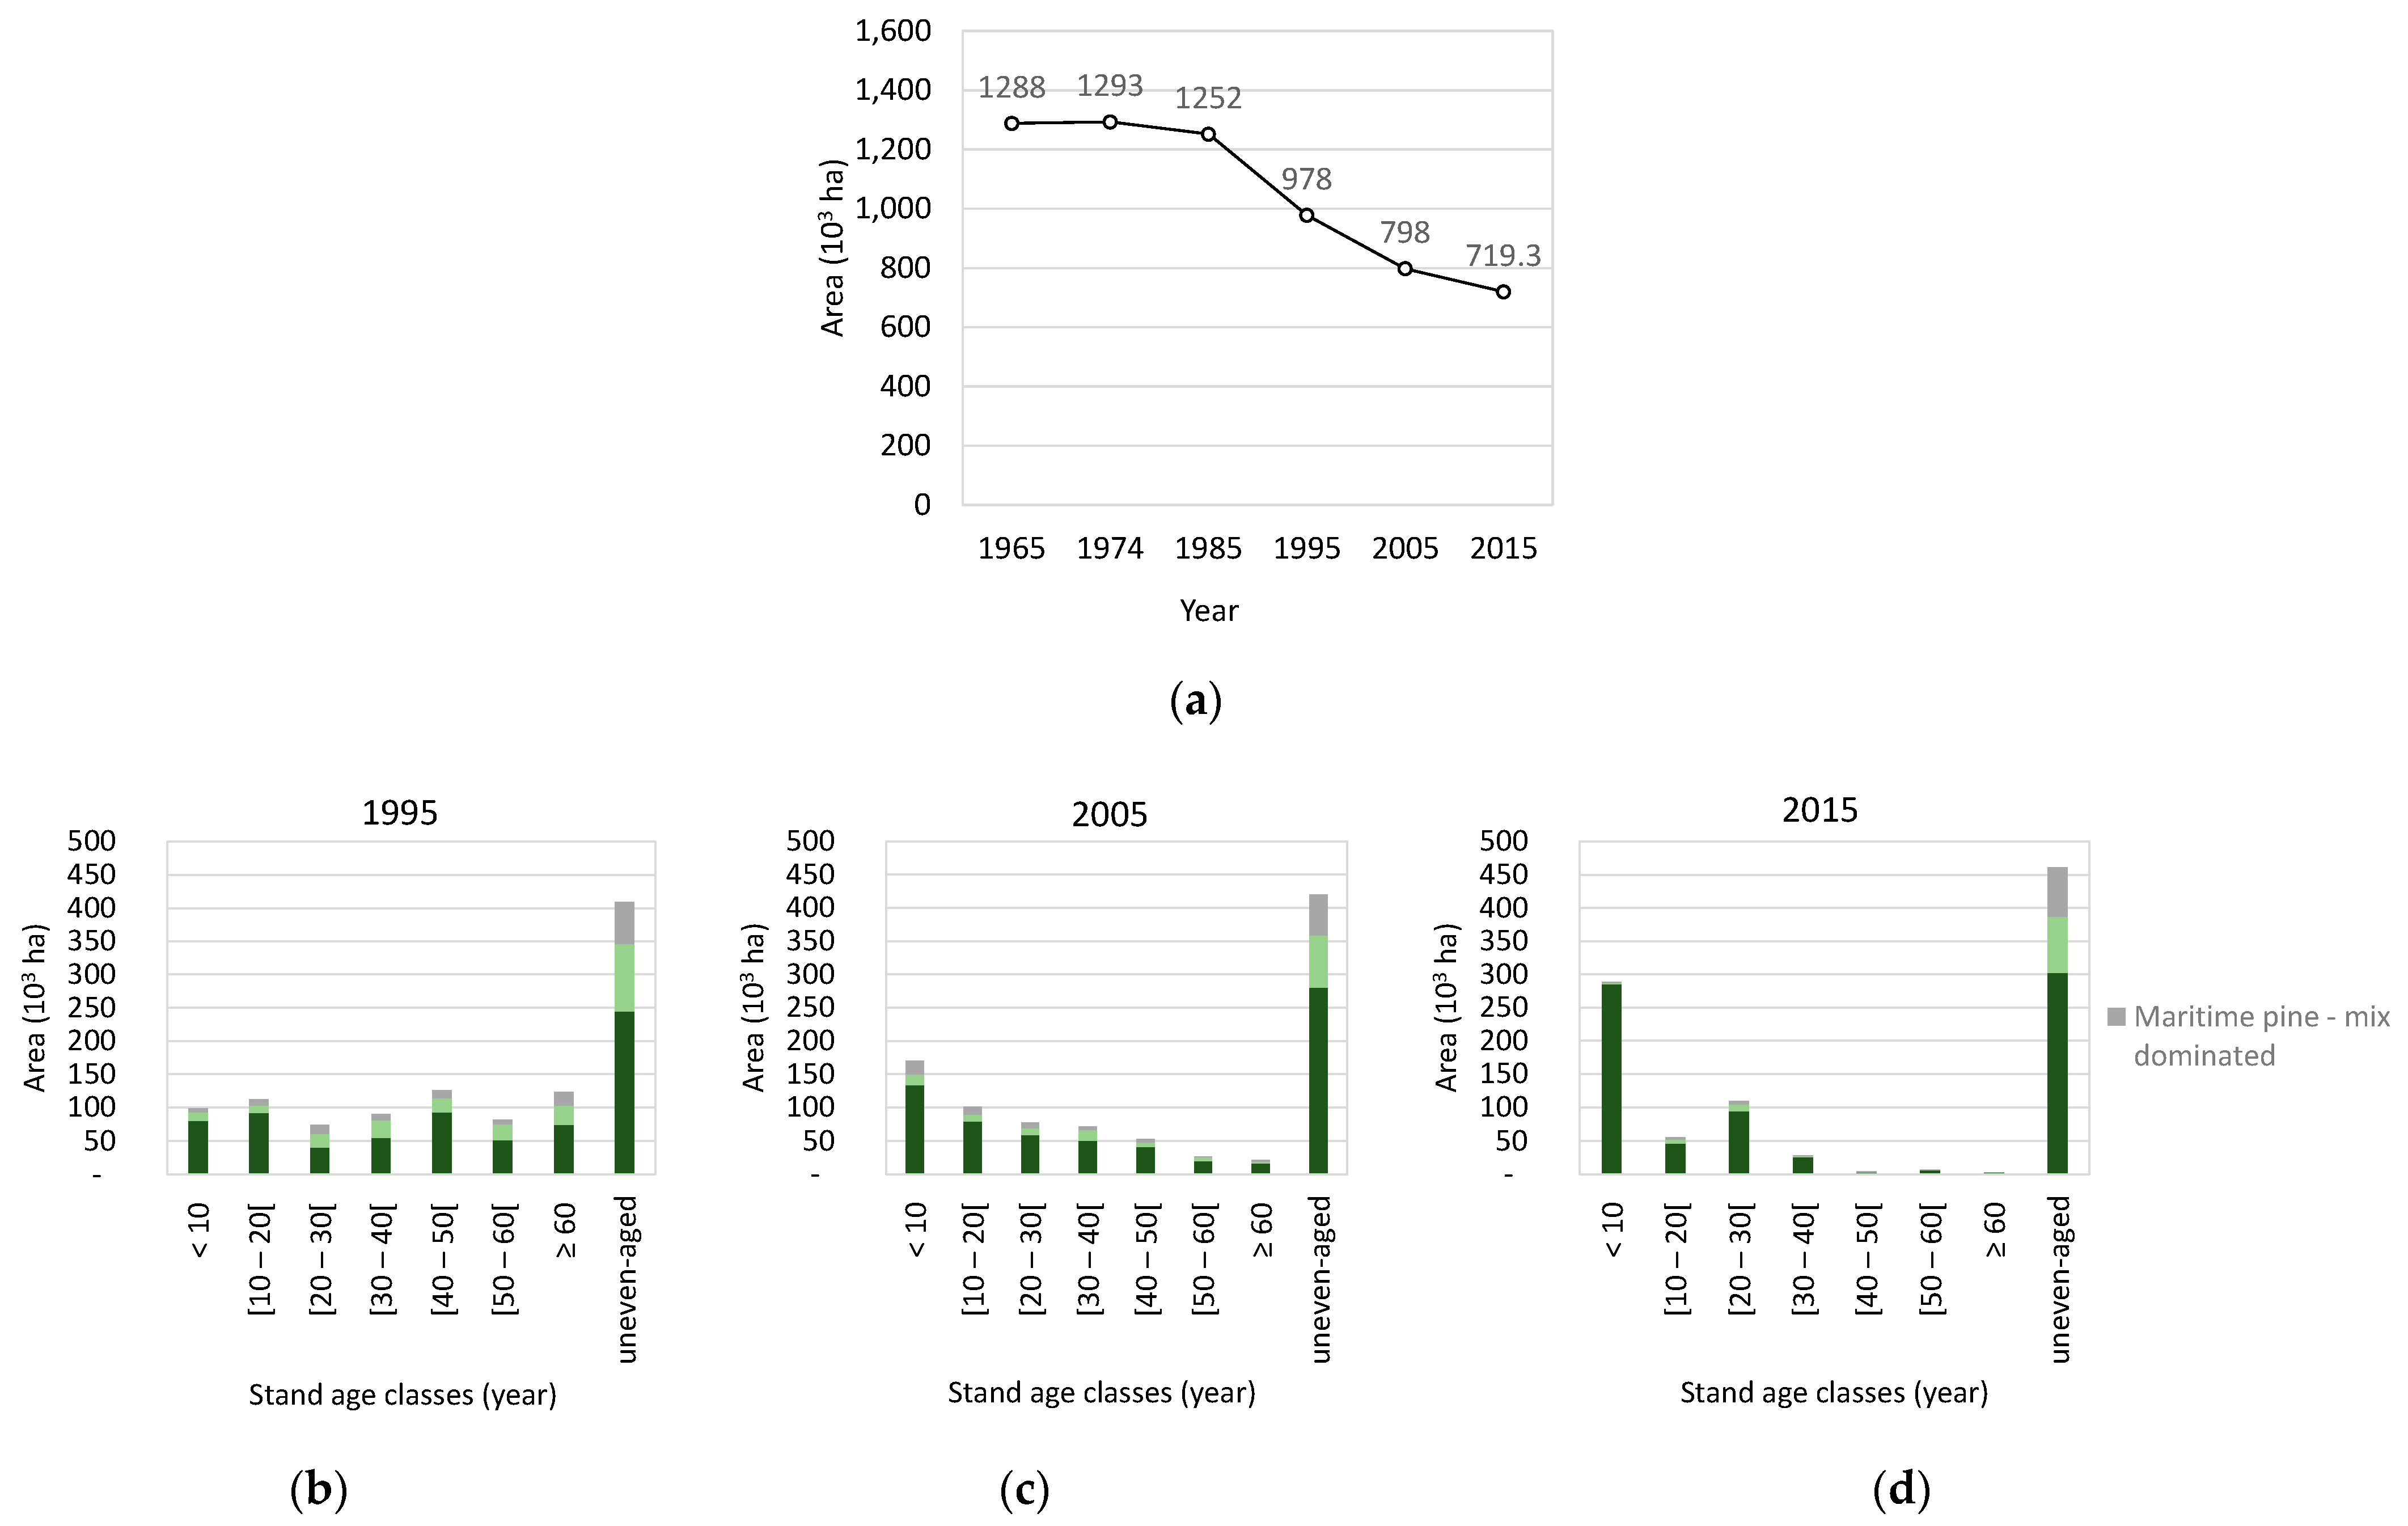
3.4. Species’ Afforestation and Management
4. Discussion
5. Conclusions
Author Contributions
Funding
Institutional Review Board Statement
Informed Consent Statement
Data Availability Statement
Conflicts of Interest
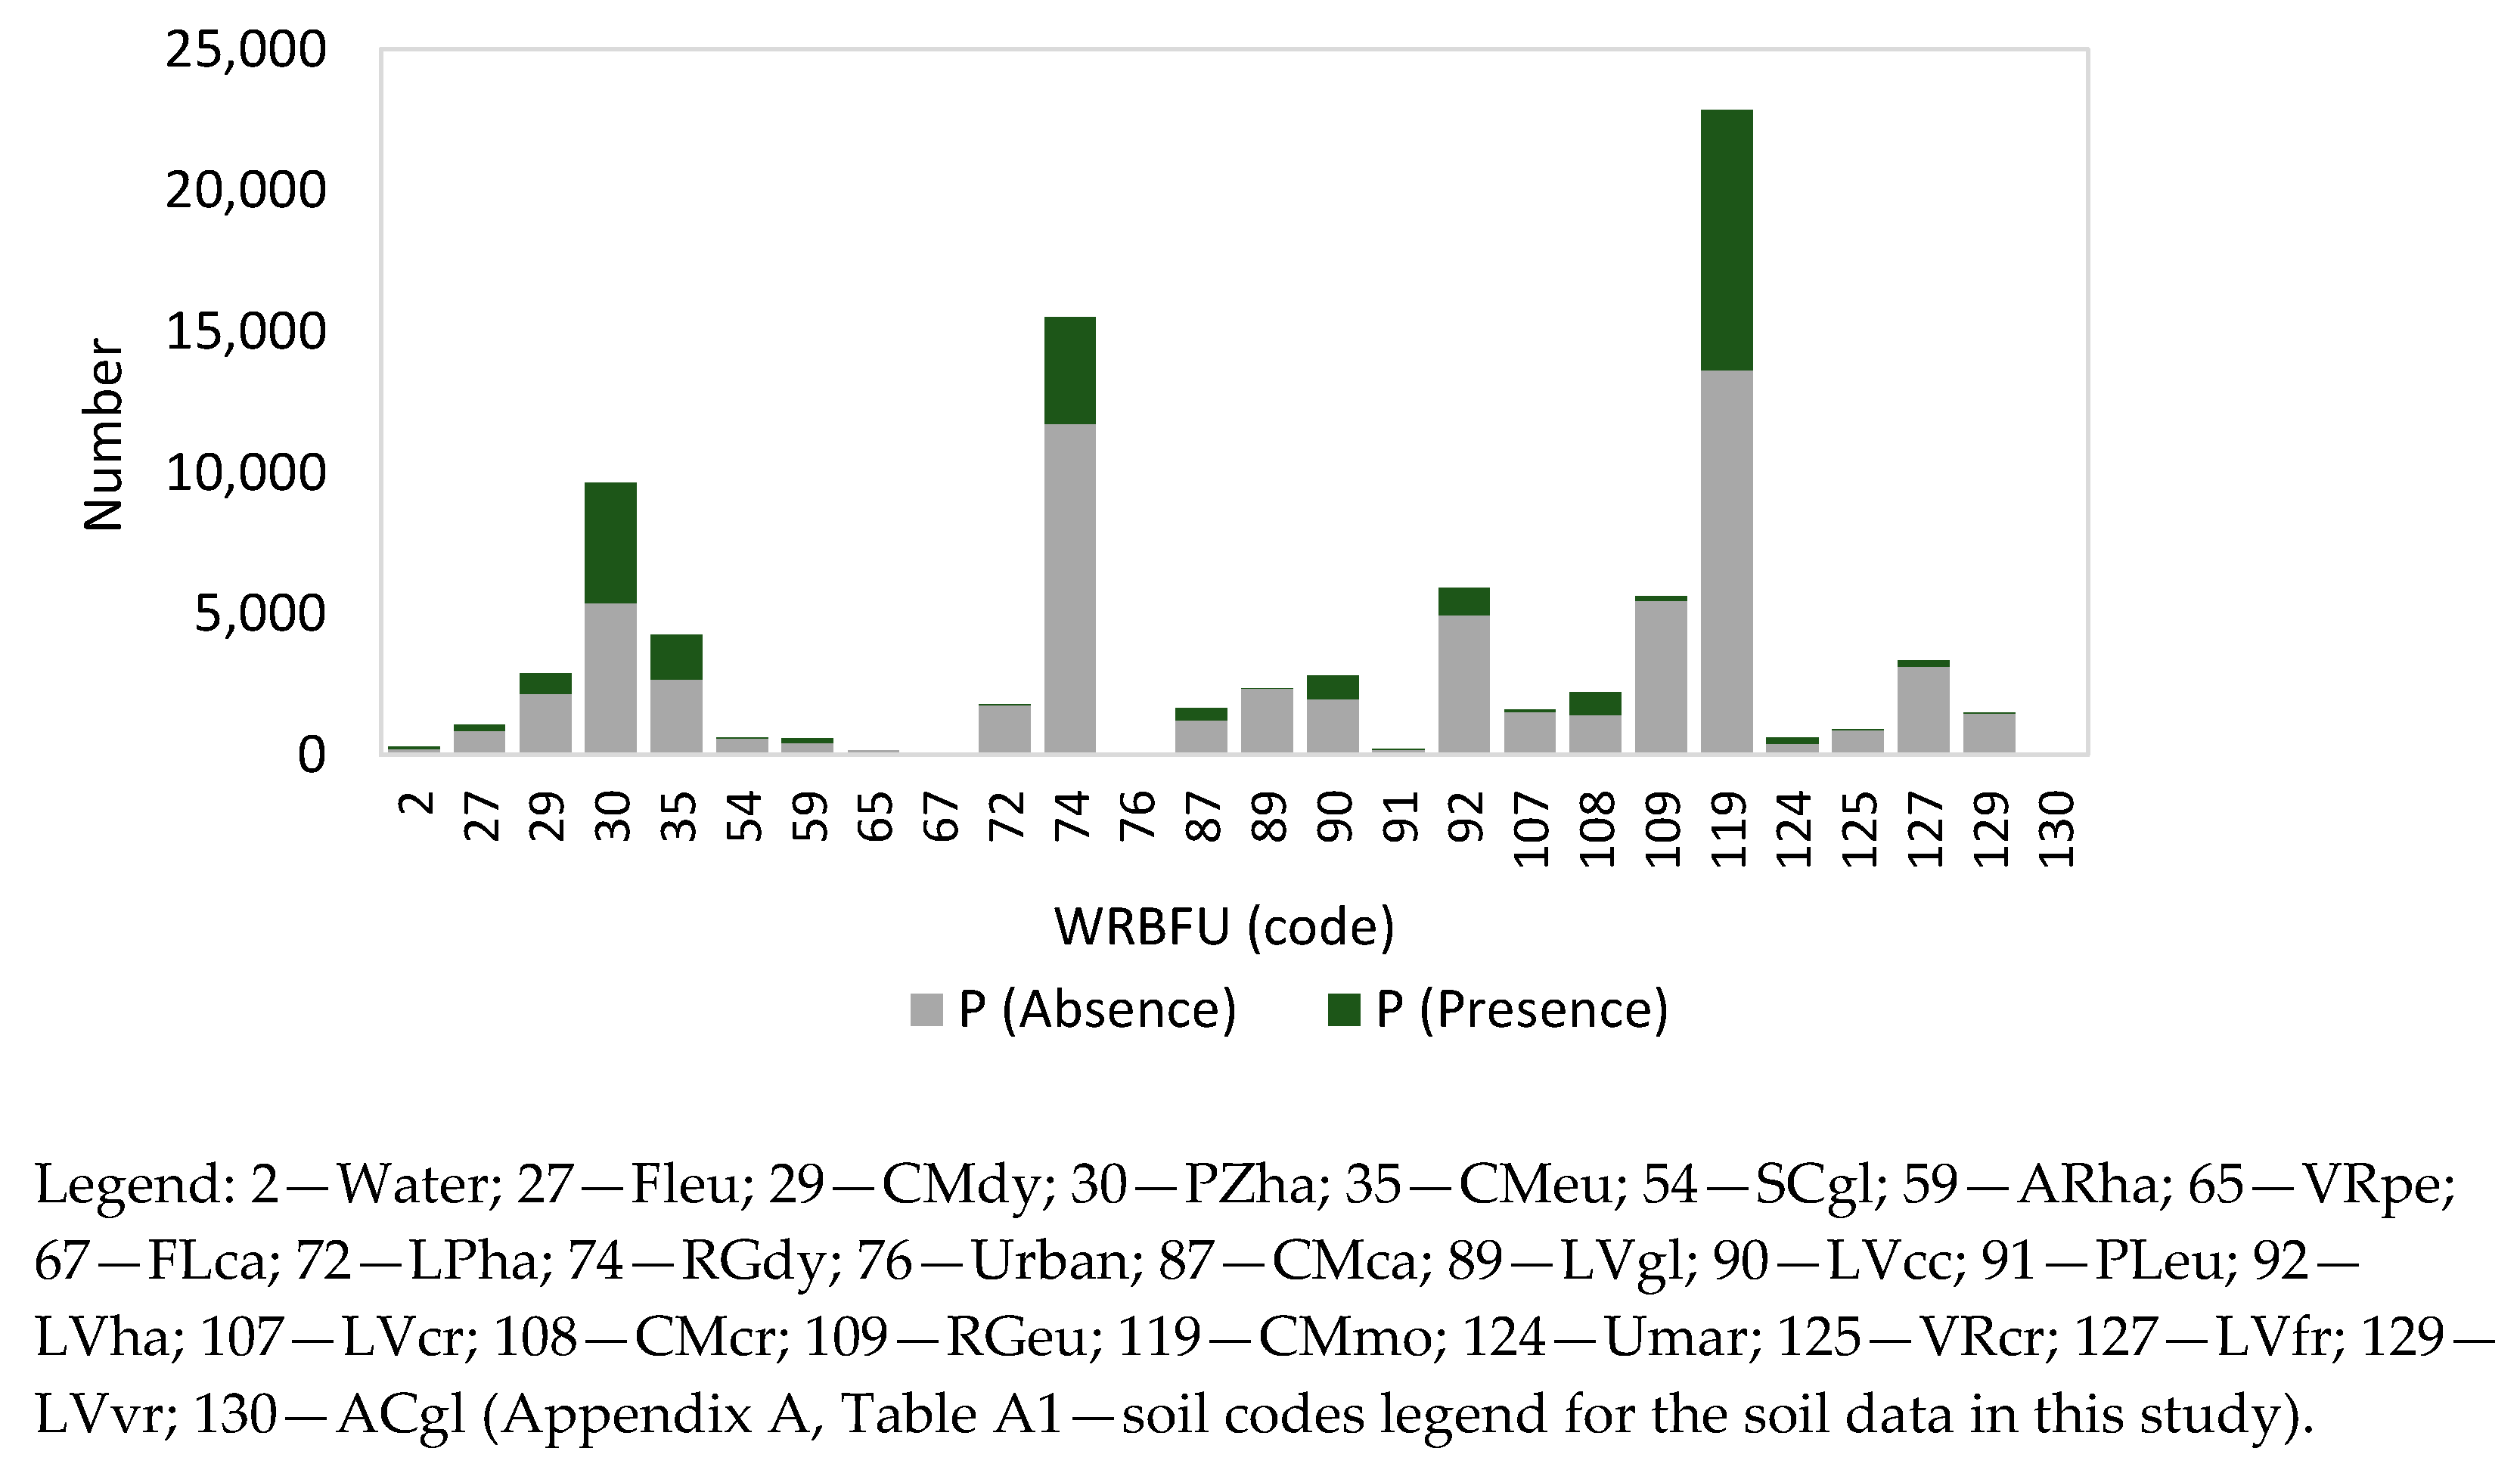
Appendix A

| Code | WRFBU | Group | Qualifier |
|---|---|---|---|
| 2 | Water | - | - |
| 27 | FLeu | Fluvisol | Eutric |
| 29 | CMdy | Cambisol | Dystric |
| 30 | PZha | Podzol | Haplic |
| 35 | CMeu | Cambisol | Eutric |
| 54 | SCgl | Solonchak | Gleyic |
| 59 | ARha | Arenosol | Haplic |
| 65 | VRpe | Vertisol | Pellic |
| 67 | FLca | Fluvisol | Calcaric |
| 72 | LPha | Leptosol | Haplic |
| 74 | RGdy | Regosol | Dystric |
| 76 | Urban | - | - |
| 87 | CMca | Cambisol | Calcaric |
| 89 | LVgl | Luvisol | Gleyic |
| 90 | LVcc | Luvisol | Calcic |
| 91 | PLeu | Planosol | Eutric |
| 92 | LVha | Luvisol | Haplic |
| 107 | LVcr | Luvisol | Chromic |
| 108 | CMcr | Cambisol | Chromic |
| 109 | RGeu | Regosol | Eutric |
| 119 | CMmo | Cambisol | Mollic |
| 124 | UMar | Umbrisol | Arenic |
| 125 | VRcr | Vertisol | Chromic |
| 127 | LVfr | Luvisol | Ferric |
| 129 | LVvr | Luvisol | Fluvic |
| 130 | ACgl | Acrisol | Gleyic |
| Type | Variable | RI | Pearson | RI | Pearson | RI | Pearson |
|---|---|---|---|---|---|---|---|
| P (n = 88,455) | Pb95 (n = 88,455) | SI50 (n = 739) | |||||
| Temperature | T max | 31.33 | −0.07778 | 24.03 | 0.0795 | 29.27 | 0.102 |
| T min | 0.00 | −0.00339 | 17.53 | 0.0609 | 53.24 | 0.1685 | |
| BIO1 | 16.62 | −0.04285 | 0.00 | 0.0107 | 44.16 | 0.1433 | |
| BIO2 | 59.66 | −0.14503 | 90.78 | 0.2706 | 42.43 | −0.1385 | |
| BIO3 | 3.19 | 0.01097 | 52.92 | 0.1622 | 98.74 | 0.2947 | |
| BIO4 | 46.38 | −0.11351 | 98.57 | 0.2929 | 100.00 | −0.2982 | |
| BIO5 | 55.73 | −0.13571 | 87.32 | 0.2607 | 56.02 | −0.1762 | |
| T max Aug | 22.69 | 0.05726 | 56.55 | 0.1726 | 57.82 | 0.1812 | |
| BIO6 | 1.88 | 0.00785 | 28.99 | 0.0937 | 64.28 | 0.1991 | |
| T min Jan | 55.53 | −0.13523 | 87.53 | 0.2613 | 5.98 | −0.0374 | |
| BIO7 | 50.27 | −0.12274 | 100.00 | 0.297 | 86.37 | −0.2604 | |
| BIO8 | 12.37 | −0.03275 | 15.40 | 0.0548 | 74.41 | 0.2272 | |
| BIO9 | 43.92 | −0.10768 | 61.47 | 0.1867 | 30.43 | −0.1052 | |
| BIO10 | 46.69 | −0.11424 | 61.44 | 0.1866 | 25.70 | −0.0921 | |
| BIO11 | 0.01 | −0.00341 | 24.14 | 0.0798 | 72.17 | 0.221 | |
| Precipitation | BIO12 | 96.23 | 0.23188 | 96.33 | 0.2865 | 24.33 | 0.0883 |
| BIO13 | 100.00 | 0.24082 | 96.54 | 0.2871 | 15.03 | 0.0625 | |
| BIO14 | 52.24 | 0.12742 | 54.42 | 0.1665 | 8.98 | 0.0457 | |
| BIO15 | 38.77 | −0.09545 | 33.92 | 0.1078 | 10.38 | −0.0496 | |
| BIO16 | 98.45 | 0.23715 | 99.55 | 0.2957 | 25.23 | 0.0908 | |
| BIO17 | 73.21 | 0.17722 | 70.63 | 0.2129 | 10.67 | 0.0504 | |
| BIO18 | 73.66 | 0.17829 | 81.87 | 0.2451 | 36.55 | 0.1222 | |
| BIO19 | 99.38 | 0.23935 | 98.08 | 0.2915 | 21.38 | 0.0801 | |
| Topography | E | 0.51 | −0.00461 | 41.67 | 0.13 | 89.44 | −0.2689 |
| S | 37.45 | 0.0923 | 26.02 | 0.0852 | 42.00 | −0.1373 | |
| A | 11.22 | 0.03002 | 11.42 | 0.0434 | 0.00 | 0.0208 | |
| Soil | WRBFU | 26.65 | 0.06666 | 29.27 | 0.0945 | 21.02 | 0.0791 |
References
- Barrio-Anta, M.; Castedo-Dorado, F.; Cámara-Obregón, A.; López-Sánchez, C. Predicting current and future suitable habitat and productivity for Atlantic populations of maritime pine (Pinus pinaster Aiton) in Spain. Ann. For. Sci. 2020, 77, 41. [Google Scholar] [CrossRef]
- Bede-Fazekas, A.; Levente Horváth, K.M. Impact of climate change on the potential distribution of Mediterranean pines. Q. J. Hung. Meteorol. Serv. 2014, 118, 41–52. [Google Scholar]
- Deus, E.; Silva, J.S.; Castro-Díez, P.; Lomba, A.; Ortiz, M.L.; Vicente, J. Current and future conflicts between eucalypt plantations and high biodiversity areas in the Iberian Peninsula. J. Nat. Conserv. 2018, 45, 107–117. [Google Scholar] [CrossRef]
- Ribeiro, M.M.; Roque, N.; Ribeiro, S.; Gavinhos, C.; Castanheira, I.; Quinta-Nova, L.; Albuquerque, T.; Gerassis, S. Bioclimatic modeling in the Last Glacial Maximum, Mid-Holocene and facing future climatic changes in the strawberry tree (Arbutus unedo L.). PLoS ONE 2019, 14, e0210062. [Google Scholar] [CrossRef] [Green Version]
- Hock, B.K.; Payn, T.W.; Shirley, J.W. Using a geographical information system and geostatistics to estimate site index of Pinus radiata for Kaingaroa Forest. N. Z. J. For. Sci. 1993, 23, 264–277. [Google Scholar]
- Payn, T.W.; Hill, R.B.; Hock, B.K.; Skinner, M.F.; Thorn, A.J.; Rijkse, W.C. Potential for the use of GIS and spatial analysis techniques as tools for monitoring changes in forest productivity and nutrition, a New Zealand example. For. Ecol. Manag. 1999, 122, 187–196. [Google Scholar] [CrossRef]
- Santos, C.; Almeida, J. Caracterização espacial de um índice de produtividade nos povoamentos de pinheiro bravo em Portugal. Finisterra Rev. Port. De Geogr. 2003, 75, 51–65. (In Portuguese) [Google Scholar] [CrossRef] [Green Version]
- Pelissari, A.L.; Caldeira, S.F.; Filho, F.A.; Amaral, M.S. Propostas de mapeamentos da capacidade produtiva de sítios florestais por meio de análises geoestatísticas. Sci. For. 2015, 43, 601–608. [Google Scholar]
- Mestre, S.; Alegria, C.; Teresa, M.; Albuquerque, D.; Goovaerts, P. Developing an index for forest productivity mapping—A case study for maritime pine production regulation in Portugal. Rev. Árvore 2017, 41, e410306. [Google Scholar] [CrossRef]
- Parresol, B.R.; Scott, D.A.; Zarnoch, S.J.; Edwards, L.A.; Blake, J.I. Modeling forest site productivity using mapped geospatial attributes within a South Carolina Landscape, USA. For. Ecol. Manag. 2017, 406, 196–207. [Google Scholar] [CrossRef]
- Alegria, C.; Roque, N.; Albuquerque, T.; Gerassis, S.; Fernandez, P.; Ribeiro, M.M. Species ecological envelopes under climate change scenarios: A case study for the main two wood-production forest species in Portugal. Forests 2020, 11, 880. [Google Scholar] [CrossRef]
- Fourcade, Y.; Engler, J.O.; Rodder, D.; Secondi, J. Mapping species distributions with MAXENT using a geographically biased sample of presence data: A performance assessment of methods for correcting sampling bias. PLoS ONE 2019, 9, e97122. [Google Scholar] [CrossRef] [Green Version]
- ICNF. Planos Regionais de Ordenamento Florestal; Instituto da Conservação da Natureza e das Florestas, Lisboa. 2019. Available online: http://www2.icnf.pt/portal/florestas/profs/prof-em-vigor (accessed on 20 February 2020). (In Portuguese).
- DGRF. Plano Regional de Ordenamento Florestal do Pinhal Interior Sul; Documento estratégico; Direção Geral dos Recursos Florestais: Lisbon, Portugal, 2005. (In Portuguese) [Google Scholar]
- ICNF. FN6—Áreas dos Usos do Solo e das Espécies Florestais de Portugal Continental. Resultados Preliminares; Instituto da Conservação da Natureza e das Florestas, Lisboa. 2013. Available online: http://www2.icnf.pt/portal/florestas/ifn/resource/doc/ifn/ifn6-res-prelimv1-1 (accessed on 20 February 2020). (In Portuguese).
- ICNF. 6° Inventário Florestal Nacional—IFN6. 2015. Relatório Final; Instituto da Conservação da Natureza e das Florestas, Lisboa. 2019. Available online: http://www2.icnf.pt/portal/florestas/ifn/resource/doc/ifn/ifn6/IFN6_Relatorio_completo-2019-11-28.pdf (accessed on 20 February 2020). (In Portuguese).
- Oliveira, A. Boas Práticas Florestais para o Pinheiro Bravo. Manual; Centro Pinus, Porto. 1999. Available online: https://centropinus.org/files/2018/04/manual01.pdf (accessed on 12 November 2020). (In Portuguese).
- DR. Estratégia Nacional para as Florestas, Resolução de Conselho de Ministros n° 6-B/2015, Diário da República, I Série—n° 24 de 4 de fevereiro. 2015. Available online: https://dre.pt/application/file/66432612 (accessed on 9 March 2018). (In Portuguese).
- ICNF. Estatísticas. Incêndios Florestais—Totais Anuais (Nacionais, Por Distrito e por Freguesia). Área Ardida Por Tipo de Ocupação de Solos. Lisboa, Instituto da Conservação da Natureza e Florestas. 2017. Available online: http://www.icnf.pt/portal/florestas/dfci/inc/estat-sgif (accessed on 9 March 2018). (In Portuguese).
- Soares, P.; Calado, N.; Carneiro, S. Manual de Boas Práticas Para o Pinheiro-Bravo. Centro Pinus, Porto. 2020. Available online: https://centropinus.org/files/2020/05/Silvicultura_Centro-Pinus_digital.pdf (accessed on 12 November 2020).
- Calvo, L.; Hernández, V.; Valbuena, L.; Taboada, A. Provenance and seed mass determine seed tolerance to high temperatures associated to forest fires in Pinus pinaster. Ann. For. Sci. 2016, 73, 381–391. [Google Scholar] [CrossRef] [Green Version]
- Alegria, C.; Teixeira, M.C. An overview of maritime pine private non-industrial forest in the centre of Portugal: A 19-year case study. Folia For. Pol. 2016, 58, 198–213. [Google Scholar] [CrossRef] [Green Version]
- Nurek, T.; Gendek, A.; Roman, K.; Dąbrowska, M. The Impact of Fractional Composition on the Mechanical Properties of Agglomerated Logging Residues. Sustainability 2020, 12, 6120. [Google Scholar] [CrossRef]
- Nurek, T.; Gendek, A.; Roman, K. Forest Residues as a Renewable Source of Energy: Elemental Composition and Physical Properties. BioResources 2018, 14, 6–20. Available online: https://ojs.cnr.ncsu.edu/index.php/BioRes/article/view/BioRes_14_1_6_Nurek_Forest_Residues_Renewable_Energy/6480 (accessed on 23 February 2021). [CrossRef]
- Nurek, T.; Gendek, A.; Roman, K.; Dąbrowska, M. The effect of temperature and moisture on the chosen parameters of briquettes made of shredded logging residues. Biomass Bioenergy 2019, 130, 105368. [Google Scholar] [CrossRef]
- Navalho, I.; Alegria, C.; Quinta-Nova, L.; Fernandez, P. Integrated planning for landscape diversity enhancement, fire hazard mitigation and forest production regulation: A case study in central Portugal. Land Use Policy 2017, 61, 398–412. [Google Scholar] [CrossRef]
- Fernandes, P.M. Combining forest structure data and fuel modelling to classify fire hazard in Portugal. Ann. For. Sci. 2009, 66, 415. [Google Scholar] [CrossRef] [Green Version]
- Fernandes, P.M.; Luz, A.; Loureiro, C. Changes in wildfire severity from maritime pine woodland to contiguous forest types in the mountains of northwestern Portugal. For. Ecol. Manag. 2010, 260, 883–892. [Google Scholar] [CrossRef]
- Fernandes, P.M.; Loureiro, C.; Guiomar, N.; Pezzatti, G.B.; Manso, F.T.; Lopes, L. The dynamics and drivers of fuel and fire in the Portuguese public forest. J. Environ. Manag. 2014, 146, 373–382. [Google Scholar] [CrossRef]
- Davis, L.; Johnson, K. Forest Management, 3rd ed.; McGraw-Hill Education: New York, NY, USA, 1987. [Google Scholar]
- DGT. Catálogo de Serviços de Dados Geográficos; Direção Geral do Território, Lisboa. 2020. Available online: https://snig.dgterritorio.gov.pt/rndg/srv/por/catalog.search#/search?anysnig=COS&fast=index (accessed on 20 February 2020).
- IPMA. Clima de Portugal Continental. Instituto Português do Mar e da Atmosfera. 2021. Available online: https://www.ipma.pt/pt/educativa/tempo.clima/ (accessed on 1 March 2021).
- DGT. Especificações Técnicas da Carta de Uso e Ocupação do Solo de Portugal Continental para 1995, 2007, 2010 e 2015. Relatório Técnico; Direção-Geral do Território, Lisboa. 2018. Available online: http://www.dgterritorio.pt/cartografia_e_geodesia/cartografia/cartografia_tematica/cartografia_de_uso_e_ocupacao_do_solo__cos_clc_e_copernicus_/ (accessed on 27 July 2019).
- ICNF. Inventário Florestal Nacional. IFN4. Dados de Base de 1995-98. ICNF: Lisboa, Portugal. 2020. Available online: http://www2.icnf.pt/portal/florestas/ifn/ifn4/dad-base95-98 (accessed on 11 August 2020). (In Portuguese).
- Hijmans, R.J.; Cameron, S.E.; Parra, J.L.; Jones, P.G.; Jarvis, A. Very high-resolution interpolated climate surfaces for global land areas. Int. J. Climatol. 2005, 25, 1965–1978. [Google Scholar] [CrossRef]
- NASA JPL. NASA Shuttle Radar Topography Mission Global 1 arc second [Data Set]. NASA EOSDIS Land Processes DAAC. 2013. Available online: http://doi.org/10.5067/MEaSUREs/SRTM/SRTMGL1.003 (accessed on 9 March 2018).
- Panagos, P. The European soil database. GEO Connex. 2006, 5, 32–33. [Google Scholar]
- Van Liedekerke, M.; Jones, A.; Panagos, P. ESDBv2 Raster Library—A Set of Rasters Derived from the European Soil Database Distribution v2.0 (CD-ROM, EUR 19945 EN); European Commission and the European Soil Bureau Network. 2006. Available online: https://esdac.jrc.ec.europa.eu/content/european-soil-database-v2-raster-library-1kmx1km (accessed on 29 July 2018).
- IUSS Working Group WRB. World Reference Base for Soil Resources 2014, Update 2015 International Soil Classification System for Naming Soils and Creating Legends for Soil Maps; World Soil Resources Reports No. 106; FAO: Rome, Italy, 2015. [Google Scholar]
- Vanclay, J. Modeling Forest Growth and Yield. Applications to Mixed Tropical Forests; CAB International: Wallingford, UK, 1994. [Google Scholar]
- Páscoa, F.; Bento, J.; Marques, C. Previsão da Produção Lenhosa Para o Período 1988/2048; ACEL: Lisboa, Portugal, 1989. Inventário Florestal, Pinheiro Bravo. (In Portuguese) [Google Scholar]
- WEKA. WEKA Software. Machine Learning Group at the University of Waikato: Waikato, New Zealand. 2020. Available online: https://www.cs.waikato.ac.nz/ml/weka/ (accessed on 11 August 2020).
- Hall, M.; Frank, E.; Holmes, G.; Pfahringer, B.; Reutemann, P.; Witten, I.H. The WEKA data mining software: An update. SIGKDD Explor. 2009, 11, 10–18. [Google Scholar] [CrossRef]
- Breiman, L. Random forests. Mach. Learn. 2001, 45, 5–32. [Google Scholar] [CrossRef] [Green Version]
- Witten, I.H.; Frank, E.; Hall, M.A. Data Mining: Practical Machine Learning Tools and Techniques; Morgan Kaufmann: Burlington, VT, USA, 2011. [Google Scholar]
- Ryan, T.P. Modern Regression Methods; John Wiley & Sons: New York, NY, USA, 1997. [Google Scholar]
- Nussbaumer, R.; Mariethoz, G.; Gloaguen, E.; Holliger, K. Which path to choose in sequential Gaussian simulation. Math. Geosci. 2018, 50, 97–120. [Google Scholar] [CrossRef]
- Albuquerque, M.; Gerassis, S.; Sierra, C.; Taboada, J.; Martín, J.; Antunes, I.; Gallego, J. Developing a new Bayesian risk index for risk evaluation of soil contamination. Sci. Total Environ. 2017, 603–604, 167–177. [Google Scholar] [CrossRef]
- Goovaerts, P. Geostatistics for Natural Resources Evaluation. Applied Geostatistics; Oxford University Press: New York, NY, USA, 1997; p. 496. [Google Scholar]
- Soares, A.; Nunes, R.; Azevedo, L. Integration of uncertain data in geostatistical modelling. Math. Geosci. 2017, 49, 253–273. [Google Scholar] [CrossRef]
- Alves, A.A.M. Técnicas de Produção Florestal; Instituto Nacional de Investigação Científica: Lisbon, Portugal, 1988. (In Portuguese) [Google Scholar]
- Alves, A.M.; Pereira, J.S.; Correia, V.A. Silvicultura. A Gestão dos Ecossistemas Florestais; Fundação Calouste Gulbenkian: Lisbon, Portugal, 2012. (In Portuguese) [Google Scholar]
- AFN. Inventário Florestal Nacional Portugal Continental. 5º Inventário Florestal Nacional 2005–2006. Apresentação do Relatório Final. Available online: http://www2.icnf.pt/portal/florestas/ifn/resource/doc/ifn/Apresenta-IFN5-AFN-DNGF-JP.pdf (accessed on 11 August 2020). (In Portuguese).
- DGR. Inventário Florestal Nacional Portugal Continental. 3ª Revisão, 1995–1998. Relatório Final; Direçção-Geral das Florestas (DGR): Lisboa, Portugal, 2010. (In Portuguese) [Google Scholar]
- AFN. Inventário Florestal Nacional Portugal Continental. 5º Inventário Florestal Nacional 2005–2006. FloreStat—Aplicação para a Consulta dos Resultados do 5° Inventário Florestal Nacional. Autoridade Florestal Nacional (AFN): Lisboa, Portugal. 2010. Available online: http://www.icnf.pt/portal/florestas/ifn/ifn5/relatorio-final-ifn5-florestat-1 (accessed on 11 August 2020). (In Portuguese).
- Santos, C.; Almeida, J.A. Spatial characterization of maritime pine productivity in Portugal. In Forest Context and Policies in Portugal. World Forests; Reboredo, F., Ed.; Springer: Cham, Switzerland, 2014; Volume 19, pp. 185–217. [Google Scholar] [CrossRef]
- Oliveira, A.C.; Pereira, J.S.; Correia, A.V. A Silvicultura do Pinheiro Bravo. Manual; Centro Pinus: Porto, Portugal, 2000. [Google Scholar]
- Alegria, C. Simulation of silvicultural scenarios and economic efficiency for maritime pine (Pinus pinaster Aiton) wood-oriented management in centre inland of Portugal. Investig. Agrar. Sist. Recur. For. Syst. 2011, 20. [Google Scholar] [CrossRef] [Green Version]
- Ribeiro, M.M.; Plomion, C.; Petit, R.; Vendramin, G.G.; Szmidt, A.E. Variation in chloroplast single-sequence repeats In Portuguese maritime pine (Pinus pinaster Ait.). Theor. Appl. Genet 2001, 102, 97–103. [Google Scholar] [CrossRef]
- Louro, G.; Marques, H.; Salinas, F. Elementos de Apoio à Elaboração de Projectos Florestais, 2nd ed.; Estudos e Informação n° 321, Direcção Geral das Florestas—DGF, Lisboa. 2002. Available online: http://www2.icnf.pt/portal/florestas/gf/documentos-tecnicos/resource/doc/Elaboracao-projetos-florestais_2ed-EI-321_Louro-Marques-Salinas_DGF_2002b.pdf (accessed on 11 August 2020). (In Portuguese).
- Pereira, J.S.; Correia, A.V.; Correia, C.V.; Ferreira, M.T.; Onofre, N.; Freitas, H.; Godinho, F. Florestas e biodiversidade. In Alterações Climáticas em Portugal. Cenários, Impactos e Medidas de Adaptação (Projecto SIAM II); Santos, F.D., Miranda, P.M.A., Eds.; Gradiva: Lisbon, Portugal, 2006; pp. 301–344. [Google Scholar]


| Type | Variable | Units | Description |
|---|---|---|---|
| Temperature | T max | °C 10−1 | Monthly average maximum temperature |
| T min | °C 10−1 | Monthly average minimum temperature | |
| BIO1 | °C 10−1 | Annual mean temperature | |
| BIO2 | °C 10−1 | Mean diurnal range (mean of monthly (max temp–min temp)) | |
| BIO3 | % | Isothermality | |
| BIO4 | % | Temperature seasonality (standard deviation ×100) | |
| BIO5 | °C 10−1 | Maximum temperature of the warmest month | |
| T max Aug | °C 10−1 | Maximum temperature in August | |
| BIO6 | °C 10−1 | Minimum temperature of the coldest month (i.e., winter frost) | |
| T min Jan | °C 10−1 | Minimum temperature in January | |
| BIO7 | °C 10−1 | Temperature annual range | |
| BIO8 | °C 10−1 | Mean temperature of the wettest quarter | |
| BIO9 | °C 10−1 | Mean temperature of the driest quarter | |
| BIO10 | °C 10−1 | Mean temperature of the warmest quarter | |
| BIO11 | °C 10−1 | Mean temperature of the coldest quarter | |
| Precipitation | BIO12 | mm | Annual precipitation |
| BIO13 | mm | Precipitation of the wettest month | |
| BIO14 | mm | Precipitation of the driest month | |
| BIO15 | % | Precipitation seasonality (coefficient of variation) | |
| BIO16 | mm | Precipitation of the wettest quarter | |
| BIO17 | mm | Precipitation of the driest quarter | |
| BIO18 | mm | Precipitation of the warmest quarter | |
| BIO19 | mm | Precipitation of the coldest quarter | |
| Topography | E | m | Elevation—The vertical distance measured between a point and a datum (a reference surface) which is usually the mean sea level (MSL) |
| S | % | Slope—The rate of change of elevation for each digital elevation model (DEM) cell (i.e., the first derivative of a DEM) | |
| A | ° | Aspect—The orientation of slope measured clockwise in degrees from 0 to 360, where 0 is north-facing, 90 is east-facing, 180 is south-facing, and 270 is west-facing. | |
| Soil | WRBFU | Soil codes from the international soil classification system for naming soils and creating legends for soil maps. |
| ML Tree Regression Models—Species Distribution Models (Pb95) (n = 88,455) | |||
|---|---|---|---|
| Regressor variables | M5P | RF | RT |
| R2 | R2 | R2 | |
| (MAE) | (MAE) | (MAE) | |
| ME—BIO5, BIO6, BIO7, BIO12, E, WRBFU | 0.6688 | 0.6934 | 0.5356 |
| (5.9535) | (5.5021) | (6.5937) | |
| MR—BIO13, BIO19, BIO16, BIO12, BIO18, BIO17, BIO2 | 0.6532 | 0.6555 | 0.5322 |
| (6.2138) | (5.7823) | (6.5820) | |
| ML Tree Classification Models—Species distribution models (P) (n = 88,455) | |||
| Regressor variables | J48 | RF | RT |
| Kappa | Kappa | Kappa | |
| (MAE) | (MAE) | (MAE) | |
| ME—BIO5, BIO6, BIO7, BIO12, E, WRBFU | 0.6425 | 0.6524 | 0.5789 |
| (0.1893) | (0.1701) | (0.1654) | |
| MR—BIO7, BIO16, BIO4, BIO19, BIO13, BIO12, BIO2 | 0.6298 | 0.6427 | 0.5613 |
| (0.1937) | (0.1761) | (0.1724) | |
| ML Tree Regression Models—Productivity models (SI35) (n = 739) | |||
| Regressor variables | M5P | RF | RT |
| R2 | R2 | R2 | |
| (MAE) | (MAE) | (MAE) | |
| ME—BIO5, BIO6, BIO7, BIO12, E, WRBFU | 0.3727 | 0.4261 | 0.2247 |
| (2.9650) | (2.9093) | (3.9190) | |
| MR—BIO4, BIO3, E, BIO7, BIO8, BIO11, BIO6 | 0.3845 | 0.4170 | 0.2634 |
| (2.9473) | (2.9339) | (3.7945) | |
| Species Distribution (Pb95) (n = 88,455) | Species Productivity (SI35) (n = 739) | ||||||||
|---|---|---|---|---|---|---|---|---|---|
| Type | Variables | Min. | Max. | Mean | SD | Min. | Max. | Mean | SD |
| Temperature | BIO5 | 19.7 | 34.0 | 28.6 | 2.5 | 22.1 | 31.9 | 27.3 | 2.1 |
| BIO6 | −2.8 | 9.2 | 5.0 | 2.3 | −1.1 | 8.3 | 4.8 | 1.9 | |
| BIO7 | 12.2 | 29.3 | 23.6 | 2.9 | 14.1 | 27.9 | 22.5 | 2.9 | |
| Precipitation | BIO12 | 463.0 | 1792.0 | 840.7 | 269.9 | 483.0 | 1593.0 | 1015.6 | 211.5 |
| Topography | E | 0.0 | 1921.0 | 321.1 | 262.6 | 0.0 | 1275.0 | 329.6 | 248.5 |
| Maritime Pine—Pb95 > 0 (n = 23,752) | ||||||
|---|---|---|---|---|---|---|
| Type | Variable | Units | Min. | Max. | Mean | Std. Dev. |
| Temperature | BIO5 | °C | 21.8 | 32.7 | 27.5 | 2.2 |
| T max Aug | °C | 21.8 | 32.7 | 27.5 | 2.2 | |
| BIO6 | °C | −1.4 | 9.0 | 5.4 | 1.7 | |
| T min Jan | °C | −2.4 | 9.3 | 3.4 | 2.0 | |
| BIO7 | °C | 13.3 | 28.2 | 22.1 | 2.9 | |
| T max Aug–T min Jan | °C | 14.1 | 31.0 | 24.1 | 3.2 | |
| Precipitation | BIO12 | mm | 468.0 | 1587.0 | 968.3 | 221.3 |
| Topography | E | m | 0.0 | 1192.0 | 264.9 | 200.7 |
| Temperature Range (°C) | Temperature Limits (°C) | Precipitation (mm) | Elevation (m) | WRFBU |
|---|---|---|---|---|
| BIO7 ≤ 25.1 | BIO6 > 2.6 BIO5 < 29.8 | P > 821 | E < 731 | Soils different of LVcc, CMca, and FLca |
Publisher’s Note: MDPI stays neutral with regard to jurisdictional claims in published maps and institutional affiliations. |
© 2021 by the authors. Licensee MDPI, Basel, Switzerland. This article is an open access article distributed under the terms and conditions of the Creative Commons Attribution (CC BY) license (http://creativecommons.org/licenses/by/4.0/).
Share and Cite
Alegria, C.; Roque, N.; Albuquerque, T.; Fernandez, P.; Ribeiro, M.M. Modelling Maritime Pine (Pinus pinaster Aiton) Spatial Distribution and Productivity in Portugal: Tools for Forest Management. Forests 2021, 12, 368. https://doi.org/10.3390/f12030368
Alegria C, Roque N, Albuquerque T, Fernandez P, Ribeiro MM. Modelling Maritime Pine (Pinus pinaster Aiton) Spatial Distribution and Productivity in Portugal: Tools for Forest Management. Forests. 2021; 12(3):368. https://doi.org/10.3390/f12030368
Chicago/Turabian StyleAlegria, Cristina, Natália Roque, Teresa Albuquerque, Paulo Fernandez, and Maria Margarida Ribeiro. 2021. "Modelling Maritime Pine (Pinus pinaster Aiton) Spatial Distribution and Productivity in Portugal: Tools for Forest Management" Forests 12, no. 3: 368. https://doi.org/10.3390/f12030368
APA StyleAlegria, C., Roque, N., Albuquerque, T., Fernandez, P., & Ribeiro, M. M. (2021). Modelling Maritime Pine (Pinus pinaster Aiton) Spatial Distribution and Productivity in Portugal: Tools for Forest Management. Forests, 12(3), 368. https://doi.org/10.3390/f12030368