Article

Effects of Soil Moisture and Temperature on Microbial Regulation of Methane Fluxes in a Poplar Plantation

Co-Innovation Center for Sustainable Forestry in Southern China, College of Biology and the Environment, Nanjing Forestry University, Nanjing 210037, Jiangsu, China
*
Author to whom correspondence should be addressed.
Forests 2021, 12(4), 407; https://doi.org/10.3390/f12040407
Submission received: 5 January 2021 / Revised: 20 March 2021 / Accepted: 25 March 2021 / Published: 29 March 2021
(This article belongs to the Section Forest Ecology and Management)

Abstract

:
Improved mechanistic understanding of soil methane (CH4) exchange responses to shifts in soil moisture and temperature in forest ecosystems is pivotal to reducing uncertainty in estimates of the soil-atmospheric CH4 budget under climate change. We investigated the mechanism behind the effects of soil moisture and temperature shifts on soil CH4 fluxes under laboratory conditions. Soils from the Huai River Basin in China, an area that experiences frequent hydrological shifts, were sampled from two consecutive depths (0–20 and 20–50 cm) and incubated for 2 weeks under different combinations of soil moisture and temperature. Soils from both depths showed an increase in soil moisture and temperature-dependent cumulative CH4 fluxes. CH4 production rates incubated in different moisture and temperature in surface soil ranged from 1.27 to 2.18 ng g−1 d−1, and that of subsurface soil ranged from 1.18 to 2.34 ng g−1 d−1. The Q10 range for soil CH4 efflux rates was 1.04–1.37. For surface soils, the relative abundance and diversity of methanotrophs decreased with moisture increase when incubated at 5 °C, while it increased with moisture increase when incubated at 15 and 30 °C. For subsurface soils, the relative abundance and diversity of methanotrophs in all samples decreased with moisture increase. However, there was no significant difference in the diversity of methanogens between the two soil depths, while the relative abundance of methanogens in both depths soils increased with temperature increase when incubated at 150% water-filled pore space (WFPS). Microbial community composition exhibited large variations in post incubation samples except for one treatment based on the surface soils incubated at 15 °C, which showed a decrease in the total and unique species number of methanotrophs with moisture increase. In contrast, the unique species number of methanogens in surface soils increased with moisture increase. The analysis of distance-based redundancy analysis (db-RDA) showed that soil pH, dissolved organic carbon (DOC), dissolved organic nitrogen (DON), microbial biomass carbon (MBC), NO3-N, and NH4+-N mainly performed a significant effect on methanotrophs community composition when incubated at 60% WFPS, while they performed a significant effect on methanogens community composition when incubated at 150% WFPS. Overall, our findings emphasized the vital function of soil hydrology in triggering CH4 efflux from subtropical plantation forest soils under future climate change.

1. Introduction

As the largest carbon pool in terrestrial ecosystems, forests play a significant role in regulating and mitigating global climate change [1]. Aerobic forest soils are highly efficient at oxidizing atmospheric CH4 and contribute about 7% to the global atmospheric sink [2,3,4]. However, a considerable number of studies have reported CH4 emissions from forest soils [5,6,7,8,9,10]. To a great extent, dramatic changes in environmental factors (such as moisture and temperature), anthropogenically or naturally induced, could shift the role of forest ecosystems from net CH4 sinks to net CH4 sources [11]. Therefore, understanding the implications of changes in soil hydrology on CH4 flux of forest soils is crucial for accurate accounting of global CH4 budgets, especially under future climate change.
China has the largest plantation area (approximately 62 million ha) in the world [12,13], with 63% of plantations distributed in regions under a sub-tropical climate [14]. As poplar has the ability to grow in both dry and moist habitats [15], this species is cultivated worldwide on extended areas, occupying approximately the area of 31.4 million ha in the world [16], and spreading over the area of 6.67 million ha in China [15]. Hence, the poplar plantation is one of the typical and important forest types that is likely to suffer from the hydrological variation in future climate change. Areas in some sub-tropical regions in China, such as the Yangtze and Huai River Basin, experience a hydrological shift due to a short-term and intense wet season that lasts from June to July each year [17]. However, little is known about the potential impact of such seasonal hydrological shifts on the intrinsic atmospheric CH4 exchange capability of the soils in these forest ecosystems.
Soil moisture content govern the intrinsic ability of soils to act as sinks or sources of atmospheric CH4 through regulating the CH4 fluxes between soils and the atmosphere. Moisture not only impacts the gas diffusivity [18], but also is important for the substrate supply for soil microorganisms [19,20]. For many soils, 60% water-filled pore space (WFPS) is approximately field capacity [21]. Maximum CH4 uptake rates were recorded under a diverse range of moisture conditions between 20% and 60% water-holding capacity [22,23]. Temperature is another important factor controlling CH4 transport, oxidation and production by affecting gas diffusion and microorganism activity [24,25]. Methanogenesis seems to be more sensitive to soil temperature than methanotrophy [25]. CH4 oxidation occurs between 6–50 °C, and the best reaction temperature ranged from 20 to 35 °C [24,26]. It should be noted that the CH4 oxidation rate decreases drastically at both below and above the temperature optima [27]. Furthermore, a shift in the abundance, composition and structure of CH4-producing (methanogens) and -consuming (methanotrophs) microbial communities could potentially be affected by changes in soil hydrology and temperature, thereby triggering or mitigating soil CH4 effluxes [28,29]. Indeed, some studies focused on the effect of moisture and temperature on greenhouse gas fluxes with incubation method at different ecosystems, including forest, grassland, peatland, and paddy soils [19,21,30,31,32]. However, few studies have mechanistically investigated the combined impact of a shift in soil moisture and temperature on functional microbial communities in relation to CH4 fluxes in such plantation forest soils.
In light of this knowledge gap, we chose a poplar plantation to reveal the complex variation of CH4 fluxes driven by microbial community under the shift of moisture and temperature. In this study, we performed a laboratory-based soil incubation experiment using Huai River Basin poplar plantation soils under different moisture and temperature treatments, where the soils naturally experience hydrological shifts during middle June to early July each year (approximately 15 days). We hypothesized that: (1) the rise in temperature could lead to the increase of methanogens abundance, stimulating CH4 production; (2) the rise in moisture would decrease the methanotrophs abundance, thereby restraining CH4 oxidation. As a result, high temperature with high moisture would stimulate soil CH4 efflux regulated by microbes.

2. Materials and Methods

2.1. Site Description

The study site is located at the Sihong Forest Farm (33°20′ N, 118°20′ E), Sihong County, in the lower reaches of the Huai River Basin of Jiangsu Province, China. The study area occurs in a mid-latitude warm zone with a typical sub-tropical climate having long periods of sunshine. The mean annual temperature is 14.4 °C, ranging from a minimum monthly temperature of −7 °C (January) to 28 °C (July). The mean annual precipitation is approximately 972.5 mm, mostly occurring from June to August. The soil is a Gleysol with a clay-loam texture, derived from lacustrine sediments. The poplar plantation at the study site was established in March 2007 with 1-year-old seedlings of clone “Nanlin-95”, a hybrid of clone I-69 (Populus deltoides Bartr. cv. “Lux”) and clone I-45 (P. euramericana [Dode] Guineir. cv. “I-45/51”), on an area of 6.7 ha. At the time of the study in 2019, the average tree height and diameter at breast height were 23.92 m and 24.46 cm, respectively. The main understory vegetation included barnyard grass (Echinochloa crusgalli [L.] Beauv), Hawk’s Beard (Youngia japonica [L.] DC), Common Heronsbill Herb (Geranium wilfordii Maxim), and Mock strawberry (Duchesnea indica [Andr.] Focke).

2.2. Soil Sampling and Laboratory Incubation Experimental Design

Soil samples were collected in three plots (120 m × 60 m per plot). In July 2019, five pits in each plot were selected following the S-type sampling approach. Thirty soil cores from two depths (surface: 0–20 cm and subsurface: 20–50 cm) were collected from the three plots. Soil cores collected from each depth were sub-divided into two portions immediately after thorough mixing and cleaning (manual removal of plant debris and stones). For fresh soil microbial community analysis, at least three aliquots from each sample depth were transferred into sterilized centrifuge tubes and immediately frozen in dry ice. The rest of the samples was transported to a laboratory in a container with ice bags. In the laboratory, the samples for microbial analysis were stored at −80 °C, and the rest of the samples were stored at 4 °C pending incubation. Prior to incubation, the samples from each depth were sieved through a 2 mm mesh and thoroughly mixed to achieve homogenization.
Aliquots from each soil depth were incubated under multiple combinations of soil moisture (60% and 150% WFPS) and soil temperature (5, 15, and 30 °C), resulting in 12 treatments. The three incubation temperatures represented the lowest, mean, and highest soil temperatures, respectively, at the study site, and the soil moisture percentages represented the conditions immediately before (60%) and after (150%) a heavy precipitation event typical for the region. For laboratory incubation, aliquots of approximately 30 g (dry weight) of well-mixed soil were transferred into sterilized 250-mL reagent bottles (Schott, Mainz, Germany). As the field soil moisture content was already approximately 60% WFPS, additional distilled water was added to some samples to create the 150% WFPS treatments. For aeration, the reagent bottles were covered with porous aluminum foils, which also served to create dark conditions for incubation. Soil moisture was maintained gravimetrically on a daily basis. All treatments were incubated in triplicate.

2.3. Soil Analysis after Incubation

Gravimetric soil water content (SWC) was determined by drying the soil samples at 105 °C for 24 h, and soil bulk density (BD) was determined using the core method [31]. Soil WFPS was calculated as follows:
WFPS ( % ) = SWC × BD 1 BD / 2.65 × 100
where, 2.65 is the assumed soil particle density (g cm−3). Soil pH was recorded with a pH meter (AB15 + Basic; Accumet, San Diego, CA, USA) in a 1:2.5 soil: water mixture. Dissolved organic carbon (DOC) and nitrogen (DON) contents were calculated after measuring total carbon (TC) and total nitrogen (TN) in soil extracts (10 g of soil in 40 mL of 0.5 M K2SO4) using a total organic carbon analyzer (TOC-L; Shimadzu, Kyoto, Japan). Microbial biomass carbon (MBC) was measured using the chloroform fumigation extraction method [33]. The concentration of mineral nitrogen, including ammonium nitrogen (NH4+-N) and nitrate nitrogen (NO3-N), was determined by ultraviolet–visible (UV–vis) spectrophotometry (UV-2550; Shimadzu, Tokyo, Japan) after extracting 5 g of soil in 50 mL of 2 M KCl.

2.4. Gas Sampling and Analysis

Soil samples were incubated for a period of 2 weeks, and gas sampling was conducted sequentially on days 1, 2, 4, 7, 10, and 14. On each sampling day, air in the headspace above the soil in each reagent bottle was sampled twice with a 6 h interval between samplings. The decrease in the headspace air pressure caused by the first sampling event was maintained by adding the same volume of oxygen (O2)-free nitrogen gas (N2). For headspace air sampling, the reagent bottles were tightly closed using polypropylene screw caps containing silicon septa. At each sampling time, approximately 25 mL of headspace air was collected from each reagent bottle using a 50 mL syringe and transferred into pre-evacuated glass vials (20 mL, SVF-20; Nichiden-Rika Glass Co., LTD, Kobe, Japan).
The CH4 concentration in the headspace air samples was measured using a gas chromatograph (7890B; Agilent Technologies, Inc., Palo Alto, CA, USA) equipped with two Porapak Q packed columns (length: 1.83 m, inner diameter: 2 mm, and mesh: 80/100) and flame ionization detector (FID). The working temperatures of the oven and detector were 60 °C and 250 °C, respectively. Pure N2 was used as the carrier gas (30 mL·min−1). For FID, the flow rates of hydrogen (as the fuel gas) and pure air (as the oxidant fuel gas) were 40 mL·min−1 and 400 mL·min−1, respectively. The standard gas (CH4 concentration: 10.2 ppm, National Institute of Metrology, Beijing, China) was used for calibration before and after each measurement.
The CH4 flux rates (F, ng·g−1·d−1) were calculated using the following equation:
F = T S T T S T + T × M W M V × β × V H 1 + α × V H 2 α × V H 1 W S × 1 Δ t
where, MW is the molar weight of CH4 (g·mol−1), MV is the volume of one-mole gas at the standard temperature and pressure (22.4 L·mol−1), TST is the standard temperature (273.15 K), T is the incubation temperature (°C), WS is the dry weight of soil (g), ∆t is the interval times between headspace sampling (6 h), α and β are CH4 concentration measured by GC on the first and second time sampling (ppm), VH1 is the volume of the reagent bottles (250 mL), and VH2 is the headspace volume of the reagent bottles after the first sampling (25 mL).
Cumulative CH4 fluxes for the 2-week incubation period (Fc, ng·g−1·14d−1) was estimated using the following equation:
F C = F i
where, Fi is the CH4 flux at the ith days (ng·g−1·d−1). Furthermore, the missing daily CH4 fluxes such as at 3rd day were estimated by the mean values between the two sampling events, considering that the sampling was not continuous.
The Q10 values were calculated as indicators of temperature sensitivity of the CH4 fluxes using the formula:
Q 10 = R 2 / R 1 10 / T 2 T 1
where, T1 and T2 represent two incubation temperatures, and R1 and R2 represent CH4 fluxes at temperatures T1 and T2, respectively.

2.5. DNA Extraction, Polymerase Chain Reaction Amplification, and Illumina MiSeq Sequencing

Microbial genomic DNA was extracted from 0.5 g of each soil sample after incubation using a soil DNA extraction kit (Omega Bio-Tek, Norcross, GA, USA) following the standard protocol described by the manufacturer. The quality and quantity of soil-extracted DNA in 50 μL of Tris-Ethylene Diamine Tetraacetic Acid (EDTA) buffer solution were determined using a NanoDrop 2000 UV–vis spectrophotometer (Thermo Scientific, Wilmington, DE, USA). In addition, the quality of DNA was also confirmed via 1% agarose gel electrophoresis. In total, 36 soil extracted DNA samples (from the 12 treatments [n = 3]) were used for polymerase chain reaction (PCR) amplification and Illumina MiSeq analysis.
The primer sets 1106F-1378R (TTWAGTCAGGCAACGAGC), (TGTGCAAGGAGCAGGGAC) [34] and A189F-mb661R (GGNGACTGGGACTTCTGG), (CCGGMGCAACGTCYTTACC) [35] were used, targeting alpha subunits of the functional genes, methyl-coenzyme M reductase (mcrA) and particulate methane monooxygenase (pmoA), on the Illumina MiSeq platform. The PCR amplifications were carried out using 20 μL of reaction mixture containing 4 μL of 5 × FastPfu Buffer, 2 μL of 2.5 mM deoxyribonucleoside triphosphates (dNTPs), 0.8 μL of each primer (5 μM), 0.4 μL of FastPfu polymerase enzyme, and 10 ng of template DNA. The reaction conditions for PCR (ABI GeneAmp 9700; Applied Biosystems, Waltham, MA, USA) were as follows: for mcrA, initial denaturation: 3 min at 95 °C, 37 cycles (95 °C 30 s, 55 °C 30 s, and 72 °C 45 s), and final extension: 10 min at 72 °C, and for pmoA, initial denaturation: 3 min at 95 °C, 35 cycles (95 °C 30 s, 55 °C 30 s, and 72 °C 45 s), and final extension: 10 min at 72 °C.
The PCR products were purified using 2% agarose gel electrophoresis using AxyPrep DNA Gel Extraction Kit (Axygen Biosciences, Union City, CA, USA) and were quantified using QuantiFluor™ -ST (Promega, Madison, WI, USA) according to the manufacturers’ instructions. Purified amplicons were pooled into equimolar concentrations and paired-end sequenced (2 × 300) on an Illumina MiSeq platform (Illumina, San Diego, CA, USA), following the standard protocols by Majorbio Bio-Pharm Technology Co. Ltd. (Shanghai, China). The raw data were submitted to the National Center for Biotechnology Information Sequence Read Archive database (Accession Number: PRJNA670803).
Raw fastq files were demultiplexed, quality-filtered by Trimmomatic and merged by Fast Length Adjustment of Short reads (FLASH, https://ccb.jhu.edu/software/FLASH/, accessed on 18 December 2020) with the following criteria: (i) the reads were truncated at any site receiving an average quality score <20 over a 50 bp sliding window; (ii) primers were exactly matched allowing 2 nucleotide mismatching, and reads containing ambiguous bases were removed; (iii) sequences whose overlap longer than 10 bp were merged in terms of their overlap with mismatch no more than 2 bp [36,37].
Operational taxonomic units (OTUs) were clustered with 97% similarity cutoff using UPARSE (version 7.1 http://drive5.com/uparse/, accessed on 18 December 2020) with a “greedy” algorithm that performs chimera filtering and OUT clustering simultaneously [38]. The taxonomy comparison of 97% similar OUT representative sequences were analyzed by the Ribosomal Database Project (RDP) classifier Bayesian algorithm (http://rdp.cme.msu.edu/, accessed on 18 December 2020) against the fgr/pmoA and fgr/mcrA database using confidence threshold of 70%.

2.6. Data Analysis

Analysis of variance of soil CH4 effluxes, chemical properties, and microbial α-diversity was performed with R 3.6.1. Alpha diversity of methanotrophs and methanogens was evaluated by Chao1 and Shannon indexes (reflecting microbial community abundance and diversity). The Chao1 [39] and Shannon [40] indexes were calculated using the following equations:
C h a o 1 = S o b s + n 2 n 1 1 2 n 2 + 1
where, Sobs is the number of operational taxonomic units (OTUs) actually observed, n1 is the number of OTUs with only one sequence, and n2 is the number of OTUs with only two sequences.
S h a n n o n = i = 1 S o b s n i N ln n i N
where, Sobs is the number of OTUs actually observed, ni is the number of sequences contained in the ith OTU, and N is all numbers of sequences.
A Venn chart was used to represent the number of shared and unique species (such as OTUs) in different incubation treatments to intuitively show the species similarity and overlap. In general, analysis was based on a similarity level of 97% OTUs. Distance-based redundancy analysis (db-RDA) based on Bray–Curtis distance was applied to clarify the relationship between soil properties and microbial community composition.

3. Results

3.1. Variation in Soil CH4 Fluxes

Cumulative CH4 fluxes (where positive values indicate CH4 effluxes from soils) showed an increasing trend among treatments in response to temperature (Figure 1). For the surface soil layer, CH4 fluxes of the sample incubated at 30 °C were significantly higher than the samples incubated at 5 °C, at the same moisture status. In subsurface soils, CH4 flux of the sample incubated at 5 °C + 60% WFPS was significantly lower than others, excepting the sample incubated at 15 °C + 60% WFPS. Moreover, the sensitivity analysis showed that the Q10 values of the different incubation samples ranged from 1.04 to 1.37 (mean = 1.17) (Table 1).
We measured the temporal pattern of CH4 fluxes across six sampling dates (Figure 2). Positive CH4 fluxes representing CH4 production rates were observed in almost all incubation treatments during the 2-week incubation period, whereas negative CH4 fluxes representing CH4 consumption were only exhibited by the 15 °C + 60% WFPS treatment on the seventh and fourteenth days of incubation. Independent of temperature, CH4 fluxes in surface soil samples with higher moisture (150% WFPS) declined over time. In contrast, CH4 fluxes in subsurface soil samples with higher moisture (150% WFPS) showed an increasing trend with incubation duration. During the experiment, surface soil samples incubated at 15 °C + 60% WFPS shifted from being CH4 sources to sinks. The CH4 fluxes in subsurface soil samples with lower moisture (60% WFPS) showed a W-type response, independent of temperature, and the middle peak coincided with the fourth day of incubation.

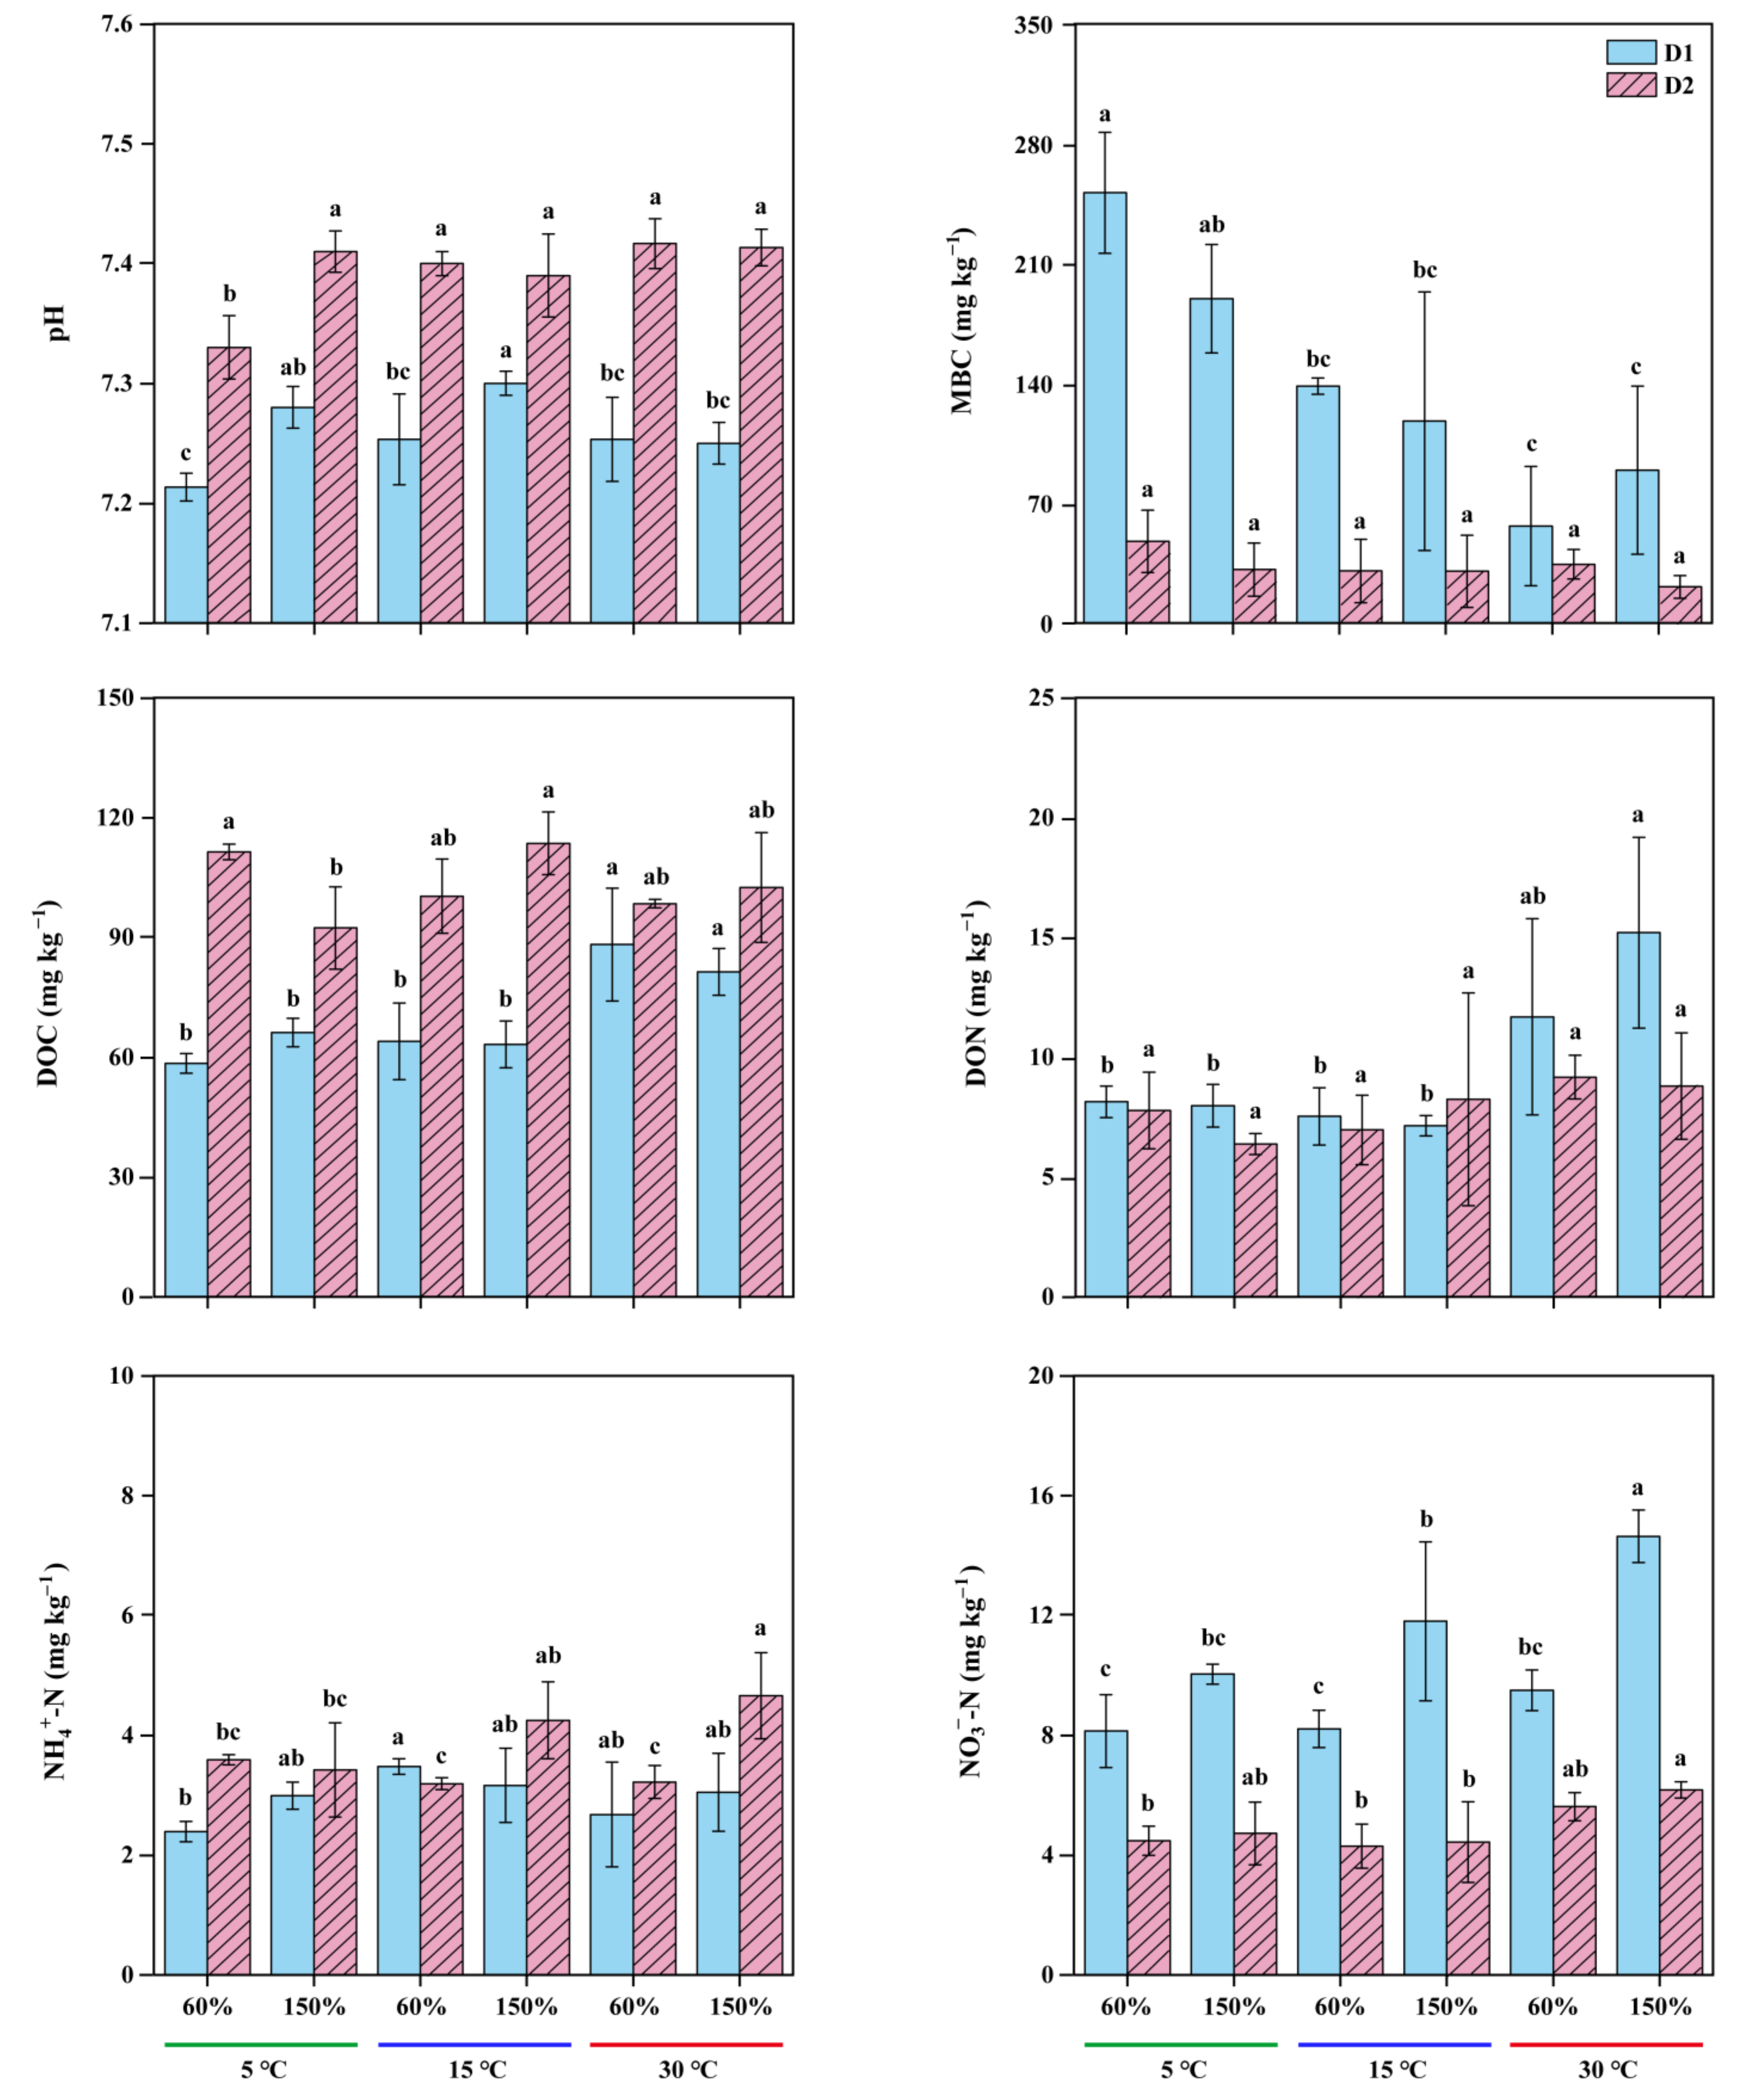
3.2. Variability in Soil Chemical Properties and Response of Experimental Treatments

After incubation, we measured the basic soil chemical properties known for their potential effects on soil CH4 production and consumption processes, for both the surface and subsurface layers (Figure 3). The pH, DOC, and NH4+-N contents of the surface soil samples were lower than those of the subsurface samples. In contrast, the MBC, NO3-N, and DON contents of the surface soil samples were higher than those of the subsurface samples.
The pH of the surface soil samples significantly increased with moisture increase when incubated at 5 and 15 °C. The soil NH4+-N content at subsurface significantly increased with moisture increase when incubated at 15 and 30 °C. The surface soil MBC appeared to decrease with temperature increase, whereas NO3-N generally increased with moisture and temperature increase. In addition, the surface soil DOC and DON in samples incubated at 30 °C were higher than those in samples incubated at 5 and 15 °C.

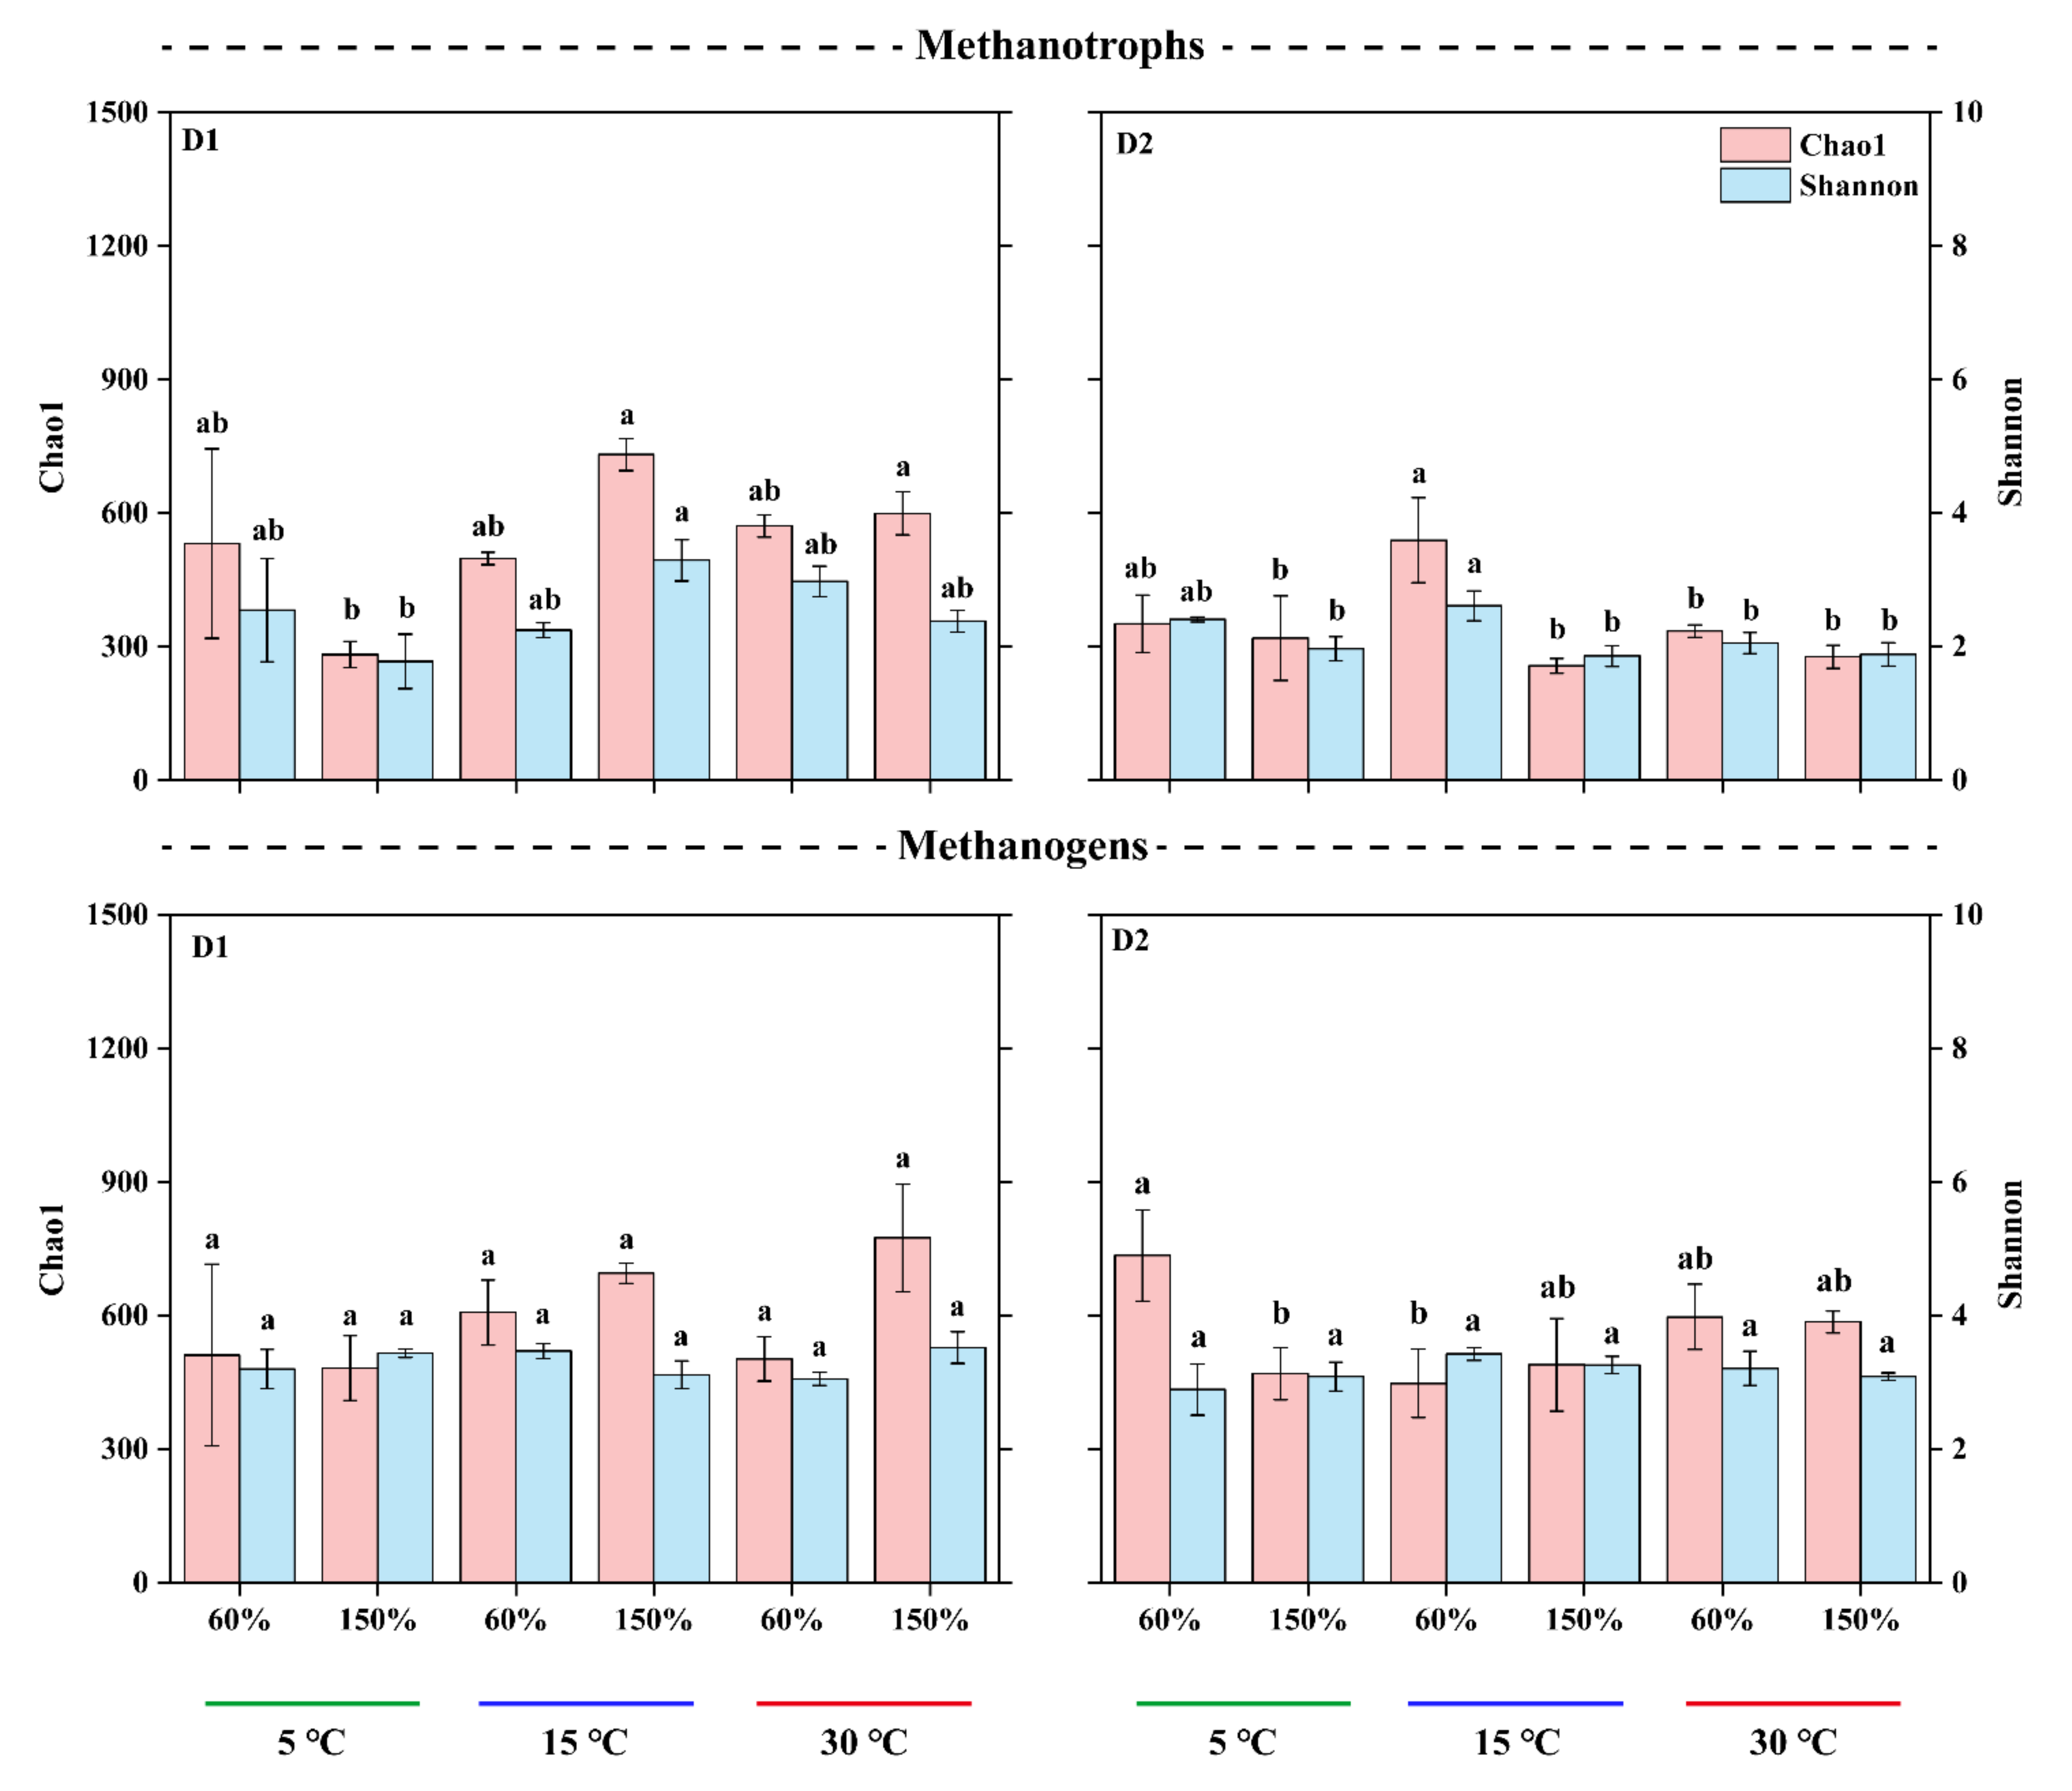
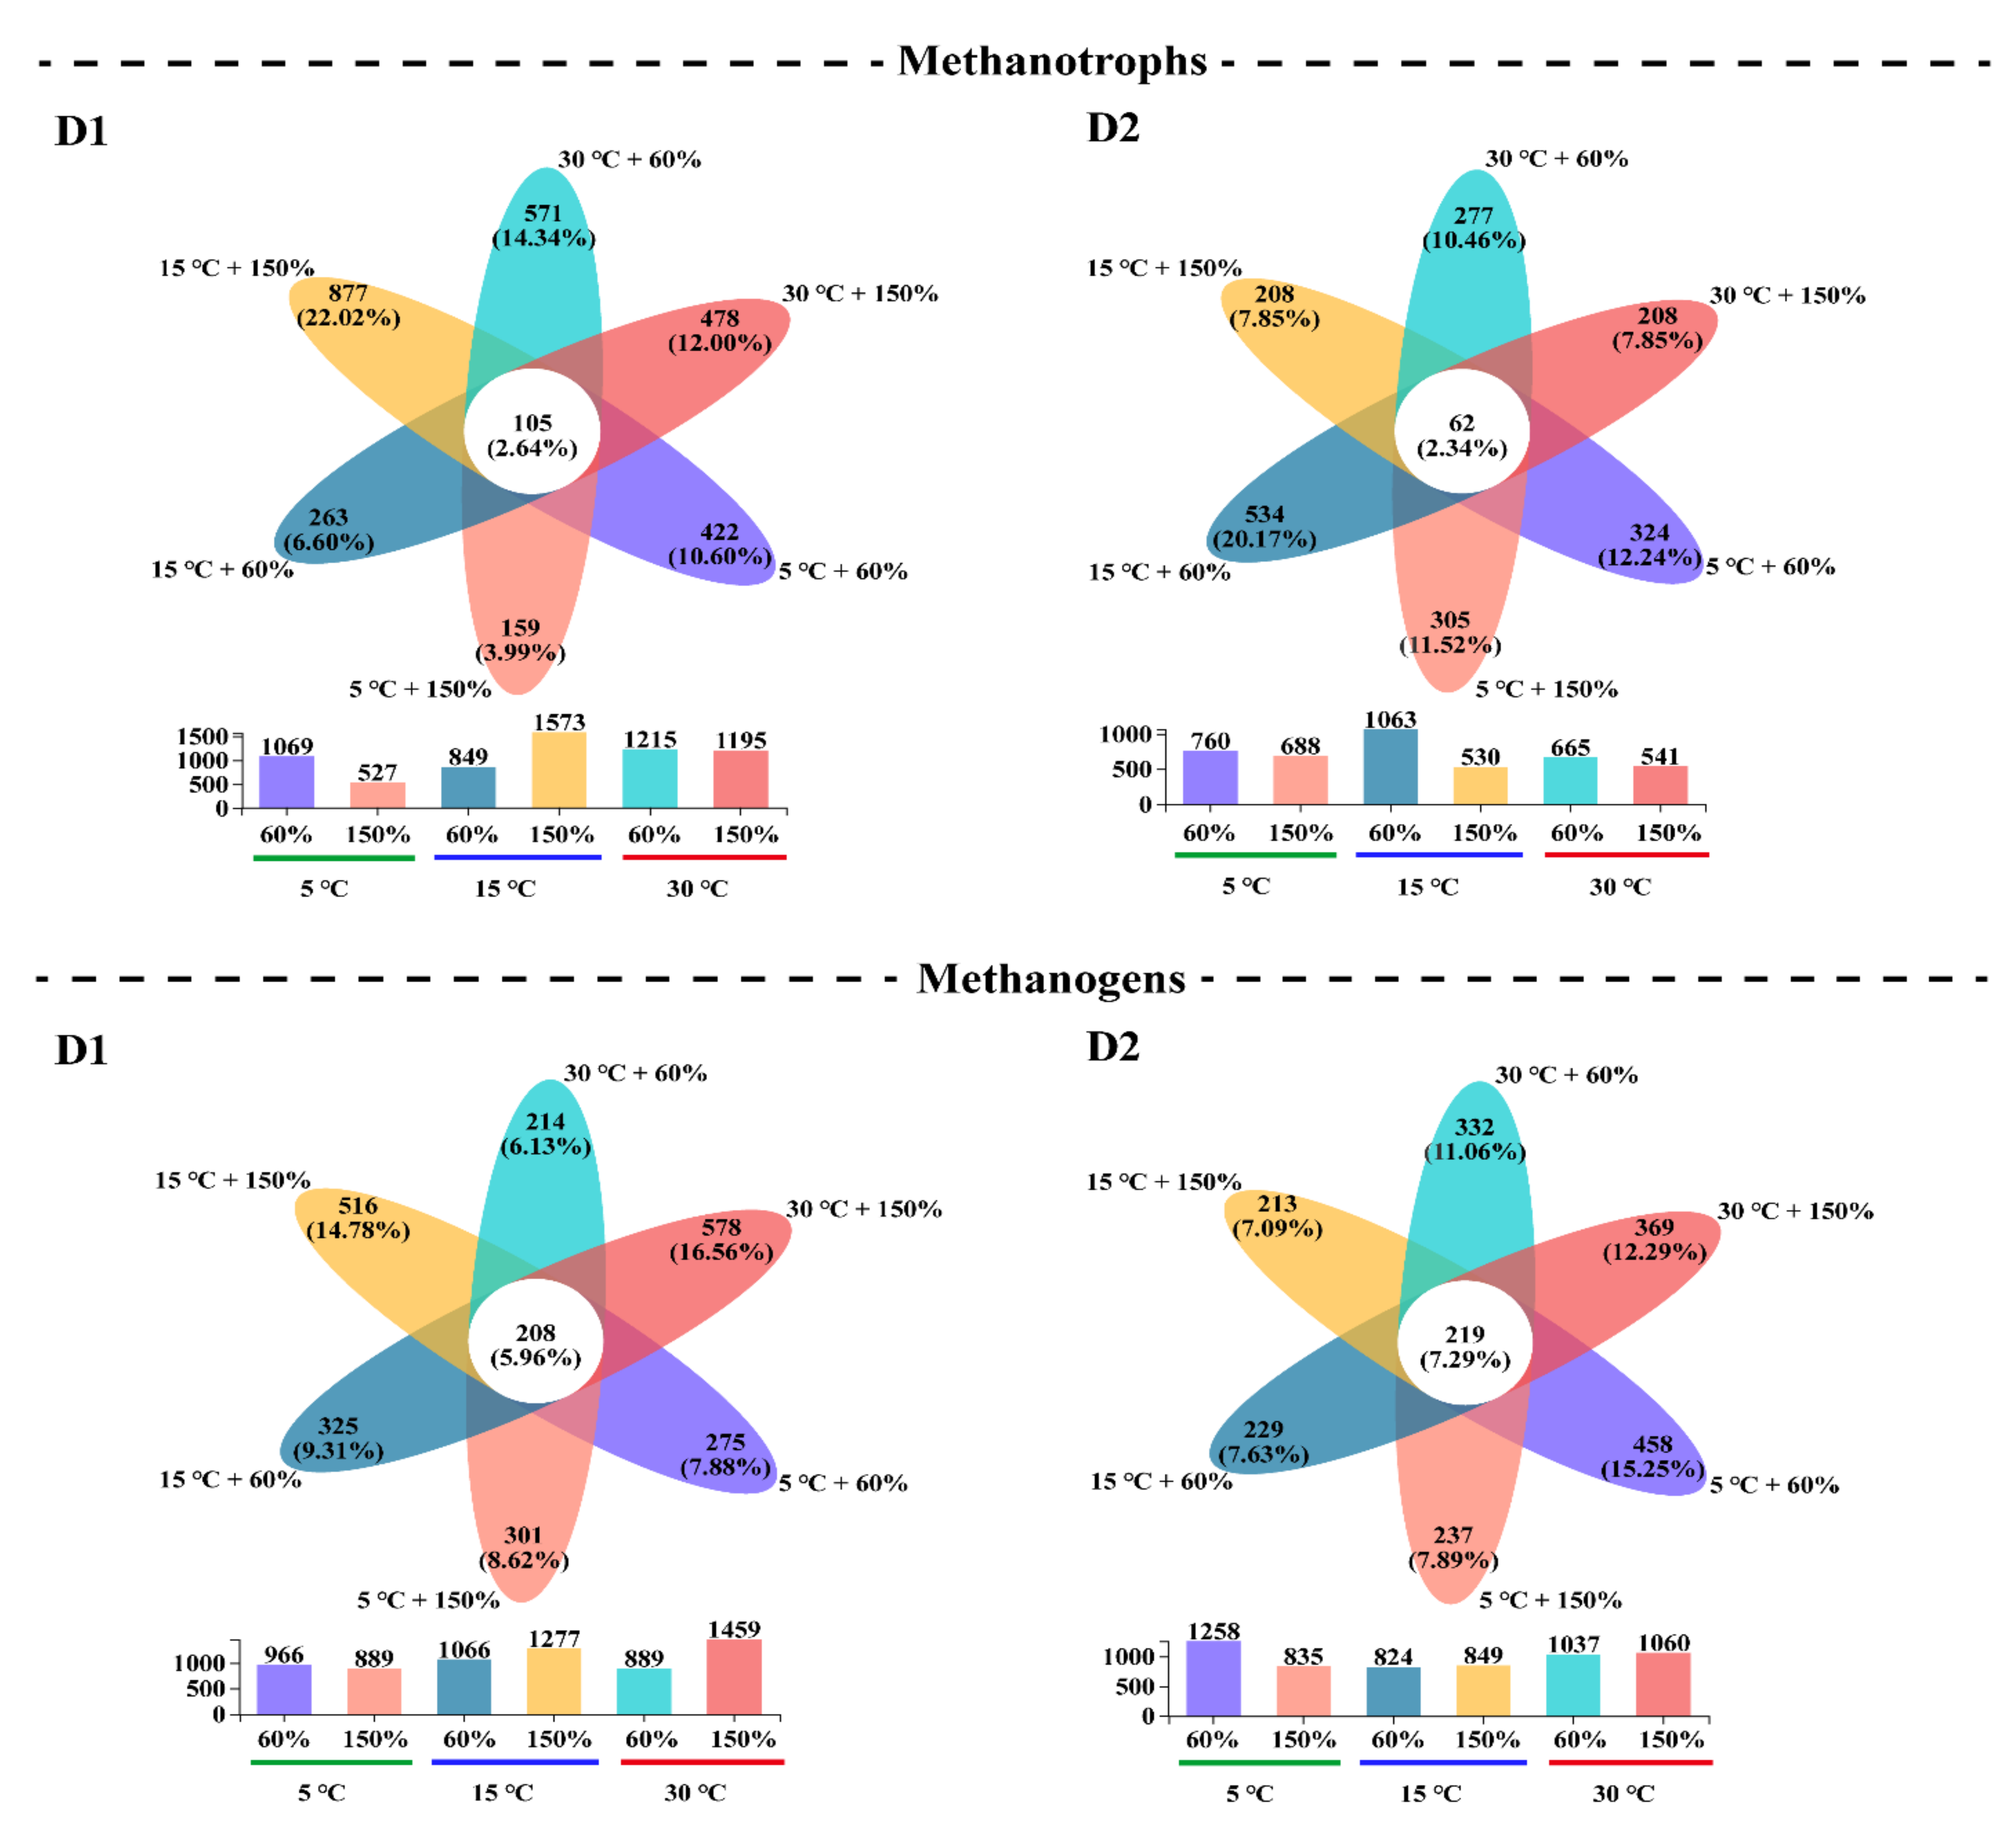
3.3. Microbial α-Diversity and Species Composition Patterns

For surface soils, the relative abundance (Chao1) and diversity (Shannon) of methanotrophs decreased with moisture increase when incubated at 5 °C, while increased with moisture increase when incubated at 15 and 30 °C (Figure 4). The relative abundance of methanotrophs incubated at 5 °C + 150% WFPS was significantly lower than that in samples incubated at 15 and 30 °C + 150% WFPS. The diversity of methanotrophs incubated at 5 °C + 150% WFPS was significantly lower than that in samples incubated at 15 °C + 150% WFPS. For subsurface soils, the relative abundance and diversity of methanotrophs in all samples decreased with moisture increase regardless of the incubation temperature. The relative abundance and diversity of methanotrophs incubated at 15 °C + 60% WFPS was significantly higher than that of other treatments, excepting the samples incubated at 5 °C + 60% WFPS.
However, there was no significant difference in diversity of methanogens for both surface and subsurface soils, regardless of the incubation treatments. The relative abundance of methanogens in both surface and subsurface soils increased with temperature increase when incubated at 150% WFPS. Surprisingly, for subsurface soils, the relative abundance of methanogens incubated at 60% WFPS was significantly higher than those at 150% WFPS, when the incubation temperature was 5 °C. The relative abundance of methanogens incubated at 5 °C was significantly higher than those at 15 °C, when the incubation moisture was 60% WFPS.
The shared OTUs of methanotrophs and methanogens under different moisture and temperature treatment had only 2–8%, which indicated a large variation in microbial community composition after incubating (Figure 5). Except for the surface soil samples incubated at 15 °C, the total and unique species number of methanotrophs decreased with increasing moisture during incubation. In contrast, the unique species number of methanogens in surface soils increased with increasing moisture during incubation. Moreover, the total species number of methanogens in subsurface soils increased with increasing temperature during incubation, when incubated at 150% WFPS.

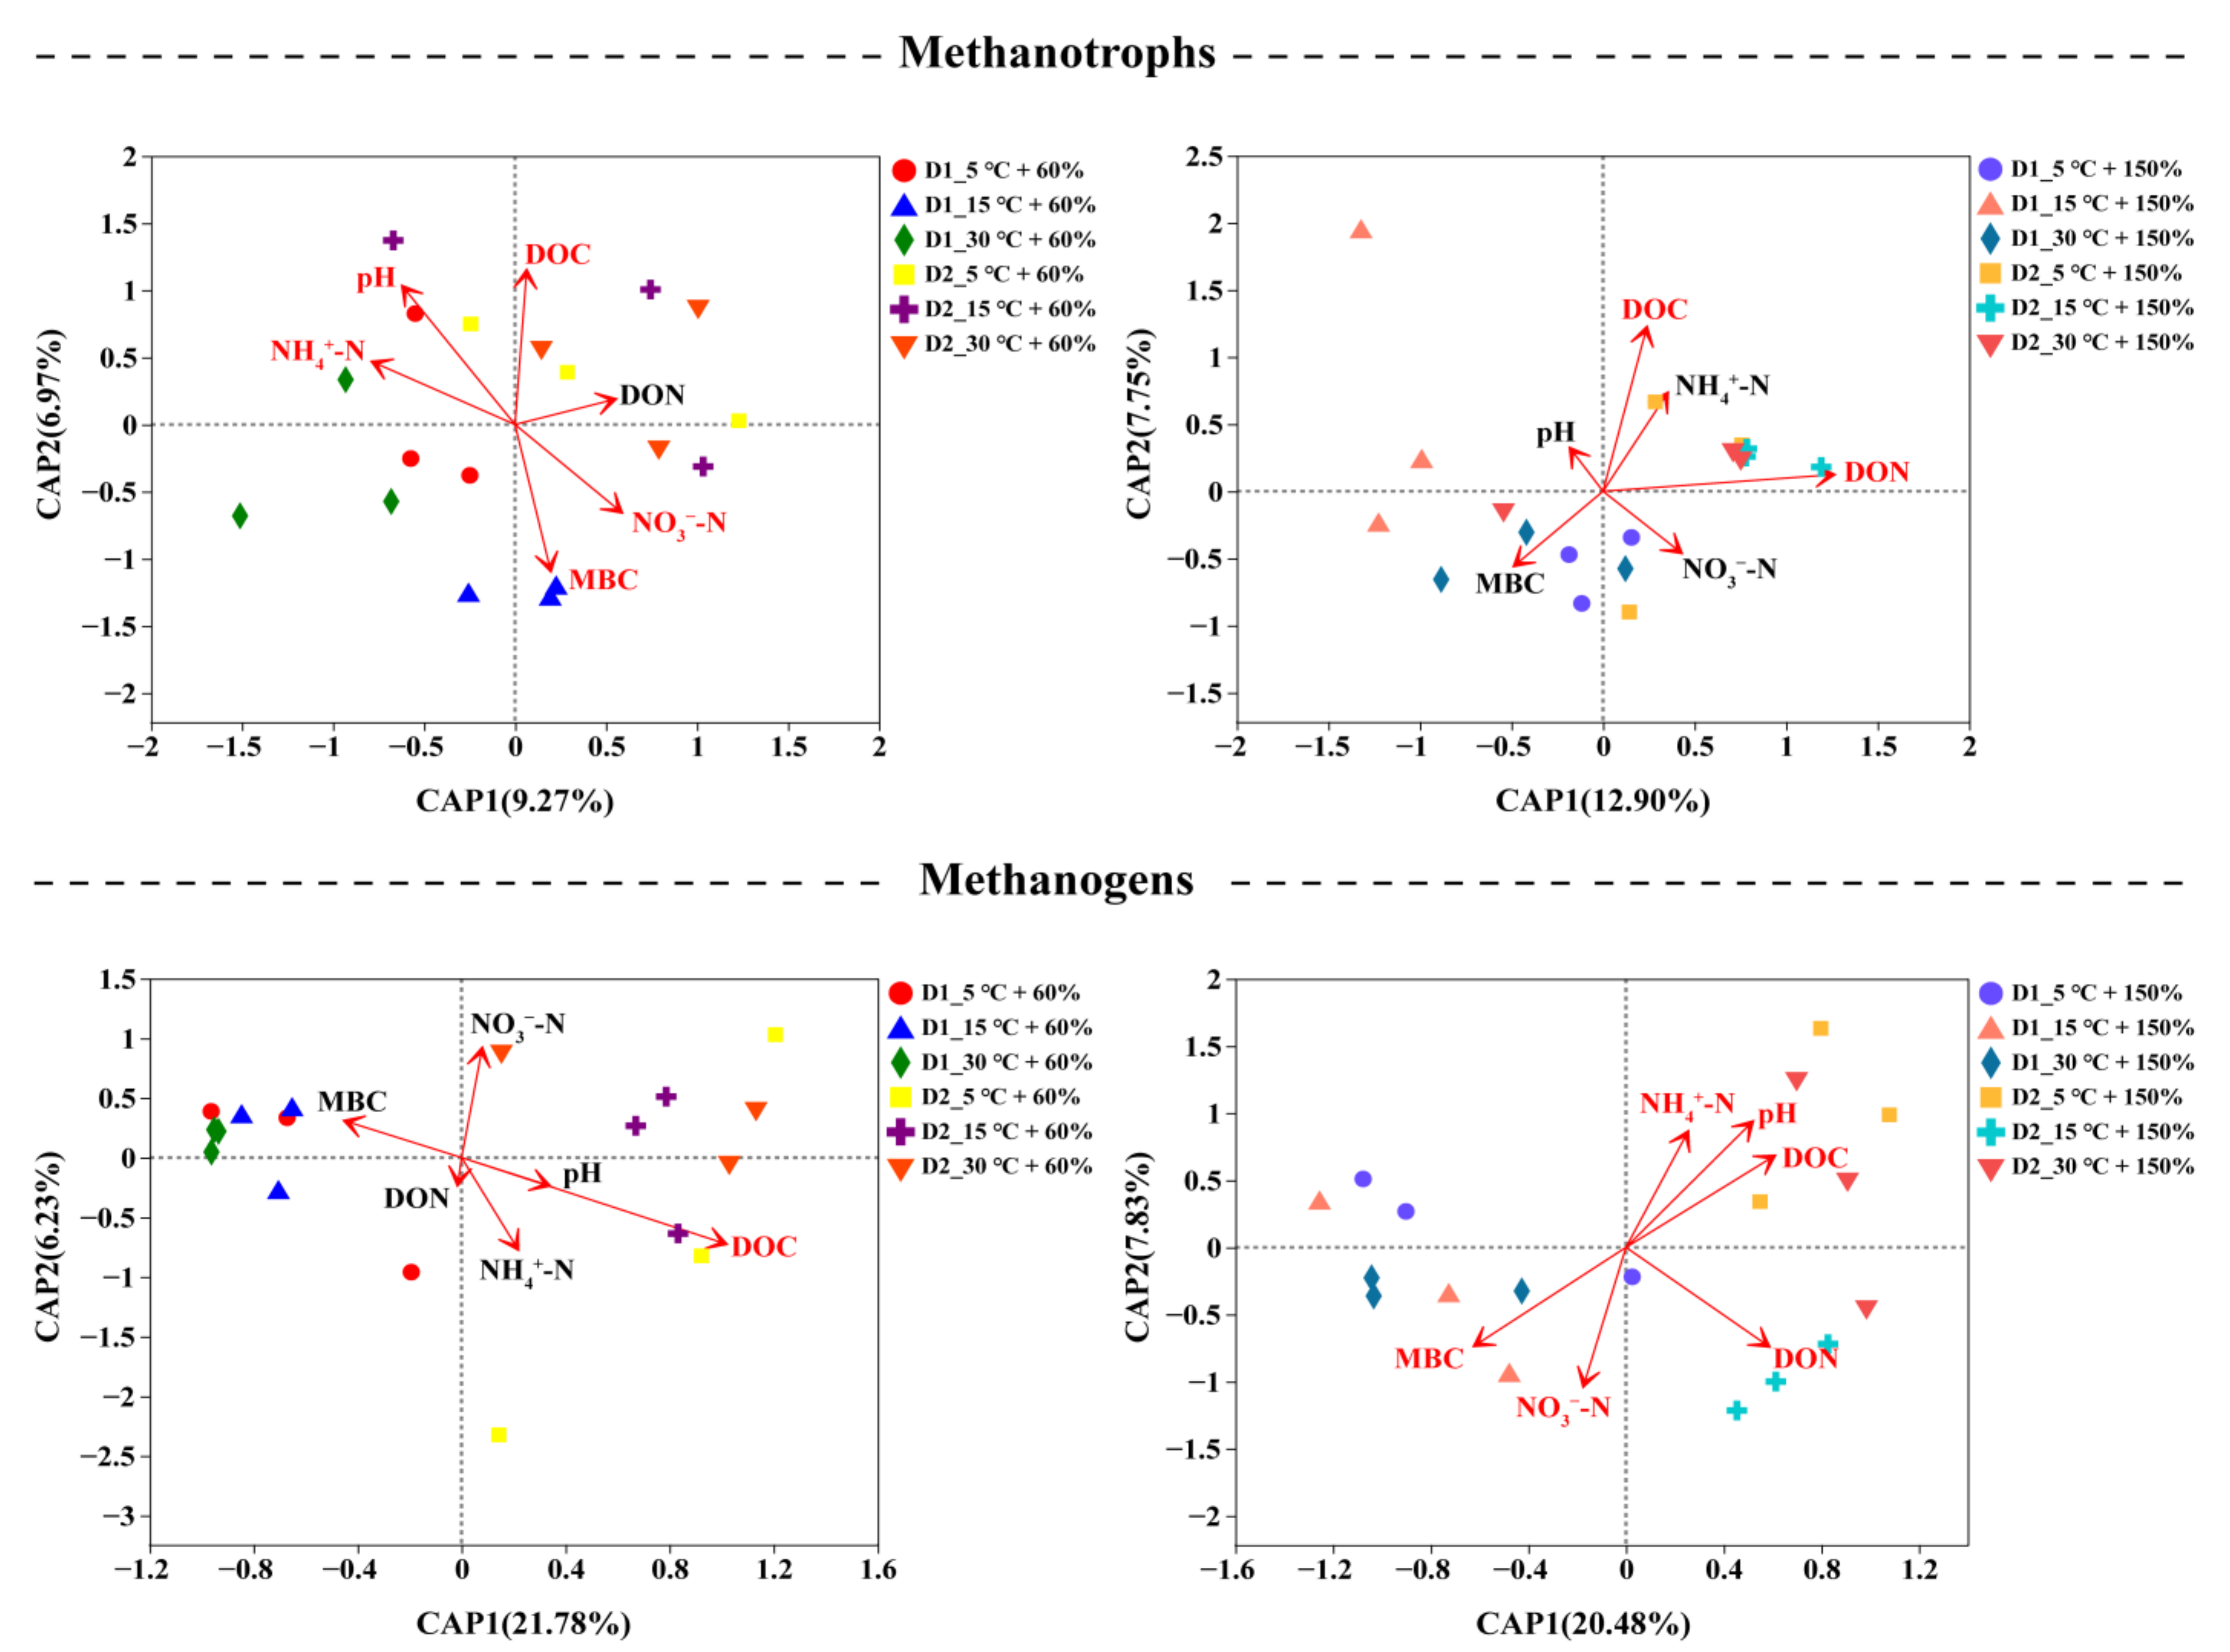
3.4. Correlation of Soil Chemical Properties and Microbial Community Composition

The analysis of db-RDA showed that soil MBC (p = 0.003) and NO3-N (p = 0.027) had a significant effect on methanotrophs community composition in surface soils under an incubation at 60% WFPS, while soil pH (p = 0.002), DOC (p = 0.004), and NH4+-N (p = 0.013) had a significant effect on methanotrophs community composition in subsurface soils (Figure 6). Soil DOC (p = 0.001) and DON (p = 0.01) had a significant effect on methanotrophs community composition in subsurface soils when incubated at 150% WFPS. Similarly, soil DOC (p = 0.009) had a significant effect on methanogens community composition in subsurface soils under an incubation at 60% WFPS. Furthermore, soil MBC (p = 0.011) and NO3-N (p = 0.001) had a significant effect on methanogens community composition in surface soils when incubated at 150% WFPS, while soil pH (p = 0.003), DOC (p = 0.016), DON (p = 0.001), and NH4+-N (p = 0.007) had a significant effect on methanogens community composition in subsurface soils.

4. Discussion

We recorded positive CH4 flux rates even in the relatively dry soils at initial field moisture (60% WFPS) (Figure 1), indicating that target forest soil is a potential atmospheric CH4 source. This could be attributed to the clay-loam texture of target forest soil. Generally, clay-loam soils physical structure promote formation of microsites within soil aggregates that protect strictly anaerobic methanogenic communities from damage by O2 even at low bulk soil moisture contents [41,42,43]. We also found that CH4 fluxes in soils incubated at 15 °C + 60% WFPS (initial field moisture) declined with duration of incubation and switched from emission to uptake (Figure 2). Our results are supported by the findings of Wu et al. [31] who reported that CH4 oxidation rates increase faster with rising temperature (from 5 to 15 °C) than CH4 emission rates. Similarly, an incubation study by Dunfield et al. [44] reported that an increase in CH4 production rates was negligible, but oxidation rates increased significantly at temperatures of 0–15 °C. This could be attributed to contrasting physiological characteristics of methanogens and methanotrophs relying on different temperature sensitivities and optimal temperature ranges [44,45]. Additionally, our results of Q10 of soil CH4 production rates (1.04–1.37) were relatively low (Table 1), particularly compared to 1.8 and 6.1 for anaerobic CH4 production from Panamanian peats [30], however, observed values were close to the 1.1–1.5 for CH4 production from Panamanian and Malaysian forests [30] and 1.2–1.3 for deep boreal forest soils [46].
Over the 2-week incubation, the cumulative CH4 fluxes showed an increase with increasing soil moisture and temperature (Figure 1). This finding is consistent with those of several studies that have identified a positive relationship between CH4 fluxes and soil moisture and temperature [47,48,49]. Dou et al. [50] suggested that high soil moisture and high soil temperature could stimulate CH4 efflux from soil to the atmosphere through the microbial process. One potential explanation is that higher WFPS may constrain and slow down the diffusion of CH4 and O2 into soils, thus halting the activity of high-affinity methanotrophs [51,52,53]. Another potential explanation is that high soil moisture content leads to anaerobic conditions, thus triggering the activity of methanogens and causing an increase in CH4 production rates [54,55]. Similarly, high temperature not only increase the activity of methanogens but also increase the activity of microbial communities that supply methanogenic substrates (hydrogen-producing bacteria or acetyl-producing bacteria), promoting the rates of CH4 production [25]. In this regard, a previous study suggested that seasonal CH4 fluxes could increase by 80–300% under both wetter and warmer soil climates [56].
We observed that a higher temperature enhanced the soil DOC and DON contents (Figure 3). These changes may occur because higher temperatures can enhance the decomposition rates, thereby promoting the release of organic carbon and nitrogen into the soil solution [57,58]. Rui et al. [59] reported that MBC was significantly higher at 10 °C than at 25 °C after 30 days of incubation and attributed this to a lower microbial metabolic activity at a lower temperature, preserving a higher MBC. This supports our observation about the decline of MBC content with temperature (Figure 3). Furthermore, we observed a positive effect of soil moisture percentage on soil pH and NO3-N and NH4+-N contents (Figure 3). This is consistent with the findings of Zarate-Valdez et al. [60] who examined the short-term effects of soil moisture on soil pH. Fu et al. [61] reported an increase in NO3-N and NH4+-N contents with initial soil moisture content. Furthermore, soil properties under different incubation affect methanotrophs and methanogens community composition. In particular, the methanotrophs community composition was mainly influenced by soil factors under a low moisture level (60% WFPS), but the methanogens community composition was affected under a high moisture level (150% WFPS) (Figure 6).
The hypothesis does not apply to all treatments, and was only supported partially by the results. The decreasing for relative abundance and diversity of methanotrophs with moisture increase occurred in subsurface soil and incubation samples at 5 °C in surface soil (Figure 4). Meanwhile, the methanotrophs population decreased but methanogens population increased with increasing moisture, in surface soil (Figure 5). These results are consistent with Kharitonov et al. [62] who attributed this phenomenon to the reduction in the size of aerobic zones. Increasing relative abundance of methanogens with temperature increase occurred in both depth soils when incubated at higher moisture (150% WFPS) (Figure 4). This is supported by several research works. Turetsky et al. [56] reported that soil warming treatments increased methanogen abundance in the surface-most peat layer (0–5 cm). Espenberg et al. [63] showed a strong positive correlation between abundance of mcrA and soil temperature at a soil depth of 0–20 cm. Field-based studies have also reported positive correlations between the abundance of methanogens and CH4 fluxes along hydrological gradients [64,65]. Similarly, Jones et al. [48] suggested a positive correlation between CH4 fluxes and temperature to increasing temperature-led metabolic rates.
Overall, the CH4 soil-atmosphere exchange rates are the result of rather complex interactions among soil physical, chemical, and biological processes. In general, soil nutrient availability play a pivotal role in shaping the belowground functions [66]. Specifically, substrate availability (mineral nitrogen and labile carbon), soil pH, and gas diffusivity are likely to directly or indirectly determine the CH4 fluxes by controlling the activity, abundance, and composition of the microbial communities, because this process was initially driven by environmental variables (mainly soil temperature and moisture) [28,67,68]. Studies such as ours contribute to the body of knowledge on biochemical processes of soil organisms, particularly those involved in methane dynamics.
Laboratory incubations provide the best and least biased basis for estimating the temperature and moisture dependence of greenhouse gases flux [21]. The two-factorial incubation design not only provides the opportunity for temperature and moisture effects to be assessed independently, but also enabled us to compare CH4 efflux potentials of different land-use types under similar climate conditions [21]. Nevertheless, it is worth noting that the in situ forest soil–atmosphere methane exchange could not be completely simulated through the laboratory incubation experiments due to the soil aggregate structural changes. Therefore, further studies need to focus on forest soils in situ methane dynamics with environmental change to achieve a more accurate methane budget for dealing with climate change. A further incubation experiment could be designed to test the role of soil aggregates on methanogens through sieving soils or disrupting the aggregates in the future. In addition, owing to the research scale of this method, most of these studies had been limited to one site, one region, or one specific ecosystem. Therefore, our result could be limited to apply for the long-term changes in CH4 exchanges from wide-ranging forest ecosystems. Further research is needed to explore effects of temperature and moisture on the microbial mechanisms to soil methane fluxes in the global scale for better modeling of the CH4 budget.

5. Conclusions

We simulated the combined impact of a shift in soil moisture and temperature due to short-term intense wet seasons on functional microbial communities in relation to methane fluxes in plantation soils. We found that adequate moisture and high temperature could stimulate the CH4 efflux from soils and may form a positive feedback loop for the climate system. Moisture and temperature are capable of impacting soil aeration and substrate availability, thereby governing CH4 flux rates by regulating microbial community composition and abundance. Our observations emphasized that methanogenesis occurs more widely than is currently realized. Consequently, CH4 efflux from soils should not be ignored, especially under field moisture conditions of upland forest soils. Such a change in the role of forest soils in global atmospheric methane dynamics could lead to drastic effects on global methane budgets.

Author Contributions

H.F. Writing-Original Draft, Methodology, and Formal Analysis; J.G. Methodology, Investigation, and Data Curation; S.M. Methodology, Writing–Review and Editing; M.H. and P.C. Investigation; J.S., X.X. (Xuan Xu) and X.X. (Xia Xu). Writing–Review and Editing; W.W. Conceptualization, Supervision, Writing–Review and Editing, and Funding Acquisition. All authors have read and agreed to the published version of the manuscript.

Funding

This work was supported by the National Natural Science Foundation of China [grant number 31700555 and 32071763], the Natural Science Foundation of Jiangsu Province [grant number BK20170927], and the Priority Academic Program Development of Jiangsu Higher Education Institution (PAPD), and the Jiangsu Government Scholarship for Overseas Studies (JS-2020-194).

Institutional Review Board Statement

Not applicable.

Informed Consent Statement

Not applicable.

Data Availability Statement

The data presented in this study are available on request from the corresponding author.

Conflicts of Interest

The authors declare no conflict of interest.

References

  1. Pan, Y.; Birdsey, R.A.; Fang, J.; Houghton, R.; Kauppi, P.E.; Kurz, W.A.; Phillips, O.L.; Shvidenko, A.; Lewis, S.L.; Canadell, J.G.; et al. A large and persistent carbon sink in the world’s forests. Science 2011, 333, 988–993. [Google Scholar] [CrossRef] [PubMed] [Green Version]
  2. Smith, K.; Dobbie, K.; Ball, B.; Bakken, L.; Sitaula, B.; Hansen, S.; Brumme, R.; Borken, W.; Christensen, S.; Priemé, A.; et al. Oxidation of atmospheric methane in Northern European soils, comparison with other ecosystems, and uncertainties in the global terrestrial sink. Glob. Chang. Biol. 2000, 6, 791–803. [Google Scholar] [CrossRef]
  3. Wang, Z.P.; Ineson, P. Methane oxidation in a temperate coniferous forest soil: Effects of inorganic N. Soil Biol. Biochem. 2003, 35, 427–433. [Google Scholar] [CrossRef]
  4. Aronson, E.L.; Helliker, B.R. Methane flux in non-wetland soils in response to nitrogen addition: A meta-analysis. Ecology 2010, 91, 3242–3251. [Google Scholar] [CrossRef]
  5. Chan, A.S.K.; Parkin, T.B. Methane oxidation and production activity in soils from natural and agricultural ecosystems. J. Environ. Qual. 2001, 30, 1896–1903. [Google Scholar] [CrossRef] [PubMed] [Green Version]
  6. Von Fischer, J.C.; Hedin, L.O. Separating methane production and consumption with a field-based isotope pool dilution technique. Glob. Biogeochem. Cycles 2002, 16, 8-1–8-13. [Google Scholar] [CrossRef]
  7. Shoemaker, J.K.; Keenan, T.F.; Hollinger, D.Y.; Richardson, A.D. Forest ecosystem changes from annual methane source to sink depending on late summer water balance. Geophys. Res. Lett. 2014, 41, 673–679. [Google Scholar] [CrossRef]
  8. Do Carmo, J.B.; Keller, M.; Dias, J.D.; de Camargo, P.B.; Crill, P. A source of methane from upland forests in the Brazilian Amazon. Geophys. Res. Lett. 2006, 33, L04809. [Google Scholar] [CrossRef] [Green Version]
  9. Megonigal, J.P.; Guenther, A.B. Methane emissions from upland forest soils and vegetation. Tree Physiol. 2008, 28, 491–498. [Google Scholar] [CrossRef] [Green Version]
  10. Martins, C.S.C.; Nazaries, L.; Delgado-Baquerizo, M.; Macdonald, C.A.; Anderson, I.C.; Hobbie, S.E.; Venterea, R.T.; Reich, P.B.; Singh, B.K. Identifying environmental drivers of greenhouse gas emissions under warming and reduced rainfall in boreal-temperate forests. Funct. Ecol. 2017, 31, 2356–2368. [Google Scholar] [CrossRef] [Green Version]
  11. Feng, H.; Guo, J.; Han, M.; Wang, W.; Peng, C.; Jin, J.; Song, X.; Yu, S. A review of the mechanisms and controlling factors of methane dynamics in forest ecosystems. For. Ecol. Manag. 2020, 455, 117702. [Google Scholar] [CrossRef]
  12. Piao, S.; Fang, J.; Ciais, P.; Peylin, P.; Huang, Y.; Sitch, S.; Wang, T. The carbon balance of terrestrial ecosystems in China. Nature 2009, 458, 1009–1013. [Google Scholar] [CrossRef] [PubMed]
  13. Chen, D.; Zhang, C.; Wu, J.; Zhou, L.; Lin, Y.; Fu, S. Subtropical plantations are large carbon sinks: Evidence from two monoculture plantations in South China. Agric. For. Meteorol. 2011, 151, 1214–1225. [Google Scholar] [CrossRef]
  14. Zhu, J.; He, N.; Wang, Q.; Yuan, G.; Wen, D.; Yu, G.; Jia, Y. The composition, spatial patterns, and influencing factors of atmospheric wet nitrogen deposition in Chinese terrestrial ecosystems. Sci. Total Environ. 2015, 511, 777–785. [Google Scholar] [CrossRef]
  15. Wu, Y.; Wang, Q.; Wang, H.; Wang, W.; Han, S. Shelterbelt poplar forests induced soil changes in deep soil profiles and climates contributed their inter-site variations in dryland regions, northeastern China. Front. Plant Sci. 2019, 10, 220. [Google Scholar] [CrossRef] [Green Version]
  16. Danilović, M.; Raković, D.; Isajev, D.; Antonić, S. Comparative analysis of the assortment structure of poplar clones I-214 and Pannonia. Glas. Sumar. Fak. 2020, 122, 31–46. [Google Scholar] [CrossRef]
  17. Yao, T.; Zhang, X.; Guan, H.; Zhou, H.; Hua, M.; Wang, X. Climatic and environmental controls on stable isotopes in atmospheric water vapor near the surface observed in Changsha, China. Atmos. Environ. 2018, 189, 252–263. [Google Scholar] [CrossRef] [Green Version]
  18. Smith, K.A.; Ball, T.; Conen, F.; Dobbie, K.E.; Massheder, J.; Rey, A. Exchange of greenhouse gases between soil and atmosphere: Interactions of soil physical factors and biological processes. Eur. J. Soil Sci. 2003, 54, 779–791. [Google Scholar] [CrossRef] [Green Version]
  19. Schindlbacher, A.; Zechmeister-Boltenstern, S.; Butterbach-Bahl, K. Effects of soil moisture and temperature on NO, NO2, and N2O emissions from European forest soils. J. Geophys. Res. Atmos. 2004, 109, D17. [Google Scholar] [CrossRef]
  20. Meixner, F.X. Biogenic emissions of nitric oxide and nitrous oxide from arid and semi-arid land. In Dryland Ecohydrology; Springer: Berlin/Heidelberg, Germany, 2006; pp. 233–255. [Google Scholar]
  21. Schaufler, G.; Kitzler, B.; Schindlbacher, A.; Skiba, U.; Sutton, M.A.; Zechmeister-Boltenstern, S. Greenhouse gas emissions from European soils under different land use: Effects of soil moisture and temperature. Eur. J. Soil Sci. 2010, 61, 683–696. [Google Scholar] [CrossRef]
  22. Bowden, R.D.; Newkirk, K.M.; Rullo, G.M. Carbon dioxide and methane fluxes by a forest soil under laboratory-controlled moisture and temperature conditions. Soil Biol. Biochem. 1998, 30, 1591–1597. [Google Scholar] [CrossRef] [Green Version]
  23. Whalen, S.; Reeburgh, W. Moisture and temperature sensitivity of CH4 oxidation in boreal soils. Soil Biol. Biochem. 1996, 28, 1271–1281. [Google Scholar] [CrossRef] [Green Version]
  24. Bian, R.; Chen, J.; Li, W.; Sun, Y.; Chai, X.; Wang, H.; Wang, Y.; Zhao, J. Numerical modeling of methane oxidation and emission from landfill cover soil coupling water-heat-gas transfer: Effects of meteorological factors. Process Saf. Environ. Prot. 2021, 146, 647–655. [Google Scholar] [CrossRef]
  25. Koh, H.-S.; Ochs, C.A.; Yu, K. Hydrologic gradient and vegetation controls on CH4 and CO2 fluxes in a spring-fed forested wetland. Hydrobiologia 2009, 630, 271–286. [Google Scholar] [CrossRef]
  26. Reddy, K.R.; Yargicoglu, E.N.; Yue, D.; Yaghoubi, P. Enhanced microbial methane oxidation in landfill cover soil amended with biochar. J. Geotech. Geoenviron. 2014, 140, 04014047. [Google Scholar] [CrossRef]
  27. Spokas, K.A.; Bogner, J.E. Limits and dynamics of methane oxidation in landfill cover soils. Waste Manag. 2011, 31, 823–832. [Google Scholar] [CrossRef] [PubMed]
  28. Kolb, S. The quest for atmospheric methane oxidizers in forest soils. Environ. Microbiol. Rep. 2009, 1, 336–346. [Google Scholar] [CrossRef] [PubMed]
  29. Malghani, S.; Reim, A.; von Fischer, J.; Conrad, R.; Kuebler, K.; Trumbore, S.E. Soil methanotroph abundance and community composition are not influenced by substrate availability in laboratory incubations. Soil Biol. Biochem. 2016, 101, 184–194. [Google Scholar] [CrossRef]
  30. Sjogersten, S.; Aplin, P.; Gauci, V.; Peacock, M.; Siegenthaler, A.; Turner, B.L. Temperature response of ex-situ greenhouse gas emissions from tropical peatlands: Interactions between forest type and peat moisture conditions. Geoderma 2018, 324, 47–55. [Google Scholar] [CrossRef]
  31. Wu, X.; Yao, Z.; Brüggemann, N.; Shen, Z.Y.; Wolf, B.; Dannenmann, M.; Zheng, X.; Butterbach-Bahl, K. Effects of soil moisture and temperature on CO2 and CH4 soil–atmosphere exchange of various land use/cover types in a semi-arid grassland in Inner Mongolia, China. Soil Biol. Biochem. 2010, 42, 773–787. [Google Scholar] [CrossRef]
  32. Zhang, Y.; Hou, W.; Chi, M.; Sun, Y.; An, J.; Yu, N.; Zou, H. Simulating the effects of soil temperature and soil moisture on CO2 and CH4 emissions in rice straw-enriched paddy soil. CATENA 2020, 194, 104677. [Google Scholar] [CrossRef]
  33. Vance, E.D.; Brookes, P.C.; Jenkinson, D.S. Microbial biomass measurements in forest soils: Determination of kC values and tests of hypotheses to explain the failure of the chloroform fumigation-incubation method in acid soils. Soil Biol. Biochem. 1987, 19, 689–696. [Google Scholar] [CrossRef]
  34. Feng, Y.; Lin, X.; Yu, Y.; Zhang, H.; Chu, H.; Zhu, J. Elevated ground-level O3 negatively influences paddy methanogenic archaeal community. Sci. Rep. 2013, 3, 3193. [Google Scholar] [CrossRef] [PubMed] [Green Version]
  35. Kolb, S.; Knief, C.; Stubner, S.; Conrad, R. Quantitative detection of methanotrophs in soil by novel pmoA-targeted real-time PCR assays. Appl. Environ. Microbiol. 2003, 69, 2423–2429. [Google Scholar] [CrossRef] [Green Version]
  36. Tao, S.; Li, L.; Li, L.; Liu, Y.; Ren, Q.; Shi, M.; Liu, J.; Jiang, J.; Ma, H.; Huang, Z.; et al. Understanding the gut-kidney axis among biopsy-proven diabetic nephropathy, type 2 diabetes mellitus and healthy controls: An analysis of the gut microbiota composition. Acta Diabetol. 2019, 56, 581–592. [Google Scholar] [CrossRef] [PubMed]
  37. Wu, B.; Hou, S.; Peng, D.; Wang, Y.; Wang, C.; Xu, F.; Xu, H. Response of soil micro-ecology to different levels of cadmium in alkaline soil. Ecotoxicol. Environ. Saf. 2018, 166, 116–122. [Google Scholar] [CrossRef] [PubMed]
  38. Feng, H.; Guo, J.; Wang, W.; Song, X.; Yu, S. Soil Depth Determines the Composition and Diversity of Bacterial and Archaeal Communities in a Poplar Plantation. Forests 2019, 10, 550. [Google Scholar] [CrossRef] [Green Version]
  39. Chao, A. Nonparametric estimation of the number of classes in a population. Scand. J. Stat. 1984, 11, 265–270. [Google Scholar]
  40. Shannon, C.E. A mathematical theory of communication. Bell Syst. Tech. J. 1948, 27, 379–423. [Google Scholar] [CrossRef] [Green Version]
  41. Fetzer, S.; Conrad, R. Effect of redox potential on methanogenesis by Methanosarcina barkeri. Arch. Microbiol. 1993, 160, 108–113. [Google Scholar] [CrossRef]
  42. Brioukhanov, A.; Netrusov, A.; Sordel, M.; Thauer, R.K.; Shima, S. Protection of Methanosarcina barkeri against oxidative stress: Identification and characterization of an iron superoxide dismutase. Arch. Microbiol. 2000, 174, 213–216. [Google Scholar] [CrossRef]
  43. von Arnold, K.; Nilsson, M.; Hanell, B.; Weslien, P.; Klemedtsson, L. Fluxes of CO2, CH4 and N2O from drained organic soils in deciduous forests. Soil Biol. Biochem. 2005, 37, 1059–1071. [Google Scholar] [CrossRef]
  44. Dunfield, P.; Dumont, R.; Moore, T.R. Methane production and consumption in temperate and subarctic peat soils: Response to temperature and pH. Soil Biol. Biochem. 1993, 25, 321–326. [Google Scholar] [CrossRef]
  45. Wu, X.L.; Chin, K.J.; Conrad, R. Effect of temperature stress on structure and function of the methanogenic archaeal community in a rice field soil. FEMS Microbiol. Ecol. 2002, 39, 211–218. [Google Scholar] [CrossRef] [PubMed]
  46. Bond-Lamberty, B.; Smith, A.P.; Bailey, V. Temperature and moisture effects on greenhouse gas emissions from deep active-layer boreal soils. Biogeosciences 2016, 13, 6669–6681. [Google Scholar] [CrossRef] [Green Version]
  47. Fang, S.; Lin, D.; Tian, Y.; Hong, S. Thinning intensity affects soil-atmosphere fluxes of greenhouse gases and soil nitrogen mineralization in a lowland poplar plantation. Forests 2016, 7, 141. [Google Scholar] [CrossRef] [Green Version]
  48. Jones, S.P.; Diem, T.; Quispe, L.P.H.; Cahuana, A.J.; Reay, D.S.; Meir, P.; Teh, Y.A. Drivers of atmospheric methane uptake by montane forest soils in the southern Peruvian Andes. Biogeosciences 2016, 13, 4151–4165. [Google Scholar] [CrossRef] [Green Version]
  49. Chen, Y.; Chen, G.; Ye, Y. Coastal vegetation invasion increases greenhouse gas emission from wetland soils but also increases soil carbon accumulation. Sci. Total Environ. 2015, 526, 19–28. [Google Scholar] [CrossRef]
  50. Dou, X.; Zhou, W.; Zhang, Q.; Cheng, X. Greenhouse gas (CO2, CH4, N2O) emissions from soils following afforestation in central China. Atmos. Environ. 2016, 126, 98–106. [Google Scholar] [CrossRef]
  51. Phillips, R.L.; Whalen, S.C.; Schlesinger, W.H. Influence of atmospheric CO2 enrichment on methane consumption in a temperate forest soil. Glob. Chang. Biol. 2001, 7, 557–563. [Google Scholar] [CrossRef]
  52. McLain, J.E.T.; Kepler, T.B.; Ahmann, D.M. Belowground factors mediating changes in methane consumption in a forest soil under elevated CO2. Glob. Biogeochem. Cycles 2002, 16, 23-1–23-14. [Google Scholar] [CrossRef]
  53. Warner, D.L.; Villarreal, S.; McWilliams, K.; Inamdar, S.; Vargas, R. Carbon dioxide and methane fluxes from tree Stems, coarse woody debris, and soils in an upland temperate forest. Ecosystems 2017, 20, 1205–1216. [Google Scholar] [CrossRef]
  54. McLain, J.E.T.; Ahmann, D.M. Increased moisture and methanogenesis contribute to reduced methane oxidation in elevated CO2 soils. Biol. Fertil. Soils 2008, 44, 623–631. [Google Scholar] [CrossRef]
  55. Sun, J.; Xia, Z.; He, T.; Dai, W.; Peng, B.; Liu, J.; Gao, D.; Jiang, P.; Han, S.; Bai, E. Ten years of elevated CO2 affects soil greenhouse gas fluxes in an open top chamber experiment. Plant Soil 2017, 420, 435–450. [Google Scholar] [CrossRef]
  56. Turetsky, M.R.; Treat, C.C.; Waldrop, M.P.; Waddington, J.M.; Harden, J.W.; McGuire, A.D. Short-term response of methane fluxes and methanogen activity to water table and soil warming manipulations in an Alaskan peatland. J. Geophys. Res. Biogeosci. 2008, 113, G00A10. [Google Scholar] [CrossRef] [Green Version]
  57. Rinnan, R.; Michelsen, A.; Jonasson, S. Effects of litter addition and warming on soil carbon, nutrient pools and microbial communities in a subarctic heath ecosystem. Appl. Soil Ecol. 2008, 39, 271–281. [Google Scholar] [CrossRef]
  58. Pedersen, E.P.; Elberling, B.; Michelsen, A. Seasonal variations in methane fluxes in response to summer warming and leaf litter addition in a subarctic heath ecosystem. J. Geophys. Res. Biogeosci. 2017, 122, 2137–2153. [Google Scholar] [CrossRef]
  59. Rui, Y.; Gleeson, D.B.; Murphy, D.V.; Hoyle, F.C. Response of microbial biomass and CO2-C loss to wetting patterns are temperature dependent in a semi-arid soil. Sci. Rep. 2017, 7, 13032. [Google Scholar] [CrossRef] [PubMed] [Green Version]
  60. Zarate-Valdez, J.L.; Zasoski, R.J.; Lauchli, A.E. Short-term effects of moisture content on soil solution pH and soil Eh. Soil Sci. 2006, 171, 423–431. [Google Scholar]
  61. Fu, Q.; Yan, J.; Li, H.; Li, T.; Hou, R.; Liu, D.; Ji, Y. Effects of biochar amendment on nitrogen mineralization in black soil with different moisture contents under freeze-thaw cycles. Geoderma 2019, 353, 459–467. [Google Scholar] [CrossRef]
  62. Kharitonov, S.; Semenov, M.; Sabrekov, A.; Kotsyurbenko, O.; Zhelezova, A.; Schegolkova, N. Microbial Communities in Methane Cycle: Modern Molecular Methods Gain Insights into Their Global Ecology. Environments 2021, 8, 16. [Google Scholar] [CrossRef]
  63. Espenberg, M.; Truu, M.; Truu, J.; Maddison, M.; Nolvak, H.; Jarveoja, J.; Mander, Ü. Impact of reed canary grass cultivation and mineral fertilisation on the microbial abundance and genetic potential for methane production in residual peat of an abandoned peat extraction area. PLoS ONE 2016, 11, e0163864. [Google Scholar] [CrossRef]
  64. Frey, B.; Niklaus, P.A.; Kremer, J.; Luescher, P.; Zimmermann, S. Heavy-machinery traffic impacts methane emissions as well as methanogen abundance and community structure in oxic forest soils. Appl. Environ. Microbiol. 2011, 77, 6060–6068. [Google Scholar] [CrossRef] [Green Version]
  65. Christiansen, J.R.; Levy-Booth, D.; Prescott, C.E.; Grayston, S.J. Microbial and environmental controls of methane fluxes along a soil moisture gradient in a Pacific coastal temperate rainforest. Ecosystems 2016, 19, 1255–1270. [Google Scholar] [CrossRef]
  66. Martins, C.S.C.; Macdonald, C.A.; Anderson, I.C.; Singh, B.K. Feedback responses of soil greenhouse gas emissions to climate change are modulated by soil characteristics in dryland ecosystems. Soil Biol. Biochem. 2016, 100, 21–32. [Google Scholar] [CrossRef]
  67. Dalal, R.C.; Allen, D.E. Greenhouse gas fluxes from natural ecosystems. Aust. J. Bot. 2008, 56, 369–407. [Google Scholar] [CrossRef]
  68. Luo, G.J.; Kiese, R.; Wolf, B.; Butterbach-Bahl, K. Effects of soil temperature and moisture on methane uptake and nitrous oxide emissions across three different ecosystem types. Biogeosciences 2013, 10, 3205–3219. [Google Scholar] [CrossRef] [Green Version]
Figure 1. Soil cumulative CH4 fluxes (ng g−1 14d−1) during a 2-week incubation period. The left and right figures show cumulative CH4 fluxes for the different incubation treatments comprising three temperatures (5, 15, and 30 °C) and two soil moisture states (60% and 150% WFPS) for two soil depths (D1: surface soil from 0–20 cm and D2: subsurface soil from 20–50 cm). Different lowercase letters indicate significant differences between treatments (p < 0.05). WFPS: water-filled pore space.
Forests 12 00407 g001
Figure 2. CH4 fluxes (ng g−1 d−1) of the different treatment samples during the incubation period. Positive values indicate CH4 emission, and negative values indicate CH4 uptake. The incubation treatments comprised of combinations of three temperatures (5, 15, and 30 °C) and two soil moisture states (60% and 150% WFPS) applied to soils from two depths (D1: surface soil from 0–20 cm and D2: subsurface soil from 20–50 cm). WFPS: water-filled pore space.
Forests 12 00407 g002
Figure 3. Chemical properties of soil samples after incubation at temperatures of 5, 15, and 30 °C in combination with soil moisture states of 60% and 150% water-filled pore space. The blue and pink bars represent the chemical properties of D1 (surface soil: 0–20 cm) and D2 (subsurface soil: 20–50 cm), respectively. Different lowercase letters indicate significant differences between treatments in each soil layer (p < 0.05). MBC: microbial biomass carbon; DOC: dissolved organic carbon; DON: dissolved organic nitrogen; NH4+-N: ammonium nitrogen; NO3-N: nitrate nitrogen.
Forests 12 00407 g003
Figure 4. Community abundance (Chao1) and diversity (Shannon) of methanotrophs (upper figures) and methanogens (lower figures) in soil samples after incubation at temperatures of 5, 15, and 30 °C in combination with soil moisture states of 60% and 150% water-filled pore space. Samples from two soil depths were incubated: D1 (0–20 cm) and D2 (20–50 cm). Different lowercase letters indicate significant differences between treatments (p < 0.05).
Forests 12 00407 g004
Figure 5. Species composition of methanotrophs (upper figures) and methanogens (lower figures) in soil samples after incubation at temperatures of 5, 15, and 30 °C in combination with soil moisture states of 60% and 150% water-filled pore space. Samples from two soil depths were incubated: D1 (0–20 cm) and D2 (20–50 cm). The core indicates the number of shared species (OTUs). The petals indicate the number of unique species (OTUs). The bar charts show the total species number for each treatment. OTU: operational taxonomic unit.
Forests 12 00407 g005
Figure 6. Distance-based redundancy analysis (db-RDA) of relationship between soil properties and methanotrophs (upper figures) and methanogens (lower figures) community composition. Samples from two soil depths: D1 (0–20 cm) and D2 (20–50 cm) were incubated at temperatures of 5, 15, and 30 °C in combination with soil moisture states of 60% and 150% water-filled pore space. Red arrows indicate soil properties, and arrow lengths represent the degree of correlation of soil properties on microbial community composition. The angle of the arrows represents the direction of correlation (acute angles: positive correlation; obtuse angles: negative correlation). Red font indicates a significant effect of soil chemical properties on microbial communities. MBC: microbial biomass carbon; DOC: dissolved organic carbon; DON: dissolved organic nitrogen; NH4+-N: ammonium nitrogen; NO3-N: nitrate nitrogen.
Forests 12 00407 g006
Table 1. CH4 efflux rates during a 2-week incubation period (ng g−1 d−1), means ± standard deviation (SD, n = 3), and Q10 values for two soil depths (D1: 0–20 cm; D2: 20–50 cm) in a poplar plantation. WFPS: water-filled pore space.
Depth
(cm)
WFPS
(%)
CH4 Efflux Rates ± SD
(ng g−1 d−1)
Q10
5 °C15 °C30 °C5–15 °C15–30 °C5–30 °C
D1601.27 ± 0.211.47 ± 0.101.95 ± 0.441.151.211.19
1501.48 ± 0.441.77 ± 0.302.18 ± 0.101.191.151.17
D2601.18 ± 0.331.62 ± 0.392.15 ± 0.601.371.211.27
1502.09 ± 0.302.22 ± 0.442.34 ± 0.581.061.041.05
Publisher’s Note: MDPI stays neutral with regard to jurisdictional claims in published maps and institutional affiliations.

