Abstract
SQUAMOSA promoter binding protein (SBP) is a kind of plant-specific transcription factor, which plays a crucial role in stress responses and plant growth and development by activating and inhibiting the transcription of multiple target genes. In this study, a total of 30 SBP genes were identified from Populus trichocarpa genome and randomly distributed on 16 chromosomes in poplar. According to phylogenetic analysis, the PtSBPs can be divided into six categories, and 14 out of the genes belong to VI. Furthermore, the SBP genes in VI were proved to have a targeting relationship with miR156. The homeopathic element analysis showed that the promoters of poplar SBP genes mainly contain the elements involved in growth and development, abiotic stress and hormone response. In addition, there existed 10 gene segment duplication events in the SBP gene duplication analysis. Furthermore, there were four poplar and Arabidopsis orthologous gene pairs among the poplar SBP members. What is more, poplar SBP gene family has diverse gene expression pattern under salt stress. As many as nine SBP members were responding to high salt stress and six members possibly participated in growth development and abiotic stress. Yeast two-hybrid experiments indicated that PtSBPs can form heterodimers to interact in the transcriptional regulatory networks. The genome-wide analysis of poplar SBP family will contribute to function characterization of SBP genes in woody plants.
1. Introduction
Transcription factors (TFs) are sequence-specific DNA binding proteins that can activate or inhibit the transcription of multiple target genes at RNA level [1] and play a crucial role in various regulatory networks of stress responses and plant growth and development [2]. SQUAMOSA promoter binding protein (SBP) family is one of the important TF families involved in stress responses and plant growth and development. The SBP genes were firstly discovered in snapdragon [3], and then they were isolated and identified from many other plant species. The family has a highly conserved SBP domain consisting of 74 amino acid residues approximately, which includes two zinc finger structures and a specific nuclear localization signal structure NLS [4]. In particular, SBP TF is a kind of conserved miRNA targeting plant transcription factors, and it can especially interact with the members of miR156/157 family [5].
SBP genes are mainly involved in plant growth and development processes such as flower formation, leaf development, plant fertility, fruit maturity, developmental stage transition, as well as stress responses including hormone response, photoperiod, copper homeostasis, biological and abiotic stress responses [6]. There were 17 SBP genes in Arabidopsis. Among them, AtSPL3 was highly expressed in the leaves, flower primordia and inflorescence apical meristems [7]. AtSPL7 was a regulator of copper homeostasis and can bind to GTAC core element associated with copper reactions [8]. AtSPL8 played a positive role in the GA-mediated anther development [9]. The BpSPL1 from Betula platyphylla can bind to the promoter region of BpMADS5, which is a homology of FRUITFULL from Arabidopsis and regulates flowering [10]. In citrus, CclSBP7 acts as an activator of flowers and participates in flowering process [11]. There were a total of 19 SBP genes in rice, most of which were mainly expressed in young panicle [12]. OsSPL16 regulated the shape, size and quality of rice grain [13], and OsSPL14 regulated the rice branches during nutritional stage through interacting with miR156 [14]. VpSBP5 showed resistance to Erysiphenecator by activating SA induction system and MeJA-induced wound signals [15]. It was reported that miR156 improved drought resistance of alfalfa by silencing SPL13, indicating SPL13 played a negative role in abiotic stress responses [16]. In pineapple, SBP family genes were proved to respond to abiotic stresses such as cold, heat, salt and drought [17]. Some yeast two-hybrid studies have already confirmed that there were interactions between SBP homologous genes in Arabidopsis thaliana, Betula luminifera and Nicotiana benthamiana, which can form heterodimers [18,19,20].
Poplar is an important economic and shelterbelt construction species with the advantages of rapid growth, excellent material, strong adaptability and is widely distributed in northern China [21]. It is also a model plant used for biological and genetic research in woody plants [22]. Salinization is one of the main abiotic stresses that affect the growth and development of poplars. SBP genes play an important role in stress responses and plant growth and development. Previous studies were mainly focused on poplar SBP TFs involved in anthocyanins, cold resistance and copper homeostasis [23,24,25]; few studies have been conducted on the poplar SBP family genes associated with stress response. In this study, a total of 30 poplar SBP TFs were identified and analyzed on their physical and chemical properties, phylogeny, gene structure, promoter cis-acting element, chromosome distribution, gene duplication and the relationship with targeted miRNA. Based on the transcriptome analysis of Populus simonii × Populus nigra under salt stress, we also profiled the gene expression pattern of SBP family genes in the leaves, roots and stems to identify potential PtSBPs induced by salt stress. In addition, yeast two-hybrid assay indicated that the SBP TFs which were highly expressed in the Populus simonii × Populus nigra leaves could form heterodimers. The study lays the foundation for biological function of SBP family genes in poplar.
2. Materials and Methods
2.1. Identification of SBP Genes
A total of 30 SBP TFs were drawn from PlantTFDB database (http://planttfdb.gao-lab.org/) (accessed on 28 September 2020) [26]. The protein sequences of the 30 SBP members were searched from Phytozome (https://phytozome.jgi.doe.gov/pz/portal.html) (accessed on 28 September 2020) [27]. The SBP domains of the genes were detected by Pfam tools (https://pfam.xfam.org/search/sequence) (accessed on 28 September 2020) [28], and multiple sequence alignment and visualization were carried out by Web Logo and DNAMAN software (version 8.0) [29]. The sequence length, molecular weight (MW), isoelectric point (PI), instability index, fat index and grand average of hydropathicity (GRAVY) of PtSBP proteins were analyzed by ExPASy (https://web.expasy.org/protparam/) (accessed on 28 September 2020) [30], and the subcellular localization of SBP protein was predicted by Wolf PSORT [31].
2.2. Phylogenetic Evolution and Gene Structure Analysis
We downloaded the sequences of SBP family genes of Populus trichocarpa, Arabidopsis and rice from PlantTFDB database (http://planttfdb.gao-lab.org/) (accessed on 28 September 2020). To explore the evolutionary relationship of the SBP family members among the three species, a rootless phylogenetic tree were constructed by ML maximum likelihood method in MEGA7.0, with 1000 Bootstrap repeated sampling, corrected by Poisson. JTT + G + I model, ITOL v.3 (https://itol.embl.de/) (accessed on 28 September 2020) was used to view and annotate the phylogenetic tree [32,33]. MEME program (http://meme-suite.org/tools/meme) (accessed on 28 September 2020) was used to identify the motifs in the promoter region of SBP genes, and the maximum number of motifs was 10 [34]. We determined UTR, domain and CDS region of poplar SBP genes using TBtools software [27].
2.3. Chromosome Location and Gene Duplication Analysis
The chromosome location of PtSBPs were determined by using TBtools software [27,35]. Combined with multiple collinearity scanning tool (MCScanX(https://academic.oup.com/nar/article/40/7/e49/1202057)) (accessed on 28 September 2020) and BLASTP, the segmental replication of PtSBPs and the collinearity of genes across species were analyzed [35,36]. The Ka/Ks substitution rate of homologous gene pairs of PtSBPs was also calculated by TBtools [35]. The statistically significant Ka/Ks substitution rate that were below, equal to or higher than 1.0 indicated purification selection, neutral selection or positive selection, respectively.
2.4. Promoter and miRNA Analysis
The PlantCARE database (http://bioinformatics.psb.ugent.be/webtools/plantcare/html/) (accessed on 28 September 2020) was used to analyze the cis-acting elements in the 2000 bp upstream promoter regions of PtSBPs [37]. Furthermore, the function of the SBP genes was speculated by the elements related to growth and development, hormone response, stress response and others. Complementarity and target-site accessibility are two important factors in the miRNA target recognition mechanism [38]. The potential target miRNAs of PtSBPs were predicted by psRNA target server (http://plantgrn.noble.org/psRNATarget) (accessed on 28 September 2020), based on default parameters [39]. In addition, the relationship between PtSBPs and miRNAs was analyzed and visualized by Cytoscape v3.3 (http://www.cytoscape.org/) (accessed on 28 September 2020) [31].
2.5. Plant Materials
The plant materials used for gene clone, di-haploid Populus simonii × Populus nigra, was from the experimental forests of Northeast Forestry University (China). The growing twigs of Populus simonii × Populus nigra were hydroponic cultured in 26 °C/22 °C, 16/8-h light/dark cycles and 70% relative humidity [21]. A total of 30 seedlings with new roots and leaves were transplanted into soil for 2 months and were divided randomly into 10 groups. The leaves at the fourth and fifth layer, barks and pulp cores in the middle stem segments were harvested and stored in liquid nitrogen for gene expression pattern analysis by RNA-Seq. Meanwhile, 30 seedlings with new roots and leaves were treated with 150 mM NaCl for 24 h with another 30 seedlings cultured in water as control. The roots, stems and leaves with three biological repeats were harvested from the above seedlings. Plant samples were stored in liquid nitrogen for gene expression analysis under salt stress by RNA-Seq. The roots and leaves with three biological repeats were harvested from a total of 48 seedlings under water and salt stress conditions at 0, 12, 24 and 36 h, respectively, for spatiotemporal expression analysis by RNA-Seq.
2.6. Gene Expression Analysis by RNA-Seq
Plant samples were sent to GENEWIZ company (https://www.genewiz.com/) (accessed on 28 September 2020) for RNA-Seq using Illumina Hi-seq 2000 technology. The construction of RNA library and data processing referred to our previous research [40]. Differentially expressed genes (DEGs) were identified by DESeq in R softwarewith the differentially significant standards including FC (Fold Change) ≥ 2 and Padj ≥ 0.05 [41]. The venn diagram of PtSBPs was drawn by venny 2.1.0 (https://bioinfogp.cnb.csic.es/tools/venny/index.html) (accessed on 28 September 2020). The gene expression pattern of SBP genes in poplar was visualized with HEML 1.0.3.7.
2.7. Verification of Real-Time Quantitative PCR
In order to test the certainty of RNA-Seq results of PtSBPs under salt stress, as many as 9 nonredundant SBP genes were selected for RT-qPCR [42]. The primer sequences of the SBP genes and Actin as internal reference gene were listed in Table S1. The relative expression level of the SBP genes was calculated by the 2−ΔΔCt method, ΔΔCt = (Cttreat − Ctcontrol)2 − (Cttreat − Ctcontrol)1 [43].
2.8. Yeast Two-Hybrid Test
Total RNA from poplar leaves was extracted by MiniBEST Plant RNA Extraction Kit (Takara, Dalian) and then was reverse transcribed into cDNA by PrimeScript™ RT reagent Kit (Takara, Dalian). The primers [27,37] of PtSBP2, PtSBP8, PtSBP13 and PtSBP23 were designed according to their transcript sequences (Tables S2 and S3). The transcript fragments were obtained by PCR (TaKaRa Ex Taq) and aligned by BLASTn (http://blast.ncbi.nlm.nih.gov/Blast.cgi) (accessed on 28 September 2020). The ORF sequences of the genes were combined to pGBKT7 and pGADT7 vectors by double enzyme digestion, respectively. Positive clones were confirmed by PCR and DNA sequencing.
In order to identify the interaction among the poplar SBP genes, we conducted yeast two-hybrid experiment. pGBKT7-PtSBP2, pGBKT7-PtSBP8, pGBKT7-PtSBP13 and pGBKT7-PtSBP23 were transferred into Y2H Gold yeast strain and coated on SD/-Trp and SD/-Trp/-His/X-α-Gal for self-activation verification. According to the self-activation results, we designed four combinations of PtSBPs, which were as follows: (pGBKT7-PtSBP2/pGADT7-PtSBP8; pGBKT7-PtSBP23/pGADT7-PtSBP8; pGBKT7-PtSBP2/pGADT7-PtSBP13; pGBKT7-PtSBP23/pGADT7-PtSBP13). Then, the combined vectors were cotransferred into Y2H strain, setting pGBKT7-Lam/pGADT7-T as negative control and pGBKT7-53/pGADT7-T as positive control. The cotransferred Y2H strains were screened on SD/Trp/-Leu solid medium, and the positive strains were verified on SD/-Trp/-Leu/-His/-Ade/X-α-gal/ABA (200 ng/mL) solid medium.
3. Results
3.1. Identification and Sequence Alignment of PtSBPs
The sequence information of the 30 candidate PtSBPs were obtained from Phytozome (https://phytozome.jgi.doe.gov/pz/portal.html) (accessed on 28 September 2020) and named as PtSBP1-30 according to their chromosome distribution (Table 1). All the genes had SBP domains according to domain analysis in Pfam. Through comparing the protein sequences by DNAMAN, we found that the conserved domains of all PtSBPs contained 74 amino acid residues, two zinc finger structures (Zn-1, Zn-2) and a highly conservative NLS (Figure 1). The protein length of PtSBPs was 69-1073aa, the molecular weight was 8.35157–119.09139 kDa, the fat index was 36.89–84.11, the isoelectric point was 5.87–10.62 and the unstable index of protein was 35.42–91.51. According to the hydrophilic index, all poplar SBP proteins belonged to hydrophilic proteins, among which PtSBP10 was the strongest (−1.316) and PtSBP16 protein was the weakest (−0.298). In addition, the subcellular localization of PtSBP proteins were predicted by Wolf PSORT. The results showed that the protein signals of PtSBP2, PtSBP5, PtSBP9, PtSBP15, PtSBP16, PtSBP25, PtSBP28 and PtSBP29 existed in both nucleus and cytoplasm, and the others 22 protein signals only existed in nucleus.

Table 1.
Analysis of PtSBP sequences.
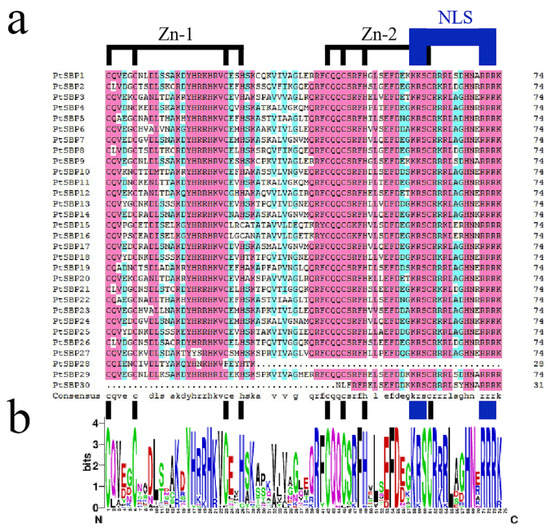
Figure 1.
Alignment of SBP domains in poplar SBP gene. (a) Multiple alignment of PtSBP protein domain obtained by means of DNAMAN software (version 8.0), which pointed out two conserved zinc finger structures (Zn-1, Zn-2) and nuclear localization signal (NLS). (b) WebLogo is used to display the sequence markers of the poplar SBP domain. The total height of each column of letters indicates the degree of conservation of each position, and the height of each letter indicates the relative evaluation rate of the corresponding amino acid.
3.2. Phylogeny and Gene Structure Analysis
In order to explore the evolutionary relationship of poplar SBP family, we constructed a rootless phylogenetic tree containing 30 SBP genes from Populus trichocarpa, 17 from Arabidopsis and 19 from rice (Figure 2, Table S4). The result showed that the 66 SBP proteins were clustered into six groups, which was consistent with the classification of SBP family from Arabidopsis thaliana, Capsicum annuum L. and Salvia miltiorrhiza [1,44,45]. Except for group II, each group contained at least one SBP from the three species. Subgroup IV was the largest with 20 genes, of which had 7 SBP genes from poplar and subgroup I was the smallest with 4 genes, of which had 2 SBP genes from poplar.
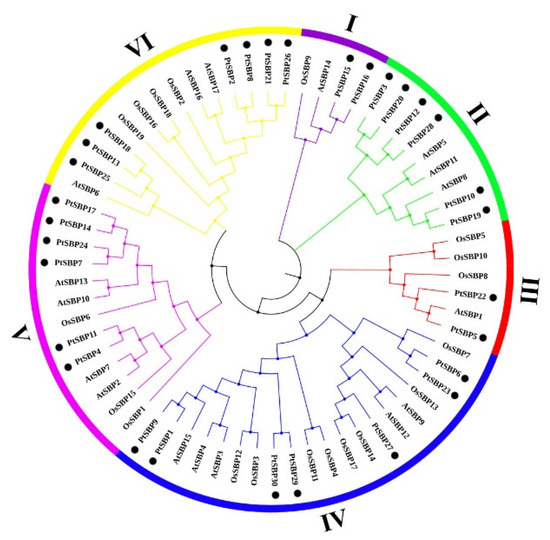
Figure 2.
Phylogenetic tree of SBP genes in poplar, Arabidopsis and rice. The rootless phylogenetic trees of poplar, Arabidopsis and rice SBP protein sequences were drawn using the ML maximum likelihood method in MEGA7.0. The gene numbers of 66 SBP genes are listed in Table S4. The phylogenetic tree is divided into six groups: I, II, III, IV, V and VI, regards each color as a group, and poplar SBP genes are marked with ●.
In order to compare the diversity of gene structure, the UTR, CDS, domin and intron regions of the PtSBP genes were characterized (Figure 3). As we expected, the genes in the same group had similar gene structure. In group V, PtSBP11, PtSBP14, PtSBP17 and PtSBP24 all contained nine introns, and PtSBP2, PtSBP8, PtSBP13, PtSBP18, PtSBP25 and PtSBP26 in group VI all contained two introns. It was also found that most genes contained multiple introns, only PtSBP28 and PtSBP30 had no introns. The CDS and domin of the genes in the same subfamily were also similar. The CDS length of four members in group I and group III was very similar. Interestingly, among the 30 PtSBPs, only PtSBP7, PtSBP14, PtSBP17 and PtSBP24 contained both SBP and Ank_2 domains, which belonged to subgroup V. Motif analysis showed that motif 1–10 were widely distributed in PtSBP genes, and motif 1, motif 2 and motif 4 were shared by the genes from each group, except PtSBP28 and PtSBP30 (Figure 3). There were ten motifs in PtSBP7, PtSBP14, PtSBP17 and PtSBP24. In particular, motif 9 and motif 10 were unique to them, indicating that these four proteins may have specific functions [46].
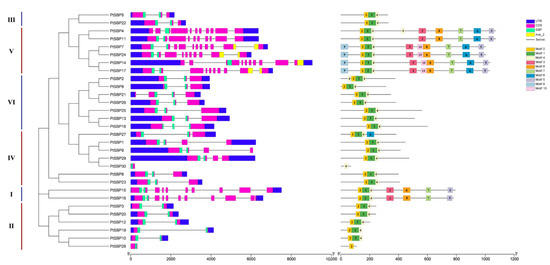
Figure 3.
Phylogenetic tree, gene structure and conservative motif analysis of PtSBP. Phylogenetic trees were constructed based on 30 PtSBP proteins, which were divided into 5 groups. In the analysis of gene structure, blue represents UTR, pink represents CDS, green represents SBP region, yellow represents Ank_2 region, and “-” represents intron. The conservative motif of SBP gene is predicted by MEME method, and the numbers (1–10) in the colored rectangles indicate motif 1–10, and the length of the rectangle indicates the size of the motif.
3.3. Chromosome Location and Gene Duplication Events
Based on Populus trichocarpa genome, the 30 SBP genes were located on 16 chromosomes (Figure 4A). These genes were unevenly distributed on Populus trichocarpa chromosomes, with chromosome 2 having the largest number, 4 SBP genes, while chromosome 6, 9 and 13 have no SBP gene. There were three SBP genes on the Chr1 in tomato [47], which was consistent with our study. Chromosome 8, 10 and 14 also contained three SBP genes, chromosome 3, 11, and 15 contained two, and other chromosomes only contained one.
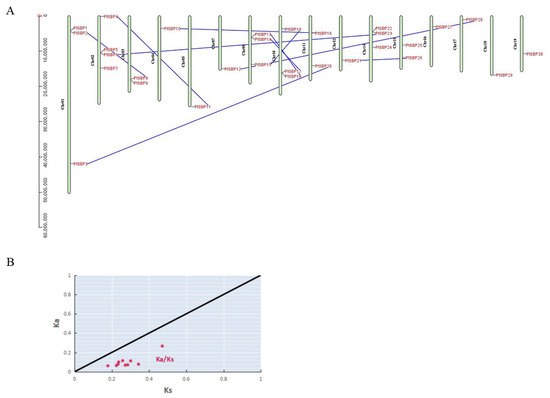
Figure 4.
(A) Analysis of gene segmental duplication. The distribution of 30 SBP genes on poplar chromosomes, with segmental duplication relationships represented by blue lines. (B) Nonsynonymous (Ka) and synonymous (Ks) ratio analysis of gene replication driving force. The x-axis represents Ks, the y-axis represents Ka, the black line represents Ka/Ks = 1, and the red dot represents the Ka/Ks replacement rate of 10 segmental repetitive events.
The expansion of gene families in any species is mainly accomplished by periodic replication events [48]. In this study, we used MCScan and TBtools to search micro fragments and compare their binding relationship, furtherly to accurately locate repetitive gene pairs to clarify the differentiation and expansion process of poplar SBP family genes. Genome-wide gene replication surveys revealed ten pairs of duplicated SBP genes in Populus (Figure 4A, Table S5). In order to determine the driving force of SBP gene replications in poplar, we calculated the nonsynonymous (Ka) and synonymous (Ks) ratios of the ten pairs of duplicate genes (Figure 4B, Table 2). The value is considered to be an authoritative boundary value for determining gene purification selection or neutral selection [49]. According to the Ka/Ks value, the ten pairs of genes experienced different evolutionary rate and selection pressures, indicating that poplar SBP family experienced strong purification selection to reduce harmful mutations after repetition.
Table 2.
Ka, Ks and Ka/Ks ratio for paralogous PtSBP genes.
As Arabidopsis is a popular model plant, the functions of several Arabidopsis SBP genes have been characterized maturely [50]. In the study, the collinear relationship of SBP genes between Arabidopsis and poplar was analyzed and further applicated to identify and infer their function of the homologous PtSBP genes. There were four SBP orthologous gene pairs between poplar and Arabidopsis identified, such as PtSBP3-AtSBP11, PtSBP13-AtSBP6, PtSBP24-AtSBP10 and PtSBP27-AtSBP12 (Figure 5, Table S6), indicating these conserved homologous genes developed from the differentiation of common ancestors and may share important functions among species.
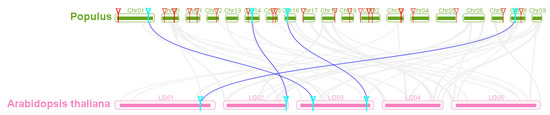
Figure 5.
Homology analysis of poplar and Arabidopsis SBP genes. The gray line represents the collinear block of poplar and Arabidopsis genomes, the blue line represents the SBP orthologous pair, the red triangle represents the poplar SBP gene and the blue triangle represents the orthologous gene of two species.
3.4. Cis-Acting Element and Target miRNA Analysis
Cis-acting elements play an important role in gene transcriptional regulation during plant development and in the response to stress [51]. The promoter cis-acting elements of PtSBPs were identified through PlantCARE. Except the basic cis-acting elements (such as TATA-box and CAAT-box), a large number of cis-acting elements were found in the promoters PtSBPs (Figure 6, Table 3). The element function can be divided into three categories: growth and development, abiotic stress and hormone response. Most SBP promoters contained the elements involved in gibberellin and light response. The elements that regulate endosperm and tissue development were located in the promoters of PtSBP11-13, PtSBP15-16, PtSBP18 and PtSBP30. The elements associated with abiotic stresses such as drought, low temperature and anaerobic mainly existed in the promoters of PtSBP12-15 and PtSBP27-28. And hormones such as jasmonic acid, salicylic acid and abscisic acid related elements mainly existed in the promoters of PtSBP11-14. These results indicated that poplar SBP family genes may respond to environmental changes and participate in important physiological and developmental processes through circadian rhythm and hormone regulation.
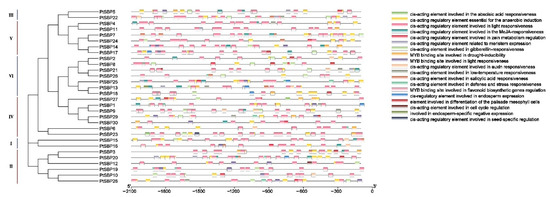
Figure 6.
Cis-acting element analysis of the PtSBP promoter. Analysis of cis-acting elements of the poplar SBP gene promoter. The upstream 2000 bp sequences of 30 SBP genes were intercepted for analysis, and the rectangles with different colors represented cis-acting elements with different functions.
Table 3.
Cis-acting regulatory element in promoter of PtSBP genes.
MicroRNA (miRNA) is a small noncoding single-stranded RNA molecule, which participates in the gene regulation at post-transcriptional stage in plants [52] and plays an important role in growth and development and stress responses. By querying miRNA database, we predicted 4 miRNAs (miR156, miR164, miR167 and miR7826) targeting 14 PtSBPs (Figure 7). Among them, miR156 is the most abundant and involved in plant evolution, which inhibits the expression of SBP transcription factors in Arabidopsis [53]. In this study, miR156 was predicted to have targeted relationship with 14 PtSBPs. Studies have shown that miR164, miR167 and miR7826 indirectly regulate plant tissue development [54,55,56]. In this study, the target gene of miR164 was predicted as PtSBP24, the target gene of miR167 was predicted as PtSBP16 and the target genes of miR7826 was predicted as PtSBP22 and PtSBP26.
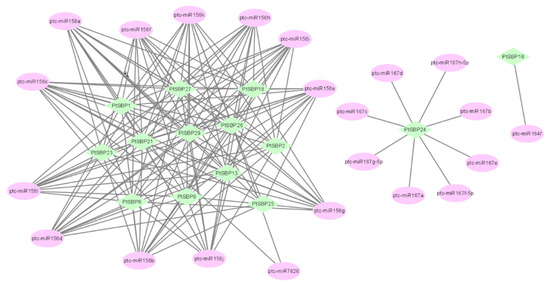
Figure 7.
Analysis of the targeting relationship between PtSBP and miRNA. The green icon represents PtSBP, and the pink icon represents the poplar miRNA.
3.5. Gene Expression Analysis of PtSBPs in Different Tissues
In order to profile expression pattern of PtSBPs in different tissues, we compared the transcriptomes of three paired tissues: root-stem, leaf-root and leaf-stem (Sheet 1). The SBP genes had different expression patterns in the three tissues, such as 6 DEGs being identified between root and stem, 9 between leaf and root and 10 between leaf and stem. There were 6 shared genes in leaf-root and leaf-stem combinations (Figure 8A(a), Table S7), indicating the 6 genes were differentially expressed in the leaves. Similarly, there were 3 shared genes in the root-leaf and root-stem combinations (Figure 8A(b), Table S7) and 3 shared genes in the stem-leaf and stem-root combinations (Figure 8A(c), Table S7). We also compared three tissue pairs and found 3 shared genes (PtSBP8, PtSBP20 and PtSBP23), which means that the 3 genes had differential expression patterns in the three tissues (Figure 8A(d), Table S7).
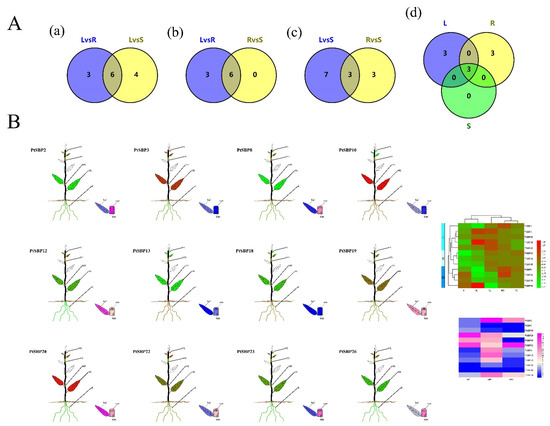
Figure 8.
(A) Veen diagram for tissue specific analysis of PtSBP. The figure (a–d) show the number of DEGS in different tissues and the shared genes. R: Root, S: Stem, L: leaf. (B) The expression of different PtSBP in different tissues. R: Root, MS: Mature stems, YS: Young Stems, YL: Young Leaves, ML: Mature Leaves. The expression level is visualized by TBtools. Red and pink represent high expression levels, and green and blue represent low.
We drew a heatmap of 12 DEGs by combination of the microarray data in popgenie (http://popgenie.org/eximage?eplant=enable) (accessed on 28 September 2020) and the RNA-Seq data in our study (Figure 8B, Table S8, Sheet 2). Based on gene clustering in the heatmap, these genes were divided into three categories: a, b and c. The genes in class a were mainly expressed in the leaves, followed by the roots and stems; class b genes were highly expressed in the leaves, moderately in the stems and lowly in the roots; class c genes were mostly expressed in the roots, moderately in the stems and least in the leaves. PtSBP3 and PtSBP10 had the highest expression in the leaves, while PtSBP3 had the lowest expression in the leaves. The expression of PtSBP19 and PtSBP26 was the lowest in the roots, and the PtSBP18 was relatively highly expressed in the roots. The expression of the shared genes PtSBP8 and PtSBP23 was low in the roots and leaves, but high in the stems, while the expression of PtSBP20 in the leaves was higher than that in the roots and stems, which was consistent with the VENN analysis.
3.6. Gene Expression Analysis of PtSBPs in Different Tissues under Salt Stress
In order to explore the expression pattern of the SBP genes under salt stress, the transcript level of the SBP genes in the roots, leaves and stems of poplar under 150 mM salt for 24 h were profiled by RNA-Seq. The results showed that a total of 5 SBP genes were induced in the roots by salt stimulation, 4 of the genes were upregulated (PtSBP4, PtSBP16, PtSBP22 and PtSBP29), and one of the genes was downregulated (PtSBP8). Similarly, as many as 4 genes responded to salt stimulation in the leaves, 3 of the genes were downregulated (PtSBP10, PtSBP12 and PtSBP20), only PtSBP13 was upregulated. There were an upregulated gene PtSBP13 and a downregulated gene PtSBP22 in the stems, which were upregulated and downregulated by 1.1–6.6 times and 1.3–3.2 times, respectively (Sheet 3–4). VEEN diagram showed that most of the SBP genes were differentially expressed in the different tissues under salt stress. There were 4 and 3 genes responding to salt stimulation in the roots and leaves, respectively. Interestingly, a jointly gene was upregulated both in the stems and leaves in response to salt stress (Figure 9A).
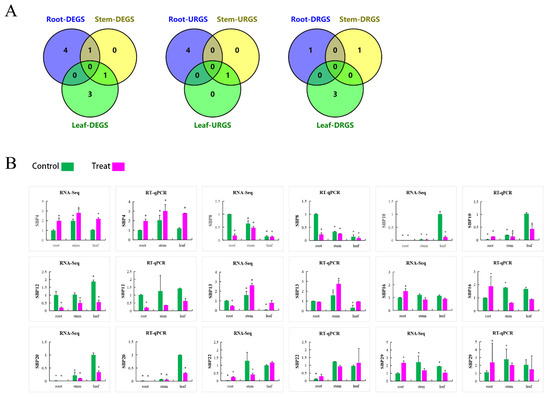
Figure 9.
(A) Veendiagram of the DEGS expression analysis in tissues under high salt stress. The figure shows the number of DEGS under salt stress, the DEGS of upregulated, the DEGS of downregulated and the DEGS of shared in different tissues. (B) The expression pattern of PtSBP in different tissues under high salt stress were analyzed based on RNA-Seq and RT-qPCR. Green means control and pink means salt treatment. The relative expression level of each gene was calculated according to the corresponding gene expression level in root and leaf without treatment. Error bars represent the standard deviation of biological reproduction. “*” indicates a significant difference (p < 0.05).
In order to verify the spatiotemporal expression patterns of PtSBPs under salt stress, the expressions of 9 SBP genes that significantly responded to salt stress were analyzed at 0 h, 12 h, 24 h and 36 h under 150 mM NaCl condition (Figure 10, Sheet 5). Almost each gene was able to respond to salt stress in the different tissues throughout the time, but their expression patterns were different. With salt treatment, the expression of PtSBP13 in the leaves increased continuously in 0–24 h, reached the peak at 24 h and decreased in 24–36 h. By contrast, the expression of PtSBP8 decreased continuously in 0–24 h, decreased to the valley at 24 h and then increased in 24–36 h. PtSBP10, PtSBP22 and PtSBP29 showed a decreasing trend with stress treatment. The expression levels of PtSBP4 and PtSBP16 fluctuated during the stress process, but it showed an upward trend overall. On the contrary, the expression of PtSBP12 and PtSBP20 showed a downward trend overall. In the roots with salt treatment, the expression patterns of PtSBP10, PtSBP13, PtSBP20 and PtSBP22 reached a peak at 12 h; while the expression level of PtSBP29 dropped to a trough at 24 h; and the expression level of PtSBP12 showed a downward trend. Similar to the expression patterns in the leaves, PtSBP4 and PtSBP16 fluctuated during the stress process, but it showed an upward trend overall, while the expression level of PtSBP8 showed a downward trend overall.
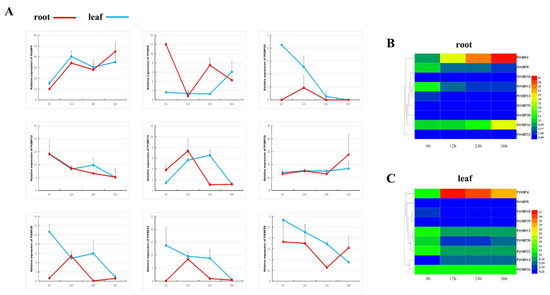
Figure 10.
(A) shows the broken line diagram of gene expression at 0 h, 12 h, 24 h and 36 h, which regards the red and blue as the expression of root and stem. Figure (B,C) are heat maps of gene expression at different time points, which regards the red and blue as the expression of high and low.
To further verify the identified SBP genes in salt stress response by RNA-Seq, the relative expression levels of the 9 SBP genes under salt stress at 24 h were analyzed by RT-qPCR. The trends of the RT-qPCR results were similar to the RNA-Seq analysis (Figure 9B). In the roots, PtSBP4, PtSBP16 and PtSBP29 were upregulated by 2 times, whereas PtSBP8 and PtSBP12 were downregulated by 4 times. In the stems, PtSBP12, PtSBP16 and PtSBP22 were downregulated by 2–3 times. In the leaves, PtSBP10, PtSBP12 and PtSBP20 were downregulated by more than 2 times, while PtSBP4 and PtSBP13 were upregulated by more than 2 times.
3.7. PtSBP Protein Interaction Analysis
For exploring whether heterodimer can be formed among the PtSBP proteins, we selected 4 DEGs whose expression levels in the leaves were higher than those in the stems for yeast two-hybrid analysis. As shown in Figure 11A, pGBKT7-PtSBP2 and pGBKT7-PtSBP23 can grow normally on SD/-Trp solid medium, but they cannot grow on SD/-Trp/His/X-α-gal solid medium. PGBKT7-PtSBP8 and pGBKT7-PtSBP13 could grow on the two solid mediums and turned blue on SD/-Trp/-His/X-α-Gal, which indicated that PtSBP8 and PtSBP13 had self-activating activity, but PtSBP2 and PtSBP23 had no the activity. The yeast two-hybrid results (Figure 11) indicated that the four cotransformation combinations pGBKT7-PtSBP2/pGBKT7-PtSBP8; pGBKT7-PtSBP23/pGADT7-PtSBP8; pGBKT7-PtSBP2/pGADT7-PtSBP13; pGBKT7-PtSBP23/pGADT7-PtSBP13 can all grow on the SD/Trp/-Leu and SD/-Trp/-Leu/-His/-Ade/X-α-gal/ABA (200 ng/mL) medium and turned blue on the solid medium of SD/-Trp/-Leu/-His/-Ade/X-α-gal/ABA (200 ng/mL). The results indicated the PtSBP proteins could form heterodimer and interact with each other in the transcriptional regulatory network.
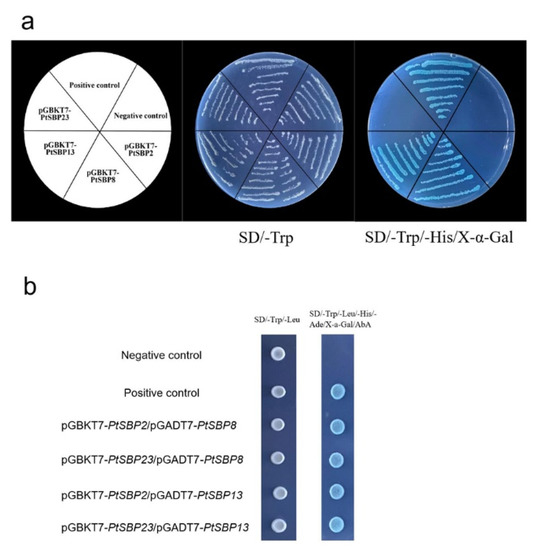
Figure 11.
Self-activation activity analysis and yeast two-hybrid experiment. (a) Self-activation test of PtSBP2, PtSBP8, PtSBP13 and PtSBP23, setting pGBKT7as negative contrast and pGBKT7-53/pGADT7-T as positive contrast. (b) Interaction experiment of PtSBP protein of yeast two-hybrid, setting pGBKT7Lam/pGADT7-T as negative contrast and pGBKT7-53/pGADT7-T as positive contrast.
4. Discussion
SQUAMOSA, as a large plant-specific TF, contains a highly conserved SBP domain, which plays an important role in plant development, signal transduction and defense regulation [3,8,9,57]. The SBP gene was originally found in the snapdragon [3], and then they were identified and characterized in more species. For example, 17 and 19 SBP genes were identified from Arabidopsis and rice, respectively. Furthermore, the tissue specificity of each gene was predicted by analyzing EST data and their phylogeny [1]. Fifteen SBP members were identified in pepper, and most members were predicted to mediate SA and MeJA pathways through RT-qPCR analysis [44]. Previous studies on SBP genes have revealed their role in growth and development, especially in hormone induction and copper homeostasis [23,25]. Poplar is a model species for plant biology study [22]. However, the study on poplar SBP genes is unknown in salt response. In this study, we identified a total of 30 PtSBP genes from 16 chromosomes of Populus trichocarpa, analyzed their general information, and profiled their expression patterns in the different tissues under salt stress, providing the foundation for biological function of poplar SBP family genes in stress response.
Phylogenetic analysis has an important guiding significance for gene family diversity and gene function. In this study, all the SBP genes from Populus trichocarpa, Arabidopsis and rice were divided into six groups according to phylogenetic relationship, similar to the previous studies of the SBP genes from Arabidopsis thaliana, Capsicum annuum L. and Salvia miltiorrhiza, each group contained at least one PtSBP, AtSBP and OsSBP (Figure 2, Table S4). In the same group, most PtSBPs shared similar gene structure, CDS length, motif distribution, etc. It indicated that the evolution and structural variation of the PtSBPs were closely related to their gene structure diversity (Figure 3), as described in the previous studies on tomatoes and apples [6,58]. Interestingly, PtSBP7, PtSBP14, PtSBP17 and PtSBP24 in group V contain both SBP and Ank_2 regions, and they have two more distinct motives than other proteins, probably the Ank_2 region consists of the two motives. Whether the four proteins have specific functions needs further exploration.
Each plant family is originated from a common ancestor and has evolved many times to expand. Due to the similarities between PtSBP, AtSBP and OsSBP, the function of some PtSBP can be predicted based on known AtSBP and OsSBP. AT2G33810 (II) is highly expressed in leaf, flower primordium and apical meristem of inflorescence [7]; AT5G18830 (I) is considered to be a central regulator of copper homeostasis, which regulates the expression of copper-responsive genes [8]; AT1G02065 (II) can promote the development of pollen sacs [9]; LOC_OS08G39890 (IV) is regulated by miR156 and can promote the branch of rice vegetative period [14]; LOC_OS08G41940 (VI) can regulate the shape, size and quality of rice grains [13]. Therefore, the PtSBPs in the corresponding group may have similar functions with above SBP genes.
MiRNA is an important regulator in plant growth and development, more than half of the target genes of miRNA are TFs, such as MYB, SBP, HD-ZIP and AP2 [59,60]. In the study, some PtSBPs were identified to have a targeting relationship with miR156, miR164, miR167 and miR7826 (Figure 7). Among them, 14 PtSBP genes may be targeted with miR156, which is one of the largest miRNA in the evolution. The plants overexpressing miR156 will display more collaterals, more leaves, faster growth and delayed flowering [12]. High-throughput sequencing and miRNA sequencing showed that miR156 can function under drought, salt, cold and heat stress [61,62,63]. Interestingly, these 14 SBP genes were concentrated in the group IV and group VI, so they may have similar functions. MiR164 targeted with PtSBP24 can encode plant sulfur genes, regulate the root length [55] and also affect the tissue specificity of rice genes [64]; it can also improve the resistance to dahlias verticillium wilt in cotton [65]. MiR167 targeted with PtSBP16 can promote anther growth and cracking [56]. MiR7826 targeted with PtSBP22 and PtSBP26 contributes to the synthesis of fatty acids in peony seeds [54]. Therefore, it is critical to study how specific miRNAs regulate PtSBP genes in the future study. These findings will deepen our understanding on the regulation mechanism of miRNA and its target SBP genes.
Gene duplication is the driving force for reproduction of new genes and expansion of genic family, which provides the original genetic resources for natural selection and organisms adaption under different complex environments. Poplar has experienced at least three genome-wide replications, followed by multiple segmental replication events [37,66]. In this study, we identified ten segmental replication events, involving 20 SBP genes distributed on 13 chromosomes (Figure 4A, Table S5). We also calculated Ka/Ks substitution rate of gene duplication pairs (Figure 4B, Table 2). All Ka/Ks values were far less than 1.0, indicating that poplar SBP gene family had experienced strong purification selection, which removed harmful mutations to maintain function possibly. Therefore, the biological function of PtSBPs can be inferred by comparing with orthologous genes from Arabidopsis. There were four SBP homologous pairs found, including PtSBP3-AtSBP11, PtSBP13-AtSBP6, PtSBP24-AtSBP10 and PtSBP27-AtSBP12 (Figure 5, Table S6). AtSBP11 (AT3G15270.1) was involved in regulating flowering, development and other nutritional changes [67]. AtSBP6 (AT1G69170.1) mediated resistance to Pseudomonas syringa [68]. AtSBP10 (AT1G20980.1) was associated with the resistant to the mycotoxin fumonisin induced by PCD [57]. And AtSBP12 (AT2G47070.1) responded to abiotic stress in reproductive stage [69]. Thus, the biological functions of a few PtSBP genes can be predicted by lineal homologous relationship with AtSBP genes.
Recent studies have shown that SBP TFs play an important role in regulating plant development and abiotic stress responses. Through gene expression analysis in the different tissues, we identified 13 (43%) differentially expressed SBP genes. Among them, PtSBP8, PtSBP20 and PtSBP23 were shared genes differentially expressed in any two tissues (Figure 8A(d), Table S7), with significant influence on development. A total of 9 (30%) SBP genes were found to be response to salt stress, 5 in the roots, 2 in the stems and 7 in the leaves. Most of them were differentially expressed only in the one tissue. In particular, PtSBP13 was upregulated both in the stems and leaves (Figure 9). The spatiotemporal expression analysis of the 9 SBP genes indicated that almost every gene can respond to high salt stress in the different tissues at each time point, but their expression patterns were different (Figure 10). It was worth noting that PtSBP8, PtSBP10, PtSBP12, PtSBP13, PtSBP20 and PtSBP22 were not only significantly respond to salt stress but also differentially expressed in the different tissues. In addition, the promoters of the PtSBP genes contained gibberellin and light-responsive elements. Furthermore, the promoters of PtSBP12 and PtSBP13 contained the elements that regulate endosperm and tissue development and respond to drought, low temperature, anaerobic stress, jasmonic acid, salicylic acid and abscisic acid. Interestingly, both PtSBP8 and PtSBP13 have a targeting relationship with miR156.
Previous yeast two-hybrid assays showed that there were interactions between SBP homologous genes in Arabidopsis thaliana, Betula platyphylla and Nicotiana tabacum L. [18,19,20]. In our study, yeast two-hybrid results indicated that PtSBP2, PtSBP8, PtSBP13 and PtSBP23 formed four heterologous dimers, indicating that PtSBP protein can form heterodimers to interact in the transcriptional regulation network.
5. Conclusions
In this study, we focused on the physicochemical properties, conservative domains, phylogeny, gene structure, cis-acting elements, chromosome distribution and gene duplication of a total of 30 SBP genes from poplar. All the 30 genes had SBP domains, and the conserved domains of all PtSBPs contained 74 amino acid residues, two zinc finger structures and a highly conservative NLS. All PtSBPs belonged to hydrophilic proteins and 22 of them were predicted to be located in the nucleus. All SBPs from poplar can be clustered into six groups, based on the phylogenetic tree constructed by the SBPs from poplar, Arabidopsis and rice. Furthermore, the genes in the same group had similar gene structure. The 30 PtSBPs were located on 16 chromosomes, and there were 10 pairs of duplicated SBP genes found in Populus trichocarpa genome. A large number of cis-acting elements involved in growth and development, abiotic stress and hormone response were found in the promoters of PtSBPs. In addition, as many as 14 PtSBP genes had targeted relationship with miR156. Among the 30 members, 6 genes (PtSBP8, PtSBP10, PtSBP12, PtSBP13, PtSBP20 and PtSBP22) were not only differentially expressed in the different tissues of poplar but also were highly induced by salt stress. In addition, a few PtSBP proteins (PtSBP2, PtSBP8, PtSBP13 and PtSBP23) were proved to form heterodimers to interact in the transcriptional regulatory network. Based on the above results, PtSBP8 and PtSBP13 may play an important role in salt response. This study provides a valuable reference for biological function of SBP genes in poplar.
Supplementary Materials
The following are available online at https://www.mdpi.com/article/10.3390/f12040413/s1, Table S1: Primer sequences for RT-qPCR, Table S2: Primer sequences for gene cloning, Table S3: Primer sequences for vector construction, Table S4, Table S5, Table S6, Table S7: DEGs in different poplar tissues, Table S8, sheet1, sheet2, sheet3, sheet4, sheet5.
Author Contributions
Conceptualization, Data curation, K.Z. and Z.C.; Funding acquisition, T.J.; Software, L.L.; Supervision, B.Z. and T.J.; Writing—original draft, Q.G.; Writing—review and editing, Q.G. and W.Y. All authors have read and agreed to the published version of the manuscript.
Funding
This research was funded by the Fundamental Research Funds for the Central Universities (2572018CL03), the Applied technology research and Development Program of Heilongjiang Province (GA20B401) and the 111 Project (B16010). The funding bodies were not involved in the study design, data collection, analysis, or preparation of the manuscript.
Data Availability Statement
All datasets presented in this study are included in the article/Supplementary Materials.
Conflicts of Interest
The authors declare no conflict of interest.
References
- Yang, Z.; Wang, X.; Gu, S.; Hu, Z.; Xu, H.; Xu, C. Comparative study of SBP-box gene family in Arabidopsis and rice. Gene 2008, 407, 1–11. [Google Scholar] [CrossRef] [PubMed]
- Gong, W.; Shen, Y.P.; Ma, L.G.; Pan, Y.; Du, Y.L.; Wang, D.H.; Yang, J.Y.; Hu, L.D.; Liu, X.F.; Dong, C.X.; et al. Genome-wide ORFeome cloning and analysis of Arabidopsis transcription factor genes. Plant. Physiol. 2004, 135, 773–782. [Google Scholar] [CrossRef] [PubMed]
- Klein, J.; Saedler, H.; Huijser, P. A new family of DNA binding proteins includes putative transcriptional regulators of the Antirrhinum majus floral meristem identity gene SQUAMOSA. Mol. Gen. Genet. MGG 1996, 250, 7–16. [Google Scholar] [CrossRef] [PubMed]
- Birkenbihl, R.P.; Jach, G.; Saedler, H.; Huijser, P. Functional dissection of the plant-specific SBP-domain: Overlap of the DNA-binding and nuclear localization domains. J. Mol. Biol. 2005, 352, 585–596. [Google Scholar] [CrossRef]
- Lakhotia, N.; Joshi, G.; Bhardwaj, A.R.; Katiyar-Agarwal, S.; Agarwal, M.; Jagannath, A.; Goel, S.; Kumar, A. Identification and characterization of miRNAome in root, stem, leaf and tuber developmental stages of potato (Solanum tuberosum L.) by high-throughput sequencing. BMC Plant. Biol. 2014, 14, 16. [Google Scholar] [CrossRef]
- Li, J.; Hou, H.; Li, X.; Xiang, J.; Yin, X.; Gao, H.; Zheng, Y.; Bassett, C.L.; Wang, X. Genome-wide identification and analysis of the SBP-box family genes in apple (Malus × domestica Borkh.). Plant. Physiol. Biochem. PPB 2013, 70, 100–114. [Google Scholar] [CrossRef]
- Cardon, G.H.; Höhmann, S.; Nettesheim, K.; Saedler, H.; Huijser, P. Functional analysis of the Arabidopsis thaliana SBP-box gene SPL3: A novel gene involved in the floral transition. Plant. J. Cell Mol. Biol. 1997, 12, 367–377. [Google Scholar] [CrossRef]
- Yamasaki, H.; Hayashi, M.; Fukazawa, M.; Kobayashi, Y.; Shikanai, T. SQUAMOSA Promoter Binding Protein-Like7 Is a Central Regulator for Copper Homeostasis in Arabidopsis. Plant. Cell 2009, 21, 347–361. [Google Scholar] [CrossRef]
- Unte, U.S.; Sorensen, A.M.; Pesaresi, P.; Gandikota, M.; Leister, D.; Saedler, H.; Huijser, P. SPL8, an SBP-box gene that affects pollen sac development in Arabidopsis. Plant. Cell 2003, 15, 1009–1019. [Google Scholar] [CrossRef]
- Lännenpää, M.; Jänönen, I.; Hölttä-Vuori, M.; Gardemeister, M.; Porali, I.; Sopanen, T. A new SBP-box gene BpSPL1 in silver birch (Betula pendula). Physiol. Plant. 2004, 120, 491–500. [Google Scholar] [CrossRef]
- Zeng, R.F.; Zhou, J.J.; Liu, S.R.; Gan, Z.M.; Zhang, J.Z.; Hu, C.G. Genome-Wide Identification and Characterization of SQUAMOSA-Promoter-Binding Protein (SBP) Genes Involved in the Flowering Development of Citrus Clementina. Biomolecules 2019, 9, 66. [Google Scholar] [CrossRef]
- Xie, K.; Wu, C.; Xiong, L. Genomic organization, differential expression, and interaction of SQUAMOSA promoter-binding-like transcription factors and microRNA156 in rice. Plant. Physiol. 2006, 142, 280–293. [Google Scholar] [CrossRef]
- Wang, S.; Wu, K.; Yuan, Q.; Liu, X.; Liu, Z.; Lin, X.; Zeng, R.; Zhu, H.; Dong, G.; Qian, Q.; et al. Control of grain size, shape and quality by OsSPL16 in rice. Nat. Genet. 2012, 44, 950–954. [Google Scholar] [CrossRef] [PubMed]
- Jiao, Y.; Wang, Y.; Xue, D.; Wang, J.; Yan, M.; Liu, G.; Dong, G.; Zeng, D.; Lu, Z.; Zhu, X.; et al. Regulation of OsSPL14 by OsmiR156 defines ideal plant architecture in rice. Nat. Genet. 2010, 42, 541–544. [Google Scholar] [CrossRef] [PubMed]
- Hou, H.; Li, J.; Gao, M.; Singer, S.D.; Wang, H.; Mao, L.; Fei, Z.; Wang, X. Genomic organization, phylogenetic comparison and differential expression of the SBP-box family genes in grape. PLoS ONE 2013, 8, e59358. [Google Scholar] [CrossRef] [PubMed]
- Arshad, M.; Feyissa, B.A.; Amyot, L.; Aung, B.; Hannoufa, A. MicroRNA156 improves drought stress tolerance in alfalfa (Medicago sativa) by silencing SPL13. Plant. Sci. Int. J. Exp. Plant. Biol. 2017, 258, 122–136. [Google Scholar] [CrossRef] [PubMed]
- Ali, H.; Liu, Y.; Azam, S.M.; Rahman, Z.U.; Priyadarshani, S.; Li, W.; Huang, X.; Hu, B.; Xiong, J.; Ali, U.; et al. Genomic Survey, Characterization, and Expression Profile Analysis of the SBP Genes in Pineapple (Ananas comosus L.). Int. J. Genom. 2017, 2017, 1032846. [Google Scholar] [CrossRef]
- Agalou, A.; Spaink, H.P.; Roussis, A. Novel interaction of selenium-binding protein with glyceraldehyde-3-phosphate dehydrogenase and fructose-bisphosphate aldolase of Arabidopsis thaliana. Funct. Plant. Biol. FPB 2006, 33, 847–856. [Google Scholar] [CrossRef] [PubMed]
- Kessens, R.; Sorensen, N.; Kabbage, M. An inhibitor of apoptosis (SfIAP) interacts with SQUAMOSA promoter-binding protein (SBP) transcription factors that exhibit pro-cell death characteristics. Plant. Direct 2018, 2, e00081. [Google Scholar] [CrossRef]
- Li, X.Y.; Lin, E.P.; Huang, H.H.; Niu, M.Y.; Tong, Z.K.; Zhang, J.H. Molecular Characterization of Squamosa Promoter Binding PROTEIN-LIKE (SPL) Gene Family in Betula luminifera. Front. Plant. Sci. 2018, 9, 608. [Google Scholar] [CrossRef]
- Yao, W.; Zhou, B.; Zhang, X.; Zhao, K.; Cheng, Z.; Jiang, T. Transcriptome analysis of transcription factor genes under multiple abiotic stresses in Populus simonii × P. nigra. Gene 2019, 707, 189–197. [Google Scholar] [CrossRef] [PubMed]
- Jansson, S.; Douglas, C.J. Populus: A model system for plant biology. Annu. Rev. Plant. Biol. 2007, 58, 435–458. [Google Scholar] [CrossRef] [PubMed]
- Lu, S.; Yang, C.; Chiang, V.L. Conservation and diversity of microRNA-associated copper-regulatory networks in Populus trichocarpa. J. Integr. Plant. Biol. 2011, 53, 879–891. [Google Scholar] [CrossRef]
- Zhou, B.; Kang, Y.; Leng, J.; Xu, Q. Genome-Wide Analysis of the miRNA-mRNAs Network Involved in Cold Tolerance in Populus simonii x P. nigra. Genes 2019, 10, 430. [Google Scholar] [CrossRef] [PubMed]
- Wang, Y.; Liu, W.; Wang, X.; Yang, R.; Wu, Z.; Wang, H.; Wang, L.; Hu, Z.; Guo, S.; Zhang, H.; et al. MiR156 regulates anthocyanin biosynthesis through SPL targets and other microRNAs in poplar. Hortic. Res. 2020, 7, 118. [Google Scholar] [CrossRef]
- Jin, J.; Zhang, H.; Kong, L.; Gao, G.; Luo, J. PlantTFDB 3.0: A portal for the functional and evolutionary study of plant transcription factors. Nucleic Acids Res. 2014, 42, D1182–D1187. [Google Scholar] [CrossRef]
- Goodstein, D.M.; Shu, S.; Howson, R.; Neupane, R.; Hayes, R.D.; Fazo, J.; Mitros, T.; Dirks, W.; Hellsten, U.; Putnam, N.; et al. Phytozome: A comparative platform for green plant genomics. Nucleic Acids Res. 2012, 40, D1178–D1186. [Google Scholar] [CrossRef]
- Finn, R.D.; Bateman, A.; Clements, J.; Coggill, P.; Eberhardt, R.Y.; Eddy, S.R.; Heger, A.; Hetherington, K.; Holm, L.; Mistry, J.; et al. Pfam: The protein families database. Nucleic Acids Res. 2014, 42, D222–D230. [Google Scholar] [CrossRef]
- Crooks, G.E.; Hon, G.; Chandonia, J.M.; Brenner, S.E. WebLogo: A sequence logo generator. Genome Res. 2004, 14, 1188–1190. [Google Scholar] [CrossRef]
- Artimo, P.; Jonnalagedda, M.; Arnold, K.; Baratin, D.; Csardi, G.; de Castro, E.; Duvaud, S.; Flegel, V.; Fortier, A.; Gasteiger, E.; et al. ExPASy: SIB bioinformatics resource portal. Nucleic Acids Res. 2012, 40, W597–W603. [Google Scholar] [CrossRef]
- Horton, P.; Park, K.J.; Obayashi, T.; Fujita, N.; Harada, H.; Adams-Collier, C.J.; Nakai, K. WoLF PSORT: Protein localization predictor. Nucleic Acids Res. 2007, 35, W585–W587. [Google Scholar] [CrossRef] [PubMed]
- Letunic, I.; Bork, P. Interactive tree of life (iTOL) v3: An online tool for the display and annotation of phylogenetic and other trees. Nucleic Acids Res. 2016, 44, W242–W245. [Google Scholar] [CrossRef] [PubMed]
- Kumar, S.; Stecher, G.; Tamura, K. MEGA7: Molecular Evolutionary Genetics Analysis Version 7.0 for Bigger Datasets. Mol. Biol. Evol. 2016, 33, 1870–1874. [Google Scholar] [CrossRef]
- Bailey, T.L.; Boden, M.; Buske, F.A.; Frith, M.; Grant, C.E.; Clementi, L.; Ren, J.; Li, W.W.; Noble, W.S. MEME SUITE: Tools for motif discovery and searching. Nucleic Acids Res. 2009, 37, W202–W208. [Google Scholar] [CrossRef] [PubMed]
- Chen, C.; Chen, H.; Zhang, Y.; Thomas, H.R.; Frank, M.H.; He, Y.; Xia, R. TBtools: An Integrative Toolkit Developed for Interactive Analyses of Big Biological Data. Mol. Plant. 2020, 13, 1194–1202. [Google Scholar] [CrossRef] [PubMed]
- Wang, Y.; Tang, H.; Debarry, J.D.; Tan, X.; Li, J.; Wang, X.; Lee, T.H.; Jin, H.; Marler, B.; Guo, H.; et al. MCScanX: A toolkit for detection and evolutionary analysis of gene synteny and collinearity. Nucleic Acids Res. 2012, 40, e49. [Google Scholar] [CrossRef] [PubMed]
- Tuskan, G.A.; Difazio, S.; Jansson, S.; Bohlmann, J.; Grigoriev, I.; Hellsten, U.; Putnam, N.; Ralph, S.; Rombauts, S.; Salamov, A.; et al. The genome of black cottonwood, Populus trichocarpa (Torr. & Gray). Science 2006, 313, 1596–1604. [Google Scholar] [CrossRef]
- Zhang, Y. miRU: An automated plant miRNA target prediction server. Nucleic Acids Res. 2005, 33, W701–W704. [Google Scholar] [CrossRef]
- Dai, X.; Zhao, P.X. psRNATarget: A plant small RNA target analysis server. Nucleic Acids Res. 2011, 39, W155–W159. [Google Scholar] [CrossRef]
- Yao, W.; Wang, S.; Zhou, B.; Jiang, T. Transgenic poplar overexpressing the endogenous transcription factor ERF76 gene improves salinity tolerance. Tree Physiol. 2016, 36, 896–908. [Google Scholar] [CrossRef]
- Anders, S.; Huber, W. Differential expression analysis for sequence count data. Genome Biol. 2010, 11, R106. [Google Scholar] [CrossRef]
- Regier, N.; Frey, B. Experimental comparison of relative RT-qPCR quantification approaches for gene expression studies in poplar. BMC Mol. Biol. 2010, 11, 57. [Google Scholar] [CrossRef] [PubMed]
- Livak, K.J.; Schmittgen, T.D. Analysis of relative gene expression data using real-time quantitative PCR and the 2(-Delta Delta C(T)) Method. Methods (San Diegocalif.) 2001, 25, 402–408. [Google Scholar] [CrossRef] [PubMed]
- Zhang, H.-X.; Jin, J.-H.; He, Y.-M.; Lu, B.-Y.; Li, D.-W.; Chai, W.-G.; Khan, A.; Gong, Z.-H. Genome-Wide Identification and Analysis of the SBP-Box Family Genes under Phytophthora capsici Stress in Pepper (Capsicum annuum L.). Front. Plant. Sci. 2016, 7. [Google Scholar] [CrossRef]
- Zhang, L.; Wu, B.; Zhao, D.; Li, C.; Shao, F.; Lu, S. Genome-wide analysis and molecular dissection of the SPL gene family in Salvia miltiorrhiza. J. Integr. Plant. Biol. 2014, 56, 38–50. [Google Scholar] [CrossRef]
- Abdullah, M.; Cao, Y.P.; Cheng, X.; Shakoor, A.; Su, X.Q.; Gao, J.S.; Cai, Y.P. Genome-Wide Analysis Characterization and Evolution of SBP Genes in Fragaria vesca, Pyrus bretschneideri, Prunus persica and Prunus mume. Front. Genet. 2018, 9, 12. [Google Scholar] [CrossRef] [PubMed]
- Salinas, M.; Xing, S.; Höhmann, S.; Berndtgen, R.; Huijser, P. Genomic organization, phylogenetic comparison and differential expression of the SBP-box family of transcription factors in tomato. Planta 2012, 235, 1171–1184. [Google Scholar] [CrossRef]
- Gang, H.; Li, R.; Zhao, Y.; Liu, G.; Chen, S.; Jiang, J. Loss of GLK1 transcription factor function reveals new insights in chlorophyll biosynthesis and chloroplast development. J. Exp. Bot. 2019, 70, 3125–3138. [Google Scholar] [CrossRef]
- Wang, W.; Zheng, H.; Yang, S.; Yu, H.; Li, J.; Jiang, H.; Su, J.; Yang, L.; Zhang, J.; McDermott, J.; et al. Origin and evolution of new exons in rodents. Genome Res. 2005, 15, 1258–1264. [Google Scholar] [CrossRef]
- Shikata, M.; Koyama, T.; Mitsuda, N.; Ohme-Takagi, M. Arabidopsis SBP-box genes SPL10, SPL11 and SPL2 control morphological change in association with shoot maturation in the reproductive phase. Plant. Cell Physiol. 2009, 50, 2133–2145. [Google Scholar] [CrossRef]
- Dung Tien, L.; Nishiyama, R.; Watanabe, Y.; Vankova, R.; Tanaka, M.; Seki, M.; Le Huy, H.; Yamaguchi-Shinozaki, K.; Shinozaki, K.; Lam-Son Phan, T. Identification and Expression Analysis of Cytokinin Metabolic Genes in Soybean under Normal and Drought Conditions in Relation to Cytokinin Levels. PLoS ONE 2012, 7, e42411. [Google Scholar] [CrossRef]
- Eldem, V.; Okay, S.; Unver, T. Plant microRNAs: New players in functional genomics. Turk. J. Agric. For. 2013, 37, 1–21. [Google Scholar] [CrossRef]
- Wu, G.; Park, M.Y.; Conway, S.R.; Wang, J.W.; Weigel, D.; Poethig, R.S. The sequential action of miR156 and miR172 regulates developmental timing in Arabidopsis. Cell 2009, 138, 750–759. [Google Scholar] [CrossRef]
- Yin, D.D.; Li, S.S.; Shu, Q.Y.; Gu, Z.Y.; Wu, Q.; Feng, C.Y.; Xu, W.Z.; Wang, L.S. Identification of microRNAs and long non-coding RNAs involved in fatty acid biosynthesis in tree peony seeds. Gene 2018, 666, 72–82. [Google Scholar] [CrossRef]
- Geng, Y.; Jian, C.; Xu, W.; Liu, H.; Hao, C.; Hou, J.; Liu, H.; Zhang, X.; Li, T. miR164-targeted TaPSK5 encodes a phytosulfokine precursor that regulates root growth and yield traits in common wheat (Triticum aestivum L.). Plant. Mol. Biol. 2020, 104, 615–628. [Google Scholar] [CrossRef] [PubMed]
- Zheng, L.; Nagpal, P.; Villarino, G.; Trinidad, B.; Bird, L.; Huang, Y.; Reed, J.W. miR167 limits anther growth to potentiate anther dehiscence. Development 2019, 146. [Google Scholar] [CrossRef] [PubMed]
- Stone, J.M.; Liang, X.; Nekl, E.R.; Stiers, J.J. Arabidopsis AtSPL14, a plant-specific SBP-domain transcription factor, participates in plant development and sensitivity to fumonisin B1. Plant. J. Cell Mol. Biol. 2005, 41, 744–754. [Google Scholar] [CrossRef]
- Wan, H.; Yuan, W.; Yu, K.; Liu, Y.; Li, Z.; Ye, Q.; Wang, R.; Ruan, M.; Zhou, G.; Yao, Z.; et al. Geno me-wide Identification, Structure Characterization and Expression Analysis of SBP Gene Family in Tomato. Mol. Plant. Breed. 2013, 11, 299–306. [Google Scholar]
- Aukerman, M.J.; Sakai, H. Regulation of flowering time and floral organ identity by a MicroRNA and its APETALA2-like target genes. Plant. Cell 2003, 15, 2730–2741. [Google Scholar] [CrossRef]
- Rhoades, M.W.; Reinhart, B.J.; Lim, L.P.; Burge, C.B.; Bartel, B.; Bartel, D.P. Prediction of plant microRNA targets. Cell 2002, 110, 513–520. [Google Scholar] [CrossRef]
- Cui, L.G.; Shan, J.X.; Shi, M.; Gao, J.P.; Lin, H.X. The miR156-SPL9-DFR pathway coordinates the relationship between development and abiotic stress tolerance in plants. Plant. J. Cell Mol. Biol. 2014, 80, 1108–1117. [Google Scholar] [CrossRef]
- Lee, H.; Yoo, S.J.; Lee, J.H.; Kim, W.; Yoo, S.K.; Fitzgerald, H.; Carrington, J.C.; Ahn, J.H. Genetic framework for flowering-time regulation by ambient temperature-responsive miRNAs in Arabidopsis. Nucleic Acids Res. 2010, 38, 3081–3093. [Google Scholar] [CrossRef]
- Kantar, M.; Lucas, S.J.; Budak, H. miRNA expression patterns of Triticum dicoccoides in response to shock drought stress. Planta 2011, 233, 471–484. [Google Scholar] [CrossRef] [PubMed]
- Wang, J.; Bao, J.; Zhou, B.; Li, M.; Li, X.; Jin, J. The osa-miR164 target OsCUC1 functions redundantly with OsCUC3 in controlling rice meristem/organ boundary specification. New Phytol. 2020, 229, 1566–1581. [Google Scholar] [CrossRef] [PubMed]
- Hu, G.; Lei, Y.; Liu, J.; Hao, M.; Zhang, Z.; Tang, Y.; Chen, A.; Wu, J. The ghr-miR164 and GhNAC100 modulate cotton plant resistance against Verticillium dahlia. Plant. Sci. Int. J. Exp. Plant. Biol. 2020, 293, 110438. [Google Scholar] [CrossRef] [PubMed]
- Chai, G.; Wang, Z.; Tang, X.; Yu, L.; Qi, G.; Wang, D.; Yan, X.; Kong, Y.; Zhou, G. R2R3-MYB gene pairs in Populus: Evolution and contribution to secondary wall formation and flowering time. J. Exp. Bot. 2014, 65, 4255–4269. [Google Scholar] [CrossRef]
- Jung, J.H.; Lee, H.J.; Ryu, J.Y.; Park, C.M. SPL3/4/5 Integrate Developmental Aging and Photoperiodic Signals into the FT-FD Module in Arabidopsis Flowering. Mol. Plant. 2016, 9, 1647–1659. [Google Scholar] [CrossRef] [PubMed]
- Padmanabhan, M.S.; Ma, S.; Burch-Smith, T.M.; Czymmek, K.; Huijser, P.; Dinesh-Kumar, S.P. Novel positive regulatory role for the SPL6 transcription factor in the N TIR-NB-LRR receptor-mediated plant innate immunity. PLoS Pathog. 2013, 9, e1003235. [Google Scholar] [CrossRef]
- Chao, L.M.; Liu, Y.Q.; Chen, D.Y.; Xue, X.Y.; Mao, Y.B.; Chen, X.Y. Arabidopsis Transcription Factors SPL1 and SPL12 Confer Plant Thermotolerance at Reproductive Stage. Mol. Plant. 2017, 10, 735–748. [Google Scholar] [CrossRef]


Publisher’s Note: MDPI stays neutral with regard to jurisdictional claims in published maps and institutional affiliations. |
© 2021 by the authors. Licensee MDPI, Basel, Switzerland. This article is an open access article distributed under the terms and conditions of the Creative Commons Attribution (CC BY) license (https://creativecommons.org/licenses/by/4.0/).