Article

Exploring Archetypes of Tropical Fire-Related Forest Disturbances Based on Dense Optical and Radar Satellite Data and Active Fire Alerts

Laboratory of Geo-Information Science and Remote Sensing, Wageningen University & Research, Droevendaalsesteeg 3, 6708 PB Wageningen, The Netherlands
*
Author to whom correspondence should be addressed.
Forests 2021, 12(4), 456; https://doi.org/10.3390/f12040456
Submission received: 25 February 2021 / Revised: 1 April 2021 / Accepted: 7 April 2021 / Published: 9 April 2021
(This article belongs to the Section Forest Inventory, Modeling and Remote Sensing)

Abstract

:
Tropical forest disturbances linked to fire usage cause large amounts of greenhouse gas (GHG) emissions and environmental damages. Supporting precise GHG estimations and counteracting illegal fire usages in the tropics require timely and thematically detailed large-scale information on fire-related forest disturbances. Multi-sensor optical and radar detection and ranging (radar) remote sensing data combined with active fire alerts shows the potential for a more in-depth characterization of fire-related forest disturbances. We utilized dense optical (Landsat-7, Landsat-8 and Sentinel-2) and radar (Sentinel-1) time series to individually map forest disturbances in the province of Riau (Indonesia) for 2018–2019. We combined the sensor-specific optical and radar forest disturbance maps with daily active fire alerts and classified their temporal relationship (predating, coinciding, postdating) into seven so-called archetypes of fire-related forest disturbances. The archetypes reflect sensor-specific sensitives of optical (e.g., changes in tree foliage) and radar (e.g., changes in tree structure) data to detect varying types of forest disturbances, ranging from either a loss of tree foliage and/or structure predating, coinciding or postdating fires. These can be related to different magnitudes of fire-related forest disturbances and burn severities and can be associated with specific land management practices, such as slash-and-burn agriculture and salvage logging. This can support policy development, local and regional forest management and law enforcement to reduce illegal fire usage in the tropics. Results suggest that a delayed or opposing forest disturbance detection in the optical and radar signal is not only caused by environmental influences or different observation densities but, in some cases, such as fire-related forest disturbances, can be related to their different sensitives to detect changes in tree foliage and structure. Multi-sensor-based forest monitoring approaches should, therefore, not simply combine optical and radar time series on a data level, as it bears the risk of introducing artefacts.

1. Introduction

Indonesia is globally one of the main contributors of forest carbon emissions in the 21st century as a result of large-scale forest disturbances including deforestation and forest degradation [1,2]. Forest disturbances in Indonesia are caused primarily by smallholder or commercial agriculture crop expansion and timber production, of which many are illegal or unsustainable [3,4]. Furthermore, these disturbances are strongly linked to fire use [5]. While fire use for land management is forbidden by Indonesian law, a wide range of fire-related practices are still used today [6]. These practices traditionally include limited and controlled burning of forests to, for example, clear understory providing access prior to logging operations, burn forest directly or burn remaining material at previously logged patches in preparation of agricultural use [7,8]. Moreover, escaped land use fires cause large-area forest fires in dry El Nino years (e.g., 2015) [9].
While some fires burn the entire tree structure, others only burn the tree foliage resulting in varying magnitudes of released GHG emissions [10]. The lack of detailed information on fire-related forest disturbances cause high uncertainties in current GHG emission estimates [11,12]. The Paris Agreement and initiatives such as REDD+ have the goal to reduce GHG emissions by implementing sustainable land use management [13,14]. Sustainable land use and forest management needs detailed fire inventory data and information beyond simple net and gross deforestation on monthly or yearly basis [15,16].
Remote sensing has proven to be a valuable tool for monitoring large-scale forest disturbances and fires in tropical ecosystems [17]. Optical satellite time series are used to detect forest disturbances by relating spectral information, commonly, spectral vegetation indices, to photosynthetic capacity, shifts in phenology and temporal vegetation dynamics [18,19,20,21,22,23,24,25,26]. By combining optical time series with active fire alerts from Visible Infrared Imaging Radiometer Suite (VIIRS) or Moderate Resolution Imaging Spectroradiometer (MODIS) sensors, it is possible to detect and analyze fire-related forest disturbances [27,28,29,30,31,32]. However, limited availability of cloud-free observations in the tropics often restricts characterizations of fire-related forest disturbances to a simple co-location of active fire alerts and gap-free annual optical forest change products [5,33,34,35]. Hereby, the detailed information on how fires are temporally related to forest disturbances is often lacking [36].
Radar satellite sensors are capable of penetrating clouds, thus potentially providing denser time series, and are sensitive to changes in forest structure [37,38]. Combining dense radar backscatter time series with active fire alerts enables the possibility to monitor fire severity and to explore the temporal relationship of fires and forest disturbances [36,39,40,41]. Reiche et al. [36] combined VIIRS active fire alerts and radar-based forest losses derived from Sentinel-1 time series to classify whether fires predated, coincided or postdated detected forest disturbances.
Combining optical and radar remote sensing time series shows great potential in increasing the observation frequency and overcoming sensor-specific misclassifications due to environmental influences (e.g., cloud coverage, rainfall, etc.) when monitoring forest disturbances [37,42,43,44,45]. Studies also show benefits of a combined usage for burned area and fire severity mapping [46,47]. The sensitivities of both sensors towards forest disturbances vary. Optical sensors are capable of detecting subtle changes in the tree foliage but show limitations when separating those from higher magnitude changes such as tree removal, while radar sensors are capable of detecting larger structural changes in forest cover but are not able to identify changes in tree foliage that do not result in structural forest changes [36,48,49,50]. However, their synergistic potential for a more detailed temporal characterization of fire-related forest disturbances has yet to be studied [36].
The aim of this study was to combine multi-sensor optical and radar remote sensing data with active fire alerts for an improved characterization of fire-related forest disturbances for the province of Riau (Indonesia). We mapped forest disturbances independently based on dense optical (Landsat-7, Landsat-8 and Sentinel-2) and radar (Sentinel-1) time series (i). Then, we derived archetypes of fire-related forest disturbances based on the temporal relationship of mapped optical and radar forest disturbances with VIIRS active fire alerts (ii). Lastly, the implications for multi-sensor forest monitoring were discussed based on the findings of this study (iii).

2. Materials and Methods

2.1. Study Area

The province of Riau, Indonesia (100–104 E and 2.5 N–1 S) is located at the east coast of central Sumatra covering around 89,000 km2. Its topography consists of a low elevation coastline in the east and mountainous areas of up to 1200 m in the west. Riau experiences a tropical equatorial climate with regular cloud coverage. The annual precipitation varies between 2000 and 3000 mm. By the 1970s, 95% of the land was covered by natural forest [51]. However, a long history of smallholder and commercial agriculture expansion resulted in large-scale forest loss and a conversion of natural forest to plantation forest or smallholder agriculture [3,52]. Today, only patches of natural forests remain, which mainly consist of primary and secondary dryland and swamp forest and mangrove forest (Figure 1). These substantial changes in landscapes left forests vulnerable to forest disturbances [6], which in Riau, are strongly linked to fire use [5].

2.2. Data

Following the satellite and auxiliary data used in this study, the applied pre-processing are described (Table 1). We defined a historic (2015–2017) and monitoring period (2018–2019). The historic period was used for training the applied forest disturbance detection method, while the monitoring period was used to detect forest disturbances separately in optical and radar time series (i), characterize the temporal relationship of optical and radar forest disturbances with active fire alerts (ii) and classify archetypes of fire-related forest disturbances (iii).

2.2.1. Optical Satellite Data

Dense normalized burn ratio (NBR) time series of imagery from Landsat-7 ETM+, Landsat 8 and Sentinel-2 satellites were used to map optical forest disturbances. The NBR is based on near infrared and shortwave infrared bands and is sensitive to the status of burned forests [29,59]. The monitoring period of NBR time series was extended for 3 months to exclude potential cloud coverage based omission errors in the optical forest disturbance map towards the end of the monitoring period.
Landsat-7 ETM+ and Landsat-8 provide spatial resolutions of 30 m and combined temporal resolutions of up to 8 days in the tropics [56,57]. Atmospherically corrected and cloud masked Level-2a data with less than 70% cloud coverage acquired from 2015 to March 2020 were obtained in Google Earth Engine (GEE) [60,61]. Sentinel-2 a/b provide spatial resolutions of up to 10 m and temporal resolutions of up to 5 days in the tropics [55]. Level-1c data from 2015 to March 2020 with a cloud coverage of less than 70% were downloaded and pre-processed in GEE [62]. The pre-processing included atmospheric correction [63], improved cloud and shadow masking [64] and resampling to the 30 m Landsat grid.
We created combined NBR times series from Landsat-7, Landsat-8 and Sentinel-2 data. Next, we removed outliers in the time series due to the remaining cloud and cloud shadow or atmospheric noise after the atmospheric correction using a pixel-wise approach following Hamunyela et al. [65]. Additionally, an image normalization was applied to mitigate dry season and drought effects [38,66].
For validating mapped optical forest disturbances, monthly mosaics of the optical PlanetScope satellite imagery with a spatial resolution of 5 m were utilized [58].

2.2.2. Radar Satellite Data

C-band backscatter time series derived from Sentinel-1 a/b data, which was acquired in Interferometric Wide swath mode with dual-polarization (VV- and VH-polarization) and ascending and descending orbits, were used to map radar forest disturbances. Sentinel-1 provides spatial resolutions of ~20 m and a temporal resolution of up to 6 days in the tropics [54]. Sentinel-1 synthetic aperture radar (SAR) ground range-detected (GRD) data from 2015 to 2020 were accessed via GEE. Prior to the ingestion in the GEE archive, several pre-processing steps were applied, including apply orbit file, GRD border noise removal, thermal noise removal, radiometric calibration, terrain correction and geocoding [67]. Additionally, we applied an angular-based radiometric slope correction [68], adaptive multitemporal speckle filtering [69], conversion from linear to dB scale, resampling to the 30 m Landsat grid and image normalization to mitigate dry season and drought effects [38,66].
We used the Sentinel-1 backscatter time series additionally for validating the mapped radar forest disturbances, as there was no other freely available radar imagery with the same necessary temporal resolution available.

2.2.3. Active Fire Alerts

Daily active fire alerts from the VIIRS sensor onboard of Suomi National Polar-Orbiting Partnership (S-NPP) were obtained from NASA’s Fire Information for Resource Management System archive for the monitoring period [70]. The VIIRS S-NPP-V14IMGTDL_NRT product has a spatial resolution of 375 m and provides images twice a day. The well-established MODIS Fire and Thermal Anomalies product algorithm is used and adopted for the VIIRS active fire alerts generation [71]. Hereby, two thermal multispectral bands of VIIRS are utilized to detect day and night time biomass burning [28]. The data were downloaded and resampled to the 30 m Landsat grid.

2.2.4. Forest Baseline Map

We generated a forest baseline map for the beginning of the monitoring period following the Indonesian forest ministry’s definition of forest with at least 30% forest coverage and a minimum patch size of 0.25 ha. We used the Indonesian land cover map of 2017 [53] and updated areas classified as primary, secondary and plantation forest (excluding mangrove forest) by removing pixels indicating tree cover below 30% for 2000 and tree cover losses between 2001–2017 in the Hansen products [52] to reduce inconsistencies in the land cover map. Additionally, forest pixels indicating slopes greater than 15 degrees in the SRTM DEM were rejected to exclude potential geometrical artefacts in the radar forest disturbance map.

2.3. Methods

The classification of archetypes of fire-related forest disturbances followed two major steps (Figure 2). This included mapping of forest disturbances in optical and radar time series, respectively, (i) and classifying archetypes of fire-related forest disturbances based on the temporal relationship of mapped optical and radar forest disturbances with active fire alerts (ii).

2.3.1. Forest Disturbance Mapping

We used a pixel-based probabilistic algorithm [38] to map forest disturbances separately from NBR and backscatter time series. Firstly, time series values were converted into forest and non-forest probability density functions (pdfs) for the historic period. Secondly, PDFs were used to flag potential forest disturbance events for the monitoring period, when the conditional non-forest probability exceeded 0.75. Thirdly, flagged forest disturbances were confirmed—utilizing an iterative Bayesian updating—when a future observation in the time series indicated a non-forest probability above 0.95, which also caused the pixel-based monitoring to stop. The monitoring continued when the flagged forest disturbance was not confirmed. The confirmation of flagged forest disturbances was orbit-specific for the radar time series [66].
The pixel-based probabilistic algorithm was separately applied to NBR and backscatter time series and was restricted to forest pixels in the forest baseline map resulting in an optical and radar forest disturbance map.

2.3.2. Validation of Forest Disturbance Maps

The validation of the forest disturbance maps was restricted to pixels co-located with active fire alerts to focus on fire-related forest disturbances and was carried out separately for the optical and radar forest disturbance maps. We additionally included forest pixels of the forest baseline map within a buffer zone of 375 m around fire affected pixels to target omission errors [72]. A probability sampling [73] was carried out resulting in a total of 1059 sample points [74] over four sample strata classes. The four strata sample classes were: stable forest (i), optical and radar forest disturbance (ii), optical forest disturbance (iii) and radar forest disturbance (iv). Stable forest was defined as absent forest disturbances in both optical and radar forest disturbance maps. Optical and radar forest disturbance was defined as forest disturbances detected in both maps. Optical forest disturbance/radar forest disturbance were defined as forest disturbances mapped in either only optical or radar time series, respectively. The samples were allocated proportionally to the strata areas of the classes. The selected samples were used for validating both optical and radar forest disturbance maps. Samples of the strata class optical forest disturbance or radar forest disturbance were treated as stable forest if not mapped in either time series. A visual interpretation of monthly PlanetScope image mosaics was utilized to validate the optical forest disturbances, while the initial Sentinel-1 backscatter time series was used for the radar forest disturbances. The separate validation of optical and radar forest disturbance maps was carried out to account for sensor-specific capabilities and sensitivities to map forest disturbances.
The forest baseline map was based on a land cover map, a tree cover product and annual tree cover loss products all utilizing Landsat data and showing typical error sources of optical data due to environmental influences (e.g., cloud coverage, etc.). Forest disturbances missed due to an error of the forest baseline map were labelled as “error forest baseline map”, but not reported as false detections (commission error). Boundary pixels can similarly be ambiguous and cause problems when validating higher spatial resolution forest disturbances [75]. We labelled these cases as “boundary pixels” but did not report them as false detections.
The validated samples were used to create a confusion matrix and to calculate user’s (commission error) and producer’s accuracies (omission error) for areas of the optical and radar disturbance maps co-located with active fire alerts, respectively.

2.3.3. Classification of Archetypes of Fire-Related Forest Disturbances

We used the temporal relationship of mapped optical and radar disturbances and co-located active fire alerts to classify archetypes of fire-related forest disturbances. Active fire alerts were used to label both optical and radar mapped disturbances predating, coinciding or postdating detected fires. The labeling was based on a pixel-wise time span defined by two observations in either the optical or radar time series before the mapped optical or radar disturbance dates. The time span was orbit-specific for the radar time series. If a date of an active fire alert fell within the time span of a forest disturbance, it was marked as coinciding, regardless of active fire alerts occurring before or after the disturbance date. In case of multiple active fire alerts being present before and after the time span, the temporally closest active fire alert was used.
Next, the temporal relationships of optical and radar disturbances with active fire alerts were used to identify so-called archetypes of fire-related forest disturbances (Table 2). Fire-related forest disturbances can be understood as mapped forest disturbances and active fire alerts co-located and temporally coinciding within the monitoring period. Our archetypes contain information on the temporal relationship between detected forest disturbances and active fire alerts, as well as different magnitudes of fire-related forest disturbances resulting from the different sensitivities of optical and radar data towards changes in tree cover. Mapped forest disturbances absent of active fire alerts were seen as non-fire-related forest disturbances and, hence, were not included in the archetype classification. Similarly, optical and radar disturbances exclusively postdating active fire alerts were not included and rejected as non-fire-related forest disturbances. Hereby, the NBR or backscatter time series showed no impact of a fire on the respective pixel but were rather caused by wrongly co-located active fire alerts and forest disturbances due to the coarse spatial resolution of the active fire alerts (375 m) compared to the optical and radar forest disturbance maps (30 m). We were able to define seven dominant archetypes based on area statistics of the remaining temporal relationships. Ambiguous cases showing only minor individual detections (below 5%) were classified as others. More detailed information on the archetypes is provided in the results chapter.
Suitable ground-based (e.g., inventory data, interviews) or satellite-based reference data (e.g., multi-temporal vertical tree structure estimations derived by light detection and ranging (Lidar) observations) were not available to validate the archetypes.

3. Results

The following chapter presents results of the optical and radar forest disturbance maps, their temporal relationship with active fire alerts and introduces archetypes of fire-related forest disturbances.

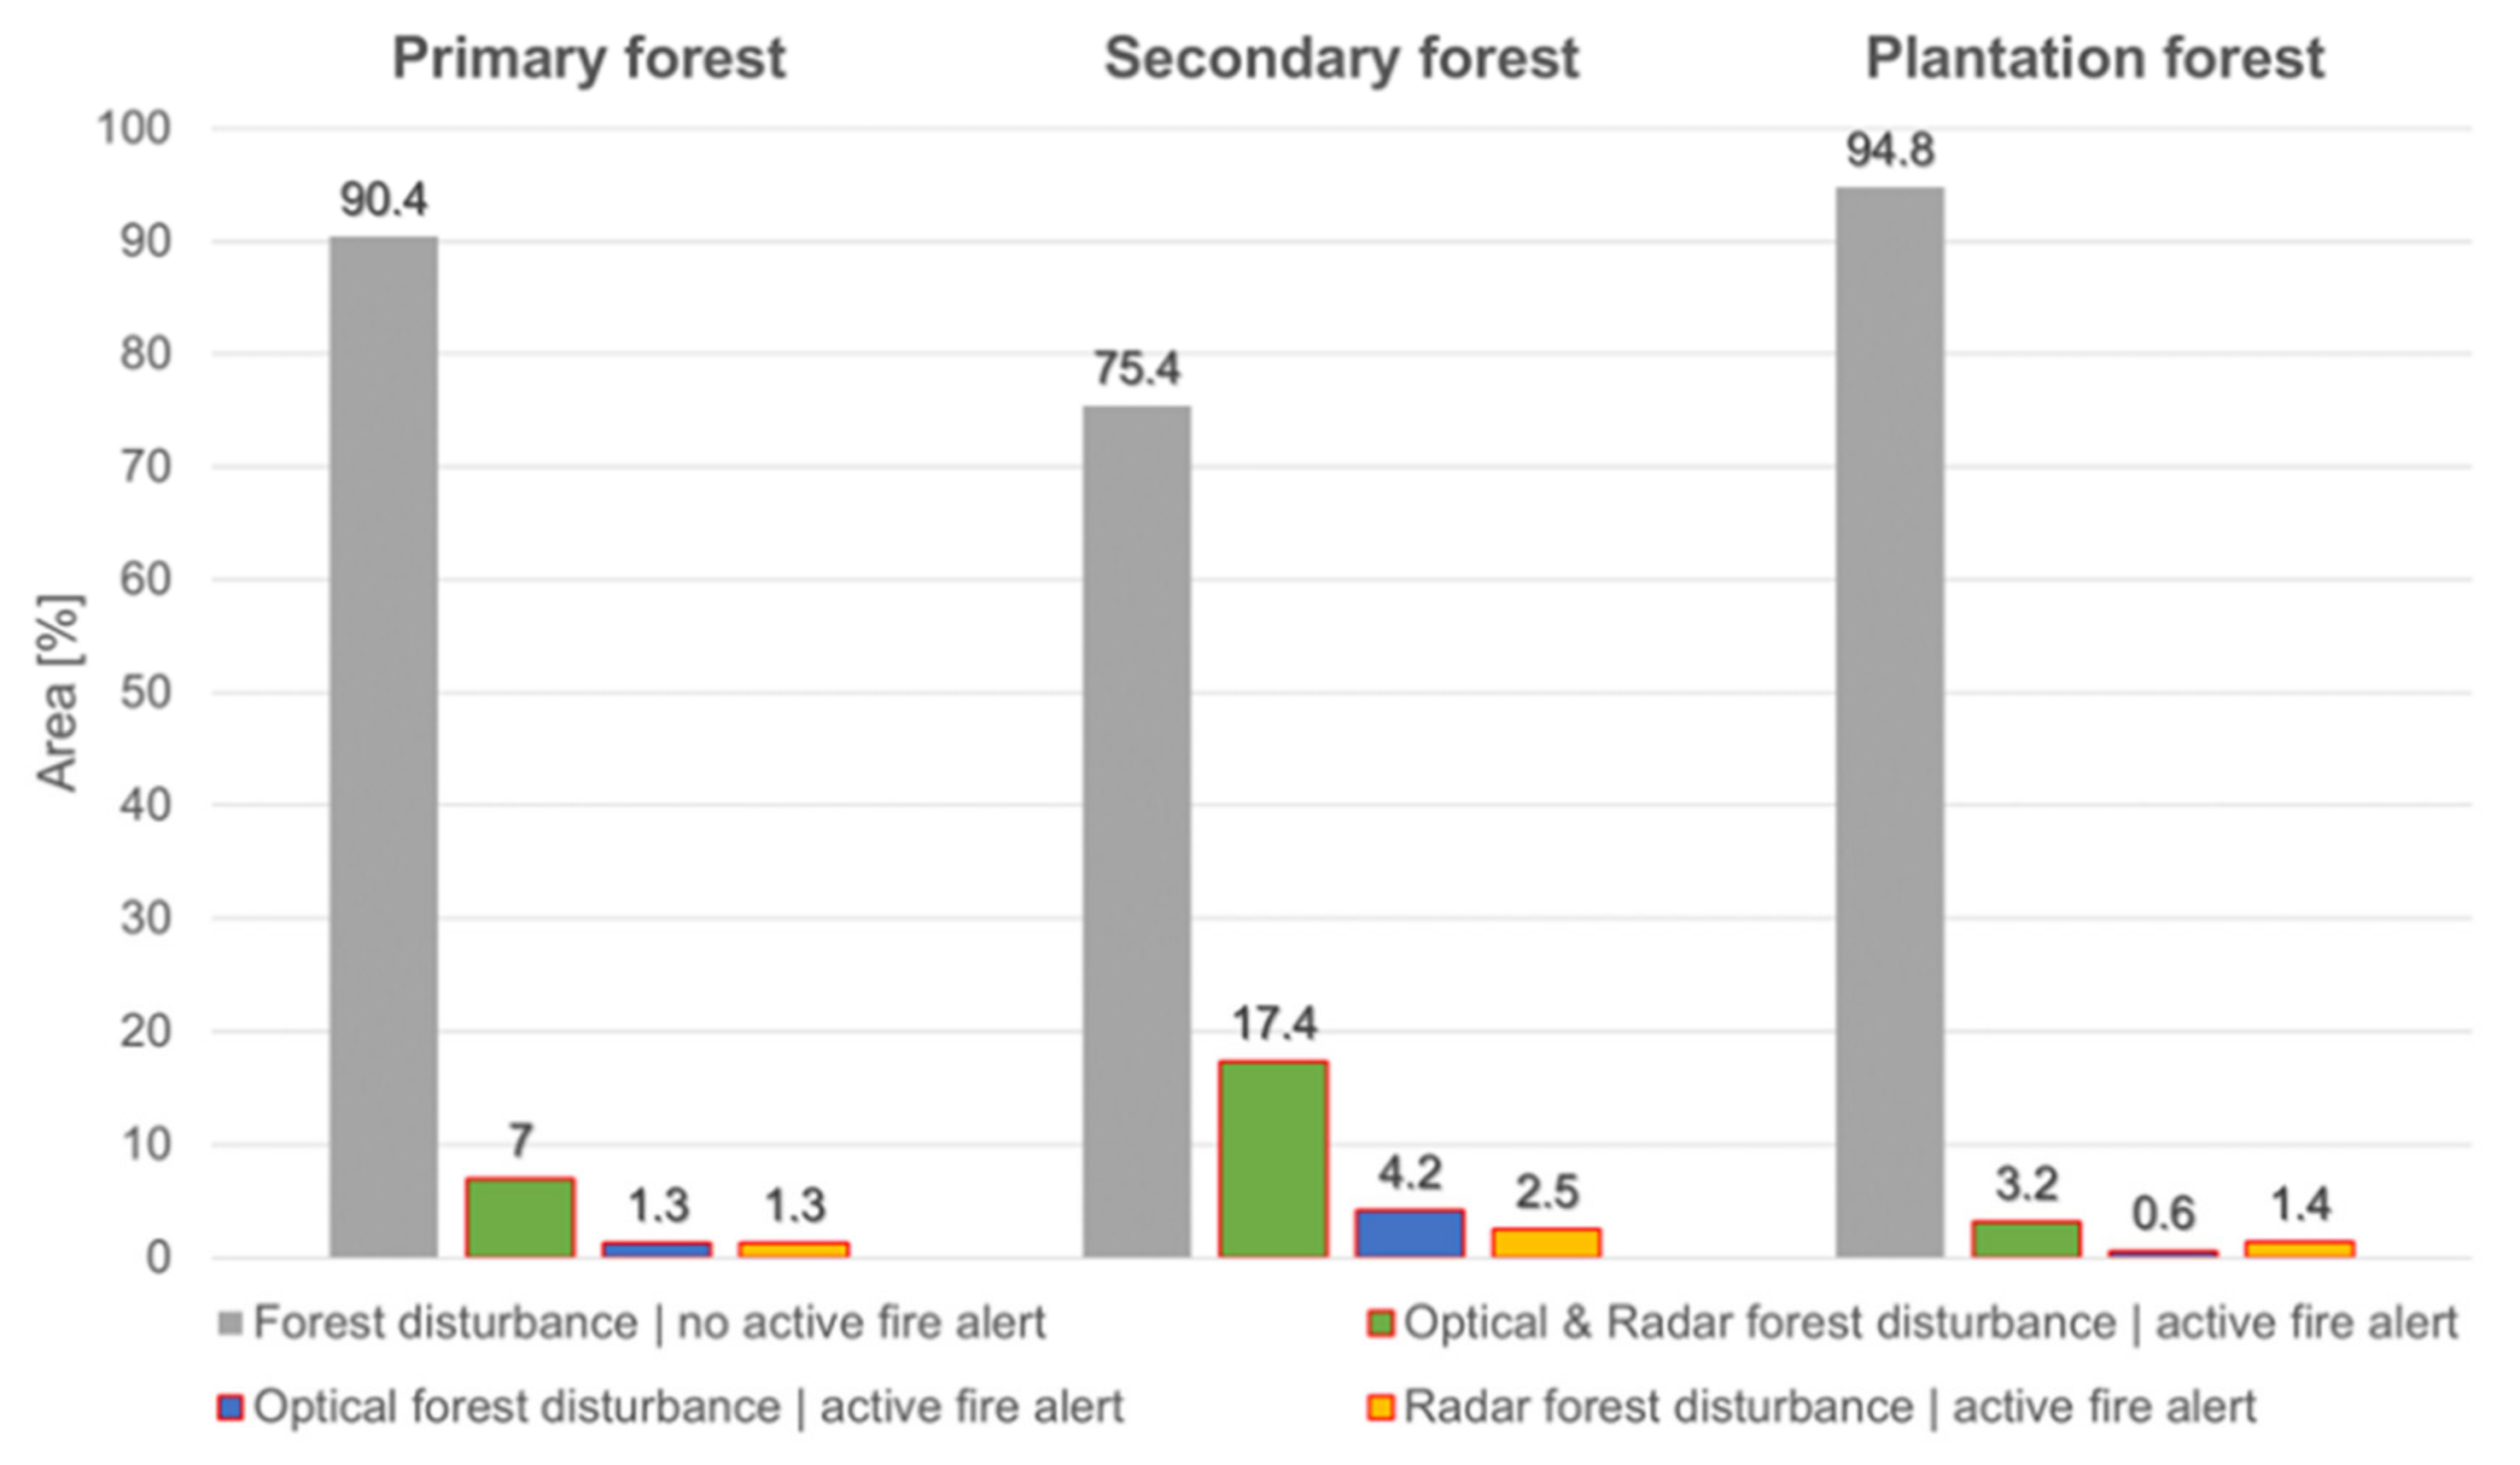
3.1. Forest Disturbance Mapping and Active Fire Alerts

The mapped forest disturbances covered an area of 30,052 ha for optical disturbances and 21,292 ha for radar disturbances. The validation showed high user’s accuracies for optical and radar forest disturbance maps of 92.1 and 87.6%, respectively. Estimated producer’s accuracies were slightly lower with 79.5% for optical and 77.5% for radar forest disturbances. Overall, 79.3% of mapped forest disturbances were not co-located with active fire alerts and indicated no fire-related forest disturbance. This included 2.5% forest disturbances exclusively post-dating active fire alerts. The remaining one fifth (20.7%) of mapped forest disturbances were co-located with active fire alerts indicating fire-related disturbances, with secondary forest showing the highest proportion (24.1%) compared to primary (9.6%) and plantation forest (5.2%) (Figure 3). The forest cover types indicated varying proportions of fire-related forest disturbances detected in either optical, radar or both time series.
Monthly totals of mapped optical and radar forest disturbances co-located with active fire alerts showed similar temporal patterns as monthly totals of active fire alerts (Figure 4). This was especially visible for major fire outbreaks towards the end of 2019 with similar peaks, including a small temporal lag, for co-located mapped optical and radar disturbances and active fire alerts [76]. Overall, active fire alerts covered larger areas than mapped forest disturbances due to re-occurring active fire alerts at the same location and their coarser spatial resolution (375 m) compared to the optical and radar time series (30 m).

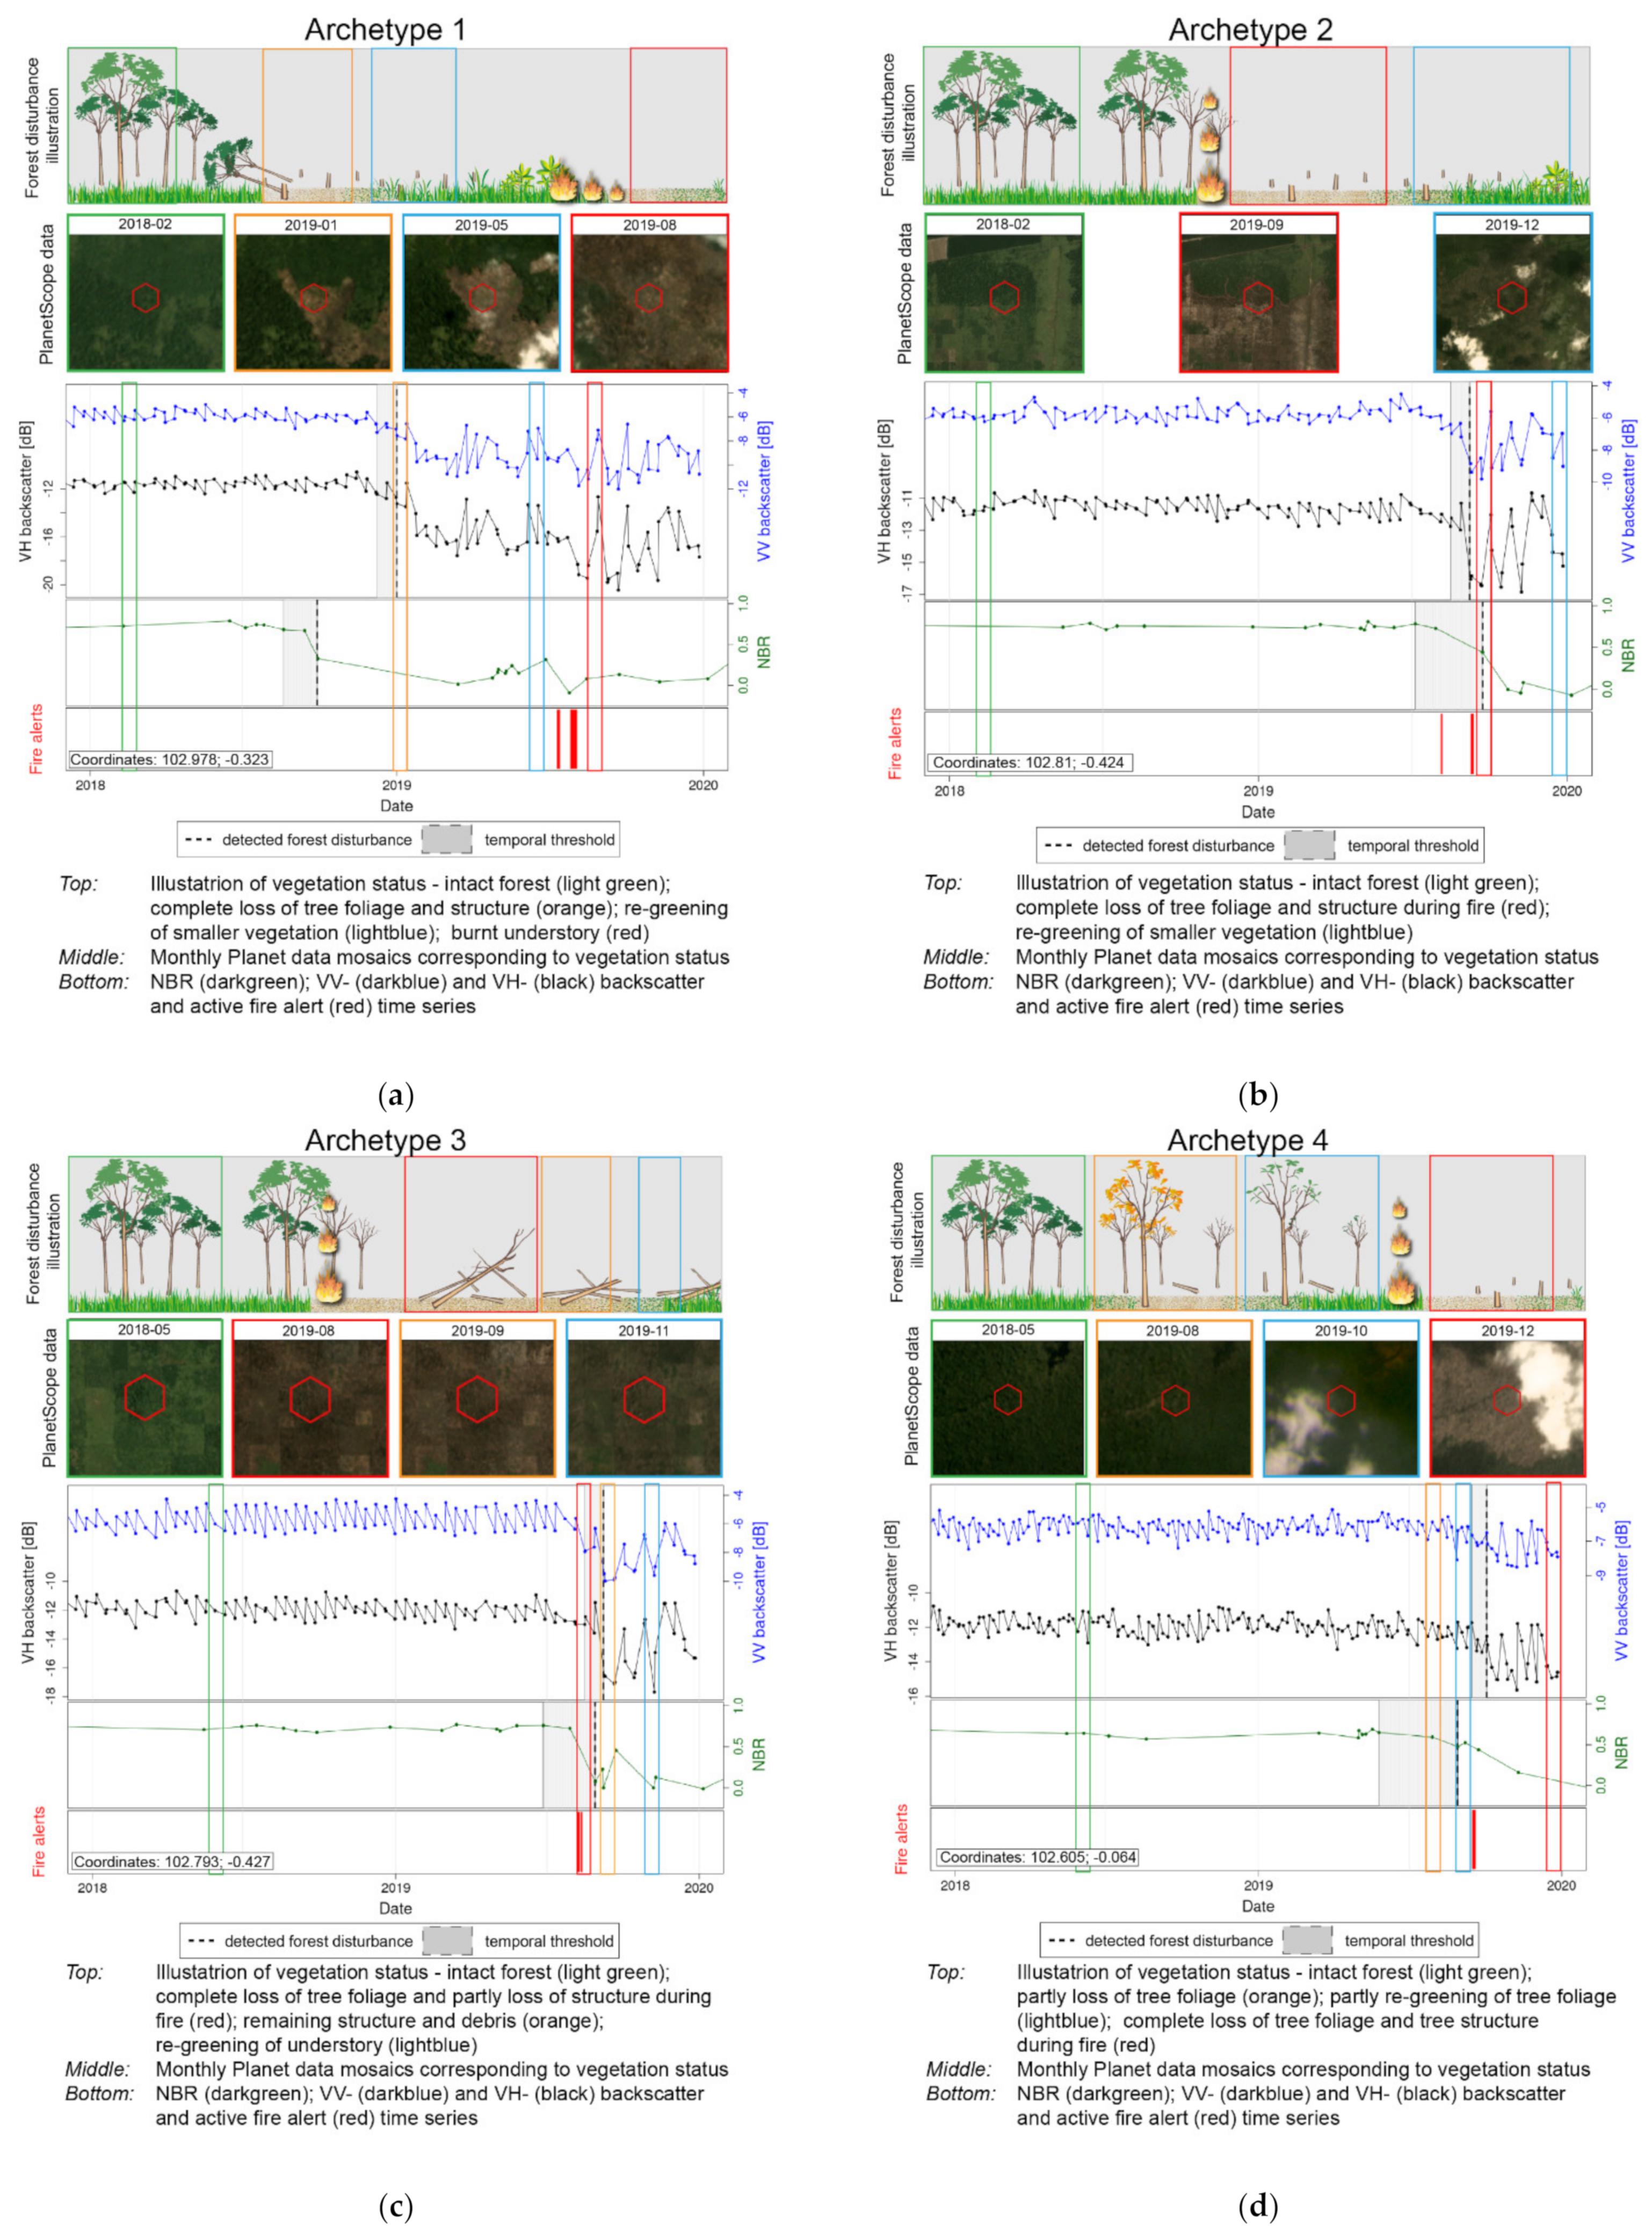
3.2. Archetypes of Fire-Related Forest Disturbances

The fire-related forest disturbances showed 12 unique temporal relationships of detected optical and radar forest disturbances and active fire alerts. We classified five cases, representing 9.4% of fire-related forest disturbances, as “others” due to minor individual detections (<5%). The remaining 90.4% of fire-related forest disturbances were used to classify seven major distinct archetypes. The archetypes are arranged in a way to depict their robustness. Archetypes 1–4 relying on a mapped disturbance in both optical and radar time series come with a fairly strong robustness, whereas Archetypes 5–7 based exclusively on a mapped disturbance in either optical and radar time series come with a weaker robustness, as potentially showing commission or omission errors of the forest disturbance maps.
  • Archetype 1 is defined by decreased NBR (optical forest disturbance) and backscatter (radar forest disturbance) values before the fire event (active fire alert). This archetype represents a complete loss of tree foliage and structure before a fire event and accounted for 11.8% of all fire-related forest disturbances.
  • Archetype 2 is defined by decreased NBR (optical forest disturbance) and backscatter (radar forest disturbance) values during the fire event (active fire alert). This archetype represents a complete loss of tree foliage and structure during a fire event and accounted for 29.1% of all fire-related forest disturbances.
  • Archetype 3 is defined by decreased NBR values (optical forest disturbance) during the fire event (active fire alert) and decreased backscatter values (radar forest disturbance) after the fire event. This archetype represents a loss of tree foliage during the fire event with remaining debris or a complete loss of tree structure after the fire event and accounted for 17.3% of all fire-related forest disturbances.
  • Archetype 4 is defined by decreased NBR values (optical forest disturbance) before the fire event (active fire alert) and decreased backscatter values (radar forest disturbance) during the fire event. This archetype represents a loss of tree foliage with remaining structure before a fire event and complete loss of tree structure during a fire event and accounted for 6.7% of all fire-related forest disturbances.
  • Archetype 5 is defined by decreased NBR values (optical forest disturbance) during the fire event (active fire alert) and stable backscatter values (no radar forest disturbance) throughout and after the fire event. This archetype represents a loss of tree foliage during a fire event with remaining tree structure and accounted for 9.2% of all fire-related forest disturbances.
  • Archetype 6 is defined by decreased NBR values (optical forest disturbance) before the fire event (active fire alert) with stable backscatter values before, throughout and after the fire event (no radar forest disturbance). This archetype represents a loss of tree foliage before a fire event with remaining tree structure and accounted for 8.1% of all fire-related forest disturbances.
  • Archetype 7 is defined by decreased backscatter values (radar forest disturbance) during the fire event (active fire alert) and stable NBR values before, throughout and after the fire event (no optical forest disturbance). This archetype represents a complete loss of tree foliage and structure during a fire event similar to Archetype 2 and accounted for 8.4% of all fire-related forest disturbances.
Concepts for prime examples of the different archetypes are presented by optical and radar time series, their respective detected forest disturbance dates and active fire alerts (Figure 5). Every concept is presented alongside high-resolution optical PlanetScope images, an individual fire-related forest disturbance illustration and colored squares relating to selected phases of the respective fire-related forest disturbance.
Overall numbers show that Archetype 2 was most dominant, then Archetype 3, closely followed by Archetype 1. Similar proportions can be seen in secondary forests (Figure 6). However, in primary forests, Archetype 3 indicates by far the largest area, followed by Archetype 2 and then Archetype 7. In plantation forests the largest area was covered by Archetype 2, similar to the overall result, followed by Archetype 7, with Archetype 3 showing less importance. Occurrences of Archetype 4, 5 and 6 were relatively low (3–9%) across all forest types. Throughout all depicted forest land cover types up to 10% of the area was classified as others and not associated to either one of the main archetypes.
Distinct spatial patterns of the archetypes could be seen for the different forest types (Figure 7). In plantation forests, distinct homogenous areas of different archetypes were visible, regardless of whether the forest disturbance happened before (Archetype 1) or during the fire event (Archetype 2). In natural (primary and secondary) forests, patches of different archetypes were more spatially interspersed. Here, often patterns of strong fire-affected forest (Archetype 2) surrounded by patches of less fire-affected forest (Archetype 3 and 5) were visible. For both natural and plantation forests, forest already degraded or weakened before a fire (Archetype 4) was situated at the edge of forests or as small patches within forests.

4. Discussion

4.1. Forest Disturbance Mapping and Fire Activity

Our results suggest that about 20% of the mapped forest disturbances can be linked to fire activity, which confirms a strong relationship between forest disturbances and fires in Riau [5]. Natural forest (primary and secondary forest) experienced more fire-related forest disturbances than plantation forest, which relates to a decreasing trend of fire usage in plantation forest as a result of enforcement of regulations to ban fire [77]. We found that 5.2% of detected forest disturbances in plantations are still fire-related, which is in agreement with other studies for plantations across Indonesia [78]. Historically fire-related forest disturbances in Indonesia have been mainly associated with a conversion from natural to plantation forest [79]. For counteracting these developments, a nationwide moratorium for regulating land use activities (oil palm plantation, timber plantation and logging activities) in primary forests was established in 2015 [80]. Our results show remaining fire-related forest disturbances in primary forest (9.6%), which could have been either caused by illegal fire use at parcel-to-plantation level and related escaped large-scale forest fires. However, secondary forest representing the majority of today’s natural forest in Riau showed the most fire-related forest disturbances (24.3%), which underlies the importance to also expand the moratorium for secondary forest to protect natural forest and sequence carbon [5,81].
We detected fire-related forest disturbances mainly in smaller forest patches and at the border of forest patches. These areas usually consist of fragmented and less dense forests, which are more vulnerable for forest degradation and extensive forest fires [82]. This edge effect is especially visible for regions with heavy historic deforestation (e.g., Indonesia) [35,83]. Furthermore, we observed no differences between natural and plantation forest relating to findings of an independence between management types and edge effects [84].
Overall, detected optical and radar fire-related forest disturbances showed high producer accuracies (optical: 92.1%; radar: 87.6%), but slightly lower user’s accuracies (optical: 79.5%; radar: 77.5%). Optical forest disturbance maps are affected by less dense time series due to limited availability of cloud-free observations causing omission errors and spectral anomalies due to remaining atmospheric noise or cloud shadow causing commission errors [17,85]. In contrast, radar forest disturbance maps are affected by unnoticed small-scale disturbances in canopy gaps due to SAR’s side-looking nature causing omission errors and fluctuating backscatter values due to changes in canopy and soil moisture causing commission errors [68,86,87,88].
Seventy-two percent of fire-related forest disturbance were mapped in both optical and radar time series. Overall, more fire-related forest disturbances were mapped exclusively in the optical time series (17%) compared to the radar time series (11%), which relates to the sensitivity of optical data to detect subtle changes in tree foliage, which stay-dependent on the wavelength-undetected in radar [38,48,49,50,89]. Sentinel-1 radar data used in this study are operating in C-band wavelength and do not penetrate tropical forest canopies very deeply [89]. Longer-wavelength radar (e.g., L-band-Alos Palsar) are less sensitive to detecting subtle changes in the tree canopy and would have been even better for distinguishing between both changes [50]. However, longer-wavelength radar data were not yet free of charge, available yet or lack high temporal resolution. Follow-up studies should explore the potential of upcoming, openly available and high-temporal detailed long-wavelength radar data from NISAR L-band [90] and BIOMASS P-band mission [91] for characterizing fire-related forest disturbances.
VIIRS active fire alerts have known shortcomings that might have resulted in errors in the co-location of mapped forest disturbance and active fire alerts [92]. Despite its improved spatial resolution (375 m) compared to similar MODIS products (1 km) [70], the difference in spatial resolution in relation to the 30 m multi-sensor optical and radar data and the detection of re-occurring active fire alerts at the same location resulted in overall larger areas of active fire alerts than mapped forest disturbances. Moreover, thermal signals are very short-lived, which makes it impossible to detect past fires and also results in high omission errors of the active fire alerts [28].

4.2. Archetypes of Fire-Related Forest Disturbances

The majority of forest fires in Indonesia are human-induced and utilized by smallholder and commercial agriculture for fire-related land management practices [8,93]. Archetypes 1, 2 and 3 relate to three commonly used fire-related land management practices. The first practice includes fire usage to burn forest directly, which bears a significant economic value for especially smallholder agriculture, as a cost efficient way of land clearing instead of relying on costly machinery [8,94]. This traditionally imbedded and still practiced slash-and-burn agriculture relates to Archetype 2, which showed the highest proportion for plantation, followed by secondary and primary forest [8,95,96,97]. Archetype 2 in plantation forest may refer to rotation cycles (cutting for new replanting), rather than slash-and-burn agriculture [6]. The second practice includes post-forest disturbance fire usage, which aims for preventing secondary growth and introducing a new cultivation after the forest removal [6,35,98]. This complete loss of tree foliage and structure before a fire relates to Archetype 1, showing the highest proportions for secondary forest, followed by plantation and primary forest. The third fire-related land management practice is so-called salvage logging, where trees affected by fire but capable of recovering are logged after the fire event [99]. The complete loss of structure after a fire with initial loss of tree foliage during a fire event is represented by Archetype 3 and was most dominant in primary forest, followed by secondary and plantation forest (Figure 8). It is worth noting that Archetype 3 does not only describe salvage logging but can also indicate a medium severity fire with remaining debris [36].
Recent results suggested the possibility to detect fires used before logging activities-to clear understory—by combining detected forest disturbances and active fire alerts [36]. However, we found that active fire alerts pre-dating mapped forest disturbance were the result of wrongly co-located fire-related forest disturbances caused by the coarse spatial resolution of active fire alerts (375 m) compared to the input data (30 m) (Figure 9).
The archetypes enable us to classify different magnitudes and types of fire-related forest disturbances by utilizing the different sensitivities of optical (subtle tree foliage changes) and radar (larger structural changes) sensors towards changes in the tree cover. High-magnitude fires resulting in a loss of tree foliage and structure (Archetype 2) were mostly observed for plantation forest (36%), which suggests more fire-prone and vulnerable monoculture plantation forest compared to mixed natural forest (primary forest: 23%; secondary forest: 29%) [100,101]. Contrary, medium magnitude fires burning tree foliage with partially affected tree structure or remaining debris (Archetype 3) were mostly located in natural forest (primary and secondary forest: 35/17% vs. plantation forest: 8%). This relates to varying partial burned forest patches in mixed natural forests due to different tree species and ages [35,102,103]. Fast spreading crown fires only burning the tree foliage without a large reduction in structural features (Archetype 5) [104] were mostly located in secondary and plantation forest. Degraded forest completely damaged by a fire, represented by a loss of tree foliage before a fire and a complete loss of structure during the fire (Archetype 4), showed minor differences between forest types [79]. Similarly, degraded forest remaining after a fire, indicated by a loss of tree foliage before a fire with remaining tree structure (Archetype 6), did not show distinct differences for the forest types. Archetype 7 based only on radar forest disturbances represented a loss of tree foliage and structure similar to Archetype 2 and relates to potential omission errors of optical sensors due to persistent cloud coverage or mixed pixels [105].
The explored archetypes are closely linked to specific land management practices and forest types in Riau and likely result in different archetype patterns in other regions [6,35,101]. Follow-up studies should investigate the transferability of the proposed archetypes to other regions.
Different archetypes can be linked to either high, medium and low burn severities. High burn severities describe a complete loss of tree foliage and structure was recorded during the fire (Archetype 2 and 7), medium burn severities describe only individual fire-affected parts of the trees (Archetype 3–5), and low burn severities describe fire only affecting understory, shrubs and bushes (Archetype 1 and 6). Depending on the severity of a fire, varying amounts of GHG are released in the atmosphere, which can be estimated by existing GHG models [12,106]. The potential of combining archetypes with GHG emission models has to be further investigated.
The spatial patterns of archetypes showed distinct borders between homogenous areas of different archetypes in plantation forest relating to the same fire propagation and intensities of monocultures [35,101]. Contrary natural forest showed heterogenous patterns of severely fire-affected archetypes surrounded by less fire-affected archetypes with light or no distinct borders. The patterns relate to variations of fire propagation and intensities in mixed natural forest due to moisture differences of varying tree species and ages [102,103].
The classification of archetypes was based on the temporal relationship of forest disturbances and active fire alerts. In order to reduce errors of omitted intersections of forest disturbances and active fire alerts during periods of missing data, we used a pixel-wise time span rather than the global time span [36]. However, wet seasons showed pixel-wise time spans of on average 72 days for optical time series and introduced potential commission errors of wrongly co-occurring forest disturbances and active fire alerts. Follow-up investigations should introduce a certainty measurement of the archetypes based on the length of their temporal thresholds.
In the absence of suitable ground-based or satellite-based reference data for independently validating the temporal dynamic and complexity of the proposed archetypes, we were only able to validate the forest disturbance maps, which gives only an indication of how accurate the archetypes are. Despite a missing direct validation, a different level of robustness can be associated with the archetypes. Archetypes (1–4) relying on mapped forest disturbances in both optical and radar time series have a strong robustness. Archetypes (5–7) relying only on a mapped forest disturbance in either the optical or radar time series have a weak robustness, as these archetypes might depict potential commission or omission errors of the optical or radar disturbance maps, respectively.

4.3. Implications for Multi-Sensor Forest Monitoring

Recent studies explored the synergistic potential of optical and radar remote sensing data for improved forest disturbance detection [38,50]. The combination of the different data streams was mainly used to achieve higher observation density and to overcome omission errors in either the optical or radar time series due to varying environmental influences. However, we discovered that using sensor-specific sensitivities towards tree cover changes (e.g., optical-tree foliage and C-band radar data-tree structure) allowed us to also characterize forest disturbances beyond a binary detection. Hereby, multi-sensor signals can oppose each other, e.g., a forest disturbance is detected in the optical but not the radar time series. That in return does not necessarily depict an omission error of the radar forest disturbance detection but shows a disturbance affecting only the tree foliage (e.g., crown fire). Archetypes 1–6 are examples for describing varying parts of the forest affected by fire depending on the mapped forest disturbance date in either time series. Thus, a delayed or missed forest disturbance detection in either time series is not only caused by environmental influences but can give valuable information on what part of the tree is affected by a disturbance. Future forest monitoring studies should, therefore, consider that a straightforward combination of optical and radar observations on a data level potentially introduces artefacts.

5. Conclusions

This study explored archetypes of fire-related forest disturbances derived from dense multi-sensor optical and radar satellite time series and active fire alerts. The archetypes represent the temporal relationship of detected optical and radar-based forest disturbances with active fire alerts and relate to fire-related forest and land use management practices and constitute a novel approach for burn severity mapping. Archetype-based burn severities might function as a proxy to improve existing GHG emission models. Archetypes can give more temporally and spatially detailed insights into fire-related forest disturbances, which can support policy development, local and regional forest management and law enforcement to reduce illegal fire usage in the tropics. This study emphasized the unprecedented value of openly available dense Landsat/Sentinel-2 optical and Sentinel-1 radar time series for characterizing fire-related forest disturbances. The integration of dense optical and radar satellite data with vertical forest structure information form GEDI, and upcoming long-wavelength radar missions (NISAR: L-band and Biomass mission: P-band) promises to further study how fire activities and forest disturbances are related.

Author Contributions

Conceptualization, J.B., J.R., J.V. and M.H.; methodology, J.B., J.R. and J.V.; validation, J.B.; investigation, J.B.; writing—original draft preparation, J.B.; writing—review and editing, J.R., V.D.S. and M.H.; visualization, J.B.; supervision, J.R., J.V., V.D.S. and M.H.; project administration, J.R. and J.V.; funding acquisition, J.V., J.R. and M.H. All authors have read and agreed to the published version of the manuscript.

Funding

This research was funded via the STW Big-EO-Analytics project funded by Nederlandse Organisatie voor Wetenschappelijk Onderzoek (NWO).

Data Availability Statement

The data and results of this study are available upon reasonable request. Please contact the main author of this publication.

Acknowledgments

Valuable feedback and input was given from the User Committee within the Big-EO-Analytics project, which helped improving and finalizing this research. This study contains modified Copernicus Sentinel-1 and Sentinel-2 data [2015–2020]. Planet data were provided through the Planet ambassador program. We thank the two anonymous reviewers for their valuable comments.

Conflicts of Interest

The authors declare no conflict of interest. The funders had no role in the design of the study; in the collection, analyses or interpretation of data; in the writing of the manuscript or in the decision to publish the results.

References

  1. Harris, N.L.; Gibbs, D.A.; Baccini, A.; Birdsey, R.A.; de Bruin, S.; Farina, M.; Fatoyinbo, L.; Hansen, M.C.; Herold, M.; Houghton, R.A.; et al. Global maps of twenty-first century forest carbon fluxes. Nat. Clim. Chang. 2021, 11, 234–240. [Google Scholar] [CrossRef]
  2. Henriques, S.T.; Borowiecki, K.J. The drivers of long-run CO2 emissions in Europe, North America and Japan since 1800. Energy Policy 2017, 101, 537–549. [Google Scholar] [CrossRef]
  3. Margono, B.A.; Potapov, P.V.; Turubanova, S.; Stolle, F.; Hansen, M.C. Primary forest cover loss in Indonesia over 2000–2012. Nat. Clim. Chang. 2014, 4, 730–735. [Google Scholar] [CrossRef]
  4. Pramudya, E.P.; Hospes, O.; Termeer, C.J.A.M. The disciplining of illegal palm oil plantations in Sumatra. Third World Q. 2018, 39, 920–940. [Google Scholar] [CrossRef] [Green Version]
  5. Adrianto, H.A.; Spracklen, D.V.; Arnold, S.R.; Sitanggang, I.S.; Syaufina, L. Forest and Land Fires Are Mainly Associated with Deforestation in Riau Province, Indonesia. Remote Sens. 2019, 12, 3. [Google Scholar] [CrossRef] [Green Version]
  6. Dennis, R.A.; Mayer, J.; Applegate, G.; Chokkalingam, U.; Colfer, C.J.P.; Kurniawan, I.; Lachowski, H.; Maus, P.; Permana, R.P.; Ruchiat, Y.; et al. Fire, People and Pixels: Linking Social Science and Remote Sensing to Understand Underlying Causes and Impacts of Fires in Indonesia. Hum. Ecol. 2005, 33, 465–504. [Google Scholar] [CrossRef]
  7. Fernández-García, V.; Santamarta, M.; Fernández-Manso, A.; Quintano, C.; Marcos, E.; Calvo, L. Burn severity metrics in fire-prone pine ecosystems along a climatic gradient using Landsat imagery. Remote Sens. Environ. 2018, 206, 205–217. [Google Scholar] [CrossRef]
  8. Purnomo, H.; Shantiko, B.; Sitorus, S.; Gunawan, H.; Achdiawan, R.; Kartodihardjo, H.; Dewayani, A.A. Fire economy and actor network of forest and land fires in Indonesia. For. Policy Econ. 2017, 78, 21–31. [Google Scholar] [CrossRef]
  9. Lohberger, S.; Stängel, M.; Atwood, E.C.; Siegert, F. Spatial evaluation of Indonesia’s 2015 fire-affected area and estimated carbon emissions using Sentinel-1. Glob. Chang. Biol. 2017, 24, 644–654. [Google Scholar] [CrossRef]
  10. Bär, A.; Michaletz, S.T.; Mayr, S. Fire effects on tree physiology. New Phytol. 2019, 223, 1728–1741. [Google Scholar] [CrossRef] [Green Version]
  11. Houghton, R.A.; House, J.I.; Pongratz, J.; Van Der Werf, G.R.; DeFries, R.S.; Hansen, M.C.; Le Quéré, C.; Ramankutty, N. Carbon emissions from land use and land-cover change. Biogeosciences 2012, 9, 5125–5142. [Google Scholar] [CrossRef] [Green Version]
  12. Van Der Werf, G.R.; Randerson, J.T.; Giglio, L.; Van Leeuwen, T.T.; Chen, Y.; Rogers, B.M.; Mu, M.; Van Marle, M.J.E.; Morton, D.C.; Collatz, G.J.; et al. Global fire emissions estimates during 1997–2016. Earth Syst. Sci. Data 2017, 9, 697–720. [Google Scholar] [CrossRef] [Green Version]
  13. Asner, G.P. Painting the world REDD: Addressing scientific barriers to monitoring emissions from tropical forests. Environ. Res. Lett. 2011, 6, 024005. [Google Scholar] [CrossRef]
  14. United Nations. Adoption of the Paris Agreement; United Nations: New York, NY, USA, 2015. [Google Scholar]
  15. Margono, B.A.; Usman, A.B.; Sugardiman, R.A. Indonesia’s Forest Resource Monitoring. Indones. J. Geogr. 2016, 48, 7. [Google Scholar] [CrossRef]
  16. Liu, T.; Mickley, L.J.; Marlier, M.E.; DeFries, R.S.; Khan, M.F.; Latif, M.T.; Karambelas, A. Diagnosing spatial biases and uncertainties in global fire emissions inventories: Indonesia as regional case study. Remote Sens. Environ. 2020, 237, 111557. [Google Scholar] [CrossRef]
  17. De Sy, V.; Herold, M.; Achard, F.; Asner, G.P.; Held, A.; Kellndorfer, J.; Verbesselt, J. Synergies of multiple remote sensing data sources for REDD+ monitoring. Curr. Opin. Environ. Sustain. 2012, 4, 696–706. [Google Scholar] [CrossRef]
  18. Hansen, M.C.; Loveland, T.R. A review of large area monitoring of land cover change using Landsat data. Remote Sens. Environ. 2012, 122, 66–74. [Google Scholar] [CrossRef]
  19. Nguyen, T.H.; Jones, S.D.; Soto-Berelov, M.; Haywood, A.; Hislop, S. A spatial and temporal analysis of forest dynamics using Landsat time-series. Remote Sens. Environ. 2018, 217, 461–475. [Google Scholar] [CrossRef]
  20. Verbesselt, J.; Zeileis, A.; Herold, M. Near real-time disturbance detection using satellite image time series. Remote Sens. Environ. 2012, 123, 98–108. [Google Scholar] [CrossRef]
  21. Zhu, Z.; Woodcock, C.E. Continuous change detection and classification of land cover using all available Landsat data. Remote Sens. Environ. 2014, 144, 152–171. [Google Scholar] [CrossRef] [Green Version]
  22. Arnett, J.T.T.R.; Coops, N.C.; Daniels, L.D.; Falls, R.W. Detecting forest damage after a low-severity fire using remote sensing at multiple scales. Int. J. Appl. Earth Obs. Geoinf. 2015, 35, 239–246. [Google Scholar] [CrossRef]
  23. Griffiths, P.; Nendel, C.; Hostert, P. Intra-annual reflectance composites from Sentinel-2 and Landsat for national-scale crop and land cover mapping. Remote Sens. Environ. 2019, 220, 135–151. [Google Scholar] [CrossRef]
  24. Parks, S.; Dillon, G.; Miller, C. A New Metric for Quantifying Burn Severity: The Relativized Burn Ratio. Remote Sens. 2014, 6, 1827–1844. [Google Scholar] [CrossRef] [Green Version]
  25. Roteta, E.; Bastarrika, A.; Padilla, M.; Storm, T.; Chuvieco, E. Development of a Sentinel-2 burned area algorithm: Generation of a small fire database for sub-Saharan Africa. Remote Sens. Environ. 2019, 222, 1–17. [Google Scholar] [CrossRef]
  26. Wittke, S.; Yu, X.; Karjalainen, M.; Hyyppä, J.; Puttonen, E. Comparison of two-dimensional multitemporal Sentinel-2 data with three-dimensional remote sensing data sources for forest inventory parameter estimation over a boreal forest. Int. J. Appl. Earth Obs. Geoinf. 2019, 76, 167–178. [Google Scholar] [CrossRef]
  27. Blackett, M. An initial comparison of the thermal anomaly detection products of MODIS and VIIRS in their observation of Indonesian volcanic activity. Remote Sens. Environ. 2015, 171, 75–82. [Google Scholar] [CrossRef] [Green Version]
  28. Schroeder, W.; Giglio, L. Visible Infrared Imaging Radiometer Suite (VIIRS) 375 m & 750 m Active Fire Detection Data Sets Based on NASA VIIRS Land Science Investigator Processing System (SIPS) Reprocessed Data—Version 1 Product User’s Guide Version 1. 2017; NASA: Washington, DC, USA, 2017.
  29. Franco, M.G.; Mundo, I.A.; Veblen, T.T. Field-Validated Burn-Severity Mapping in North Patagonian Forests. Remote Sens. 2020, 12, 214. [Google Scholar] [CrossRef] [Green Version]
  30. Gibson, R.; Danaher, T.; Hehir, W.; Collins, L. A remote sensing approach to mapping fire severity in south-eastern Australia using sentinel 2 and random forest. Remote Sens. Environ. 2020, 240, 111702. [Google Scholar] [CrossRef]
  31. Roy, D.P.; Huang, H.; Boschetti, L.; Giglio, L.; Yan, L.; Zhang, H.H.; Li, Z. Landsat-8 and Sentinel-2 burned area mapping—A combined sensor multi-temporal change detection approach. Remote Sens. Environ. 2019, 231, 111254. [Google Scholar] [CrossRef]
  32. Yin, C.; He, B.; Yebra, M.; Quan, X.; Edwards, A.C.; Liu, X.; Liao, Z. Improving burn severity retrieval by integrating tree canopy cover into radiative transfer model simulation. Remote Sens. Environ. 2020, 236, 111454. [Google Scholar] [CrossRef]
  33. Miettinen, J.; Shi, C.; Liew, S.C. Fire Distribution in Peninsular Malaysia, Sumatra and Borneo in 2015 with Special Emphasis on Peatland Fires. Environ. Manag. 2017, 60, 747–757. [Google Scholar] [CrossRef]
  34. Schroeder, T.A.; Wulder, M.A.; Healey, S.P.; Moisen, G.G. Mapping wildfire and clearcut harvest disturbances in boreal forests with Landsat time series data. Remote Sens. Environ. 2011, 115, 1421–1433. [Google Scholar] [CrossRef]
  35. Nikonovas, T.; Spessa, A.; Doerr, S.H.; Clay, G.D.; Mezbahuddin, S. Near-complete loss of fire-resistant primary tropical forest cover in Sumatra and Kalimantan. Commun. Earth Environ. 2020, 1, 65. [Google Scholar] [CrossRef]
  36. Reiche, J.; Verhoeven, R.; Verbesselt, J.; Hamunyela, E.; Wielaard, N.; Herold, M. Characterizing Tropical Forest Cover Loss Using Dense Sentinel-1 Data and Active Fire Alerts. Remote Sens. 2018, 10, 777. [Google Scholar] [CrossRef] [Green Version]
  37. Baumann, M.; Levers, C.; Macchi, L.; Bluhm, H.; Waske, B.; Gasparri, N.I.; Kuemmerle, T. Mapping continuous fields of tree and shrub cover across the Gran Chaco using Landsat 8 and Sentinel-1 data. Remote Sens. Environ. 2018, 216, 201–211. [Google Scholar] [CrossRef]
  38. Reiche, J.; Hamunyela, E.; Verbesselt, J.; Hoekman, D.; Herold, M. Improving near-real time deforestation monitoring in tropical dry forests by combining dense Sentinel-1 time series with Landsat and ALOS-2 PALSAR-2. Remote Sens. Environ. 2018, 204, 147–161. [Google Scholar] [CrossRef]
  39. Huang, W.; Sun, G.; Ni, W.; Zhang, Z.; Dubayah, R. Sensitivity of Multi-Source SAR Backscatter to Changes in Forest Aboveground Biomass. Remote Sens. 2015, 7, 9587–9609. [Google Scholar] [CrossRef] [Green Version]
  40. Carreiras, J.M.B.; Jones, J.; Lucas, R.M.; Shimabukuro, Y.E. Mapping major land cover types and retrieving the age of secondary forests in the Brazilian Amazon by combining single-date optical and radar remote sensing data. Remote Sens. Environ. 2017, 194, 16–32. [Google Scholar] [CrossRef] [Green Version]
  41. Belenguer-Plomer, M.A.; Tanase, M.A.; Fernandez-Carrillo, A.; Chuvieco, E. Burned area detection and mapping using Sentinel-1 backscatter coefficient and thermal anomalies. Remote Sens. Environ. 2019, 233, 111345. [Google Scholar] [CrossRef]
  42. Heckel, K.; Urban, M.; Schratz, P.; Mahecha, M.; Schmullius, C. Predicting Forest Cover in Distinct Ecosystems: The Potential of Multi-Source Sentinel-1 and -2 Data Fusion. Remote Sens. 2020, 12, 302. [Google Scholar] [CrossRef] [Green Version]
  43. Lehmann, E.A.; Caccetta, P.; Lowell, K.; Mitchell, A.; Zhou, Z.-S.; Held, A.; Milne, T.; Tapley, I. SAR and optical remote sensing: Assessment of complementarity and interoperability in the context of a large-scale operational forest monitoring system. Remote Sens. Environ. 2015, 156, 335–348. [Google Scholar] [CrossRef]
  44. Reiche, J.; Verbesselt, J.; Hoekman, D.; Herold, M. Fusing Landsat and SAR time series to detect deforestation in the tropics. Remote Sens. Environ. 2015, 156, 276–293. [Google Scholar] [CrossRef]
  45. Reiche, J.; Lucas, R.; Mitchell, A.L.; Verbesselt, J.; Hoekman, D.H.; Haarpaintner, J.; Kellndorfer, J.M.; Rosenqvist, A.; Lehmann, E.A.; Woodcock, C.E.; et al. Combining satellite data for better tropical forest monitoring. Nat. Clim. Chang. 2016, 6, 120–122. [Google Scholar] [CrossRef]
  46. Stroppiana, D.; Azar, R.; Calò, F.; Pepe, A.; Imperatore, P.; Boschetti, M.; Silva, J.; Brivio, P.; Lanari, R. Integration of Optical and SAR Data for Burned Area Mapping in Mediterranean Regions. Remote Sens. 2015, 7, 1320–1345. [Google Scholar] [CrossRef] [Green Version]
  47. Tanase, M.A.; Belenguer-Plomer, M.A.; Roteta, E.; Bastarrika, A.; Wheeler, J.; Fernández-Carrillo, Á.; Tansey, K.; Wiedemann, W.; Navratil, P.; Lohberger, S.; et al. Burned Area Detection and Mapping: Intercomparison of Sentinel-1 and Sentinel-2 Based Algorithms over Tropical Africa. Remote Sens. 2020, 12, 334. [Google Scholar] [CrossRef] [Green Version]
  48. Tanase, M.A.; Santoro, M.; De La Riva, J.; Prez-Cabello, F.; Le Toan, T. Sensitivity of X-, C-, and L-Band SAR Backscatter to Burn Severity in Mediterranean Pine Forests. IEEE Trans. Geosci. Remote Sens. 2010, 48, 3663–3675. [Google Scholar] [CrossRef]
  49. Pontius, J.; Schaberg, P.; Hanavan, R. Remote Sensing for Early, Detailed, and Accurate Detection of Forest Disturbance and Decline for Protection of Biodiversity. In Remote Sensing of Plant Biodiversity; Cavender-Bares, J., Gamon, J., Townsend, P., Eds.; Springer: Cham, Switzerland, 2020; ISBN 978-3-030-33156-6. [Google Scholar]
  50. Hirschmugl, M.; Deutscher, J.; Sobe, C.; Bouvet, A.; Mermoz, S.; Schardt, M. Use of SAR and Optical Time Series for Tropical Forest Disturbance Mapping. Remote Sens. 2020, 12, 727. [Google Scholar] [CrossRef] [Green Version]
  51. Adrianto, H.A.; Spracklen, D.V.; Arnold, S.R. Relationship Between Fire and Forest Cover Loss in Riau Province, Indonesia Between 2001 and 2012. Forests 2019, 10, 889. [Google Scholar] [CrossRef] [Green Version]
  52. Hansen, M.C.; Potapov, P.V.; Moore, R.; Hancher, M.; Turubanova, S.A.; Tyukavina, A.; Thau, D.; Stehman, S.V.; Goetz, S.J.; Loveland, T.R.; et al. High-resolution global maps of 21st-century forest cover change. Science 2013, 342, 850–853. [Google Scholar] [CrossRef] [Green Version]
  53. Indonesian Ministry of Environment & Forestry Land Cover 2017 Indonesia. Available online: https://data.globalforestwatch.org/datasets/b1126d52d6c5416496339aeb250d9b39 (accessed on 10 May 2020).
  54. European Space Agency (ESA). Sentinel-1: ESA’s Radar Observatory Mission for GMES Operational Services; ESA Communications: Noordwijk, The Netherlands, 2012. [Google Scholar]
  55. European Space Agency (ESA). SENTINEL-2 User Handbook; 1.0.; European Space Agency: Paris, France, 2015. [Google Scholar]
  56. United States Geological Survey (USGS). Landsat 7 (L7) Data Users Handbook; 2.0.; U.S. Geological Survey: Reston, VA, USA, 2019.
  57. United States Geological Survey (USGS). Landsat 8 (L8) Data Users Handbook; 5.0.; U.S. Geological Survey: Reston, VA, USA, 2019.
  58. Planet Team Planet Application Program Interface: In Space for Life on Earth Online. Available online: https://api.planet.com (accessed on 20 November 2020).
  59. White, J.C.; Wulder, M.A.; Hermosilla, T.; Coops, N.C.; Hobart, G.W. A nationwide annual characterization of 25 years of forest disturbance and recovery for Canada using Landsat time series. Remote Sens. Environ. 2017, 194, 303–321. [Google Scholar] [CrossRef]
  60. Foga, S.; Scaramuzza, P.L.; Guo, S.; Zhu, Z.; Dilley, R.D.; Beckmann, T.; Schmidt, G.L.; Dwyer, J.L.; Joseph Hughes, M.; Laue, B. Cloud detection algorithm comparison and validation for operational Landsat data products. Remote Sens. Environ. 2017, 194, 379–390. [Google Scholar] [CrossRef] [Green Version]
  61. United States Geological Survey (USGS). Landsat 4–7 Collection 1 (C1) Surface Reflectance (LEDAPS) Product Guide; 3.0.; U.S. Geological Survey: Reston, VA, USA, 2020.
  62. Gorelick, N.; Hancher, M.; Dixon, M.; Ilyushchenko, S.; Thau, D.; Moore, R. Google Earth Engine: Planetary-scale geospatial analysis for everyone. Remote Sens. Environ. 2017, 202, 18–27. [Google Scholar] [CrossRef]
  63. Yin, F.; Lewis, P.; Gomez-Dans, J.; Wu, Q. A sensor-invariant atmospheric correction method: Application to Sentinel-2/MSI and Landsat 8/OLI. Prep 2021, 1–42. [Google Scholar] [CrossRef] [Green Version]
  64. Schmitt, M.; Hughes, L.H.; Qiu, C.; Zhu, X.X. SEN12MS—A Curated Dataset of Georeferenced Multi-Spectral Sentinel-1/2 Imahery for Deep Learning and Data Fusion. ISPRS Ann. Photogramm. Remote Sens. Spat. Inf. Sci. 2019, IV-2/W7, 153–160. [Google Scholar] [CrossRef] [Green Version]
  65. Hamunyela, E.; Verbesselt, J.; Herold, M. Using spatial context to improve early detection of deforestation from Landsat time series. Remote Sens. Environ. 2016, 172, 126–138. [Google Scholar] [CrossRef]
  66. Reiche, J.; Mullissa, A.; Slagter, B.; Gou, Y.; Tsendbazar, N.-E.; Odongo-Braun, C.; Vollrath, A.; Weisse, M.J.; Stolle, F.; Pickens, A.; et al. Forest disturbance alerts for the Congo Basin using Sentinel-1. Environ. Res. Lett. 2021, 16, 024005. [Google Scholar] [CrossRef]
  67. Google Earth Engine Team Sentinel-1 Algorithms: Sentinel-1 Preprocessing. Available online: https://developers.google.com/earth-engine/guides/sentinel1 (accessed on 29 January 2021).
  68. Vollrath, A.; Mullissa, A.; Reiche, J. Angular-Based Radiometric Slope Correction for Sentinel-1 on Google Earth Engine. Remote Sens. 2020, 12, 1867. [Google Scholar] [CrossRef]
  69. Quegan, S.; Yu, J.J. Filtering of multichannel SAR images. IEEE Trans. Geosci. Remote Sens. 2001, 39, 2373–2379. [Google Scholar] [CrossRef]
  70. Schroeder, W.; Oliva, P.; Giglio, L.; Csiszar, I.A. The New VIIRS 375m active fire detection data product: Algorithm description and initial assessment. Remote Sens. Environ. 2014, 143, 85–96. [Google Scholar] [CrossRef]
  71. Giglio, L.; Loboda, T.; Roy, D.P.; Quayle, B.; Justice, C.O. An active-fire based burned area mapping algorithm for the MODIS sensor. Remote Sens. Environ. 2009, 113, 408–420. [Google Scholar] [CrossRef]
  72. Olofsson, P.; Arévalo, P.; Espejo, A.B.; Green, C.; Lindquist, E.; McRoberts, R.E.; Sanz, M.J. Mitigating the effects of omission errors on area and area change estimates. Remote Sens. Environ. 2020, 236, 111492. [Google Scholar] [CrossRef]
  73. Stehman, S.V.; Wickham, J.; Smith, J.H.; Yang, L. Thematic accuracy of the 1992 National Land-Cover Data for the eastern United States: Statistical methodology and regional results. Remote Sens. Environ. 2003, 86, 500–516. [Google Scholar] [CrossRef]
  74. Olofsson, P.; Foody, G.M.; Herold, M.; Stehman, S.V.; Woodcock, C.E.; Wulder, M.A. Good practices for estimating area and assessing accuracy of land change. Remote Sens. Environ. 2014, 148, 42–57. [Google Scholar] [CrossRef]
  75. Hansen, M.C.; Krylov, A.; Tyukavina, A.; Potapov, P.V.; Turubanova, S.; Zutta, B.; Ifo, S.; Margono, B.; Stolle, F.; Moore, R. Humid tropical forest disturbance alerts using Landsat data. Environ. Res. Lett. 2016, 11, 034008. [Google Scholar] [CrossRef]
  76. Normile, D. Indonesia’s fires are bad, but new measures prevented them from becoming worse. Science 2019. [Google Scholar] [CrossRef]
  77. Noojipady, P.; Morton, D.C.; Schroeder, W.; Carlson, K.M.; Huang, C.; Gibbs, H.K.; Burns, D.; Walker, N.F.; Prince, S.D. Managing fire risk during drought: The influence of certification and El Niño on fire-driven forest conversion for oil palm in Southeast Asia. Earth Syst. Dyn. 2017, 8, 749–771. [Google Scholar] [CrossRef] [Green Version]
  78. Carlson, K.M.; Heilmayr, R.; Gibbs, H.K.; Noojipady, P.; Burns, D.N.; Morton, D.C.; Walker, N.F.; Paoli, G.D.; Kremen, C. Effect of oil palm sustainability certification on deforestation and fire in Indonesia. Proc. Natl. Acad. Sci. USA 2018, 115, 121–126. [Google Scholar] [CrossRef] [Green Version]
  79. Sloan, S.; Locatelli, B.; Wooster, M.J.; Gaveau, D.L.A. Fire activity in Borneo driven by industrial land conversion and drought during El Niño periods, 1982–2010. Glob. Environ. Chang. 2017, 47, 95–109. [Google Scholar] [CrossRef] [Green Version]
  80. Busch, J.; Ferretti-Gallon, K.; Engelmann, J.; Wright, M.; Austin, K.G.; Stolle, F.; Turubanova, S.; Potapov, P.V.; Margono, B.; Hansen, M.C.; et al. Reductions in emissions from deforestation from Indonesia’s moratorium on new oil palm, timber, and logging concessions. Proc. Natl. Acad. Sci. USA 2015, 112, 1328–1333. [Google Scholar] [CrossRef] [PubMed] [Green Version]
  81. Chazdon, R.L.; Broadbent, E.N.; Rozendaal, D.M.A.; Bongers, F.; Zambrano, A.M.A.; Aide, T.M.; Balvanera, P.; Becknell, J.M.; Boukili, V.; Brancalion, P.H.S.; et al. Carbon sequestration potential of second-growth forest regeneration in the Latin American tropics. Sci. Adv. 2016, 2, e1501639. [Google Scholar] [CrossRef] [PubMed] [Green Version]
  82. Numata, I.; Silva, S.S.; Cochrane, M.A.; D’Oliveira, M.V.N. Fire and edge effects in a fragmented tropical forest landscape in the southwestern Amazon. For. Ecol. Manag. 2017, 401, 135–146. [Google Scholar] [CrossRef] [Green Version]
  83. Miettinen, J.; Hooijer, A.; Shi, C.; Tollenaar, D.; Vernimmen, R.; Liew, S.C.; Malins, C.; Page, S.E. Extent of industrial plantations on Southeast Asian peatlands in 2010 with analysis of historical expansion and future projections. GCB Bioenergy 2012, 4, 908–918. [Google Scholar] [CrossRef] [Green Version]
  84. Armenteras, D.; González, T.M.; Retana, J. Forest fragmentation and edge influence on fire occurrence and intensity under different management types in Amazon forests. Biol. Conserv. 2013, 159, 73–79. [Google Scholar] [CrossRef]
  85. Hamunyela, E.; Reiche, J.; Verbesselt, J.; Herold, M. Using Space-Time Features to Improve Detection of Forest Disturbances from Landsat Time Series. Remote Sens. 2017, 9, 515. [Google Scholar] [CrossRef] [Green Version]
  86. Doblas, J.; Shimabukuro, Y.; Sant’Anna, S.; Carneiro, A.; Aragão, L.; Almeida, C. Optimizing Near Real-Time Detection of Deforestation on Tropical Rainforests Using Sentinel-1 Data. Remote Sens. 2020, 12, 3922. [Google Scholar] [CrossRef]
  87. Danklmayer, A.; Doring, B.J.; Schwerdt, M.; Chandra, M. Assessment of Atmospheric Propagation Effects in SAR Images. IEEE Trans. Geosci. Remote Sens. 2009, 47, 3507–3518. [Google Scholar] [CrossRef]
  88. Hoekman, D.; Kooij, B.; Quiñones, M.; Vellekoop, S.; Carolita, I.; Budhiman, S.; Arief, R.; Roswintiarti, O. Wide-Area Near-Real-Time Monitoring of Tropical Forest Degradation and Deforestation Using Sentinel-1. Remote Sens. 2020, 12, 3263. [Google Scholar] [CrossRef]
  89. Bouvet, A.; Mermoz, S.; Ballère, M.; Koleck, T.; Le Toan, T. Use of the SAR Shadowing Effect for Deforestation Detection with Sentinel-1 Time Series. Remote Sens. 2018, 10, 1250. [Google Scholar] [CrossRef] [Green Version]
  90. NASA. NASA-ISRO SAR (NISAR) Mission Science Users’ Handbook; NASA: Washington, DC, USA, 2018.
  91. ESA. Biomass—Report for Mission Selection: An Earth Explorer to Observe Forest Biomass; ESA Communications: Oakville, ON, Canada, 2012. [Google Scholar]
  92. Fanin, T.; Van Der Werf, G.R. Relationships between burned area, forest cover loss, and land cover change in the Brazilian Amazon based on satellite data. Biogeosciences 2015, 12, 6033–6043. [Google Scholar] [CrossRef] [Green Version]
  93. Gaveau, D.L.A.; Sloan, S.; Molidena, E.; Yaen, H.; Sheil, D.; Abram, N.K.; Ancrenaz, M.; Nasi, R.; Quinones, M.; Wielaard, N.; et al. Four Decades of Forest Persistence, Clearance and Logging on Borneo. PLoS ONE 2014, 9, 1–11. [Google Scholar] [CrossRef] [Green Version]
  94. Fernández-García, V.; Quintano, C.; Taboada, A.; Marcos, E.; Calvo, L.; Fernández-Manso, A. Remote Sensing Applied to the Study of Fire Regime Attributes and Their Influence on Post-Fire Greenness Recovery in Pine Ecosystems. Remote Sens. 2018, 10, 733. [Google Scholar] [CrossRef] [Green Version]
  95. Page, S.E.; Hooijer, A. In the line of fire: The peatlands of Southeast Asia. Philos. Trans. R. Soc. B Biol. Sci. 2016, 371, 20150176. [Google Scholar] [CrossRef] [PubMed] [Green Version]
  96. Suyanto, S.; Applegate, G.; Permana, R.P.; Khususiyah, N.; Kurniawan, I. The Role of Fire in Changing Land Use and Livelihoods in Riau-Sumatra. Ecol. Soc. 2004, 9, art15. [Google Scholar] [CrossRef]
  97. Varma, A. The economics of slash and burn: A case study of the 1997–1998 Indonesian forest fires. Ecol. Econ. 2003, 46, 159–171. [Google Scholar] [CrossRef]
  98. Gaveau, D.L.A.; Salim, M.A.; Hergoualc’H, K.; Locatelli, B.; Sloan, S.; Wooster, M.; Marlier, M.E.; Molidena, E.; Yaen, H.; DeFries, R.; et al. Major atmospheric emissions from peat fires in Southeast Asia during non-drought years: Evidence from the 2013 Sumatran fires. Sci. Rep. 2015, 4, 6112. [Google Scholar] [CrossRef] [Green Version]
  99. Lewis, S.A.; Robichaud, P.R.; Hudak, A.T.; Austin, B.; Liebermann, R.J. Utility of Remotely Sensed Imagery for Assessing the Impact of Salvage Logging after Forest Fires. Remote Sens. 2012, 4, 2112–2132. [Google Scholar] [CrossRef] [Green Version]
  100. Zald, H.S.J.; Dunn, C.J. Severe fire weather and intensive forest management increase fire severity in a multi-ownership landscape. Ecol. Appl. 2018, 28, 1068–1080. [Google Scholar] [CrossRef] [PubMed]
  101. Liu, C.L.C.; Kuchma, O.; Krutovsky, K.V. Mixed-species versus monocultures in plantation forestry: Development, benefits, ecosystem services and perspectives for the future. Glob. Ecol. Conserv. 2018, 15, e00419. [Google Scholar] [CrossRef]
  102. Saulino, L.; Rita, A.; Migliozzi, A.; Maffei, C.; Allevato, E.; Garonna, A.P.; Saracino, A. Detecting Burn Severity across Mediterranean Forest Types by Coupling Medium-Spatial Resolution Satellite Imagery and Field Data. Remote Sens. 2020, 12, 741. [Google Scholar] [CrossRef] [Green Version]
  103. DellaSala, D.A.; Hanson, C.T. The Ecological Importance of Mixed-Severity Fires: Nature’s Phoenix; Elsevier: New York, NY, USA, 2015. [Google Scholar]
  104. Arellano-Pérez, S.; Castedo-Dorado, F.; López-Sánchez, C.; González-Ferreiro, E.; Yang, Z.; Díaz-Varela, R.; Álvarez-González, J.; Vega, J.; Ruiz-González, A. Potential of Sentinel-2A Data to Model Surface and Canopy Fuel Characteristics in Relation to Crown Fire Hazard. Remote Sens. 2018, 10, 1645. [Google Scholar] [CrossRef] [Green Version]
  105. Foschi, P.G. A geometric approach to a mixed pixel problem: Detecting subpixel woody vegetation. Remote Sens. Environ. 1994, 50, 317–327. [Google Scholar] [CrossRef]
  106. Prosperi, P.; Bloise, M.; Tubiello, F.N.; Conchedda, G.; Rossi, S.; Boschetti, L.; Salvatore, M.; Bernoux, M. New estimates of greenhouse gas emissions from biomass burning and peat fires using MODIS Collection 6 burned areas. Clim. Chang. 2020, 161, 415–432. [Google Scholar] [CrossRef] [Green Version]
Figure 1. Forest types in the province of Riau (Indonesia) for 2017 [53].
Forests 12 00456 g001
Figure 2. Flowchart for classifying archetypes of fire-related forest disturbances.
Forests 12 00456 g002
Figure 3. Forest disturbances without co-occurring active fire alerts (grey) and forest disturbances with co-occurring fire alerts: optical-only (blue), radar-only (orange), both signals (green) [%].
Forests 12 00456 g003
Figure 4. Monthly totals of co-located forest disturbances and active fire alerts represented by area of optical and radar forest disturbances and active fire alerts for each month of the monitoring period. Note: different value ranges for areas of mapped forest disturbances and active fire alerts.
Forests 12 00456 g004
Figure 5. Concepts of prime examples for Archetype 1 (a), Archetype 2 (b), Archetype 3 (c), Archetype 4 (d), Archetype 5 (e), Archetype 6 (f) and Archetype 7 (g).
Forests 12 00456 g005aForests 12 00456 g005b
Figure 6. Proportional area of archetypes of fire-related forest disturbances for primary, secondary and plantation forest.
Forests 12 00456 g006
Figure 7. Map of archetypes of fire-related forest disturbances for the province of Riau (Indonesia).
Forests 12 00456 g007
Figure 8. Time series of Planet data, Sentinel-1 VH and VV backscatter values, NBR values and active fire alerts for post-fire detected forest disturbances in both signals. Forest disturbance illustration depicts different stages of salvage logging: green—intact forest, red—fire event, blue—remaining tree structure and orange—logging of remaining tree structure.
Forests 12 00456 g008
Figure 9. Time series of Planet data, Sentinel-1 VH and VV backscatter values, NBR values and active fire alerts for post-fire detected forest disturbances in both signals. Green indicates the status of an intact forest, red the fire event and orange the actual forest disturbance.
Forests 12 00456 g009
Table 1. Overview input data.
Satellite/SensorSpatial
Resolution
Temporal
Resolution
Temporal
Coverage
Reference
Satellite data/Fire product
Radar dataSentinel-120 m6 days1 January 2015–
31 December 2019
[54]
Optical dataSentinel-210/20/60 m5 days1 January 2015–
31 March 2020
[55]
Landsat-730 m16 days1 January 2015–
31 March 2020
[56]
Landsat-830 m16 days1 January 2015–
31 March 2020
[57]
Active fire alertsS-NPP/
VIIRS
375 mtwice-daily1 January 2018–
31 December 2019
[28]
Forest baseline map
Land coverLandsat30 m-2017[53]
Tree cover 2000Landsat30 m-2000[52]
Annual tree cover lossLandsat30 mannual2001–2017[52]
Reference data optical forest disturbance map
Optical dataPlanetScope5 mMultiple per year2009–present[58]
Table 2. Temporal relationship of mapped optical and radar forest disturbance dates with respect to dates of active fire alerts for classifying the archetypes. Areas are given as proportions of all detected fire-related forest disturbances.
Optical Forest DisturbanceRadar Forest DisturbanceArea [%]
Archetype 1Predating active fire alertPredating active fire alert11.8
Archetype 2Coinciding active fire alertCoinciding active fire alert29.1
Archetype 3Coinciding active fire alertPostdating active fire alert17.3
Archetype 4Predating active fire alertCoinciding active fire alert6.7
Archetype 5Coinciding active fire alertNo detection9.2
Archetype 6Predating active fire alertNo detection8.1
Archetype 7No detectionCoinciding active fire alert8.4
OthersPredating active fire alertPostdating active fire alert3.0
No detectionPredating active fire alert2.7
Coinciding active fire alertPredating active fire alert2.4
Postdating active fire alertPredating active fire alert0.3
Postdating active fire alertCoinciding active fire alert1.0
Non-fire-related
forest disturbance
Postdating active fire alertNo detection/
No detectionPostdating active fire alert
Postdating active fire alertPostdating active fire alert
No detectionNo detection
Publisher’s Note: MDPI stays neutral with regard to jurisdictional claims in published maps and institutional affiliations.

