Article

Biochemical Basis of Altitude Adaptation and Antioxidant System Activity during Autumn Leaf Senescence in Beech Populations

Department of Forest Ecosystems Protection, Faculty of Forestry, University of Agriculture in Krakow, Al. 29-Listopada 46, 31-425 Krakow, Poland
*
Author to whom correspondence should be addressed.
Forests 2021, 12(5), 529; https://doi.org/10.3390/f12050529
Submission received: 12 March 2021 / Revised: 19 April 2021 / Accepted: 21 April 2021 / Published: 25 April 2021
(This article belongs to the Section Forest Ecophysiology and Biology)

Abstract

:
High-altitude tree populations are exposed to severe natural environmental conditions. Among abiotic factors, variable temperatures, early frosts, and high radiation are the factors affecting tree growth at high altitudes. Fagus sylvatica L. exhibits a variety of physiological and genetic traits that allow it to adapt to different forest habitats. This study examines the differences in the biochemical properties of senescing beech leaves between populations originating from different altitudes using a common-garden experiment. Leaves were collected from five-year-old plants from the beginning of August to the end of October for two years. Based on the changes in senescence marker levels the genetic differences and significant correlations between populations’ altitude origin and their biochemical characteristics were identified. According to the free radical theory of leaf senescence, reactive oxygen species (ROS) and senescence markers were highly correlated. In this study, populations from higher altitudes were characterized by earlier and greater increases in ROS content and oxidative stress, which resulted in higher antioxidative system activity. Increases in ROS in high-altitude populations play a controlling role to initiate earlier senescence processes that allow the trees to adapt to harsh climatic conditions. Earlier senescence allows beech trees to maintain a balance between nitrogen metabolism and photosynthetic activity. It allows for remobilization of nitrogen compounds more efficiently and protects the trees from nitrogen loss and prepares them for winter dormancy.

1. Introduction

The common beech (Fagus sylvatica L.) is a deciduous tree that plays an important role in the forests of Central and Western Europe. This species is sensitive to climatic factor variations such as drought, late spring and early autumn frosts and warming, and it is characterized by a great diversity of morphological [1,2], physiological [3,4,5,6] and genetic traits [7,8,9,10]. Due to the variability of these traits, beech populations from diverse climatic and altitude origins show different progressions of life processes, such as bud flushing, cambium activity, leaf senescence, various resistance to abiotic stress factors and high adaptability to different environmental conditions [11,12,13].
One of the most critical physiological and biochemical processes in deciduous trees is autumn leaf senescence. A significant effect of altitude on beech leaf senescence timing has been observed [14]. Senescence is the last stage of leaf development that determines the leaf lifespan. Leaf senescence is a genetically controlled process that is coordinated at the cell, organ, and whole-plant levels [15,16]. It consists of a series of biochemical processes in which cell organelles, membranes, and macromolecules are degraded. The products of these reactions, such as amino acids, sugars, and mineral ions, are exported from senescing leaves, stored in shoots or roots, and used for tree growth in the subsequent vegetative period [6,17,18]. The main function of leaf senescence is the remobilization of nutrients, especially nitrogen. The nutrient resorption efficiency of beech leaves depends on the date of senescence onset, the length of the senescence process and temperature changes—almost 60% of the total leaf nitrogen in beech trees is remobilized. Research on beech leaf senescence has shown that individuals that differ in autumn phenology showed different nitrogen remobilization efficiencies [5,6].
Among various hypotheses of senescence, such as the source-sink competition and carbon-nitrogen signaling hypotheses, the free radical theory deserves special attention in explaining the induction of autumn leaf senescence in beech [3,19,20]. According to this theory, the induction and progression of senescence are controlled by the changing balance between reactive oxygen species (ROS) and their scavenging by the cellular antioxidant system [21]. In plants, ROS are formed as byproducts of many metabolic pathways, especially aerobic energy metabolism, and of plant exposure to various abiotic factors [22,23]. Under non-stressed conditions, the balance between ROS accumulation and scavenging is maintained by low-molecular-weight antioxidants and antioxidative enzymes. However, this balance can be disrupted during autumn leaf senescence by the depletion of the cell antioxidative system and excess ROS accumulation. This process results in damage to various cell components. On the other hand, ROS, particularly H2O2, modulate key signaling compounds such as mitogen-activated protein (MAP) kinases, gene expression, and enzyme activity that allow the activation of numerous senescence-associated metabolic processes [24]. Oxidative stress resistance and leaf longevity are highly correlated in trees [25,26]. A significant relationship was also found between the antioxidative properties of beech leaves and the course and duration of the senescence process [19].
The main factor affecting the onset of beech leaf senescence and determining the leaf lifespan is the temperature decrease during an approximately 13 h photoperiod [5,27]. The lifespan of leaves is important to tree adaptation because it influences the length of the growing season as well as tree photosynthetic activity and carbon storage. On the other hand, excessively prolonging the growing season and delaying leaf senescence increases the risk of damage from early frosts and reduces nitrogen remobilization efficiency and availability in the next year [28]. Beech adaptability depends on the level and variation in climatic condition characteristics and population resistance to abiotic stress factors. Many studies under controlled conditions have shown the different responses of beech populations to environmental stressors [11,29,30]. Trees accommodate abiotic stress factors in two ways: by changing their genetic makeup through natural selection induced by environmental factors and by modifying their gene expression. The first mechanism is driven by genetic diversity, and the second is driven by phenotypic plasticity [31,32].
To understand these problems, beech provenances from different altitudes were selected and cultivated in common garden experiment to explore genetically determined diversity of leaf senescence progress based on chlorophyll and protein degradation. We examined the effect of provenance origin on the ability to control the increased production of ROS and protection against the oxidative stress in leaves. The study aimed to determine differences in the activity of the enzymatic and low-molecular-weight compound part of the antioxidative system among provenances from different altitudes.
We hypothesized that the redox balance in beech leaves resulting from changes in the ROS content and in antioxidant system activity controls the induction date, progress and duration of senescence. In this way, the redox balance shapes the adaptability of different beech provenances to the climatic conditions at different altitudes. The onset and duration of autumn senescence also play significant roles in the efficiency of nitrogen compound remobilization [6].

2. Materials and Methods

2.1. Plant Material and Experimental Design

The experiment was conducted in 2013–2014 using five-year-old European beech plants that were approximately 1 m in height. The beech seeds used to produce the seedlings came from six provenances located at different altitudes and were derived from two seed forest regions: BK 50 (low-altitude region—LR) and BK 80 (high-altitude region—HR). The provenance locations, characteristics of the climatic conditions and growing season lengths at these locations are presented in Figure 1, Table 1 and Table 2. To exclude the influence of the climatic conditions of the seed origin locations on the date of leaf senescence induction, the course of senescence and the biochemical changes occurring during this process, this study was carried out at the experimental plot near Cracow, Poland, at an altitude of 248 m, latitude of 50°05′24′′ N and longitude of 19°52′51′′ E. The temperature conditions during leaf collection in 2013 and 2014 are presented in Figure 2.
One hundred one-year-old beech seedlings of each provenances were produced in a container nursery and then cultivated outside in 10 liter pots for four years in a peat substrate. The substrate consisted of sphagnum peat (75%), vermiculite (15%), perlite (10%) and Osmocote Pro 17 + 11 + 10 + 2 MgO + TE 5–6 month fertilizer (Everris Int. B.V., Geldermalsen, The Netherlands, www.everris.com, accessed on 15 February 2021) (3.5 kg/m3). The substrate pH was brought to 6.5 using dolomite. During their vegetative period, the plants were fertilized with 0.5% Florovit Agro Universal fertilizer (Grupa INCO S.A., Warsaw, Poland, www.florovit.pl, accessed on 15 February 2021).
Fifteen individuals from each provenance were randomly chosen for sampling. Leaves were collected from the south side of the crown, which was evenly exposed to the sun. In both years, the leaves were collected on four occasions between the beginning of August and the end of October. The dates of leaf collection were chosen based on our previous experiments [5,6] on the factors affecting the induction and the course of beech leaf senescence (Figure 2). The sampling periods in 2013 and 2014 were divided into four phases by these dates (Figure 2). They were related to the physiological state of the leaves and the advancement of the senescence process: phase 0: leaves in full metabolic activity; phase 1: leaves in decreasing activity; phase 2: leaves after senescence induction; phase 3: leaves in advanced stage of senescence. The leaves were collected between approximately 9 and 11 a.m., frozen in liquid nitrogen, and then ground into powder. For the dry weight (DW) measurements, 100 mg of leaf powder was dried for 72 h at 70 °C until a constant weight was reached.

2.2. Biochemical Analysis

2.2.1. Chlorophyll and Carotenoid Analysis

The total chlorophyll and carotenoids were extracted from 50 mg of leaf powder with cold 80% buffered acetone. The extract absorbance was read at 663, 646 and 470 nm. The concentration of pigments was calculated using the Lichtenthaler and Wellburn formulas [33]. The results were expressed in mg g−1 DW.

2.2.2. Soluble Protein Analysis

Soluble proteins were extracted from approximately 50 mg of leaf powder in 100 mM potassium phosphate buffer (pH 7.8) containing 2 mM EDTA, 0.5% Triton X-100 and 1 mM dithiothreitol (DTT). The protein content was estimated using the Bradford method [34] with bovine serum albumin as a standard.

2.2.3. Oxidative Stress Marker Determination

To assess the intensity of oxidative stress in beech leaves, the contents of the most common ROS, hydrogen peroxide (H2O2) and the superoxide anion (O2), as well as the lipid peroxidation marker thiobarbituric acid-reactive substances (TBARS) were determined.
Hydrogen peroxide was extracted from 50 mg of leaf powder in 50 mM potassium phosphate buffer (pH 7.4) containing 0.2% Triton X-100. The hydrogen peroxide content was determined according to the Amplex Red oxidation method [19]. In brief, the reaction mixture contained 50 mM potassium phosphate buffer (pH 7.4), 0.1 mM Amplex Red and 0.2 U mL−1 horseradish peroxidase. This mixture was combined with the supernatant containing hydrogen peroxide. The reaction was conducted at 30 °C in the dark for 30 min. The concentration of H2O2 was read from a standard curve prepared for 0 to 8 μM hydrogen peroxide.
The superoxide anion content was measured according to the Tan and Berridge method with Kraj modification [19,35]. In brief, 50 mg of leaf powder was homogenized in 10 mM potassium phosphate buffer (pH 7.8) containing 0.02% Triton X-100 and 1% polyvinylpolypyrrolidone (PVPP). The reaction mixture contained 300 μM WST-1 ([2-(4-iodophenyl)-3-(4-nitrophenyl)-5-(2,4-isulfenyl)-2H-tetrazolium) (Dojindo, Munich, Germany) and 20 μg mL−1 catalase (CAT). The reaction was initiated by adding the supernatant, and the absorbance was measured at 450 nm for 20 min. The superoxide anion concentration was calculated using an extinction coefficient of 37,000 M−1 cm−1.
Lipid peroxidation was determined by measuring the TBARS content [4,36]. In brief, 50 mg of leaf powder was homogenized with 500 μL of 5% trichloroacetic acid (TCA). After centrifugation, 125 μL of supernatant was mixed with 500 μL of 20% TCA containing 0.5% thiobarbituric acid (TBA), heated at 95 °C and quickly cooled. The TBARS content was estimated by subtracting the nonspecific absorbance at 600 nm from the absorbance at 532 nm and using an extinction coefficient of 155 mM−1 cm−1.

2.2.4. Ascorbate and Dehydroascorbate Content Determination

The oxidized and total ascorbate contents were determined according to the Gillespie and Ainsworth method [37]. Fifty milligrams of leaf powder was homogenized in 6% TCA. The oxidized form of ascorbate (dehydroascorbate, DHA) was reduced with DTT to determine the total ascorbate content. The reduced form of ascorbate (AsA) was measured without DTT in the reaction mixture. The DHA content was calculated as the difference between the total ascorbate content and the AsA content. The reduction of ferric ions by ascorbate was conducted at 37 °C. The content of the complex of 2,2′-dipyridyl and ferrous ions was measured spectrophotometrically at 525 nm. The ascorbate content was determined based on a standard curve prepared with ascorbate in the range from 0.15 to 10 mM. The content of total ascorbate was expressed in μmol g−1 DW, while the oxidized ascorbate was expressed in the percentage of total ascorbate (%DHA).

2.2.5. Antioxidative Enzyme Activity Determination

The activities of catalase (CAT), ascorbate peroxidase (APX) and superoxide dismutase (SOD)—which are the enzymes that protect beech leaves from excessive ROS accumulation—were analyzed. The enzymes were extracted from 50 mg leaf powder in appropriate buffers at 4 °C, according to Kraj [3]. CAT was extracted in 50 mM potassium phosphate buffer (pH 7.0), containing 2 mM EDTA, 1 mM phenylmethylsulfonyl fluoride (PMSF) and 5% PVPP. APX was extracted in 50 mM potassium phosphate buffer (pH 6.8) containing 0.5% Triton X-100, 1 mM PMSF, 2 mM EDTA, 1 mM DTT, 1 mM ascorbic acid and 5% PVPP. SOD was extracted in 50 mM potassium phosphate buffer (pH 7.8) containing 0.5% Triton X-100, 1 mM PMSF, 2 mM diethylenetriamine-pentaacetic acid (DTPA) and 5% PVPP. The protein content in the homogenates was determined using the Bradford method [34].
The CAT, APX and SOD activities were determined according to the methods of Aebi [38], Murshed et al. [39] and Peskin and Winterbourn [40], respectively, as modified for enzyme measurement in a 96-well UV microplate by Kraj [3]. In brief, CAT activity was determined in a reaction mixture containing 50 mM phosphate buffer (pH 7.0), H2O2 and enzyme extract. The enzyme activity was determined by measuring the absorbance at 240 nm. The disappearance of H2O2 was calculated using an extinction coefficient of 43.6 M−1 cm−1. The unit of CAT activity was defined as the amount of enzyme that degraded 1 μmol H2O2 min−1 mg−1 protein. The reaction mixture for measuring APX activity contained 50 mM phosphate buffer (pH 7.0), ascorbic acid, and enzyme extract. The reaction was initiated by the addition of H2O2. The enzyme activity was measured as the decrease in the absorbance at 290 nm due to the enzymatic oxidation of AsA by H2O2 using an extinction coefficient of 2.86 mM−1 cm−1. The SOD activity was measured using the WST-1 method. Superoxide anions were formed from hypoxanthine in the reaction catalyzed by xanthine oxidase. The reaction mixture contained 50 mM phosphate buffer (pH 7.8), DTPA, hypoxanthine, WST-1, catalase, xanthine oxidase and enzyme extract. The reduction of WST-1 was monitored at 450 nm. The inhibition of WST-1 reduction was expressed as the difference between the reduction of WST-1 in the control and the reduction measured in the sample. The unit of enzyme activity was defined as the amount of SOD causing a 50% inhibition in WST-1 reduction compared to the WST-1 reduction in the control.
All biochemical analyses were performed using a Synergy-2 microplate reader (BioTek, Winooski, VT, USA).

2.3. Data Analysis

The results are expressed as mean ± standard error (SE). Changes in the contents of total chlorophyll, carotenoids, proteins, ROS (hydrogen peroxide and superoxide anion), TBARS, total ascorbate, the % of dehydroascorbate and the activities of antioxidative enzymes (CAT, APX, and SOD) were analyzed using repeated-measures analysis of variance (RM-ANOVA). Tukey’s honestly significant difference test was performed as a post hoc test to determine which provenances and collection occasions differed from each other. The differences were considered significant at p < 0.05. The sample collection date, sampling year, provenance (altitude) and region were treated as fixed factors. Before analysis, the data were tested for normality of distribution (Kolmogorov–Smirnov test) and homogeneity of variance (Bartlett’s test) [41]. Pearson’s correlation was conducted to demonstrate the relationships between senescence markers (chlorophyll and protein contents) and oxidative stress markers (H2O2, O2, TBARS) and then between oxidative stress markers and antioxidative system components (total ascorbate, DHA, carotenoids, activities of CAT, APX, SOD). Principal Component Analysis (PCA) was used to investigate the relationships between the senescence markers, oxidative stress markers and antioxidative system activity. The component with eigenvalues lower than 1 was discarded. To check whether the PCA is justified, the correlation coefficients between the variables were calculated, the Bartlett test was carried out and the Kaiser-Meyer-Olkin (KMO) criterion was analyzed. All analyses were carried out using Statistica software ver. 13 (Statsoft Inc., Tulsa, OK, USA).

3. Results

3.1. Temperature Conditions during the Sampling Periods

The temperature conditions during the sampling periods are presented in Table 2 and Figure 2. The average temperature during the sampling periods was lower (15.1 °C and 16.3 °C, respectively), and the total temperature decrease was higher (−13.1 °C and −9.0 °C, respectively), in 2013 than in 2014. The temperature profiles differed between years. The differences in average temperature in the sampling phases (phase 0–III) in 2013 and 2014 changed from 1.8 °C to −3.7 °C. The temperature profile in 2013 showed a rapid decrease at the beginning of August (phase 0), slow decrease until approximately 20 September, and then quicker drop at the beginning of October (phase I and II). The temperature increased to approximately 10 °C in the first half of October (phase III). In 2014, the temperature remained stable before the first leaf collection event (phase 0). A rapid decrease in temperature occurred in August (phase I), it was stable in September and then decreased at the end of September (phase II). The temperature varied within the range of 8 °C to 16 °C until the end of the sampling period (phase III) (Table 2, Figure 2).

3.2. Chlorophyll and Protein Contents

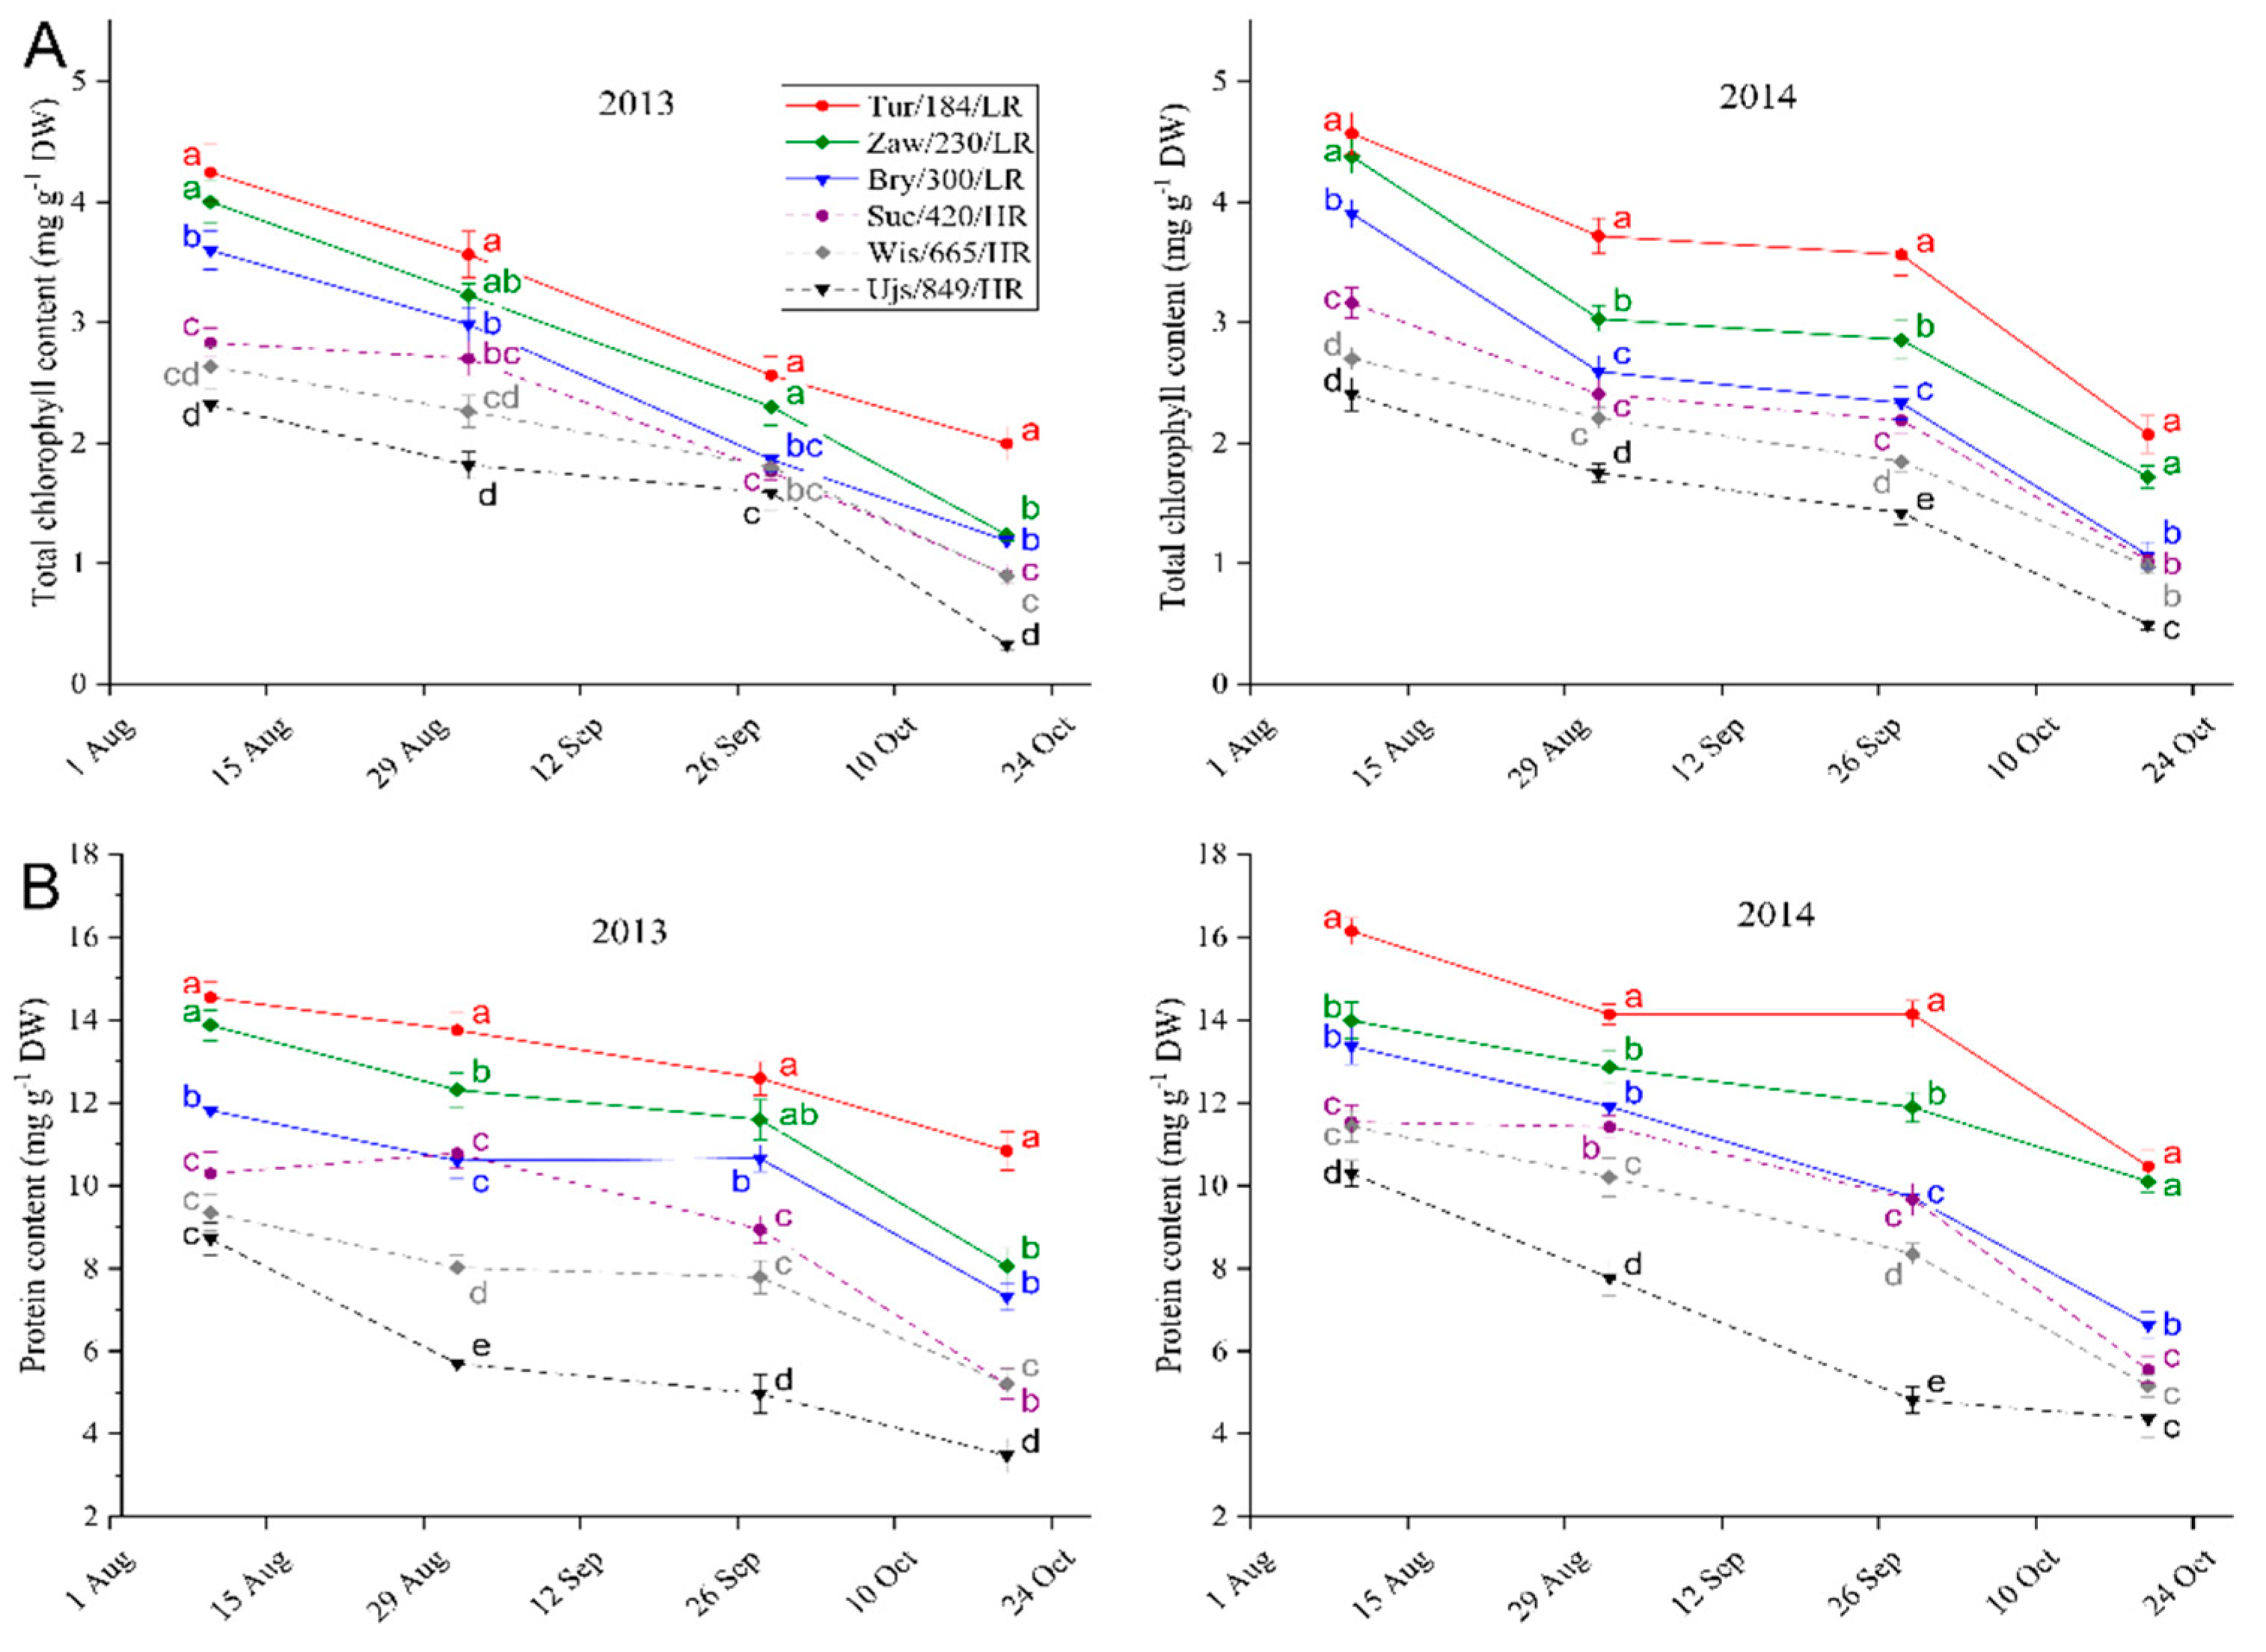
The level and changes in chlorophyll content depended on the provenance and altitude of the tree origin (p < 0.0001) (Figure 3A). Throughout the sampling periods, the chlorophyll content was higher in beech individuals from LR provenances than in those from HR provenances (p < 0.0001) (Table S1). The initial chlorophyll content increased with decreasing provenance altitude but did not depend on the year (Figure 3A). The percentage of chlorophyll degradation in both years was similar, but it was higher in HR than in LR provenances (approximately 71% and 63%, respectively). However, the chlorophyll degradation ratio depended significantly on temperature changes (r = 0.752, p < 0.012) (Figure 2 and Figure 3A). The greater temperature decrease in phase I in 2014 than in 2013 caused greater chlorophyll degradation (26.3% and 12.8%, respectively). A similar relationship between chlorophyll content and temperature occurred in phase II in 2013 compared to 2014 (27% and 11.8%, respectively). In both years, the greatest chlorophyll degradation occurred in the advanced stage of senescence (phase III) (approximately 48%) despite a temperature increase (Table 2, Tables S4 and S5, Figure 3A). The rate of chlorophyll degradation in the LR and HR provenances depended on the senescence phase and the temperature profile. The temperature decrease in August and September (phase I and II) resulted in greater chlorophyll degradation in LR than in HR provenances (51% and 33% in 2013 and 34% and 32% in 2014, respectively) (Tables S4 and S5, Figure 3A). The increase in temperature in phase III did not limit chlorophyll degradation in either year or provenance group. In phase III, chlorophyll degradation in the HR provenances occurred significantly more quickly than that in the LR provenances (59% and 35% in 2013 and 55% and 45% in 2014, respectively).
In both years, the LR provenances contained a significantly more proteins than the HR provenances (p < 0.0001) (Table S1, Figure 3B). The initial content and the rates of protein degradation and remobilization depended on the altitude of the provenance location. The temperature during the sampling period did not affect the protein content (Table S1), but temperature changes affected the protein degradation rate (r = 0.545, p < 0.01). The differences in the average temperature between years and its decrease in phase I (Table 2) did not affect the protein degradation rate (approximately 12%). However, the higher average temperature and its smaller decrease in phase II in 2014 than in 2013 caused greater protein degradation and remobilization (16% and 8%, respectively). In both years, the greatest protein degradation (26% and 27%, respectively) occurred in the advanced stage of leaf senescence in October. However, even in this case, the higher average temperature in 2014 caused greater protein degradation (Table 2, Figure 3B). In each year and phase of the sampling periods, the protein degradation and remobilization rates were higher in HR than in LR provenances. A higher average temperature in a particular phase resulted in a larger difference in protein degradation between the HR and LR provenances (Table 2, Tables S4 and S5). Consequently, protein remobilization rates were higher in the warmer year (2014) and in HR provenances (35% and 46% in LR and HR 2013; 38% and 55% in LR and HR in 2014).

3.3. Oxidative Stress Markers

The LR and HR provenances differed significantly in the levels and increases in hydrogen peroxide, superoxide anion, and TBARS contents (p < 0.0001) (Tables S1, S4 and S5). The sampling year significantly influenced the H2O2 content and its changes (Figure 4A). In both years, the temperature level and changes before the leaf collection period did not affect the initial H2O2 content (0.10 and 0.11 μmol g−1 DW, respectively). However, a significantly higher initial H2O2 content was observed in HR provenances than in LR provenances (0.09 and 0.12 μmol g−1 DW) (Figure 4A). The level of H2O2 content during the sampling period significantly depended on temperature (r= −0.764, p < 0.01). The lower temperatures and greater temperature decrease in 2013 than in 2014 affected the greater total increase in H2O2 content (0.39 and 0.23 μmol g−1 DW). In both years the HR provenances exhibited significantly higher H2O2 content and its increases than the LR provenance (total increases: 0.48 and 0.30 μmol g−1 DW in 2013, 0.33 and 0.13 μmol g−1 DW in 2014) (Figure 4A).
The temperature conditions between sampling year did not affect the superoxide anion content but did affect the changes in its content between sampling period phases (r = −0.559, p < 0.01). In both years the largest increase in superoxide anion content occurred after the largest temperature decrease (in phase I 2013 and in phase III 2014) (Figure 4B). The initial level of O2 content was higher in HR provenances than in LR provenances. The increase in the superoxide anion content was more than twice as high in 2013 and almost twice as high in 2014 in the HR provenances than in the LR provenances (6.4 and 2.5 nmol g−1 DW, 5.9 and 3.1 nmol g−1 DW). Consequently, in both years the superoxide anion content depended on the provenance altitude (p < 0.0001) and was significantly higher in HR provenances than in LR provenances.
The provenance location significantly affected the initial TBARS content and its changes (p < 0.0001) (Table S1). However, the level of these compounds did not depend on the sampling year. The changes in the TBARS content depended on the average temperature and its decrease during the sampling periods (r = −0.581, p < 0.01). The increase in TBARS was higher in the cooler (2013) than in the warmer (2014) year (125 and 100 nmol g−1 DW). Similar to the results for the hydrogen peroxide and superoxide anion contents, HR provenances were characterized by significantly higher initial TBARS contents (278 and 211 nmol g−1 DW) and greater increases (128 and 97 nmol g−1 DW) in TBARS content (p < 0.001) than LR provenances (Figure 4C).

3.4. Low-Molecular-Weight Antioxidants

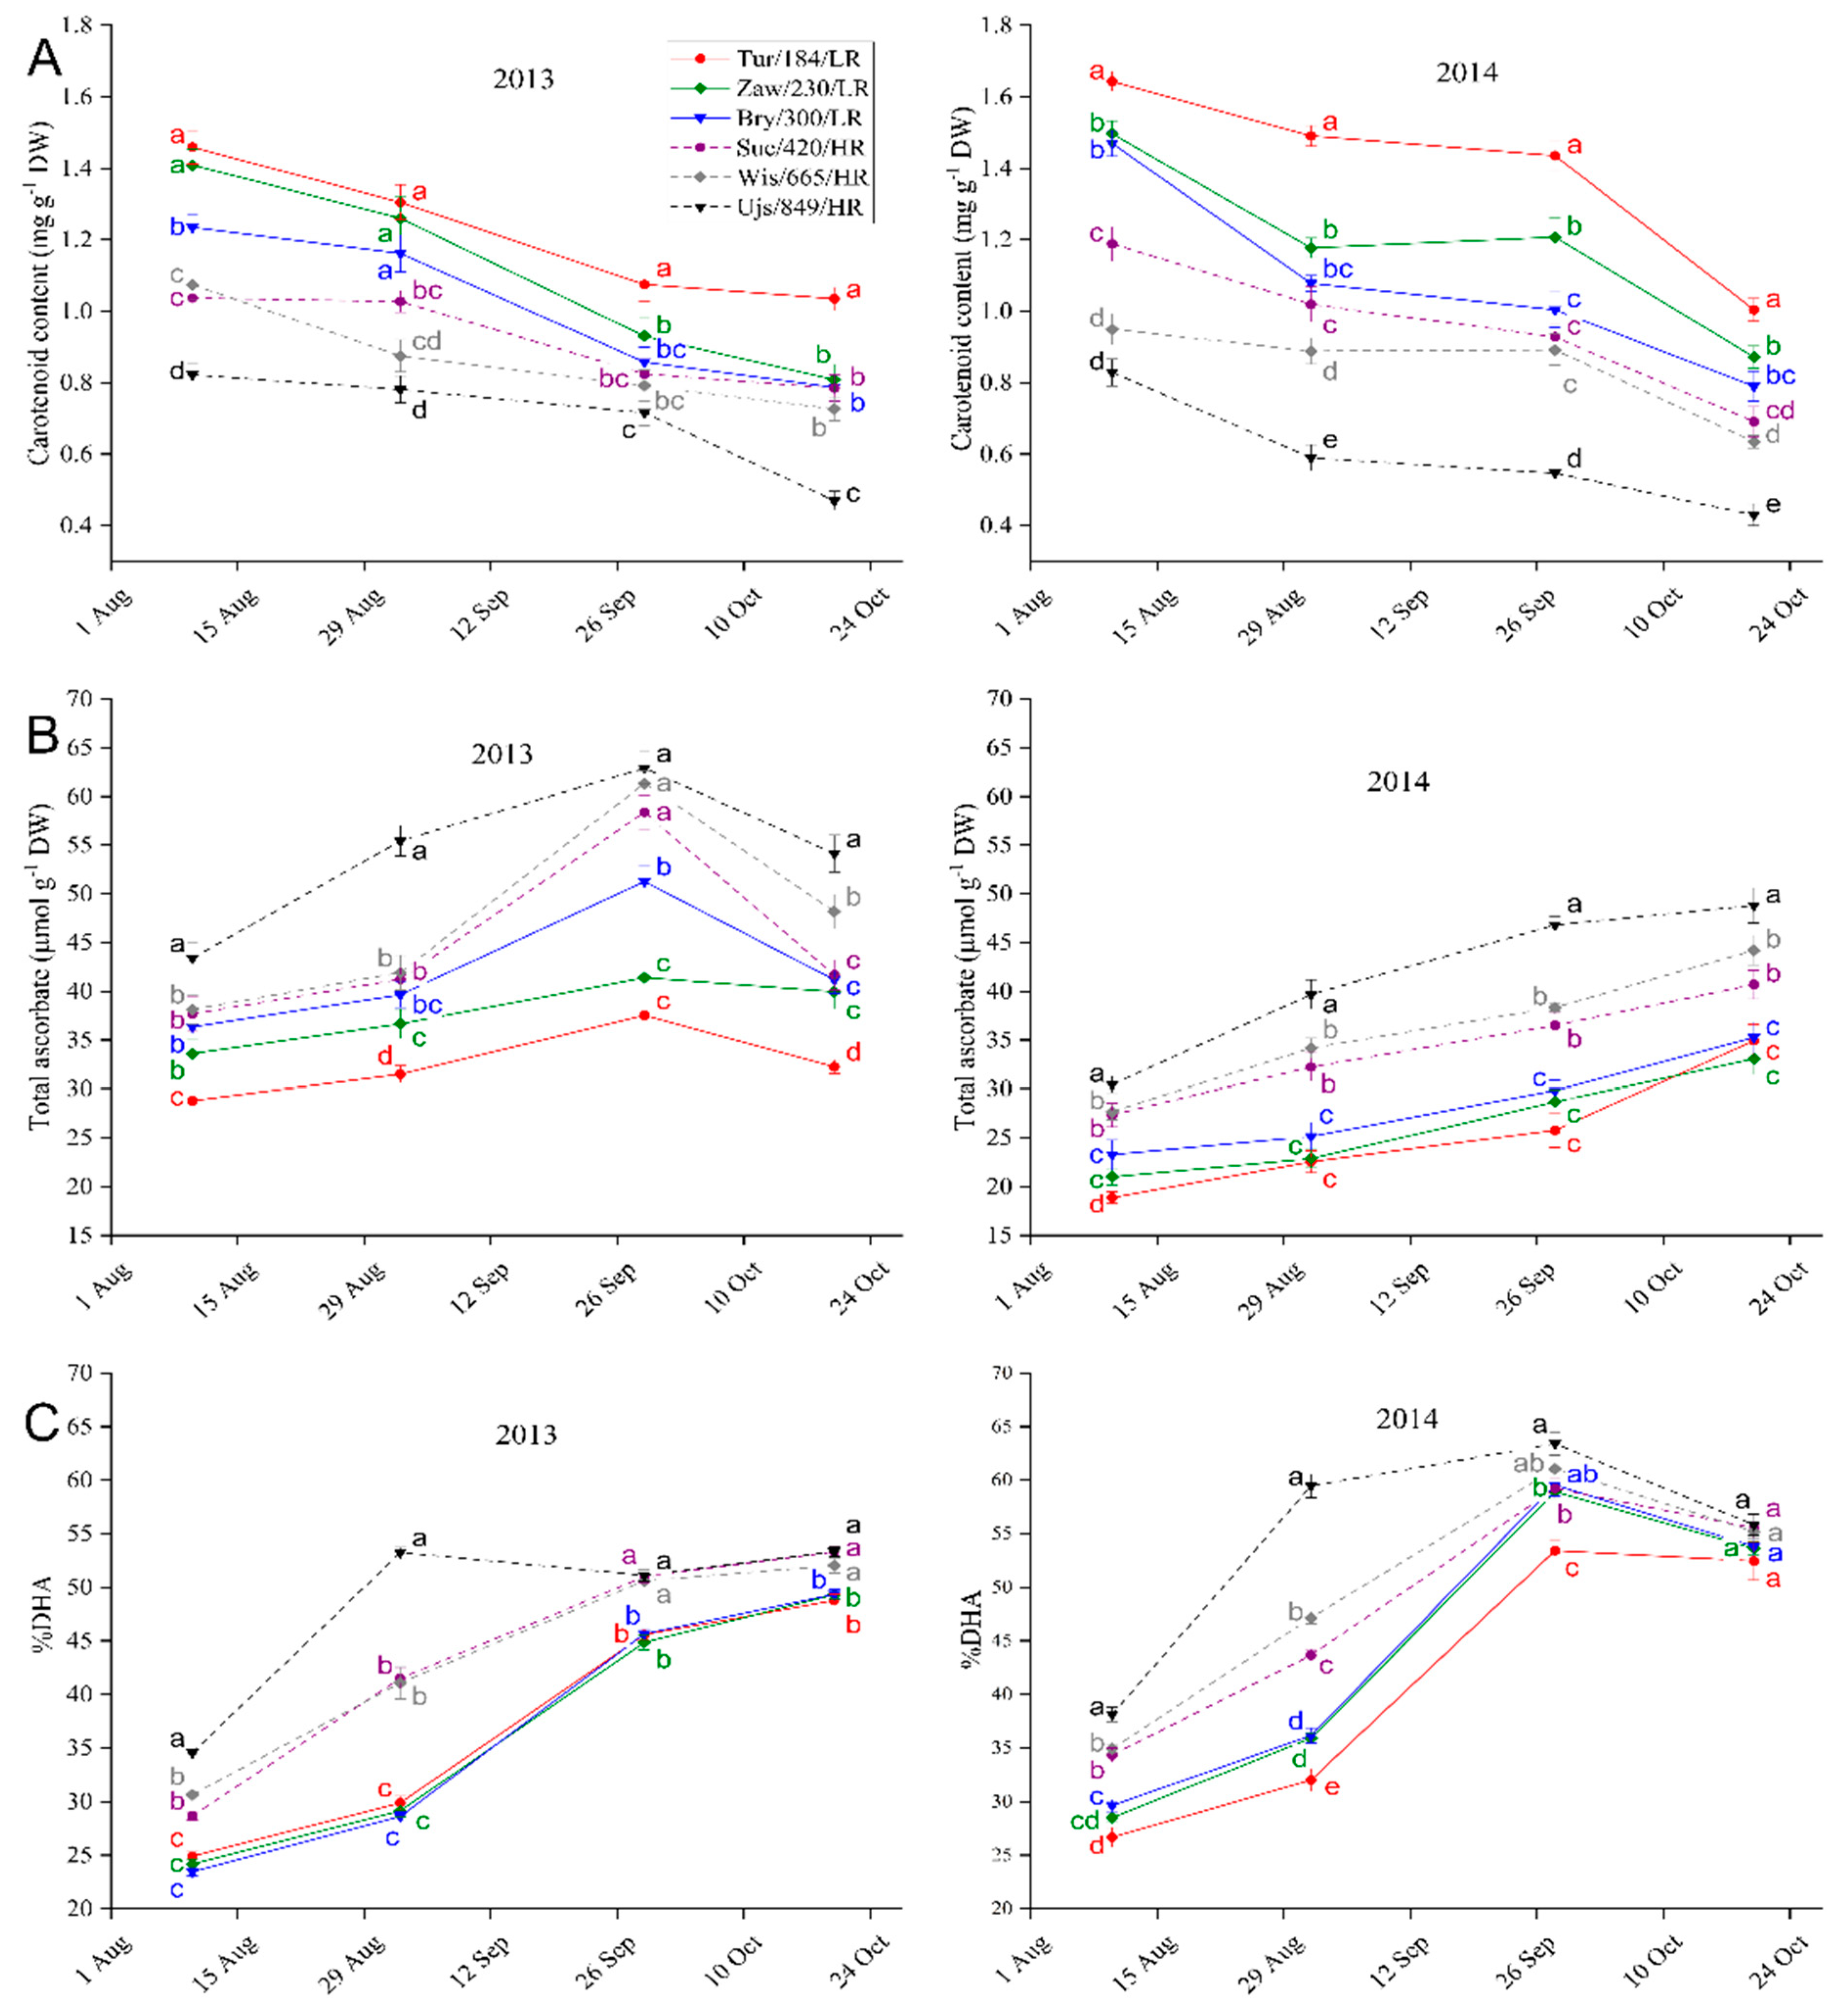
The contents of carotenoids, total ascorbate and percentage of DHA depended on the provenance origin and the temperature conditions in the sampling year. At the beginning of August, the carotenoid content ranged from 0.82 to 1.64 mg g−1 DW. In both years, the carotenoid content was significantly higher in the LR provenances (p < 0.0001) (Tables S1, S4 and S5, Figure 5A). The carotenoid and chlorophyll content profiles were similar and characteristic of the temperature changes in a particular year (r = 0.571, p < 0.01) (Figure 3A and Figure 5A). The lower temperature level and its greater changes in 2013 resulted in a more rapid decrease in carotenoid content than in 2014.
The different rates of carotenoid and chlorophyll degradation in the examined provenances resulted in changes in the carotenoid/chlorophyll ratio. The initial level of this ratio was higher in the HR provenances than in the LR provenances (0.38 and 0.35, respectively). The increase in the carotenoid/chlorophyll ratio was higher in the cooler, 2013 year than in 2014 (116% and 82%, respectively). With increasing oxidative stress (increases in H2O2, superoxide anion and TBARS contents) and the progression of leaf senescence, the carotenoid/chlorophyll ratio increased more quickly in the HR provenances (0.59 and 0.88 for the LR and HR provenances in October, respectively).
During the entire sampling period, the HR provenances contained more total ascorbate and exhibited a higher increase of this compound content than the LR provenances (increases of 47.7% and 32.7%, respectively) (p < 0.0001) (Figure 5B). The decrease in temperature caused an increase in the ascorbate level. The extent of this increase depended not only on the average temperature in a particular phase but also on short-term temperature changes (Table 2, Figure 5). The decrease in the average temperature to below 10 °C in October 2013 inhibited ascorbate synthesis proportionally to the provenance altitude; however, the average temperature above 10 °C in October 2014 ensured a further increase in ascorbate content.
The initial percentage of DHA content was significantly lower in 2013 than in 2014 due to a temperature decrease before the sampling period (27.7% and 32.0%, respectively) (Figure 2 and Figure 5). Throughout the entire sample collection period, the HR provenances were characterized by significantly higher DHA percentages than the LR provenances, however, the total increase in the DHA percentage was higher in the LR than in the HR provenances (increases of 96% and 63%, respectively). Depending on the year, almost the whole increase in the DHA percentage in the HR provenances occurred in August (phase I), before the acceleration of ascorbate synthesis (Figure 5). The LR provenances were characterized by delayed increases in their DHA percentage, which occurred in September (phase II). The difference between the DHA percentage in the HR and LR provenances was the largest at the beginning of September (HR/LR provenance DHA percentage ratios: 1.54 and 1.44 in 2013 and 2014) and subsequently decreased to almost 1.

3.5. Antioxidative Enzyme Activity

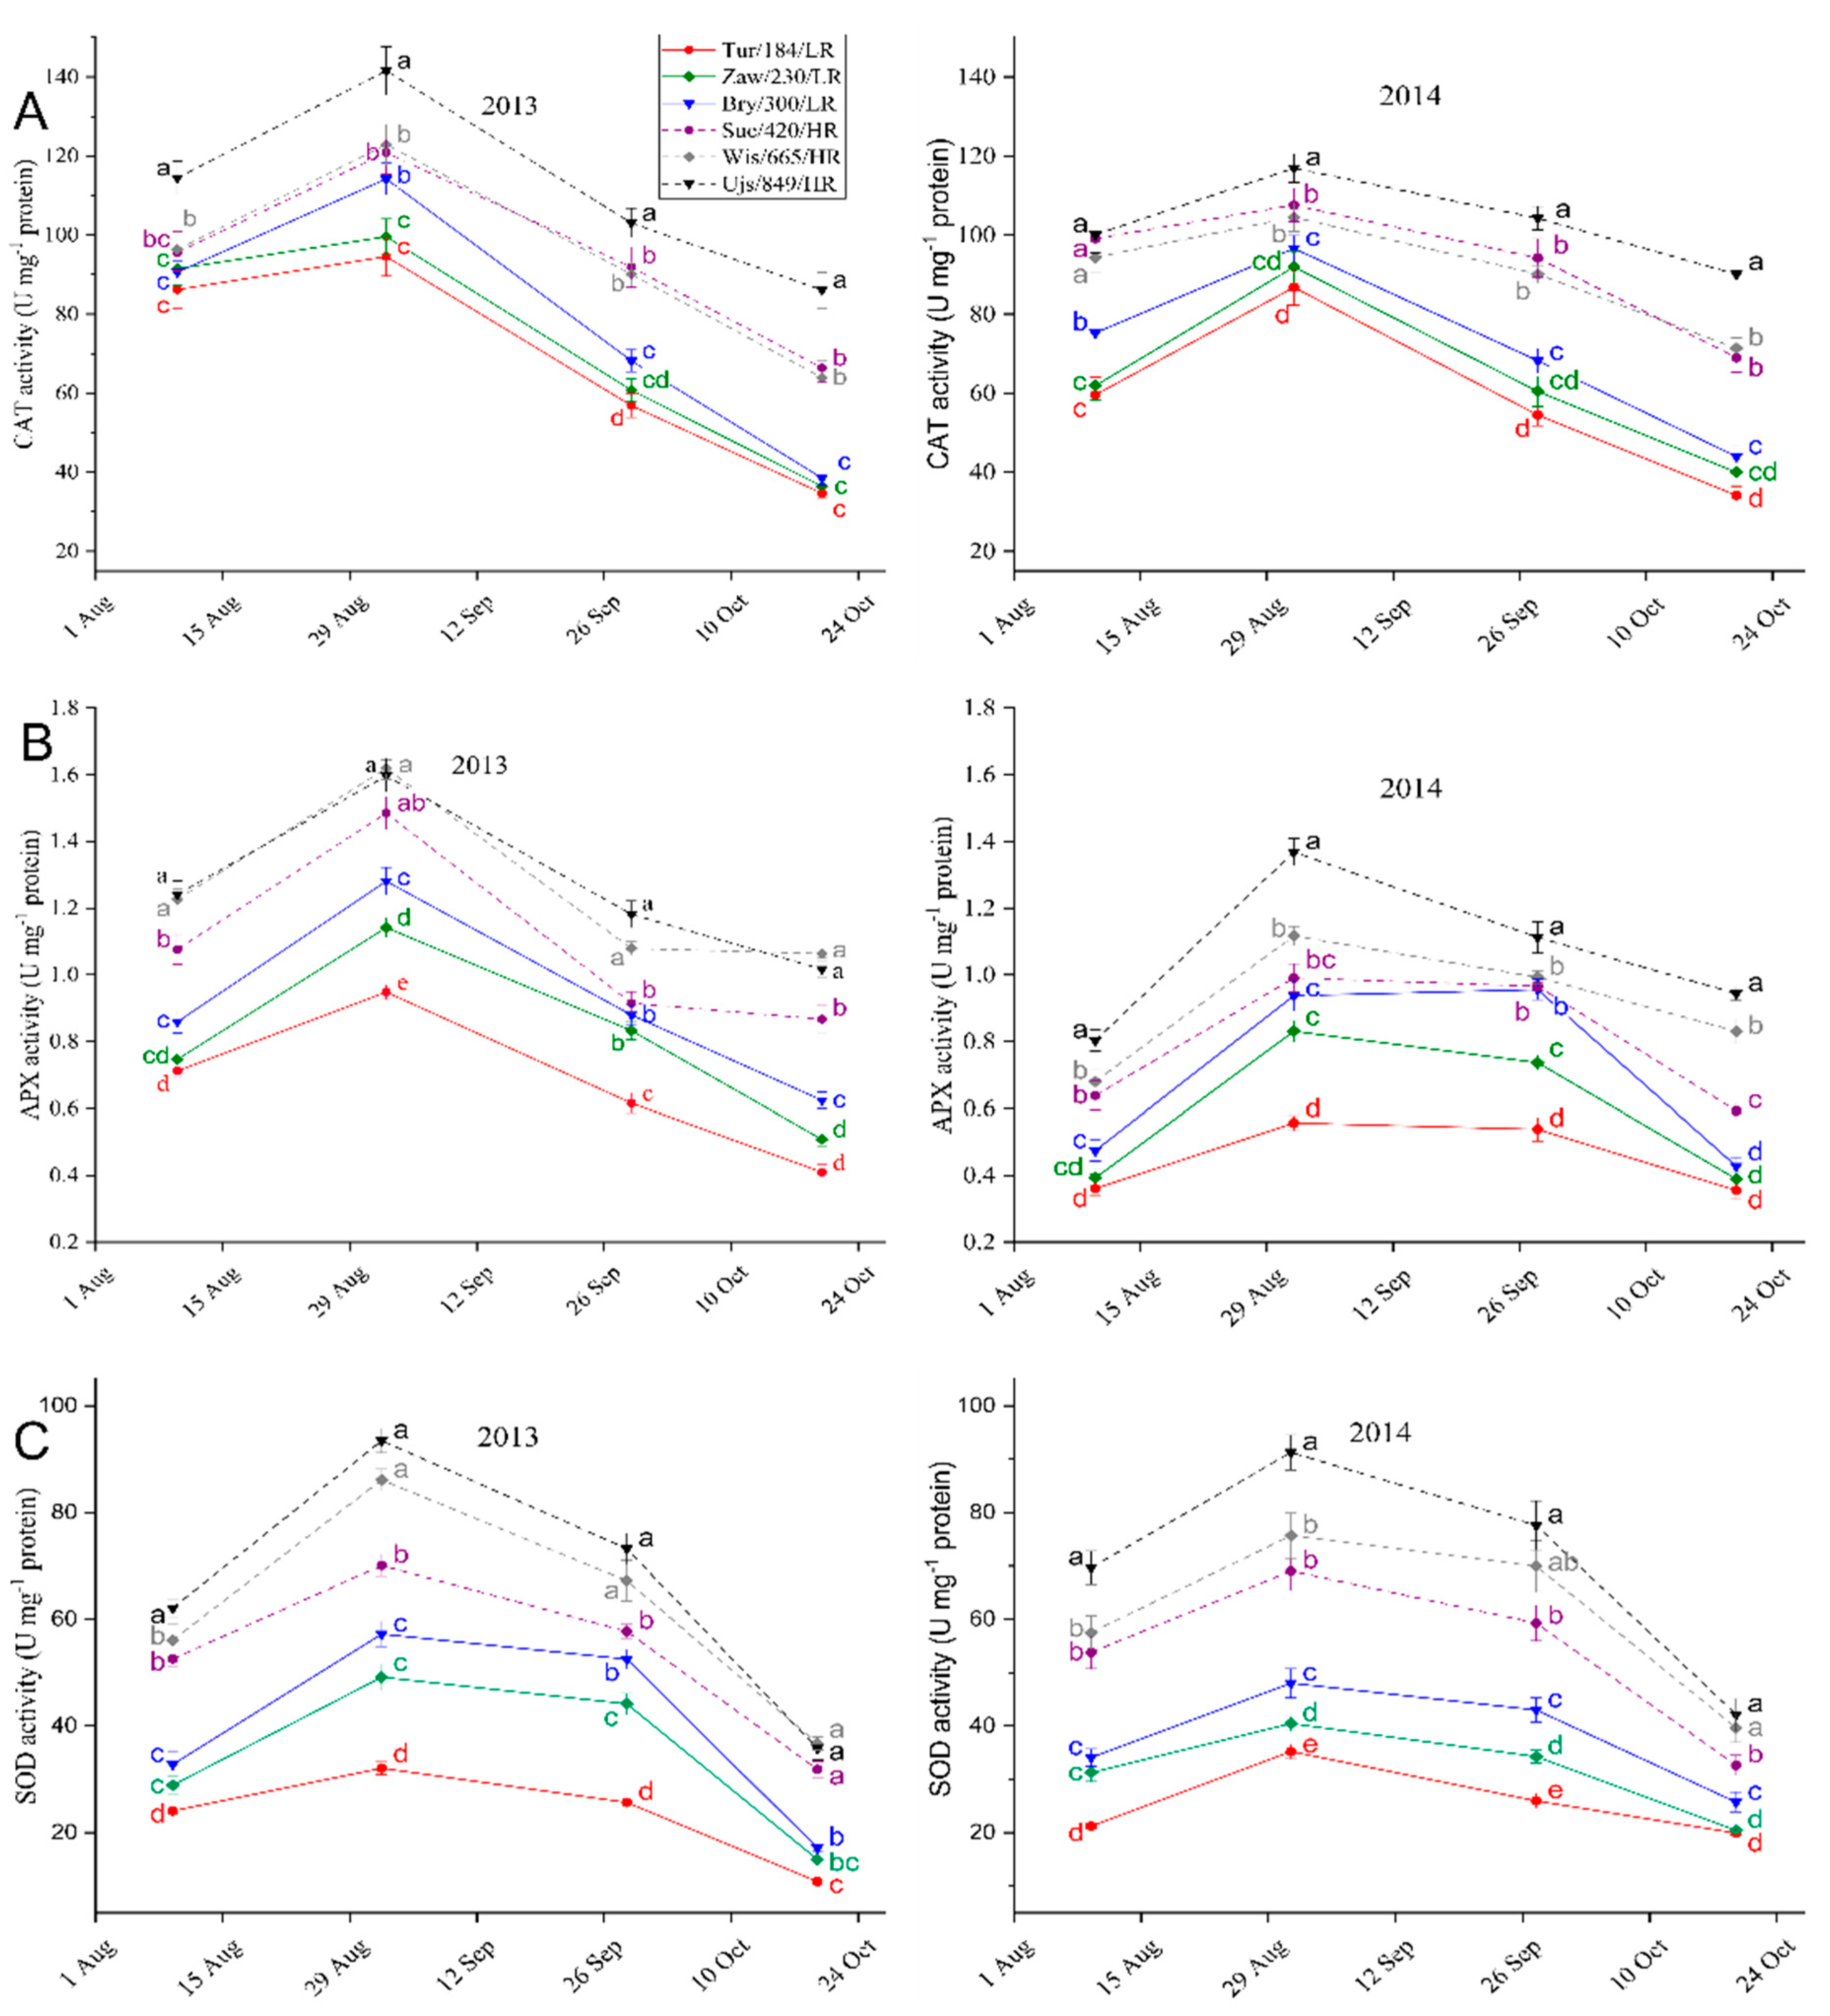
The temperature changes in the sampling year and the provenance origin significantly affected the initial levels and changes in antioxidative enzyme activity in beech (p < 0.0001, Figure 2 and Figure 6). All enzymes exhibited the highest activity at the end of August and then started to decrease after senescence induction. Despite the temperature increase in October (Table 2), the greatest decrease in enzyme activity occurred in phase III of the sampling periods (except for CAT in the HR provenances). The initial CAT activity was higher in 2013 than in 2014 by approximately 17%. A greater decrease in CAT activity occurred in the cooler, 2013 year than in 2014 (54% and 47%, respectively). The HR provenances exhibited greater CAT activity during both sampling periods (Tables S4 and S5). In sampling phases II and III, temperature decreases caused a greater enzyme activity decrease in the LR provenances than in the HR provenances. This led to a significantly greater decrease in CAT activity in the LR provenances (64% and 44% in LR and HR in 2013; 57% and 30% in LR and HR in 2014) (Figure 6A).
In all sampling phases, APX activity was significantly higher in 2013 than in 2014 by 1.05 to 1.75 times. APX activity decreased starting in the beginning of September (Figure 6B). A greater decrease occurred in the cooler, 2013 year than in 2014 (decreases of 48% and 42%, respectively). Throughout the entire sampling period, the HR provenances showed a higher level of APX activity than the LR provenances (1.36 to 2.02 times higher in 2013 and 2014, respectively).
The climatic conditions in the sampling periods did not affect the level of SOD activity, but they influenced the profile of enzyme activity in provenances and regions. The maximum level of SOD activity occurred at the beginning of September. The lower average temperature and the greater temperature decrease in 2013 than in 2014 caused greater decreases in SOD activity in September and October (64% and 48% in 2013 and 2014, respectively). SOD activity was significantly higher in the HR provenances than in the LR provenances (Figure 6C).

3.6. Correlation and PCA Analysis

For all provenances and regions, the hydrogen peroxide, superoxide anion, and TBARS contents were negatively correlated with leaf senescence markers (the chlorophyll and protein contents) (Table S2). Based on Pearson’s correlation values, it was shown that the progression of leaf senescence was associated with an altitude of the provenance location and the level of oxidative stress (Table S2 and Table 3, Figure 3 and Figure 4). Throughout the entire sampling period, the HR provenances showed higher levels and significantly higher increases in oxidative stress marker content than the LR provenances (Table S2). The leaf senescence process and ROS and TBARS accumulation were both dependent on the average temperature, the profile of temperature changes and the total decrease in temperature during the sampling periods (Table 2, Figure 3 and Figure 4).
The different levels of oxidative stress that occurred in the provenances from varied altitudes resulted in proportional reactions in the leaves to counteract ROS degrading effects. The faster increase in the H2O2, superoxide anion and TBARS contents in the HR provenances caused a higher increase in antioxidative system activity than that observed in the LR provenances (Table S3). The HR provenances were characterized by a higher and earlier increase in total AsA synthesis and lower decreases in carotenoid content and antioxidative enzyme activity in response to oxidative stress. The faster accumulation of total AsA and slower decrease in carotenoid content in the HR provenances than in the LR provenances resulted in greater antioxidative system activity, which protected HR individuals against further increases in ROS content (Table S3, Figure 5).
The antioxidant response in leaves included changes in low-weight-antioxidant levels and limitations on decreases in CAT, APX and SOD activities. The greater increase in ROS accumulation and the induction of oxidative stress limited the decrease in enzyme activity in the HR provenances. These responses were observed in mainly CAT and SOD and, to a lesser extent, APX activities (Table S3). A greater decrease in enzyme activity during leaf senescence and a resulting increase in the accumulation of H2O2, superoxide anion and TBARS were characteristic of the LR provenances (Table S3). Despite the differential decreases in antioxidant enzyme activity observed as a result of leaf senescence and oxidative stress, the participation of enzymes in leaf protective mechanisms and the correlations between CAT, APX and SOD activities were significant and high (CAT/APX, 0.590; CAT/SOD, 0.689; APX/SOD, 0.633; p < 0.001).
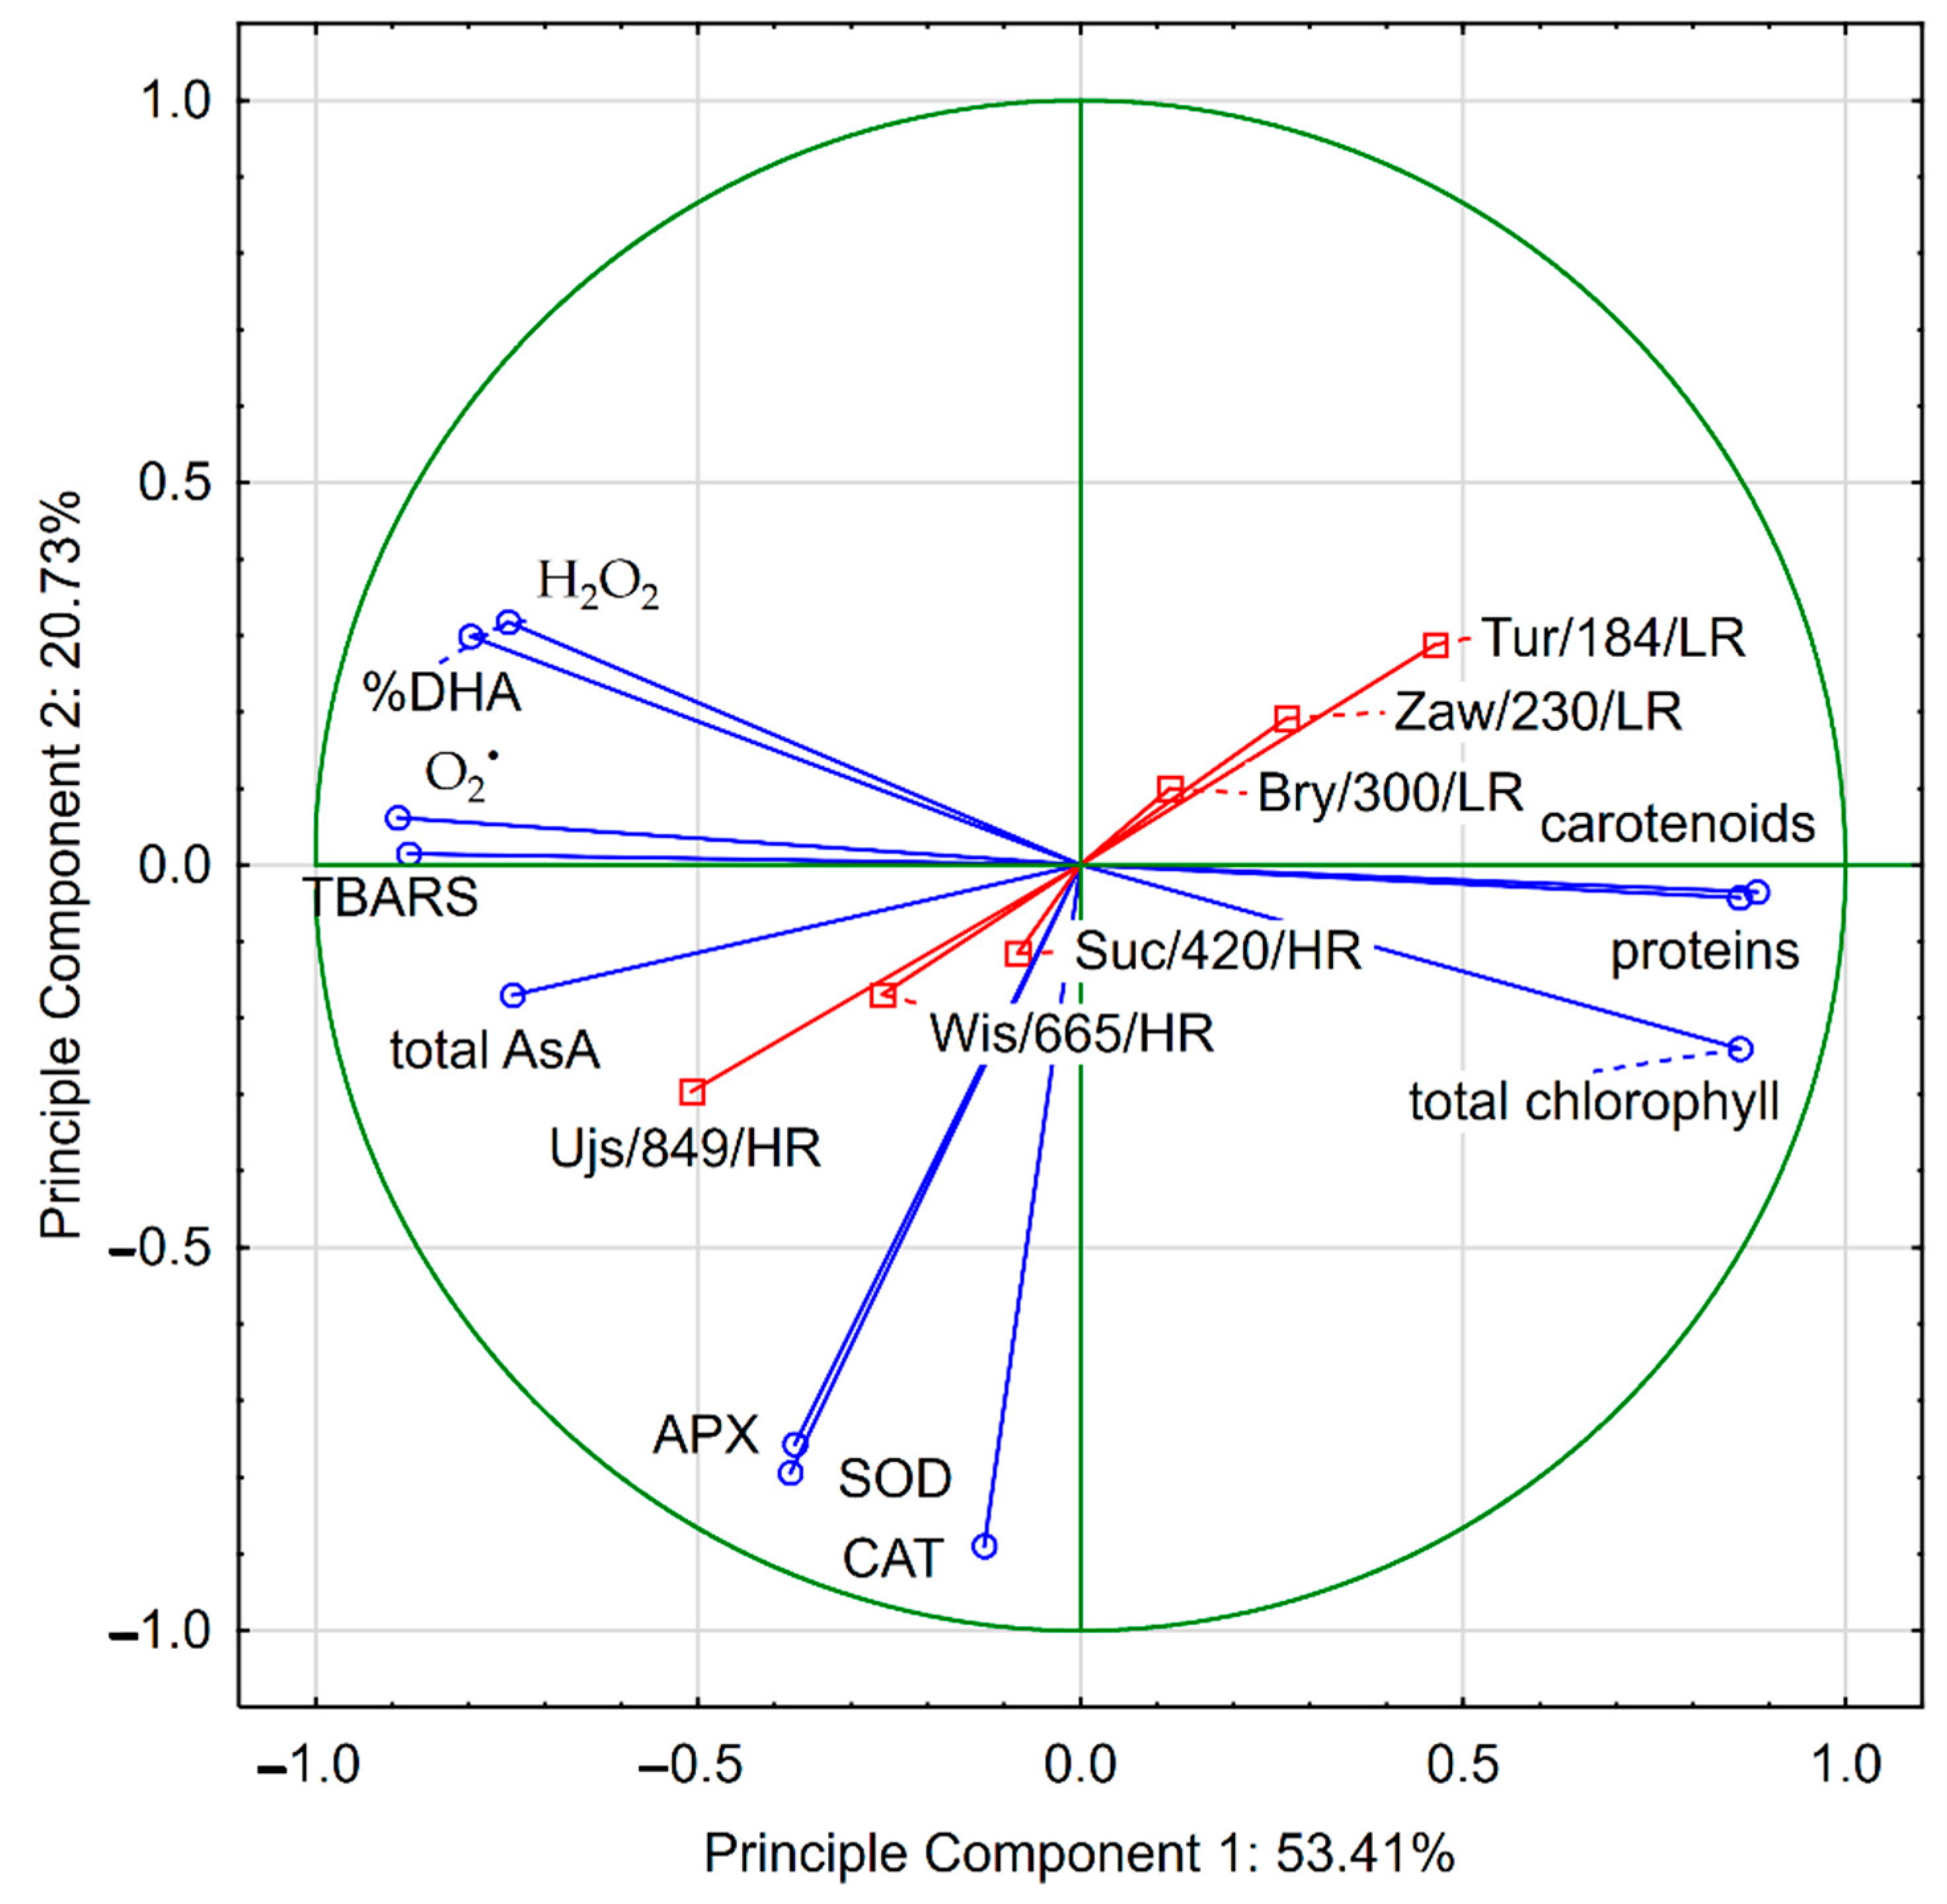
The Principle Component Analysis (PCA) showed a KMO value of 0.882. The minimum KMO score of 0.5 was reached for all variables (KMO range of 0.654–0.943). The Bartlett’s test also meets the criteria of sampling adequacy for PCA analysis (Chi-Square 4226.59, p < 0.05). Based on eigenvalues greater than 1 two components were used. Component 1 explained 53.41% and component 2 explained 20.73% of variance. The cumulative percent of the explained variance was 74.14% (Figure 7). The strong relationships were found between senescence markers and carotenoids that were degraded during senescence process. This process triggered a plant reaction manifested by the accumulation of ROS (H2O2, O2) and an increase in the ascorbate content and the degree of its oxidation as a result of scavenging of H2O2. These relationships were confirmed by PCA analysis. This analysis also confirms the significant role of catalase, superoxide dismutase and ascorbate peroxidase in the senescence process and the protection of leaves against oxidative stress. On the other hand, the PCA analysis confirmed the significant effect of provenance location on ROS level and antioxidative system activity. The increasing altitude of provenance location caused higher and quicker increase in H2O2, O2 and TBARS content in leaves and greater protection of antioxidative system against oxidative stress.

4. Discussion

The experimental conditions provided the same climatic conditions for the growth of all provenances and allowed the beech individuals’ nutrition and watering to be controlled during both sampling periods. This allowed us to exclude the effect of the climatic conditions in the provenance locations on the onset of leaf senescence and the biochemical changes during this process. Vitasse et al. [42] found significant altitudinal trends in leaf phenology that were species-specific, including in Fagus sylvatica with differences in temperature sensitivity. These trends are the result of specific physiological, biochemical and molecular responses to different climatic conditions. The phenotypic differences observed in situ reflect both environmental and genetic variations, while the variations observed in common-garden experiments reflect only genetic variations [32]. Considering the same climatic conditions were maintained for all provenances, the presented results reflect the influence of the genetic properties of beech provenances from different altitudes on the leaf senescence process.
Beech populations at higher altitudes are subject to various environmental stress factors such as low temperatures, early frosts, drought, UV radiation and high light intensity. Under these conditions, abiotic stressors induce the increased production of ROS in plant cells, leading to oxidative stress and redox imbalance [43,44]. To survive, trees have developed different physiological, biochemical and molecular strategies that include high antioxidant system activity, increased carotenoid/chlorophyll ratios, cell membrane saturation, decreased water content and increased proline content [45,46]. These adaptive responses affect, on the one hand, the senescence onset time, its duration and progression, and thus the achievement of the basic aim of senescence, i.e., the remobilization of cellular macromolecules. On the other hand, these adaptive responses allow the trees to exhibit greater resistance to oxidative stress under high-altitude, stressful conditions. This study shows that senescence markers, i.e., the chlorophyll and protein contents, were significantly correlated with oxidative stress markers (H2O2, O2, TBARS) at the level of provenance and origin region. There was also a significant correlation between each of these markers and altitude, which indicates genetic conditioning as well as the differentiation of adaptative responses to altitude in beech provenances. Our results confirm the intrinsic link between oxidative stress and leaf senescence in beech, and the free radical theory of senescence seems to explain the induction and control of beech senescence. Similar results were found in several studies in beech and other tree species [3,19,25,47].
The onset of beech leaf senescence is controlled by a dual dormancy system (temperature and photoperiod) [5,27]. It is significantly correlated with temperature changes and it accelerates with decreasing temperature that was shown in the current and previous studies [5,48]. Earlier studies have shown that the temperature increase in September slows down the senescence process [3,5]. However, in the advanced stage of senescence in October, a temperature increase does not inhibit or even slow down the senescence and protein remobilization processes. This phenomenon was also observed in this study. These findings suggest a different reaction of the leaves to temperature changes in September after senescence induction, and in October in the advanced stage of this process that results in irreversible biochemical and physiological changes in beech leaves [3]. Despite the temperature increase, in the advanced stage of senescence antioxidative enzyme activity and ascorbic acid synthesis decreased and the increase in oxidative stress was maintained, especially in provenances from lower altitudes. Similar conclusions emerge from Vitasse’s analysis [32], which stated that the altitudinal clinal patterns of leaf senescence in beech were induced more by adaptation to temperature than by differences in day length.
The purpose of autumn senescence in tree leaves is to remobilize and recycle cellular macromolecules [6,49]. In many species, the redistribution of these compounds within the plant is the main determinant of tree longevity [50]. The timing of leaf senescence determines the leaf lifespan and consequently the carbon assimilation period duration, nitrogen remobilization efficiency, tree growth rate and tree productivity [6,28,51]. Temperature not only induces but also modifies the rate and length of beech leaf senescence [5,27]. A study of beech phenological forms showed that a longer and earlier senescence period at a higher temperature, which is characteristic of the early-senescing form, resulted in greater remobilization of nitrogen compounds compared to that in later-senescing individuals [6]. Similar relationships between average temperature and remobilization efficiency were observed in the present study. The diversity of the biochemical features of the beech leaves from different altitudes resulted in different levels and changes in ROS. The generation of ROS is one of the earliest responses of beech leaves to senescence-inducing factors. It has become clear that ROS are involved in senescence controlling [52]. The controlling role of the differentiated increases in H2O2, O2 and TBARS contents in provenances of different origins was confirmed by the significant increase in antioxidant system activity in August and the subsequent decrease in activity only after a maximum value was reached in early September, after the onset of senescence. It seems that earlier and faster ROS production in populations from higher altitudes played a controlling role in the processes of protein degradation and remobilization. The earlier induction of these processes both prolongs them and allows them to occur at higher temperatures. As a result, the main purpose of leaf senescence, i.e., the remobilization of nitrogen compounds, occurs before the early autumn frosts. This protects trees from nitrogen loss, and increases the efficiency of protein remobilization in these populations. Moreover, earlier senescence prepares trees for winter dormancy and allows them to store more nitrogen compounds for the next vegetative period [32,53]. On the other hand, the excessive accumulation of ROS in the leaves of provenances from higher altitudes is inhibited by the presence of significantly higher amounts of low-molecular-weight antioxidants and greater antioxidant enzyme activity than in low-altitude provenances. Admittedly, the leaves of provenances from higher altitudes contained more ROS than those of lower-altitude provenances. However, the greater activity of the antioxidative system in these individuals ensured their control over senescence metabolism as well as protection against the unfavorable abiotic factors that contribute to oxidative stress and affect plants much more intensely in mountainous conditions than in other ecosystems. This may also suggest that these individuals have additional molecular mechanisms apart from the antioxidant system that make them more tolerant to oxidative stress.

5. Conclusions

In conclusion, the main factors controlling leaf senescence in beech and the rate of ROS generation are temperature and photoperiod. We observed different effect of temperature changes in September and October on senescing leaves. The temperature decrease in September induced the senescence process while in October it began the advanced and irreversible stage of leaf senescence. The results obtained in this study showed a significant influence of the beech population altitude on the induction time, the length and progress of leaf senescence and the intensity of the oxidative stress accompanying this process. Our results provide further evidence to support the free radical theory of leaf senescence in beech. Apart from the devastating effects of ROS on cellular macromolecules, we demonstrated the dependence of the timing, progression and duration of leaf senescence and nutrient remobilization process in beech populations at various altitudes on ROS accumulation. This regulation effect has adaptive value because it allows high-altitude provenances to grow under stressful conditions and in shorter vegetative seasons. It also allows these populations to complete their leaf cycle and to remobilize and store nitrogen compounds even under the severe conditions in mountainous environments.

Supplementary Materials

The following are available online at https://www.mdpi.com/article/10.3390/f12050529/s1, Table S1: Summary of the results of repeated-measures ANOVAs with year (2013 vs. 2014), provenance and region as independent factors and sampling period as the repeated factor, Table S2: Pearson’s correlation coefficients (r) between senescence markers and oxidative stress marker content in senescing beech leaves from different altitudes, Table S3: Pearson’s correlation coefficients (r) between oxidative stress markers and antioxidative system components in senescing leaves of beech provenances from different altitudes, Table S4: The effect of the sampling date in year 2013 on senescence markers, oxidative stress markers and antioxidative system components in senescing leaves of beech provenances from different altitudes, Table S5: The effect of the sampling date in year 2014 on senescence markers, oxidative stress markers and antioxidative system components in senescing leaves of beech provenances from different altitudes.

Author Contributions

Conceptualization, W.K.; methodology, W.K.; formal analysis, W.K. and M.Z.; investigation, W.K. and M.Z.; writing—original draft preparation, W.K. and M.Z. All authors have read and agreed to the published version of the manuscript.

Funding

This work was supported by the Ministry of Science and Higher Education of the Republic of Poland.

Data Availability Statement

Not Applicable.

Conflicts of Interest

The authors declare no conflict of interest.

References

  1. Dolnicki, A.; Kraj, W. Leaf morphology and the dynamics of frost-hardiness of shoots in two phenological forms of European beech (Fagus sylvatica L.) from Southern Poland. Electron. J. Pol. Agric. Univ. 2001, 4, 1. [Google Scholar]
  2. Kempf, M.; Banach, J.; Skrzyszewska, K. Morphological variability of beech leaves from early and late flushing provenances. Balt. For. 2018, 24, 210–217. [Google Scholar]
  3. Kraj, W. Antioxidative enzyme activity as the factor causing differential autumn senescence in phenological forms of beech (Fagus sylvatica L.). Acta Physiol. Plant. 2017, 39, 16. [Google Scholar] [CrossRef]
  4. Kraj, W. Stem girdling affects the carbon/nitrogen imbalance and oxidative stress, and induces leaf senescence in phenological forms of beech (Fagus sylvatica). Acta Biol. Cracov. Bot. 2017, 59, 67–79. [Google Scholar] [CrossRef]
  5. Kraj, W. Chlorophyll degradation and the activity of chlorophyllase and Mg-dechelatase during leaf senescence in Fagus sylvatica. Dendrobiology 2015, 74, 43–57. [Google Scholar] [CrossRef] [Green Version]
  6. Kraj, W. Proteolytic activity and nitrogen remobilisation in senescing leaves of phenological forms of Fagus sylvatica. Dendrobiology 2014, 72, 163–176. [Google Scholar] [CrossRef] [Green Version]
  7. Kraj, W.; Sztorc, A. Genetic structure and variability of phenological forms in the European beech (Fagus sylvatica L.). Ann. For. Sci. 2009, 66, 203. [Google Scholar] [CrossRef] [Green Version]
  8. Müller, M.; Finkeldey, R. Genetic and adaptive trait variation in seedlings of European beech provenances from Northern Germany. Silvae Genet. 2016, 65, 65–73. [Google Scholar] [CrossRef] [Green Version]
  9. Ciocîrlan, E.; Sofletea, N.; Ducci, F.; Curtu, A.L. Patterns of genetic diversity in european beech (Fagus sylvatica L.) at the eastern margins of its distribution range. IForest 2017, 10, 916–922. [Google Scholar] [CrossRef]
  10. Szasz-Len, A.M.; Konnert, M. Genetic diversity in European beech (Fagus sylvatica L.) seed stands in the Romanian carpathians. Ann. For. Res. 2018, 61, 65–80. [Google Scholar] [CrossRef]
  11. Thiel, D.; Kreyling, J.; Backhaus, S.; Beierkuhnlein, C.; Buhk, C.; Egen, K.; Huber, G.; Konnert, M.; Nagy, L.; Jentsch, A. Different reactions of central and marginal provenances of fagus sylvatica to experimental drought. Eur. J. For. Res. 2014, 133, 247–260. [Google Scholar] [CrossRef]
  12. Harter, D.E.V.; Nagy, L.; Backhaus, S.; Beierkuhnlein, C.; Fussi, B.; Huber, G.; Jentsch, A.; Konnert, M.; Thiel, D.; Kreyling, J. A comparison of genetic diversity and phenotypic plasticity among european beech (Fagus sylvatica L.) populations from Bulgaria and Germany under drought and temperature manipulation. Int. J. Plant Sci. 2015, 176, 232–244. [Google Scholar] [CrossRef]
  13. García-Plazaola, J.I.; Esteban, R.; Hormaetxe, K.; Fernández-Marín, B.; Becerril, J.M. Photoprotective responses of Mediterranean and Atlantic trees to the extreme heat-wave of summer 2003 in Southwestern Europe. Trees 2008, 22, 385–392. [Google Scholar] [CrossRef]
  14. Vitasse, Y.; Hoch, G.; Randin, C.F.; Lenz, A.; Kollas, C.; Scheepens, J.F.; Körner, C. Elevational adaptation and plasticity in seedling phenology of temperate deciduous tree species. Oecologia 2013, 171, 663–678. [Google Scholar] [CrossRef]
  15. Lim, P.O.; Kim, H.J.; Gil Nam, H. Leaf senescence. Annu. Rev. Plant Biol. 2007, 58, 115–136. [Google Scholar] [CrossRef] [Green Version]
  16. Buchanan-Wollaston, V.; Earl, S.; Harrison, E.; Mathas, E.; Navabpour, S.; Page, T.; Pink, D. The molecular analysis of leaf senescence-a genomics approach. Plant Biotechnol. J. 2003, 1, 3–22. [Google Scholar] [CrossRef] [PubMed]
  17. García-Plazaola, J.I.; Hernández, A.; Becerril, J.M. Antioxidant and pigment composition during autumnal leaf senescence in woody deciduous species differing in their ecological traits. Plant Biol. 2003, 5, 557–566. [Google Scholar] [CrossRef]
  18. Coleman, G.D.; Englert, J.M.; Chen, T.H.H.; Fuchigami, L.H. Physiological and environmental requirements for poplar (Populus deltoides) bark storage protein degradation. Plant Physiol. 1993, 102, 53. [Google Scholar] [CrossRef] [PubMed] [Green Version]
  19. Kraj, W. Reactive oxygen species and antioxidant levels as the factors of autumn senescence in phenological forms of beech (Fagus sylvatica L.). Acta Physiol. Plant 2016, 38, 1–12. [Google Scholar] [CrossRef]
  20. Procházková, D.; Wilhelmová, N. Leaf senescence and activities of the antioxidant enzymes. Biol. Plant 2007, 51, 401–406. [Google Scholar] [CrossRef]
  21. Juvany, M.; Müller, M.; Munné-Bosch, S. Photo-oxidative stress in emerging and senescing leaves: A mirror image. J. Exp. Bot. 2013, 64, 3087–3098. [Google Scholar] [CrossRef]
  22. Jajic, I.; Sarna, T.; Strzałka, K. Senescence, stress, and reactive oxygen species. Plants 2015, 4, 393–411. [Google Scholar] [CrossRef] [PubMed] [Green Version]
  23. Choudhury, S.; Panda, P.; Sahoo, L.; Panda, S.K. Reactive oxygen species signaling in plants under abiotic stress. Plant Signal. Behav. 2013, 8, e236811–e236816. [Google Scholar] [CrossRef] [PubMed] [Green Version]
  24. Hossain, M.A.; Bhattacharjee, S.; Armin, S.M.; Qian, P.; Xin, W.; Li, H.Y.; Burritt, D.J.; Fujita, M.; Tran, L.S.P. Hydrogen peroxide priming modulates abiotic oxidative stress tolerance: Insights from ROS detoxification and scavenging. Front. Plant Sci. 2015, 6. [Google Scholar] [CrossRef] [PubMed] [Green Version]
  25. Zimmermann, P.; Zentgraf, U. The correlation between oxidative stress and leaf senescence during plant development. Cell Mol. Biol. Lett. 2005, 10, 515–534. [Google Scholar]
  26. Kumar, V.; Khare, T.; Srivastav, A.; Surekha, C.; Shriram, V.; Wani, S.H. Oxidative Stress and Leaf Senescence: Important Insights, in Senescence Signalling and Control in Plants; Sarwat, M., Tuteja, N., Eds.; Academic Press: Cambridge, MA, USA, 2019; pp. 139–163. [Google Scholar]
  27. Schuster, C.; Kirchner, M.; Jakobi, G.; Menzel, A. Frequency of inversions affects senescence phenology of Acer pseudoplatanus and Fagus sylvatica. Int. J. Biometeorol. 2014, 58, 485–498. [Google Scholar] [CrossRef]
  28. Fracheboud, Y.; Luquez, V.; Björkén, L.; Sjödin, A.; Tuominen, H.; Jansson, S. The control of autumn senescence in European aspen. Plant Physiol. 2009, 149, 1982–1991. [Google Scholar] [CrossRef] [Green Version]
  29. Kreyling, J.; Thiel, D.; Nagy, L.; Jentsch, A.; Huber, G.; Konnert, M.; Beierkuhnlein, C. Late frost sensitivity of juvenile Fagus sylvatica L. differs between southern Germany and Bulgaria and depends on preceding air temperature. Eur. J. For. Res. 2012, 131, 717–725. [Google Scholar] [CrossRef]
  30. Kreyling, J.; Buhk, C.; Backhaus, S.; Hallinger, M.; Huber, G.; Huber, L.; Jentsch, A.; Konnert, M.; Thiel, D.; Wilmking, M.; et al. Local adaptations to frost in marginal and central populations of the dominant forest tree Fagus sylvatica L. as affected by temperature and extreme drought in common garden experiments. Ecol. Evol. 2014, 4, 594–605. [Google Scholar] [CrossRef] [Green Version]
  31. Pigliucci, M.; Murren, C.J.; Schlichting, C.D. Phenotypic plasticity and evolution by genetic assimilation. J. Exp. Biol. 2006, 209, 2362. [Google Scholar] [CrossRef] [Green Version]
  32. Vitasse, Y.; Delzon, S.; Bresson, C.C.; Michalet, R.; Kremer, A. Altitudinal differentiation in growth and phenology among populations of temperate-zone tree species growing in a common garden. Can. J. For. Res. 2009, 39, 1259–1269. [Google Scholar] [CrossRef] [Green Version]
  33. Lichtenthaler, H.K.; Wellburn, A.R. Determinations of total carotenoids and chlorophylls a and b of leaf extracts in different solvents. Biochem. Soc. Trans. 1983, 11, 591–592. [Google Scholar] [CrossRef] [Green Version]
  34. Bradford, M.M. A rapid and sensitive method for the quantitation of microgram quantities of protein utilizing the principle of protein-dye binding. Anal. Biochem. 1976, 72, 248–254. [Google Scholar] [CrossRef]
  35. Tan, A.S.; Berridge, M.V. Superoxide produced by activated neutrophils efficiently reduces the tetrazolium salt, WST-1 to produce a soluble formazan: A simple colorimetric assay for measuring respiratory burst activation and for screening anti-inflammatory agents. J. Immunol. Methods 2000, 238, 59–68. [Google Scholar] [CrossRef]
  36. Dhindsa, R.S.; Plumb-Dhindsa, P.; Thorpe, T.A. Leaf senescence: Correlated with increased levels of membrane permeability and lipid peroxidation, and decreased levels of superoxide dismutase and catalase. J. Exp. Bot. 1981, 32, 93–101. [Google Scholar] [CrossRef]
  37. Gillespie, K.M.; Ainsworth, E.A. Measurement of reduced, oxidized and total ascorbate content in plants. Nat. Protoc. 2007, 2, 871. [Google Scholar] [CrossRef]
  38. Aebi, H. Isolation, purification, characterization, and assay of antioxygenic enzymes: Catalase in vitro. Methods Enzymol. 1984, 105, 121–126. [Google Scholar] [PubMed]
  39. Murshed, R.; Lopez-Lauri, F.; Sallanon, H. Microplate quantification of enzymes of the plant ascorbate–glutathione cycle. Anal. Biochem. 2008, 383, 320–322. [Google Scholar] [CrossRef] [PubMed]
  40. Peskin, A.V.; Winterbourn, C.C. A microtiter plate assay for superoxide dismutase using a water-soluble tetrazolium salt (WST-1). Clin. Chim. Acta 2000, 293, 157–166. [Google Scholar] [CrossRef]
  41. Sokal, R.R.; Rohlf, F.J. Biometry: The Principles and Practice of Statistics in Biological Research. A Series of books in Biology; W. H. Freeman and Company: New York, NY, USA, 1995; p. 887. [Google Scholar]
  42. Vitasse, Y.; Porté, A.J.; Kremer, A.; Michalet, R.; Delzon, S. Responses of canopy duration to temperature changes in four temperate tree species: Relative contributions of spring and autumn leaf phenology. Oecologia 2009, 161, 187–198. [Google Scholar] [CrossRef] [PubMed]
  43. Mostofa, M.G.; Seraj, Z.I.; Fujita, M. Exogenous sodium nitroprusside and glutathione alleviate copper toxicity by reducing copper uptake and oxidative damage in rice (Oryza sativa L.) seedlings. Protoplasma 2014, 251, 1373–1386. [Google Scholar] [CrossRef]
  44. Rana, P.S.; Saklani, P. Analyzing the effect of altitudinal variation in enzymatic antioxidants of coleus forskohlii from Uttarakhand, India. Plant Cell Biotechnol. Mol. Biol. 2019, 20, 442–450. [Google Scholar]
  45. Öncel, I.; Yurdakulol, E.; Keleş, Y.; Kurt, L.; Yıldız, A. Role of antioxidant defense system and biochemical adaptation on stress tolerance of high mountain and steppe plants. Acta Oecol. 2004, 26, 211–218. [Google Scholar] [CrossRef]
  46. Cui, G.; Ji, G.; Liu, S.; Li, B.; Lian, L.; He, W.; Zhang, P. Physiological adaptations of Elymus dahuricus to high altitude on the Qinghai–Tibetan Plateau. Acta Physiol. Plant 2019, 41, 115. [Google Scholar] [CrossRef]
  47. Munné-Bosch, S.; Jubany-Marí, T.; Alegre, L. Drought-induced senescence is characterized by a loss of antioxidant defences in chloroplasts. Plant Cell Environ. 2001, 24, 1319–1327. [Google Scholar] [CrossRef]
  48. Čufar, K.; de Luis, M.; Saz, M.A.; Črepinšek, Z.; Kajfež-Bogataj, L. Temporal shifts in leaf phenology of beech (Fagus sylvatica) depend on elevation. Trees Struct. Funct. 2012, 26, 1091–1100. [Google Scholar] [CrossRef]
  49. Himelblau, E.; Amasino, R.M. Nutrients mobilized from leaves of Arabidopsis thaliana during leaf senescence. J. Plant Physiol. 2001, 158, 1317–1323. [Google Scholar] [CrossRef]
  50. Guiboileau, A.; Sormani, R.; Meyer, C.; Masclaux-Daubresse, C. Senescence and death of plant organs: Nutrient recycling and developmental regulation. C. R. Biol. 2010, 333, 382–391. [Google Scholar] [CrossRef] [PubMed]
  51. Delpierre, N.; Dufrêne, E.; Soudani, K.; Ulrich, E.; Cecchini, S.; Boé, J.; François, C. Modelling interannual and spatial variability of leaf senescence for three deciduous tree species in France. Agric. For. Meteorol. 2009, 149, 938–948. [Google Scholar] [CrossRef]
  52. Distelfeld, A.; Avni, R.; Fischer, A.M. Senescence, nutrient remobilization, and yield in wheat and barley. J. Exp. Bot. 2014, 65, 3783–3798. [Google Scholar] [CrossRef] [PubMed] [Green Version]
  53. Keskitalo, J.; Bergquist, G.; Gardeström, P.; Jansson, S. A cellular timetable of autumn senescence. Plant Physiol. 2005, 139, 1635–1648. [Google Scholar] [CrossRef] [PubMed] [Green Version]
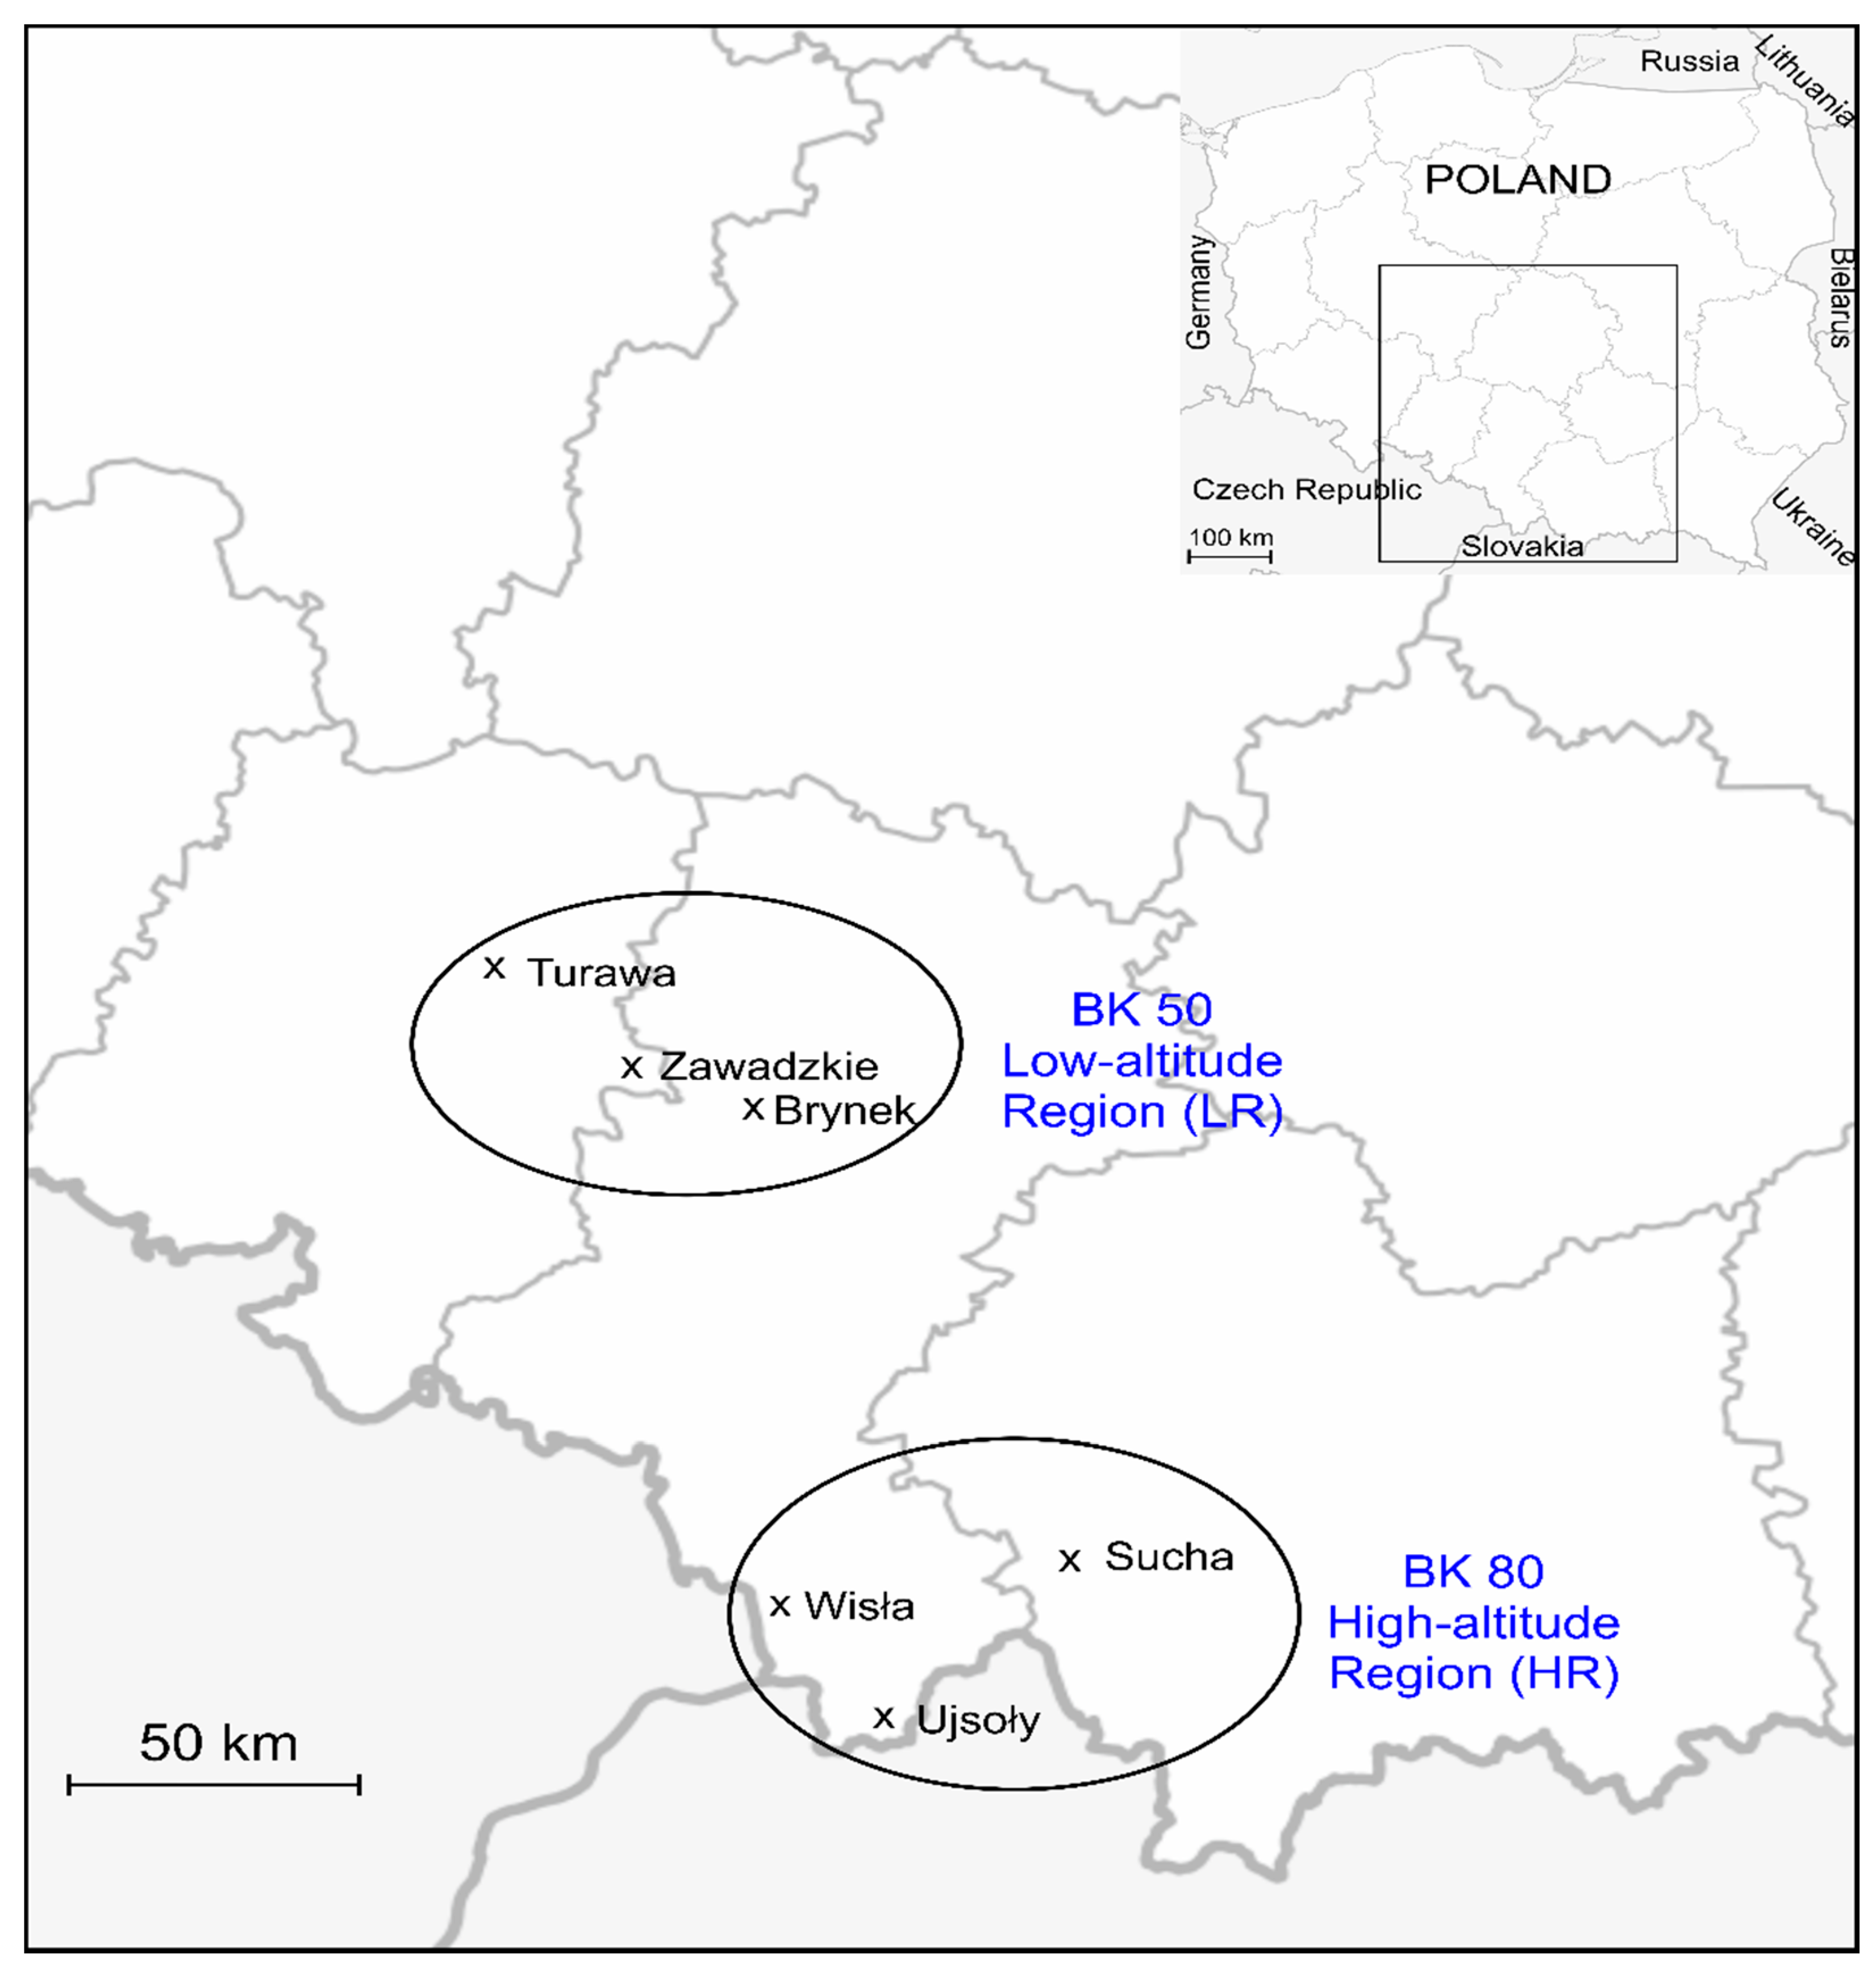
Figure 1. Map of Poland with the locations of the beech populations and regions of origin of the seeds used in the experiment.
Forests 12 00529 g001
Figure 2. Temperature conditions during the 2013 and 2014 sampling periods. The lines correspond to the minimum, average and maximum temperatures (°C). The arrows indicate the sampling dates. The sampling period phases are indicated (phases 0–III).
Forests 12 00529 g002
Figure 3. Changes in total chlorophyll (A) and protein (B) content in the leaves from different provenances of beech trees (Fagus sylvatica L.). Analyses were performed for provenances from high-altitude (dashed line) and low-altitude (solid line) regions in 2013 and 2014. Each point is the mean of 15 measurements (±SE). Means with different lowercase letters for each sampling date differ significantly at p < 0.05. The provenance labels are: Turawa–Tur/184/LR, Zawadzkie–Zaw/230/LR, Brynek–Bry/300/LR, Sucha–Suc/420/HR, Wisła–Wis/665/HR, Ujsoły–Ujs/849/HR (Table 1).
Forests 12 00529 g003
Figure 4. Changes in hydrogen peroxide (A), superoxide anion (B), and TBARS (C) content in the leaves from different provenances of beech trees (Fagus sylvatica L.). Analyses were performed for provenances from high-altitude (dashed line) and low-altitude (solid line) regions in 2013 and 2014. Each point is the mean of 15 measurements (±SE). Means with different lowercase letters for each sampling date differ significantly at p < 0.05.
Forests 12 00529 g004
Figure 5. Changes in carotenoid (A) and total ascorbate (B) content and percentage of DHA (C) in the leaves from different provenances of beech trees (Fagus sylvatica L.). Analyses were performed for provenances from high-altitude (dashed line) and low-altitude (solid line) regions in 2013 and 2014. Each point is the mean of 15 measurements (±SE). Means with different lowercase letters for each sampling date differ significantly at p < 0.05.
Forests 12 00529 g005
Figure 6. Changes in catalase (CAT) (A), ascorbate peroxidase (APX) (B) and superoxide dismutase (SOD) activity (C) in the leaves from different provenances of beech trees (Fagus sylvatica L.). Analyses were performed for provenances from high-altitude (dashed line) and low-altitude (solid line) regions in 2013 and 2014. Each point is the mean of 15 measurements (±SE). Means with different lowercase letters for each sampling date differ significantly at p < 0.05.
Forests 12 00529 g006
Figure 7. Principle Component Analysis (PCA) of the senescence, oxidative stress and antioxidative system activity markers of senescing beech leaves from different altitudes. The first two principal components are plotted. The components allowed the distinction of three groups of metabolites: Group A consists of senescence markers (chlorophyll, proteins) and carotenoids, Group B consists of oxidative stress markers (H2O2, O2, TBARS) and ascorbate in reduced (AsA) and oxidized (DHA) form), Group C consists of antioxidative enzymes (ascorbate peroxidase—APX, catalase—CAT, superoxide dismutase—SOD). The red squares represent each beech provenance.
Forests 12 00529 g007
Table 1. Coordinates, altitude and climatic conditions of the provenance locations of beech trees (Fagus sylvatica L.). Data is from the Institute of Meteorology and Water Management, National Research Institute from 2003–2013.
Provenance
Location
Provenance Code
(Provenance/Altitude/Region)
CoordinatesAltitude (m)Total Annual Precipitation (mm)Annual Minimum Temperature (°C)Annual
Maximum Temperature (°C)
Average Annual Temperature (°C)Growing Season Length (days)
Low-altitude region (LR)
TurawaTur/184/LR50°44′ N, 18°06′ E184700−8289218
ZawadzkieZaw/230/LR50°36′ N, 18°29′ E230700−9269212
BrynekBry/300/LR50°31′ N, 18°44′ E300750−8279224
Regional average238717−8.3279218
High-altitude region (HR)
SuchaSuc/420/HR49°44′ N, 19°35′ E4201000−11247193
WisłaWis/665/HR49°39′ N, 18°51′ E6651150−12226153
UjsołyUjs/849/HR49°28′ N, 19°08′ E8491200−13236150
Regional average6451117−12226.3165
Table 2. Temperature profile characteristics in the sampling periods in 2013 and 2014.
Sampling PeriodsYear
20132014
Temperature Characteristics (°C)
AverageMinimumMaximumChangeAverageMinimumMaximumChange
Phase 0 (two weeks before phase I)23.918.127.7−5.322.120.424.30.4
Phase I17.413.823.4−4.316.812.323.2−5.7
Phase II12.86.517.0−7.315.68.619.8−6.6
Phase III9.33.614.93.813.07.816.32.9
Total sampling period15.13.627.7−13.116.37.824.3−9.0
Table 3. Pearson’s correlation coefficients (r) among provenance location altitudes and biochemical parameters (senescence markers, oxidative stress markers, antioxidative system components) in senescing beech leaves.
Biochemical Parameter TypeBiochemical ParameterProvenance Altitude
Senescence markersTotal chlorophyll−0.549
Soluble protein−0.701
Oxidative stress markersHydrogen peroxide (H2O2)0.374
Superoxide anion (O2)0.612
Thiobarbituric acid-reactive substances (TBARS)0.614
Antioxidative componentsTotal ascorbate0.481
% Dehydroascorbate (DHA)0.342
Carotenoids−0.604
Antioxidative enzymesCatalase (CAT)0.505
Ascorbate peroxidase (APX)0.504
Superoxide dismutase (SOD)0.702
All Pearson’s correlation coefficients are significant at p < 0.001.
Publisher’s Note: MDPI stays neutral with regard to jurisdictional claims in published maps and institutional affiliations.