Abstract
Afforestation with different tree species formed different vegetation patterns, and altered soil properties and the composition and diversity of the soil bacterial community. In order to analyze the difference characteristics of vegetation, soil and bacterial community after 20 years’ restoration of different tree species, we investigated changes in vegetation (tree, shrubs, and herbs), soil properties and the soil bacterial community composition in the topsoil (0–10 cm) following afforestation of P. asperata Mast. and L. kaempferi (Lamb.) Carr.on the southern slope of the Qinling mountains. The results showed that, within a 20-year recovery period, the restorative effect of L. kaempferi was better than that of P. asperata, for alpha diversity and biomass of vegetation, composition and diversity of soil bacterial community were all preferable under nearly same environmental conditions if just taking these indices into consideration. Additionally, biodiversity of L. kaempfer was much richer than that of P. asperata. Our observations suggest that soil physicochemical properties, soil bacterial community composition and diversity following afforestation were mainly affected by tree species. The results could explain our hypothesis to some extent that a planted forest with quick growth speed and sparse canopy has higher biomass productivity and alpha diversity of ecosystem.
1. Introduction
The forest ecosystem is the most important part of terrestrial ecosystems with complex structure and function, which houses a major portion of terrestrial biological diversity, including an estimated 80% of all terrestrial species [1,2], and would likely play a long-term and sustained role in mitigating global warming as a huge global carbon pool [3]. In recent centuries, with the development of society and economy, forest resources are facing high-intensity exploitation and utilization, which directly or indirectly lead to the destruction and degradation of forest [4]. Globally, the extent of the world’s forest continues to decline as the human population continues to grow and demand for food and land increases; in 1990 the world had 4128 million ha of forest but by 2015 this area had decreased to 3999 million ha [5]. In order to change this trend, forest planting has become an efficient method to achieve ecological and economic demands of the forest. Tree restoration processes build new environmental conditions [6], and different planted tree species result in the formation of different ecological environment conditions, which directly or indirectly affected soil physico–chemical properties as well as the structure and function of soil microbial communities [7,8]. Similarly, the structure and function of soil microbial communities can in turn affect plant productivity by regulating plant nutrient availability [9,10]. Lots of studies on planted forest ecosystems have been reported [11], such as forest ecosystem recovery assessments [1], planted forest and biodiversity studies [2,12], biomass, carbon and nutrient storage of planted forest [13], effects on hydrologic process caused by forest vegetation change [14], effects of tree species and soil properties on the composition and diversity of the soil microbial community [4,8], however few studies have examined the correlation between plant diversity and soil bacterial community structure between two different planted tree species at the same restoration age.
The Qinling Mountains are the most important natural climatic boundary between the subtropical and warm temperate zones of China and support an astonishingly high biodiversity [15]. However, the Qinling Mountains have undergone a period of commercial logging from the 1970s to 1990s in the 20th century, which resulted in serious destruction of the forest ecosystem [16]. By 1998, the Natural Forest Protection Program was implemented and commercial logging of natural forests was banned in the Qinling Mountains. Then, artificial afforestation was fully expanded in the destroyed areas with different tree species and managements, forming various forest types at different succession stages. Meanwhile, in the context of global warming, high-altitude mountain soil has become an interest research area for climate change is occurring more intensely in cold regions [15]. These features suggest that the restoration forest ecosystem in the Qinling Mountains is an ideal field to study the discrepancies between ecological conditions driven by different planted trees species.
According to these, one hypothesis could be taken into consideration that forests with quick growth speed and sparse canopy may have higher biomass productivity and alpha diversity, this may be meaningful for carbon sink and restoration of forest ecosystems. Thus, in order to answer the hypothesis, the purposes of this study were listed as follows: (i) to compare the alpha diversity and biomass of plant of different planted tree species; (ii) to characterize the soil physico–chemical properties at different forest ecosystems; (iii) to make clear about the characteristics of soil bacterial communities under different tree species, including compositions, alpha-diversity and their interrelationship with soil physico–chemical properties.
2. Material and Methods
2.1. Field Site and Sampling
The study site is located in the Changqing National Nature Reserve, south slope of the Qinling Mountains, China (Figure 1). The reserve has an area of 29,906 ha approximately, with elevational range between 800 and 3071 m asl, and its forest coverage is greater than 90%. It is a transitional climate region between the north subtropics and the warm temperate zone, types of forest vary from sub-tropical to cold temperate.
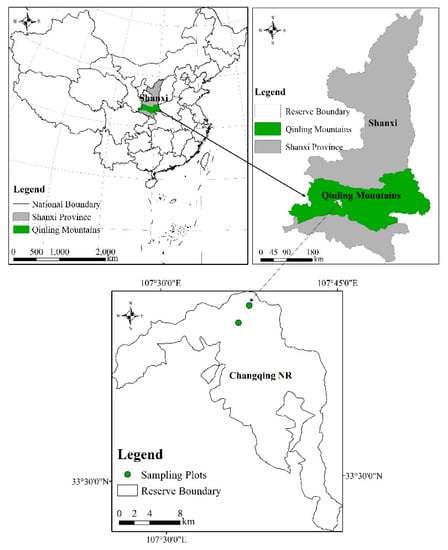
Figure 1.
Geographical location diagram of the study area in Changqing National Reserve (NR).
Field work was conducted in July 2018. Two types of planted forest, Picea asperata and Larix kaempferi were selected for field survey (Table 1), which were reforested in 1998 after deforestation. Two permanent sample plots of 100 m × 100 m were established in the region with orderly forest facies and complete topography in the two types of planted forest (Table 1). Field survey included three parts: plant survey, litter sampling and soil sampling. The type of soils of study area was brown forest soil, alfisol according to Chinese soil taxonomy.

Table 1.
Basic information of the research site.
For the plant survey, quadrats of 10 m × 10 m were used for the tree layer, 3 m × 3 m for shrubs, and 1 m × 1 m for herbs species (Figure 2). We measured every tree (DBH, diameter at breast height ≥5 cm) in the quadrats, and took down their amounts, tree species, DBH (at 1.37 m), tree height and canopy for tree layer analysis. Additionally, abundance, species, height, canopy of shrubs and herbs in every quadrat were also recorded.
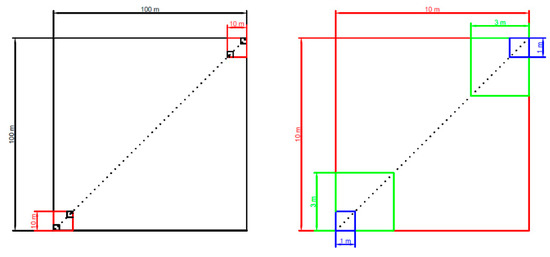
Figure 2.
Field sampling design, whereas 100 m × 100 m quadrat in black line was the permanent sample plot, 10 m × 10 m. Quadrats in red line were tree layer investigation plot, 3 m × 3 m quadrats in green line were shrub layer investigation plot, and 1 m × 1 m quadrats in blue line were herb layer investigation plot.
For litter survey, quadrats of 0.5 m × 0.5 m were established randomly in triple under the tree layer quadrat. All the litters in each quadrat were taken away to obtain the biomass of litter, and their carbon fraction coefficient.
Soils were sampled from soil surface (0–10 cm, after clear out the humus horizon) at each sampling plot using a soil borer with a diameter of 3.5 cm. To guarantee the representative of soil samples, random triplicate point sampling was applied. Soils from the 3 points were well mixed and screened using 2-mm sieves to remove residual plants roots and debris as a replicate sample from each plot. Soil samples were placed in sterile plastic bags, and then divided into two groups, one with aviation ice in a heat preservation box and taken to the laboratory in 24 h, then stored at −80 ℃ in the laboratory for high-throughput sequencing. Another one was air-dried at room temperature to determine soil chemical characteristics. Soil bulk density was measured using the core cutter method [17].
2.2. Sample Analysis
2.2.1. Biomass Estimation of Plant
The biomass of tree was calculated using DBH and tree height data from field survey with the biomass regression equation. The equation is shown as formula (1).
where W is tree biomass, D is DBH, H is tree height, a and b are coefficients for specific forest types (Table S1). Biomass of shrubs and herbs were measured through sampling in the field work, including aboveground and belowground biomass [18].
2.2.2. Physico–Chemical Analysis
Physico–Chemical properties of soil were all measured by using routine methods, and each treatment was conducted in triplicate. Potentiometry (water:soil = 2.5:1) [19], potassium dichromate oxidation-external heating method [20], semimicro-kjeldahl method [21] and HClO4-H2SO4 method [22] were applied for pH, soil organic carbon (SOC), total nitrogen (TN), total phosphate (TP), respectively.
2.2.3. Soil Microbial DNA Extraction, PCR Amplification and Sequencing
Total genome DNA from samples was extracted using CTAB/SDS method. The bacterial hepervariable V4 region (515F–806R) of the 16S rRNA genes was amplified using specific primer with the barcode. Samples with a bright main strip between 400 and 450 bp were chosen for further experiments. Samples were sequenced on an IlluminaHiSeq2500 platform and 250 bp paired-end reads were generated.
2.3. Pyrosequencing Data Treatment
Sequence analysis was performed by Uparse software (Uparse v7.0.1001). Sequences with ≥97% similarity were assigned to the same OTUs. The GreenGene Database was used based on an RDP classifier (Version 2.2) algorithm to annotate taxonomic information. OTUs abundance information were normalized using a standard of sequence number corresponding to the sample with the least sequences. Subsequent analysis was all performed basing on this output normalized data under R software.
2.4. Data Processing and Statistical Analysis
Alpha diversity of tree layer was quantitatively analyzed for occurrence frequency, density, average DBH, average tree height. Shannon diversity index (H′), Simpson dominance index (D), evenness index (Jw) and diversity threshold (Dv) were computed for shrubs and herbs layers (equations as shown in Table S2).
Statistics analysis of bacterial alpha diversity via observed species, Chao1 and Shannon’s indices were performed using QIIME (Version 1.7.0) and displayed with R software (Version 3.6.1). Mantel tests were conducted with the “mantel” function in the Vegan package to examine the interrelationships among the edaphic variables and soil bacterial characteristics.
3. Results
3.1. Diversities and Biomass of Vegetation
3.1.1. Alpha Diversity of P. asperata Forest
A total of 13 species were observed in all quadrats of P. asperata forest, among which 3 were trees, 8 were shrubs, and 2 were herbs. Among the tree species, P. asperata was dominant with the occurrence frequency of 88.37% in the sample area. The density of P. asperata was 1900 trees·ha−1, with the average DBH and average tree height of 6.85 ± 4.02 cm and 8.92 ± 1.58 m, respectively (Table 2). Four diversity indices were calculated for shrubs and herbs layer, Shannon index (H′), species dominance (D), species evenness (Jw), and diversity threshold (Dv), which were 1.80, 0.78, 0.87, and 2.08 among shrubs layer, and 0.69, 0.50, 0.72, and 0.96 for herbs layer, respectively. Plant diversity of P. asperata forest stayed at a low level. For Dv a value less than 1.5 means poor biodiversity of the ecosystem (Figure 3).

Table 2.
Alpha diversity of the tree layer.
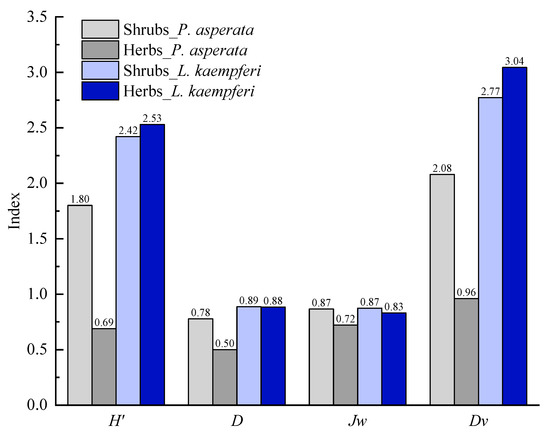
Figure 3.
Alpha diversity of the shrubs and herbs layer.
3.1.2. Alpha Diversity of L. kaempferi Forest
Compared to P. asperata forest, 39 species were observed, and 2 were trees, 16 were shrubs, and 21 were herbs, which were much higher than P. asperata forest. Among the tree species, L. kaempferi was dominant with the occurrence frequency of 97.78% in the sample area. The density of L. kaempferi was 2200 trees·ha−1, with the average DBH and average tree height of 15.37 ± 3.56 cm and 11.06 ± 1.08 m, respectively (Table 2). Diversities (H′, D, Jw, and Dv) of the shrubs and herbs layers were also higher than those of P. asperata forest, which were 2.42, 0.89, 0.87, and 2.77 for the shrubs layer, 2.53, 0.88, 0.83, and 3.04 for the herbs layer, respectively. Biodiversity was much better than that of P. asperata forest (Figure 3).
3.1.3. Vegetation Biomass of P. asperata and L. kaempferi Forest
The total biomass (including litter biomass) of vegetation in L. kaempferi (169.15 ± 13.44 t·ha−1) was greater than that of P. asperata (150.80 ± 16.75 t·ha−1). In part, biomass of trees, shrubs, herbs, and litter in L. kaempferi were all greater than those in P. asperata. In terms of different components of trees, biomass of leaf and root in P. asperata were higher than those in L. kaempferi, though the biomass of trees in L. kaempferi (151.09 ± 7.68 t·ha−1) was much higher than that in P. asperata (137.65 ± 15.12 t·ha−1) (Figure 4).
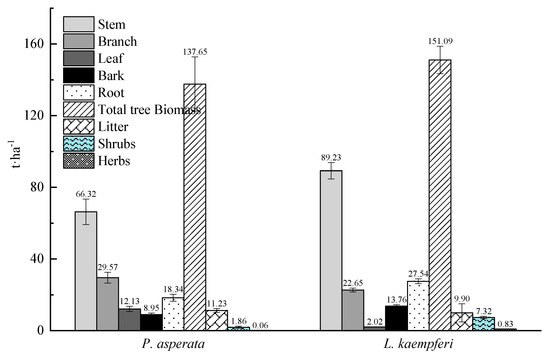
Figure 4.
Biomass of two typical forest ecosystems.
3.2. Physico–Chemical Properties of Soils
The values of pH, SOC, and TN in the soils of P. asperata forest were of 4.08 ± 0.02, 26.53 ± 0.14 g·kg−1, and 5.19 ± 0.07 g·kg−1, respectively, whereas the values in the soils of L. kaempferi forest were 3.93 ± 0.08, 21.36 ± 0.39 g·kg−1, and 4.18 ± 0.09 g·kg−1, respectively. To some extent, the values of pH, SOC, and TN in the soils of P. asperata forest were higher. For TP, the value in soils of L. kaempferi forest (1.13 ± 0.01 g·kg−1) was higher than that in soils of P. asperata forest (0.92 ± 0.01 g·kg−1) (Table 3).

Table 3.
Physicochemical properties of sampling soils.
3.3. Diversity and Composition of Soil Bacterial Community
A total of 123,322 tags and 6,697 OTUs (at 97% similarity threshold) were identified in the present study (Figure 5). For P. asperata forest, 3123 OTUs were obtained and identified as 36 phyla, 310 genera, which were less than those of soils in L. kaempferi forest with 41 phyla and 368 genera identified (Table S2).
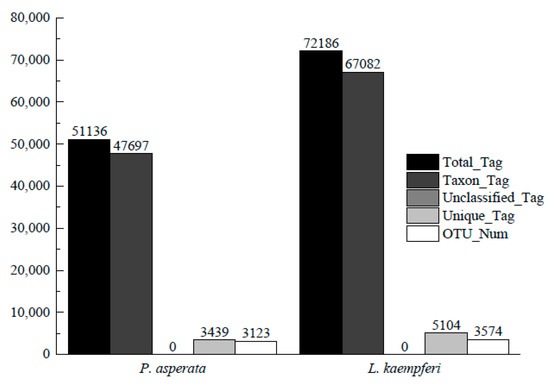
Figure 5.
Taxa dynamics of soil bacterial communities.
Bacteria community composition differed between two forest types in relative abundance profiles. Across all samples, 44 distinct bacteria phyla were detected, among which the top five phyla (Proteobacteria, Acidobacteria, Verrucomicrobia, Bacteroidetes, and Firmicutes) comprised more than 85% of all abundance in bacteria communities. Bacteria community composition differed substantially between locations at phyla level, such as bacteria communities of P. asperata forest enriched for Proteobacteria (49.98%), while Acidobacteria in L. kaempferi forest (35.57%) was much more abundant than that in P. asperata forest (21.01%) (Figure 6, Table S2).
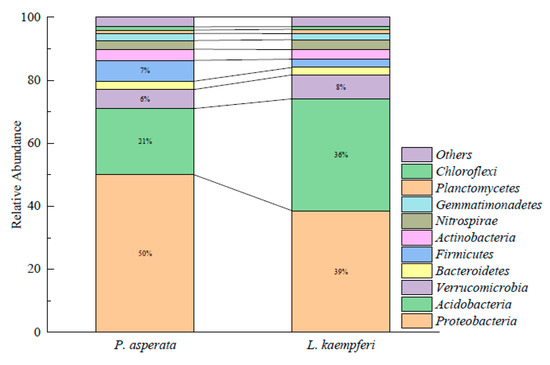
Figure 6.
Top ten bacterial phylum of the two soil groups from P. asperata and L. kaempferi forest.
Alpha diversity measured by the Shannon (H′) index, chao1 and observed species, showed significant differences between two different forest types. Lower values were observed in the P. asperata forest, with values of 8.80, 2799.40, and 2706, respectively, while those in the L. kaempferi forest were 8.86, 3565.47, and 3040, respectively (Figure 7). This pattern was similarly to the plant alpha diversity.
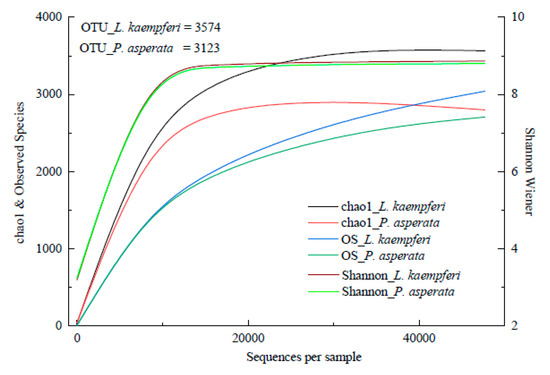
Figure 7.
Alpha-diversity of the soil bacterial community in the two forest ecosystems.
Alpha diversity indexes of soil bacterial community were significantly responsive to plant biomass and alpha diversity of plant. To validate the relationships among the soil bacterial communities, plant alpha diversity, plant biomass, and edaphic properties, a Mantel test was performed to show the relationships among the variables. The Mantel test showed that there was significant relationship between soil bacterial communities and plant properties, but no significant relationship between soil bacterial communities and edaphic properties or between plant properties and physico–chemical properties. For example, bacterial alpha diversity was significant related to plant biomass and plant alpha diversity (r values were 0.946 and 0.983, respectively, p < 0.01) (Table 4). Furthermore, the correlation was significant between plant biomass and alpha diversity of plant (r values were 0.964, p < 0.01). These results could verify our hypothesis that forest with quick growth speed and sparse canopy may has higher biomass productivity and alpha diversity.

Table 4.
Mantel tests between plant biomass, plant alpha diversities, bacterial composition, bacterial alpha diversity and soil properties, across two forest types.
4. Discussion
4.1. Distribution Characteristics of Vegetation
According to the results, alpha diversity of the tree layer (occurrence frequency, tree density, average DBH, and average TH) of L. kaempferi forest was higher than that of P. asperata forest. The main reason may be that the growth rate of L. kaempferi was much faster than that of P. asperata [23]. This is because P. asperata is an evergreen tree species, while L. kaempferi is A deciduous tree species, which meant that the canopy of P. asperata was higher than that of L. kaempferi. Furthermore, the difference in canopy of the tree layer could directly affect the micro-climate under the tree, such as precipitation and sunshine [24]. Abundant precipitation, full sunshine and nutrient-rich soil were considered to be suitable for supporting plant growth in the southern slope of the Qinling Mountains [25]. More precipitation and sunshine could reach shrub and herbs layers in L. kaempferi forest due to its lower canopy, and this may be the main reason that the alpha diversity of shrub and herbs in L. kaempferi forest were also higher than those of shrub and herbs in P. asperata forest (Figure 8).
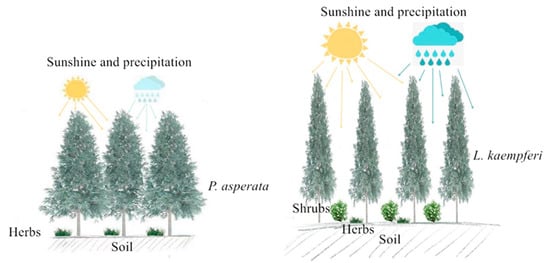
Figure 8.
Conceptual figure of P. asperata and L. kaempferi forest, where less sunshine and precipitation can reach to ground in P. asperata forest than in L. kaempferi forest.
Allometric equations are crucial in order to accurately estimate forest biomass. A number of previous studies demonstrated that power function allometric equations based on DBH and TH can be used to estimate tree biomass [3,13,26]. In this study, we estimated different tree components’ biomass based on DBH and TH, the results were smaller than the results of previous studies in the similar regions [27,28,29,30]. These obvious differences may be mainly caused by tree age. Zhao et al. reported that, in a hilly region of the Taihang Mountain, tree biomass significantly increased from 131.65 t ha−1 in a 20-year-old stand to 202.96 and 291.15 t ha−1 in 30- and 40-year-old stands, respectively [31].
The litter of the forest increased gradually with the increase in latitude, and the main controlling factor on litter decomposition was temperature [32]. The fact that litter biomass of P. asperata forest was higher in our study could be well explained for the annual temperature was lower.
This study reveals that the two types of forests behave differently in terms of different planted trees species. Higher density and species richness for herbs and shrubs in L. kaempferi forest indicate that opening of canopies favors herb and shrub growth which gives overall stability to the forest ecosystem.
4.2. Factors That Effected Soil Physico–Chemical Properties
Afforestation with singe and mixed tree species alters soil properties [4]. In our study, pH, SOC and TN in P. asperata forest soils were higher than those in L. kaempferi forest soils, but there were no significant differences. The discrepancies may be caused by various degree of forest canopy [33,34], temperature and precipitation [34], litter composition or root exudates [8]. In comparison with the results from Wang et al. (2015), SOC in our study was lower, which may be related to the young tree age in our study [35]. C/N ratio is a sign of soil nitrogen mineralization ability, which is inversely proportional to the rate of soil organic matter decomposition [36]. In our study, C/N ratio in P. asperata forest soils was a little bit higher than that in L. kaempferi forest soils though with no significant difference, representing the rate of SOC decomposition was lower in P. asperata forest soils, and this may be an important reason why SOC in P. asperata forest soils was higher. Phosphorus was one of the three most important elements for plant growth. Previous research has shown that TP in Larix forest soils was higher than that in Pinus koraiensis and Birch forest soils [37], which was similar with the result in our study. For there was higher phosphorus in Larix leaves, and along with litter decomposition, more phosphorus was accumulated in soils [38].
4.3. Effects of Tree Species on Soil Bacterial Community Composition
Plant species and diversity, driven by temperature and moisture content, also strongly influence the soil microbial community composition and diversity [39]. In our study, Proteobacteria, Acidobacteria, Verrucomicrobia, Bacteroidetes, and Firmicutes were the predominant bacterial groups in all of the soils, which were different from the results of Wang et al. 2018 [15]. These differences may be influenced by different samples from different forest ecosystems. This kind of influence lies in the difference between climate and soil physico–chemical properties of the specific forest ecosystems [40]. Recent studies have demonstrated that plant host-specific traits, including broad morphological characteristics [41] and specific genetic pathways and gene products [42,43], can have significant effects on microbiome composition and diversity. Differences of bacterial composition were also found between two research regions in our study, for example, though Proteobacteria and Acidobacteria were the first two predominant phyla in all soil samples, their proportions were different between the two study locations. Studies have shown that Acidobacteria was less abundant when the soil was moister and cooler [44,45], which was consistent with the results in our study. Additionally, Proteobacteria was the carbon availability preferences of this phylum [46], which could explain the different proportions of Proteobacteria between two forest types with different SOC.
The establishment and development of plantation forests with different tree species drive alterations in the composition and diversity of soil microbial community [4]. Previous research found that bacterial alpha diversity was significantly related to the plant diversity, biomass, SOC, and TN [47], which was similar with our results that demonstrated a significant relationship between soil bacterial communities and plant properties. This may be because the higher plant diversity might be expected to have higher root trait diversity, and which in turn results in the exudation of a more diverse range of organic compounds into the soil, thereby sustaining higher bacterial alpha diversity [48,49]. In addition, it was generally accepted that below-ground microbial community can affect the above-ground plant community by carrying out a wide spectrum of decomposition processes [50].
Different from the result that soil pH was the most important influencing factor for driving the composition and alpha-diversity patterns of soil microbial community [51], we found there was no significant relationship between alpha-diversity of soil bacterial and pH, the same as the result of Liu et al. (2018) that soil bacterial community composition and diversity following afforestation were mainly affected by tree species, followed by soil parameters.
5. Conclusions
Afforestation with different tree species formed different vegetation patterns, and altered soil properties and the composition and diversity of soil bacterial community. Generally speaking, within a 20-year recovery period, the restorative effect of L. kaempferi was better than that of P. asperata, as alpha diversity and biomass of vegetation, composition and diversity of soil bacterial community of the ecosystem were all preferable under nearly same environmental conditions if only taking these indices into consideration. The results could explain our hypothesis to some extent that a planted forest with quick growth speed and sparse canopy has higher biomass productivity and produces higher alpha diversity of ecosystem. It could be concluded that L. kaempferi was a good option of planted tree species for global warming and biodiversity protection. Furthermore, long term observation is needed to confirmthe restorative effect in more aspects.
Supplementary Materials
The following are available online at https://www.mdpi.com/article/10.3390/f12050562/s1. Table S1: Biomass regression equation of L. kaempferi and P. asperata; Table S2: Main index calculated equations of alpha diversity for shrubs and herbs.
Author Contributions
W.S. drafted the manuscript and was responsible for field work, samples collection, and analysis. X.L., Z.T. and X.S. participated in field work and reviewed the manuscript. X.L. was responsible for the research design and designed and reviewed the manuscript. All authors contributed to the editing and review of the manuscript. All authors have read and agreed to the published version of the manuscript.
Funding
This research was supported by the National Natural Science Foundation of China (NSFC, No. 41,271,194 and No. 41671193).
Institutional Review Board Statement
Not applicable.
Informed Consent Statement
Not applicable.
Data Availability Statement
The data presented in this study are available in supplementary material Table S3.
Acknowledgments
We would like to thank Jiang Ying from the Henan Agriculture University for the samples testing service. Additionally, we are also very thankful for the help from the staff of the Changqing National Nature Reserve.
Conflicts of Interest
The authors declare no conflict of interest.
References
- Stephens, S.S.; Wagner, M.R. Forest Plantations and Biodiversity: A Fresh Perspective. J. For. 2007, 105, 307–313. [Google Scholar] [CrossRef]
- Carnus, J.-M.; Parrotta, J.; Brockerhoff, E.; Arbez, M.; Jactel, H.; Kremer, A.; Lamb, D.; O’Hara, K.; Walters, B. Planted Forests and Biodiversity. J. For. 2006, 104, 65–77. [Google Scholar] [CrossRef]
- Zhao, M.; Yang, J.; Zhao, N.; Liu, Y.; Wang, Y.; Wilson, J.P.; Yue, T. Estimation of China’s forest stand biomass carbon sequestration based on the continuous biomass expansion factor model and seven forest inventories from 1977 to 2013. For. Ecol. Manag. 2019, 448, 528–534. [Google Scholar] [CrossRef]
- Liu, J.; Dang, P.; Gao, Y.; Zhu, H.; Zhu, H.; Zhao, F.; Zhao, Z. Effects of tree species and soil properties on the composition and diversity of the soil bacterial community following afforestation. For. Ecol. Manag. 2018, 427, 342–349. [Google Scholar] [CrossRef]
- FAO. Global Forest Resources Assessment 2015: How Are the World’s Forests Changing? The Food and Agriculture Organization: Rome, Italy, 2016. [Google Scholar]
- Song, X.C.; Wang, H.L.; Qin, W.D.; Deng, X.J.; Tian, H.D.; Tan, Y.B.; Wang, S.H.; Cao, J.Z. Effects of stand of artificial forests on soil microbila functhional diversity. Chin. J. Appl. Ecol. 2019, 30, 841–848. [Google Scholar]
- He, Y.J.; Liang, X.Y.; Qin, L.; Li, Z.Y.; Shao, M.X.; Tan, L. Community characteristics and soil properties of coniferous plantation forest monocultures in the early stages after close-to-nature transformation management in southern subtropical China. Acta Ecol. Sin. 2013, 33, 2484–2495. [Google Scholar]
- Chodak, M.; Klimek, B.; Azarbad, H.; Jaźwa, M. Functional diversity of soil microbial communities under Scots pine, Norway spruce, silver birch and mixed boreal forests. Pedobiologia 2015, 58, 81–88. [Google Scholar] [CrossRef]
- Zheng, H.; Ouyang, Z.Y.; Wang, X.K.; Fang, Z.G.; Zhao, T.Q.; Miao, H. Effects of regenerating forest cover on soil microbial communities: A case study in hilly red soil region, Southern China. For. Ecol. Manag. 2005, 217, 244–254. [Google Scholar] [CrossRef]
- Xu, Q.; Jiang, P.; Xu, Z. Soil microbial functional diversity under intensively managed bamboo plantations in southern China. J. Soils Sediments 2008, 8, 177–183. [Google Scholar] [CrossRef]
- Chan, O.C.; Yang, X.; Fu, Y.; Feng, Z.; Sha, L.; Casper, P.; Zou, X. 16S rRNA gene analyses of bacterial community structures in the soils of evergreen broad-leaved forests in south-west China. FEMS Microbiol Ecol. 2006, 58, 13. [Google Scholar] [CrossRef]
- Wheeler, C.E.; Omeja, P.A.; Chapman, C.A.; Glipin, M.; Tumwesigye, C.; Lewis, S.L. Carbon sequestration and biodiversity following 18 years of active tropical forest restoration. For. Ecol. Manag. 2016, 373, 44–55. [Google Scholar] [CrossRef]
- Cao, Y.; Chen, Y. Biomass, Carbon and Nutrient Storage in a 30-Year-Old Chinese Cork Oak (Quercus Variabilis) Forest on the South Slope of the Qinling Mountains, China. Forests 2015, 6, 1239–1255. [Google Scholar] [CrossRef]
- Zheng, H.; Chen, F.; Ouyang, Z.; Tu, N.; Xu, W.; Wang, X.; Miao, H.; Li, X.; Tian, Y. Impacts of reforestation approaches on runoff control in the hilly red soil region of Southern China. J. Hydrol. 2008, 356, 174–184. [Google Scholar] [CrossRef]
- Wang, H.H.; Chu, H.L.; Dou, Q.; Xie, Q.Z.; Tang, M.; Sung, C.K.; Wang, C.Y. Phosphorus and Nitrogen Drive the Seasonal Dynamics of Bacterial Communities in Pinus Forest Rhizospheric Soil of the Qinling Mountains. Front. Microbiol. 2018, 9, 1930. [Google Scholar] [CrossRef]
- Liu, X.; Wu, P.; Shao, X.; Songer, M.; Cai, Q.; Zhu, Y.; He, X. Spatiotemporally monitoring forest landscape for giant panda habitat through a high learning-sensitive neural network in Guanyinshan Nature Reserve in the Qinling Mountains, China. Environ. Earth Sci. 2017, 76, 1–12. [Google Scholar] [CrossRef]
- Jiang, S.G. Review on soil bulk density determination method. Hubei Agric. S 2019, 58, 82–91. [Google Scholar]
- De Feudis, M.; Falsone, G.; Vianello, G.; Vittori Antisari, L. The Conversion of Abandoned Chestnut Forests to Managed Ones Does Not Affect the Soil Chemical Properties and Improves the Soil Microbial Biomass Activity. Forests 2020, 11, 786. [Google Scholar] [CrossRef]
- Bao, S.D. Soil Agrochemical Analysis, 3rd ed.; China Agriculture Press: Beijing, China, 2000. [Google Scholar]
- Xue, W.P. Characteristics of Soil Organic Carbon Density in Pinus Armandii and Picea Asperata Forest in Qinling Mountains. Master’s Thesis, Northwest Agriculture & Forestry University, Xi’an, China, 2016. [Google Scholar]
- Bremner, J.; Mulvaney, C. Nitrogen-total. Methods Soil Anal. 1996, 5, 1085–1121. [Google Scholar]
- Zhang, C.; Xue, S.; Liu, G.B.; Song, Z.L. A comparison of soil qualities of different revegetation types in the Loess Plateau, China. Plant. Soil 2011, 347, 163–178. [Google Scholar] [CrossRef]
- Editorial committee of Chinese flora, Chinese Academy of Sciences. Flora of China; Editorial committee of Chinese flora, Science Press: Bejing, China, 1993. [Google Scholar]
- Ji, L. Biomass and Diversity of Shrubs and Herbs under Three Type different Canopy Forests in Jingouling Forestry Station. Master’s Thesis, Beijing Forestry University, Beijing, China, 2016. [Google Scholar]
- Guangquan, L.; Shidong, Z.; Xiaoning, T. Distributional characteristice on biomass and nutrient elements of Pine-oak forest belt in MT. Qingling. Sci. Silvae Sin. 2001, 1, 28–36. [Google Scholar]
- Xu, L.; Yu, G.; He, N.; Wang, Q.; Gao, Y.; Wen, D.; Ge, J. Carbon storage in China’s terrestrial ecosystems: A synthesis. Sci. Rep. 2018, 8, 2806. [Google Scholar] [CrossRef]
- Liu, H. Changes in Landscapes Pattern and Carbon Storage of Main Forest Tyes at Huoditang Forest Region in the Qinling Mountains. Ph.D. Thesis, Northwest Agriculture & Forestry University, Xi’an, China, 2005. [Google Scholar]
- Lin, H.; Ruide, L.; Dexiang, W.; Lianbin, S.; Hui, Z. Carbon density of arbor layer in Pinus tabulaeformis community in Huoditang forest region in Qinling Mountains. J. Northeast For. Univ. 2009, 37, 23–25. [Google Scholar]
- Kang, L. Research on Arborous Layer Aboveground Biomass and Gross Productivity of the Typical Forest Types on the Southern Slope of Qinling Mountains. Master’s Thesis, Northwest Agriculture & Forestry University, Xi’an, China, 2012. [Google Scholar]
- Ren, Y.H. Carbon Sequestration of Main Forest Tyoes at Huoditang Forest Region in the Qinling Mountains. Master’s Thesis, Northwest Agriculture & Forestry University, Xi’an, China, 2012. [Google Scholar]
- Zhao, Y.; Wang, P.; Fan, W.; Zhu, Y. Nutrient cycling in Quercus varlabilis plantations of different ages classes in hilly region of Taihang Mountain. Sci. Soil Water Conserv. 2009, 7, 66–71. [Google Scholar]
- Wen, D.; He, N.P. Spatial patterns of litter density and their controlling factors in forests and grasslands of China. Acta Ecol. Sin. 2016, 36, 2876–2884. [Google Scholar]
- Niu, X.Y.; Sun, X.M.; Chen, D.S.; Zhan, S.G. Soil microorganisms, nutrients and enzyme activity of Larix kaempferi plantation under different ages in mountainous region of eastern Liaoning Province, China. Chin. J. Appl. Ecol. 2015, 26, 2663–2672. [Google Scholar]
- Zhang, J.; Peng, C.; Zhu, Q.; Xue, W.; Shen, Y.; Yang, Y.; Wang, M. Temperature sensitivity of soil carbon dioxide and nitrous oxide emissions in mountain forest and meadow ecosystems in China. Atmos. Environ. 2016, 142, 340–350. [Google Scholar] [CrossRef]
- Wang, D.; Geng, Z.C.; She, D.; He, W.X.; Hou, L. Soil organic carbon storage and vertical distribution of carbon and nitrogen across different forest types in the Qinling Mountains. Acta Ecol. Sin. 2015, 35, 9. [Google Scholar]
- Don, A.; Schumacher, J.; Scherer-Lorenzen, M.; Scholten, T.; Schulze, E.D. Spatial and vertical variation of soil carbon at two grassland sites—Implications for measuring soil carbon stocks. Geoderma 2007, 141, 272–282. [Google Scholar] [CrossRef]
- Jia, P.; Hao, W.; Li, G.F. Study on P Content Changement in Larch Plantation. J. Northeast Forest Univ. 1998, 68–70. [Google Scholar]
- Shen, C.; Xiong, J.; Zhang, H.; Feng, Y.; Lin, X.; Li, X.; Liang, W.; Chu, H. Soil pH drives the spatial distribution of bacterial communities along elevation on Changbai Mountain. Soil Biol. Biochem. 2013, 57, 204–211. [Google Scholar] [CrossRef]
- Shi, L.-L.; Mortimer, P.E.; Ferry Slik, J.W.; Zou, X.-M.; Xu, J.; Feng, W.-T.; Qiao, L. Variation in forest soil fungal diversity along a latitudinal gradient. Fungal Divers. 2013, 64, 305–315. [Google Scholar] [CrossRef]
- Cheng, D.; Tian, Z.; Feng, L.; Xu, L.; Wang, H. Diversity analysis of the rhizospheric and endophytic bacterial communities of Senecio vulgaris L. (Asteraceae) in an invasive range. Peerj 2019, 6, e6162. [Google Scholar] [CrossRef] [PubMed]
- Kembel, S.W.; Eisen, J.A.; Pollard, K.S.; Green, J.L. The phylogenetic diversity of metagenomes. PLoS ONE 2011, 6, e23214. [Google Scholar] [CrossRef] [PubMed]
- Horton, M.W.; Bodenhausen, N.; Beilsmith, K.; Meng, D.; Muegge, B.D.; Subramanian, S.; Vetter, M.M.; Vilhjalmsson, B.J.; Nordborg, M.; Gordon, J.I.; et al. Genome-wide association study of Arabidopsis thaliana leaf microbial community. Nat. Commun 2014, 5, 5320. [Google Scholar] [CrossRef]
- Lebeis, S.L.; Paredes, S.H.; Lundberg, D.S.; Breakfield, N.; Gehring, J.; McDonald, M.; Malfatti, S.; Glavina del Rio, T.; Jones, C.D.; Tringe, S.G.; et al. Salicylic acid modulates colonization of the root microbiome by specific bacterial taxa. Science 2015, 349, 860. [Google Scholar] [CrossRef]
- Lauber, C.L.; Ramirez, K.S.; Aanderud, Z.; Lennon, J.; Fierer, N. Temporal variability in soil microbial communities across land-use types. ISME J. 2013, 7, 1641–1650. [Google Scholar] [CrossRef]
- Placella, S.A.; Brodie, E.L.; Firestone, M.K. Rainfall-induced carbon dioxide pulses result from sequential resuscitation of phylogenetically clustered microbial groups. Proc. Natl. Acad. Sci. USA 2012, 109, 10931–10936. [Google Scholar] [CrossRef]
- Fierer, N.; Bradford, M.A.; Jackson, R.B. Toward an Ecological Classification of Soil Bacteria. Ecology 2007, 88, 1354–1364. [Google Scholar] [CrossRef]
- Ren, C.; Zhang, W.; Zhong, Z.; Han, X.; Yang, G.; Feng, Y.; Ren, G. Differential responses of soil microbial biomass, diversity, and compositions to altitudinal gradients depend on plant and soil characteristics. Sci. Total Environ. 2018, 610–611, 750–758. [Google Scholar] [CrossRef]
- Reynolds, H.L.; Packer, A.; Bever, J.D.; Clay, K. Grassroots Ecology: Plant–Microbe–Soil Interactions As Drivers Of Plant Community Structure And Dynamics. Ecology 2003, 84, 2281–2291. [Google Scholar] [CrossRef]
- Thakur, M.P.; Milcu, A.; Manning, P.; Niklaus, P.A.; Roscher, C.; Power, S.; Reich, P.B.; Scheu, S.; Tilman, D.; Ai, F.; et al. Plant diversity drives soil microbial biomass carbon in grasslands irrespective of global environmental change factors. Glob. Chang. Biol. 2015, 21, 4076–4085. [Google Scholar] [CrossRef]
- Miki, T. Microbe-mediated plant–soil feedback and its roles in a changing world. Ecol. Res. 2012, 27, 509–520. [Google Scholar] [CrossRef]
- Wang, N.F.; Zhang, T.; Zhang, F.; Wang, E.T.; He, J.F.; Ding, H.; Zhang, B.T.; Liu, J.; Ran, X.B.; Zang, J.Y. Diversity and structure of soil bacterial communities in the Fildes Region (maritime Antarctica) as revealed by 454 pyrosequencing. Front. Microbiol 2015, 6, 1188. [Google Scholar] [CrossRef]
Publisher’s Note: MDPI stays neutral with regard to jurisdictional claims in published maps and institutional affiliations. |
© 2021 by the authors. Licensee MDPI, Basel, Switzerland. This article is an open access article distributed under the terms and conditions of the Creative Commons Attribution (CC BY) license (https://creativecommons.org/licenses/by/4.0/).