
Forest Development over a Twenty-Year Chronosequence of Reforested Urban Sites


Abstract
:1. Introduction
2. Materials and Methods
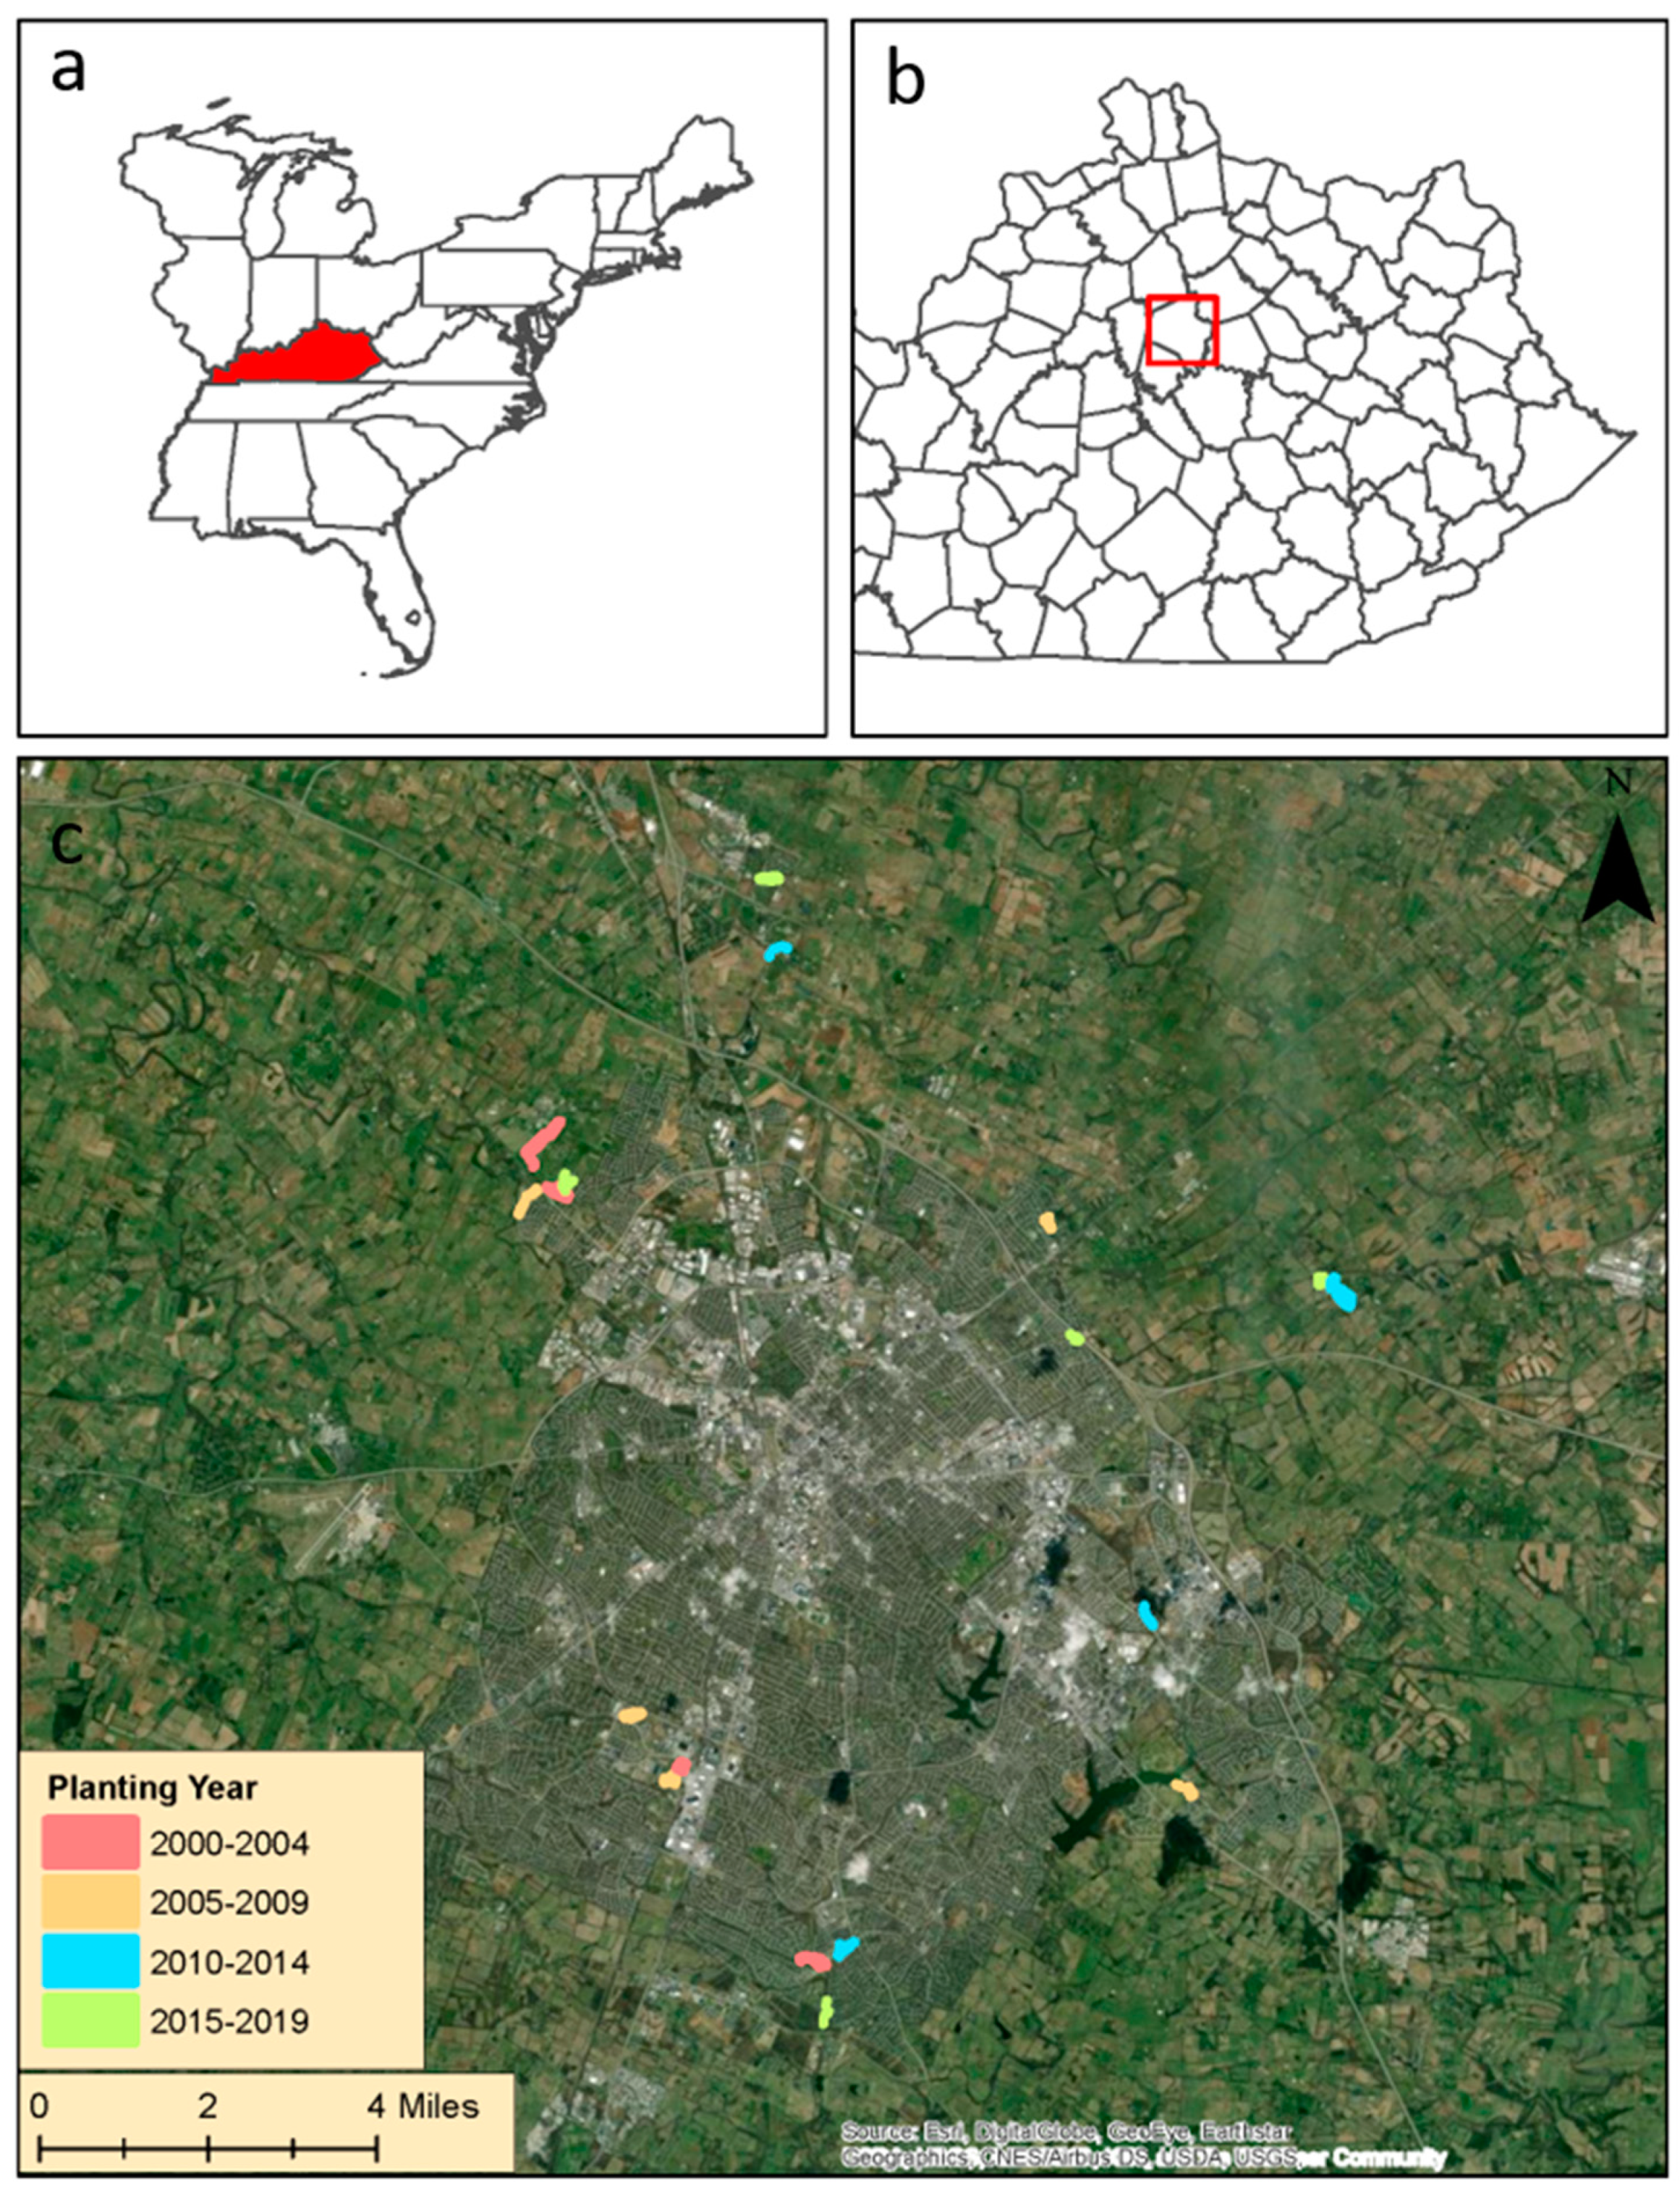
2.1. Study Sites
2.2. Survey Methods
2.3. Statistical Methods
3. Results
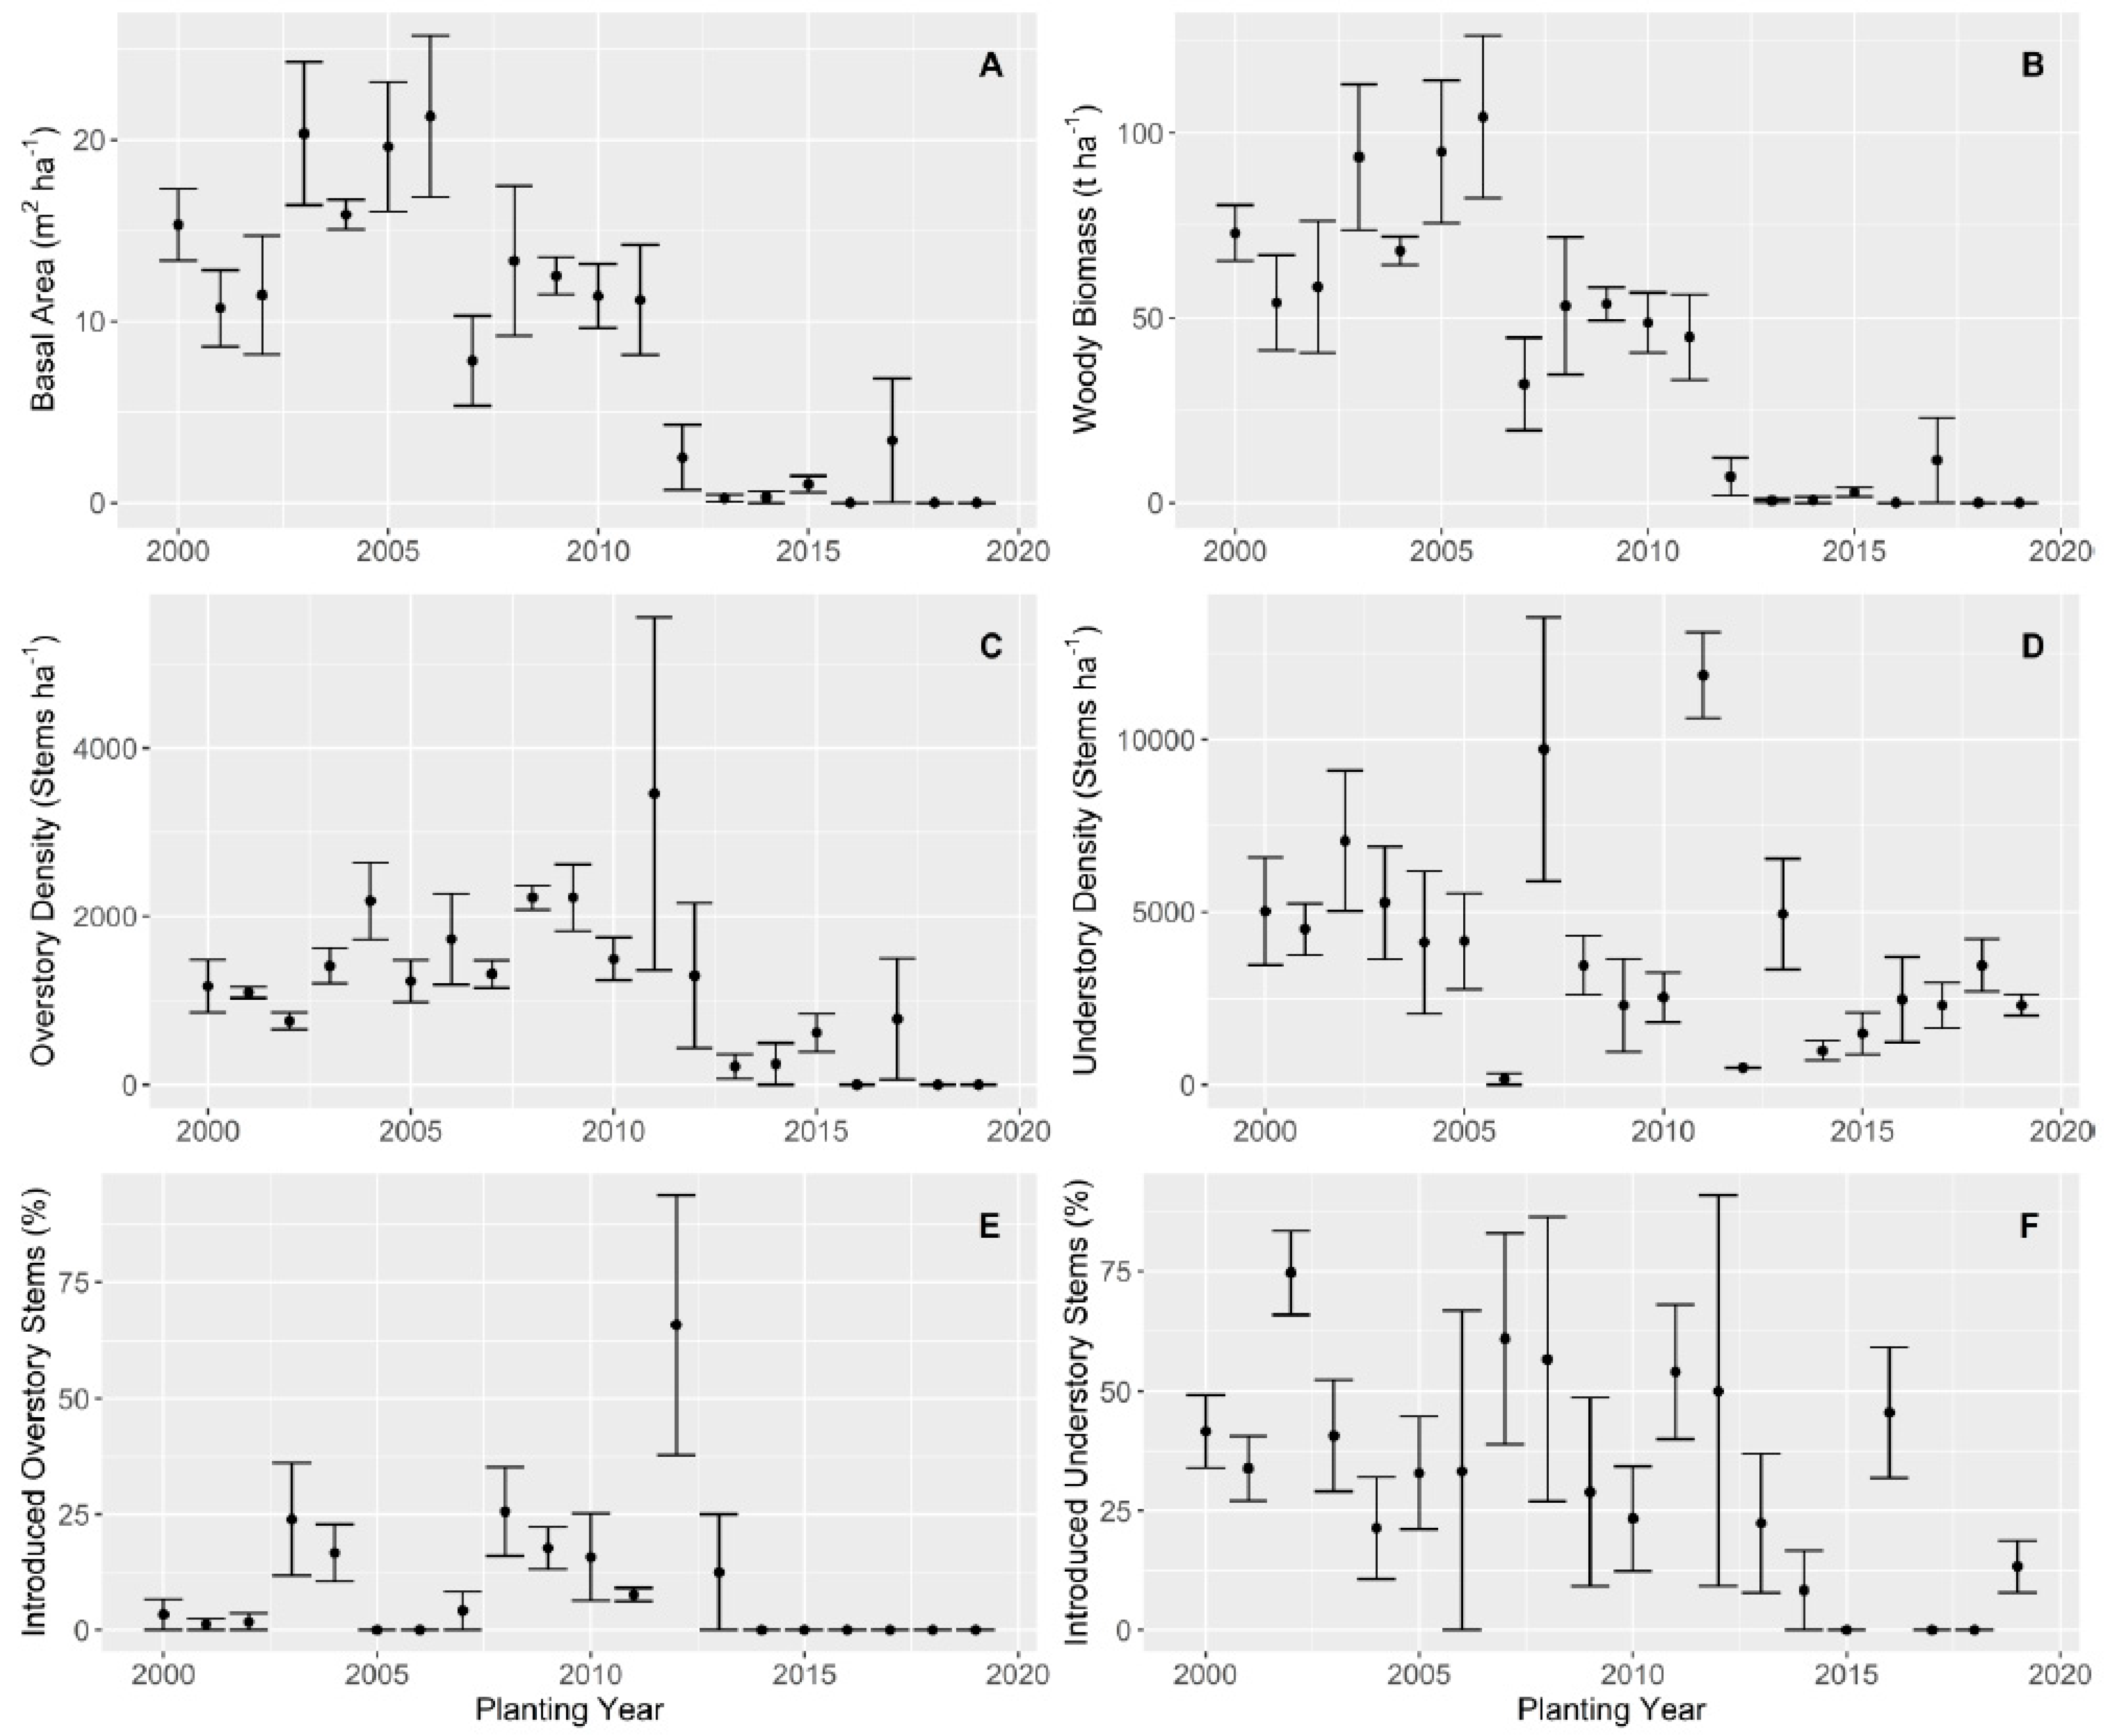
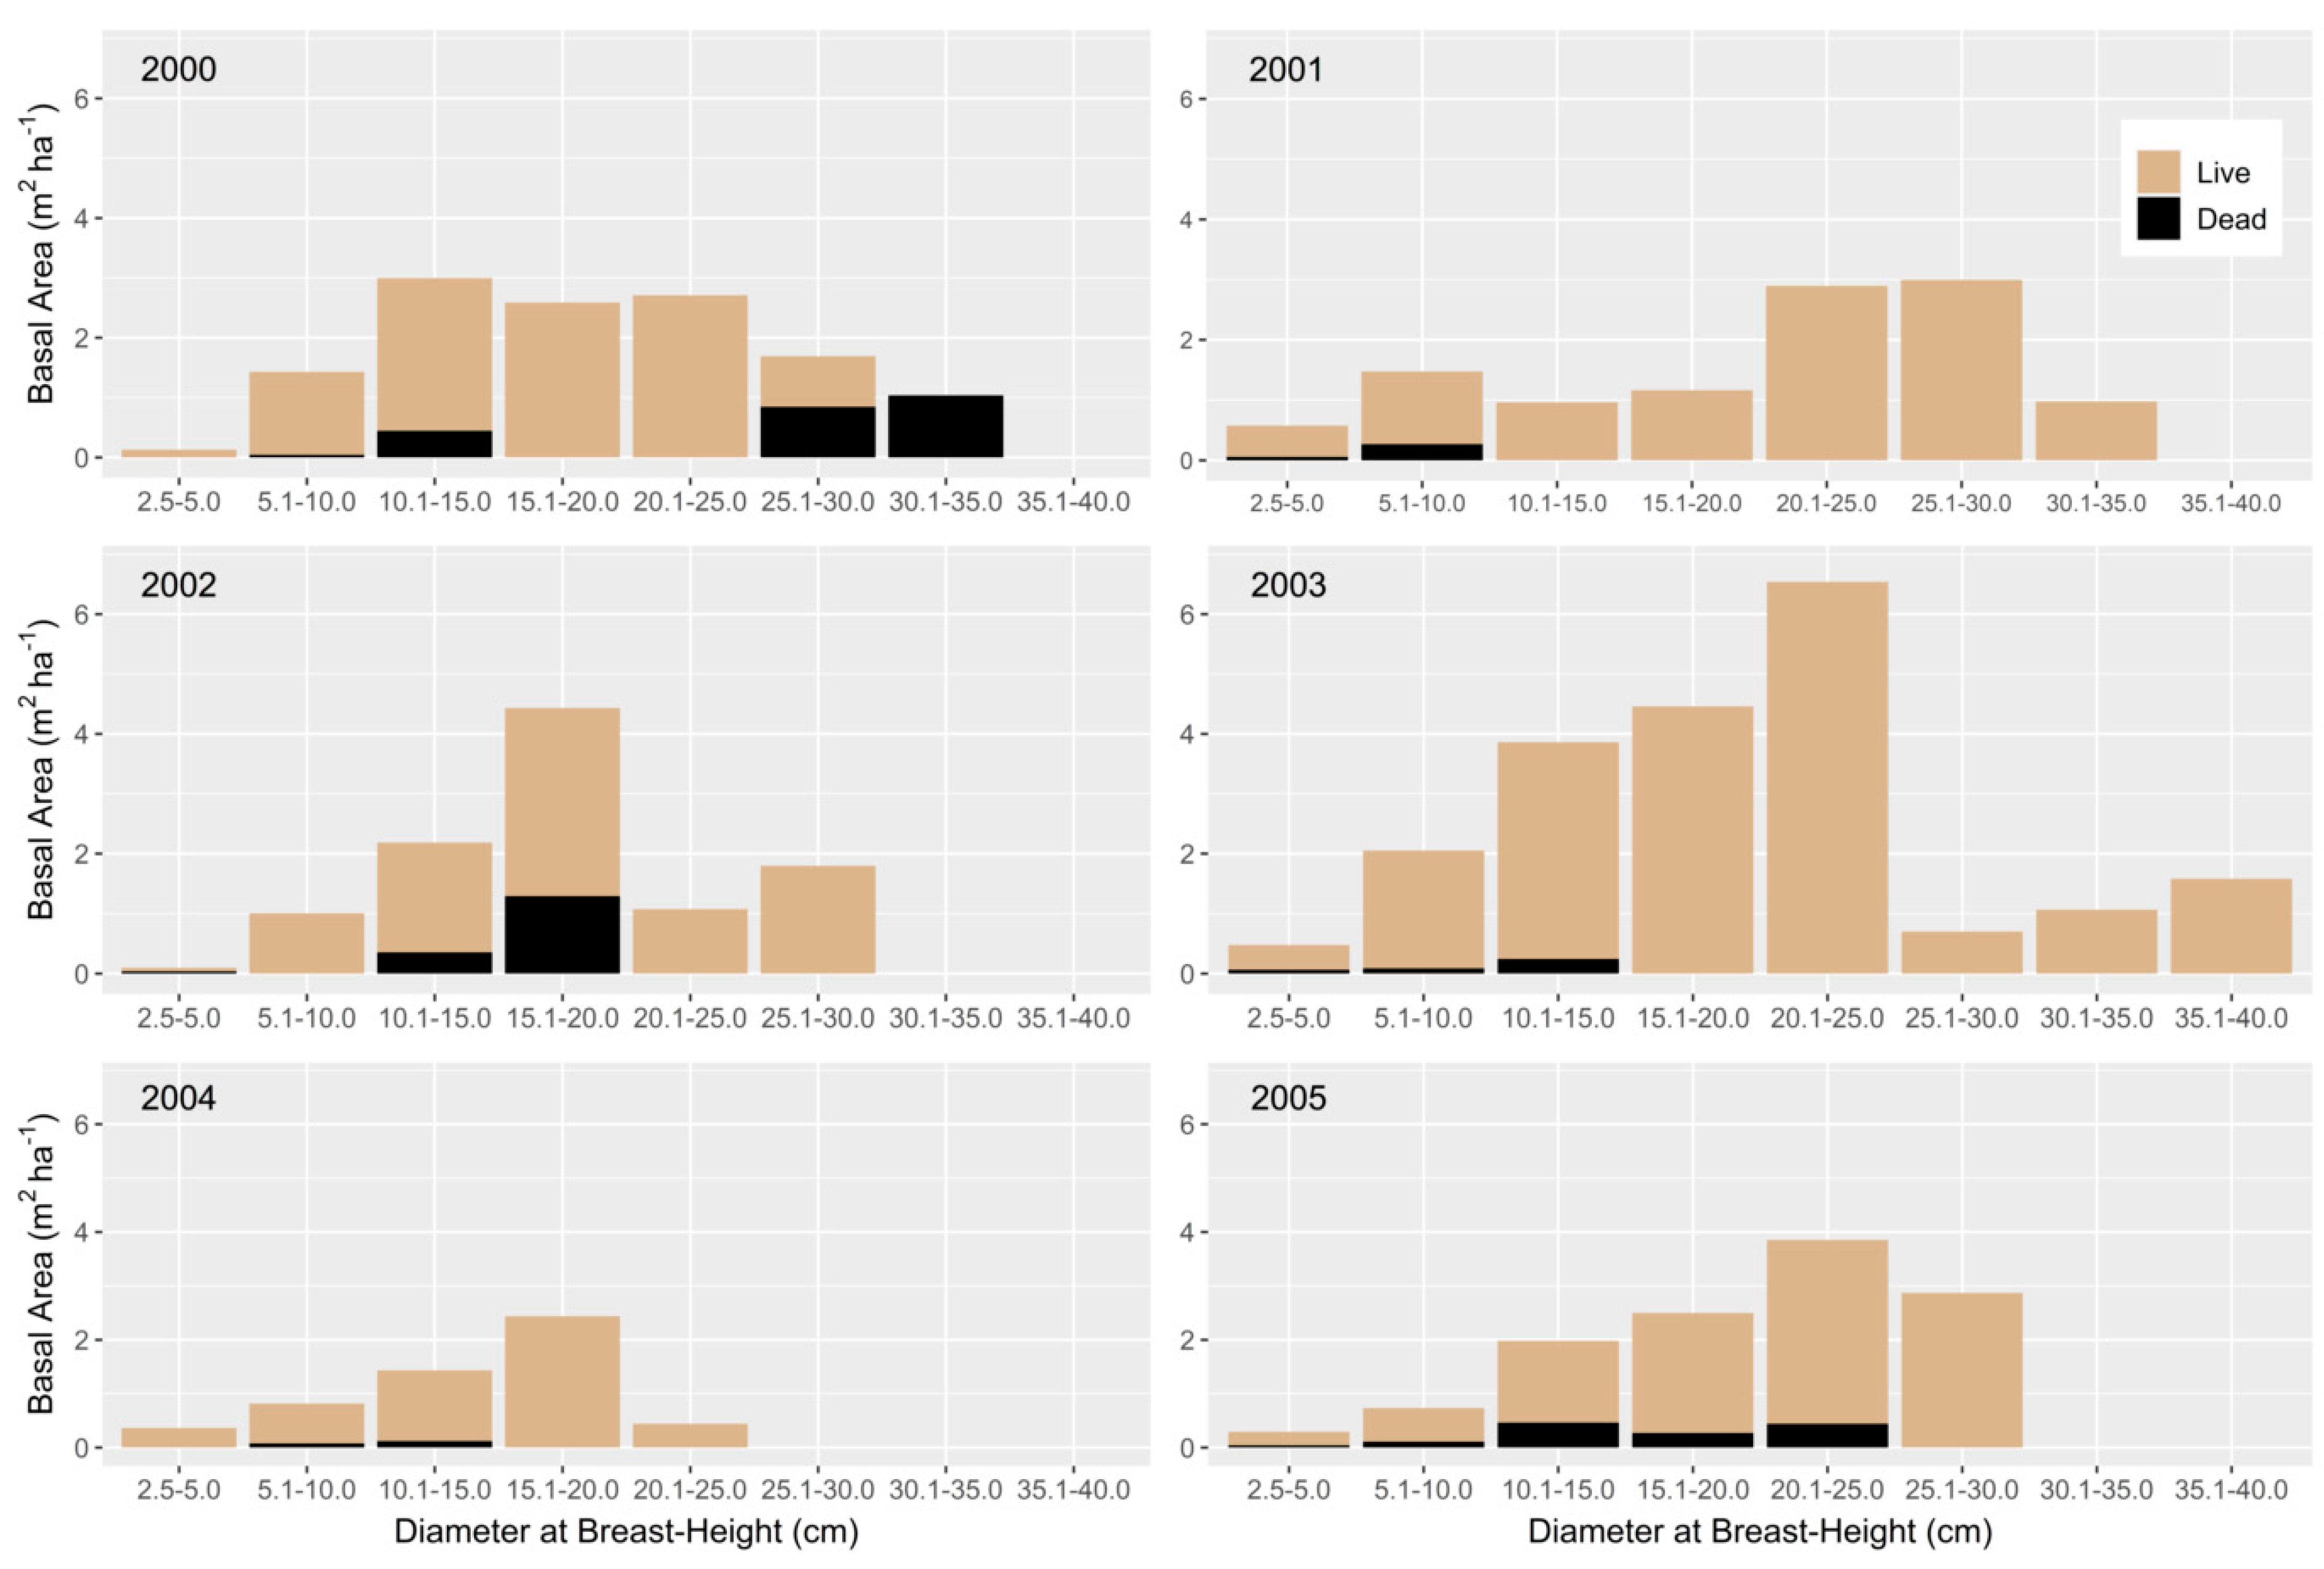
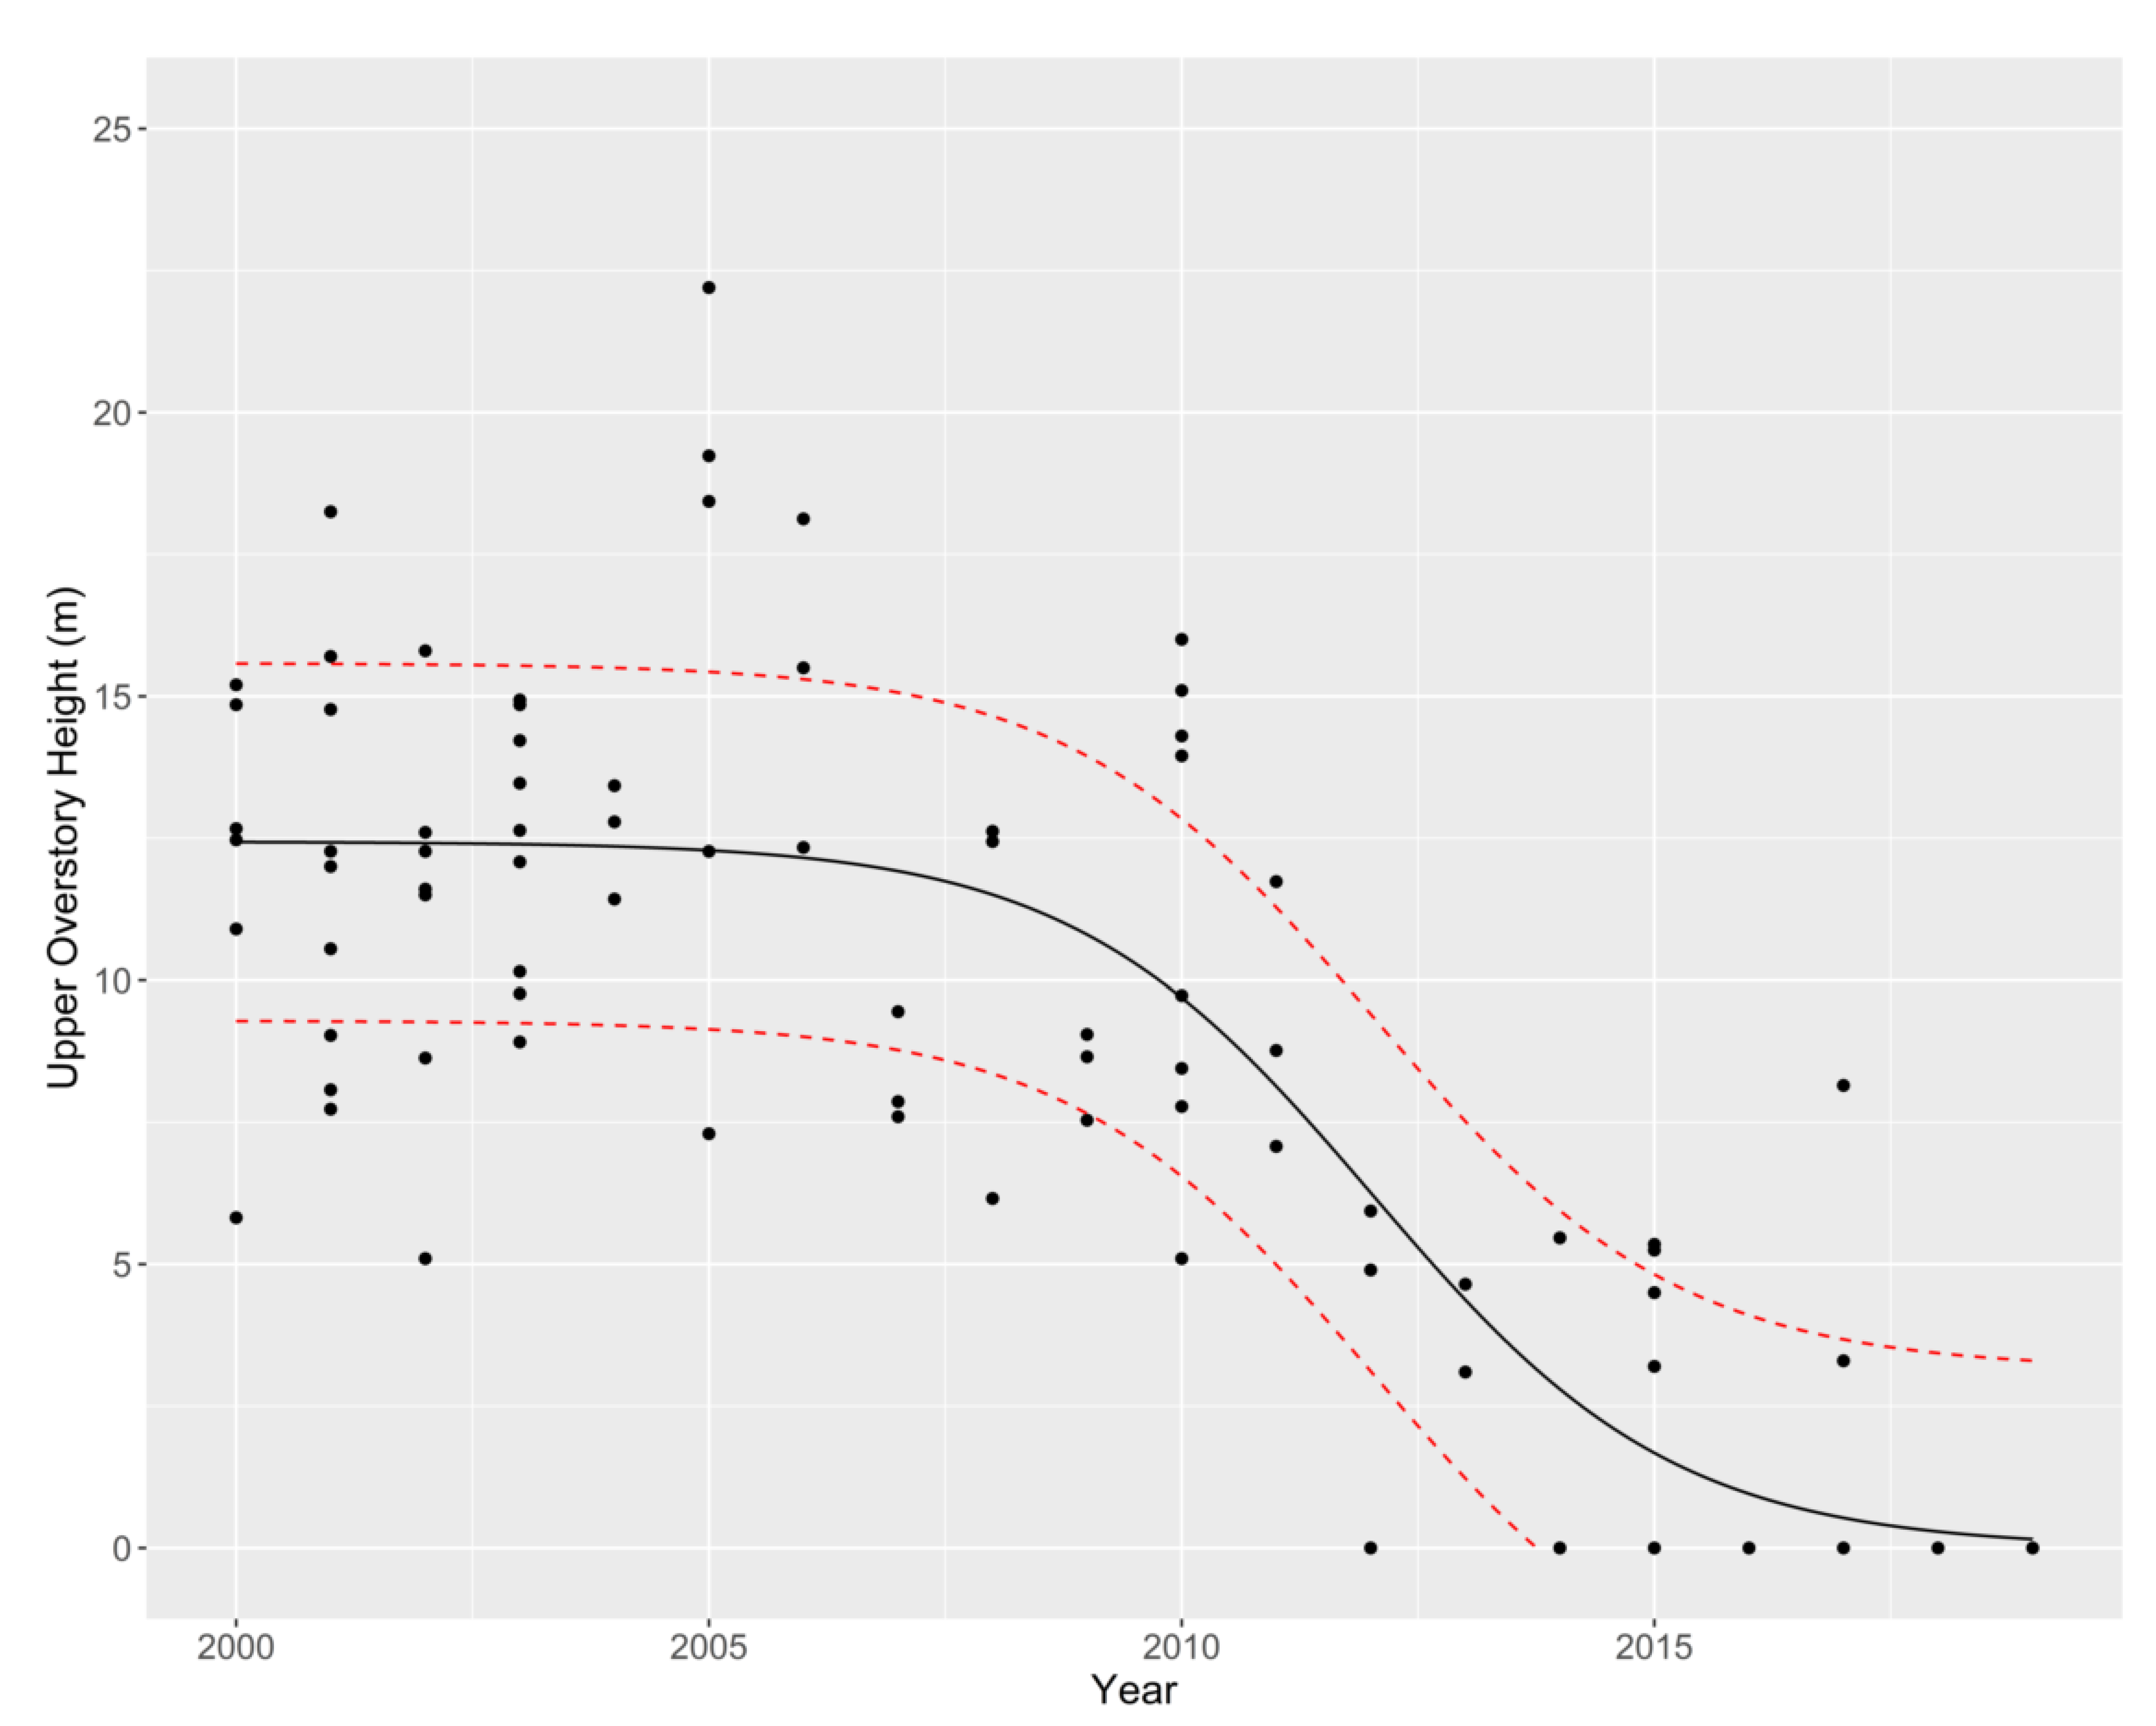
3.1. Overstory
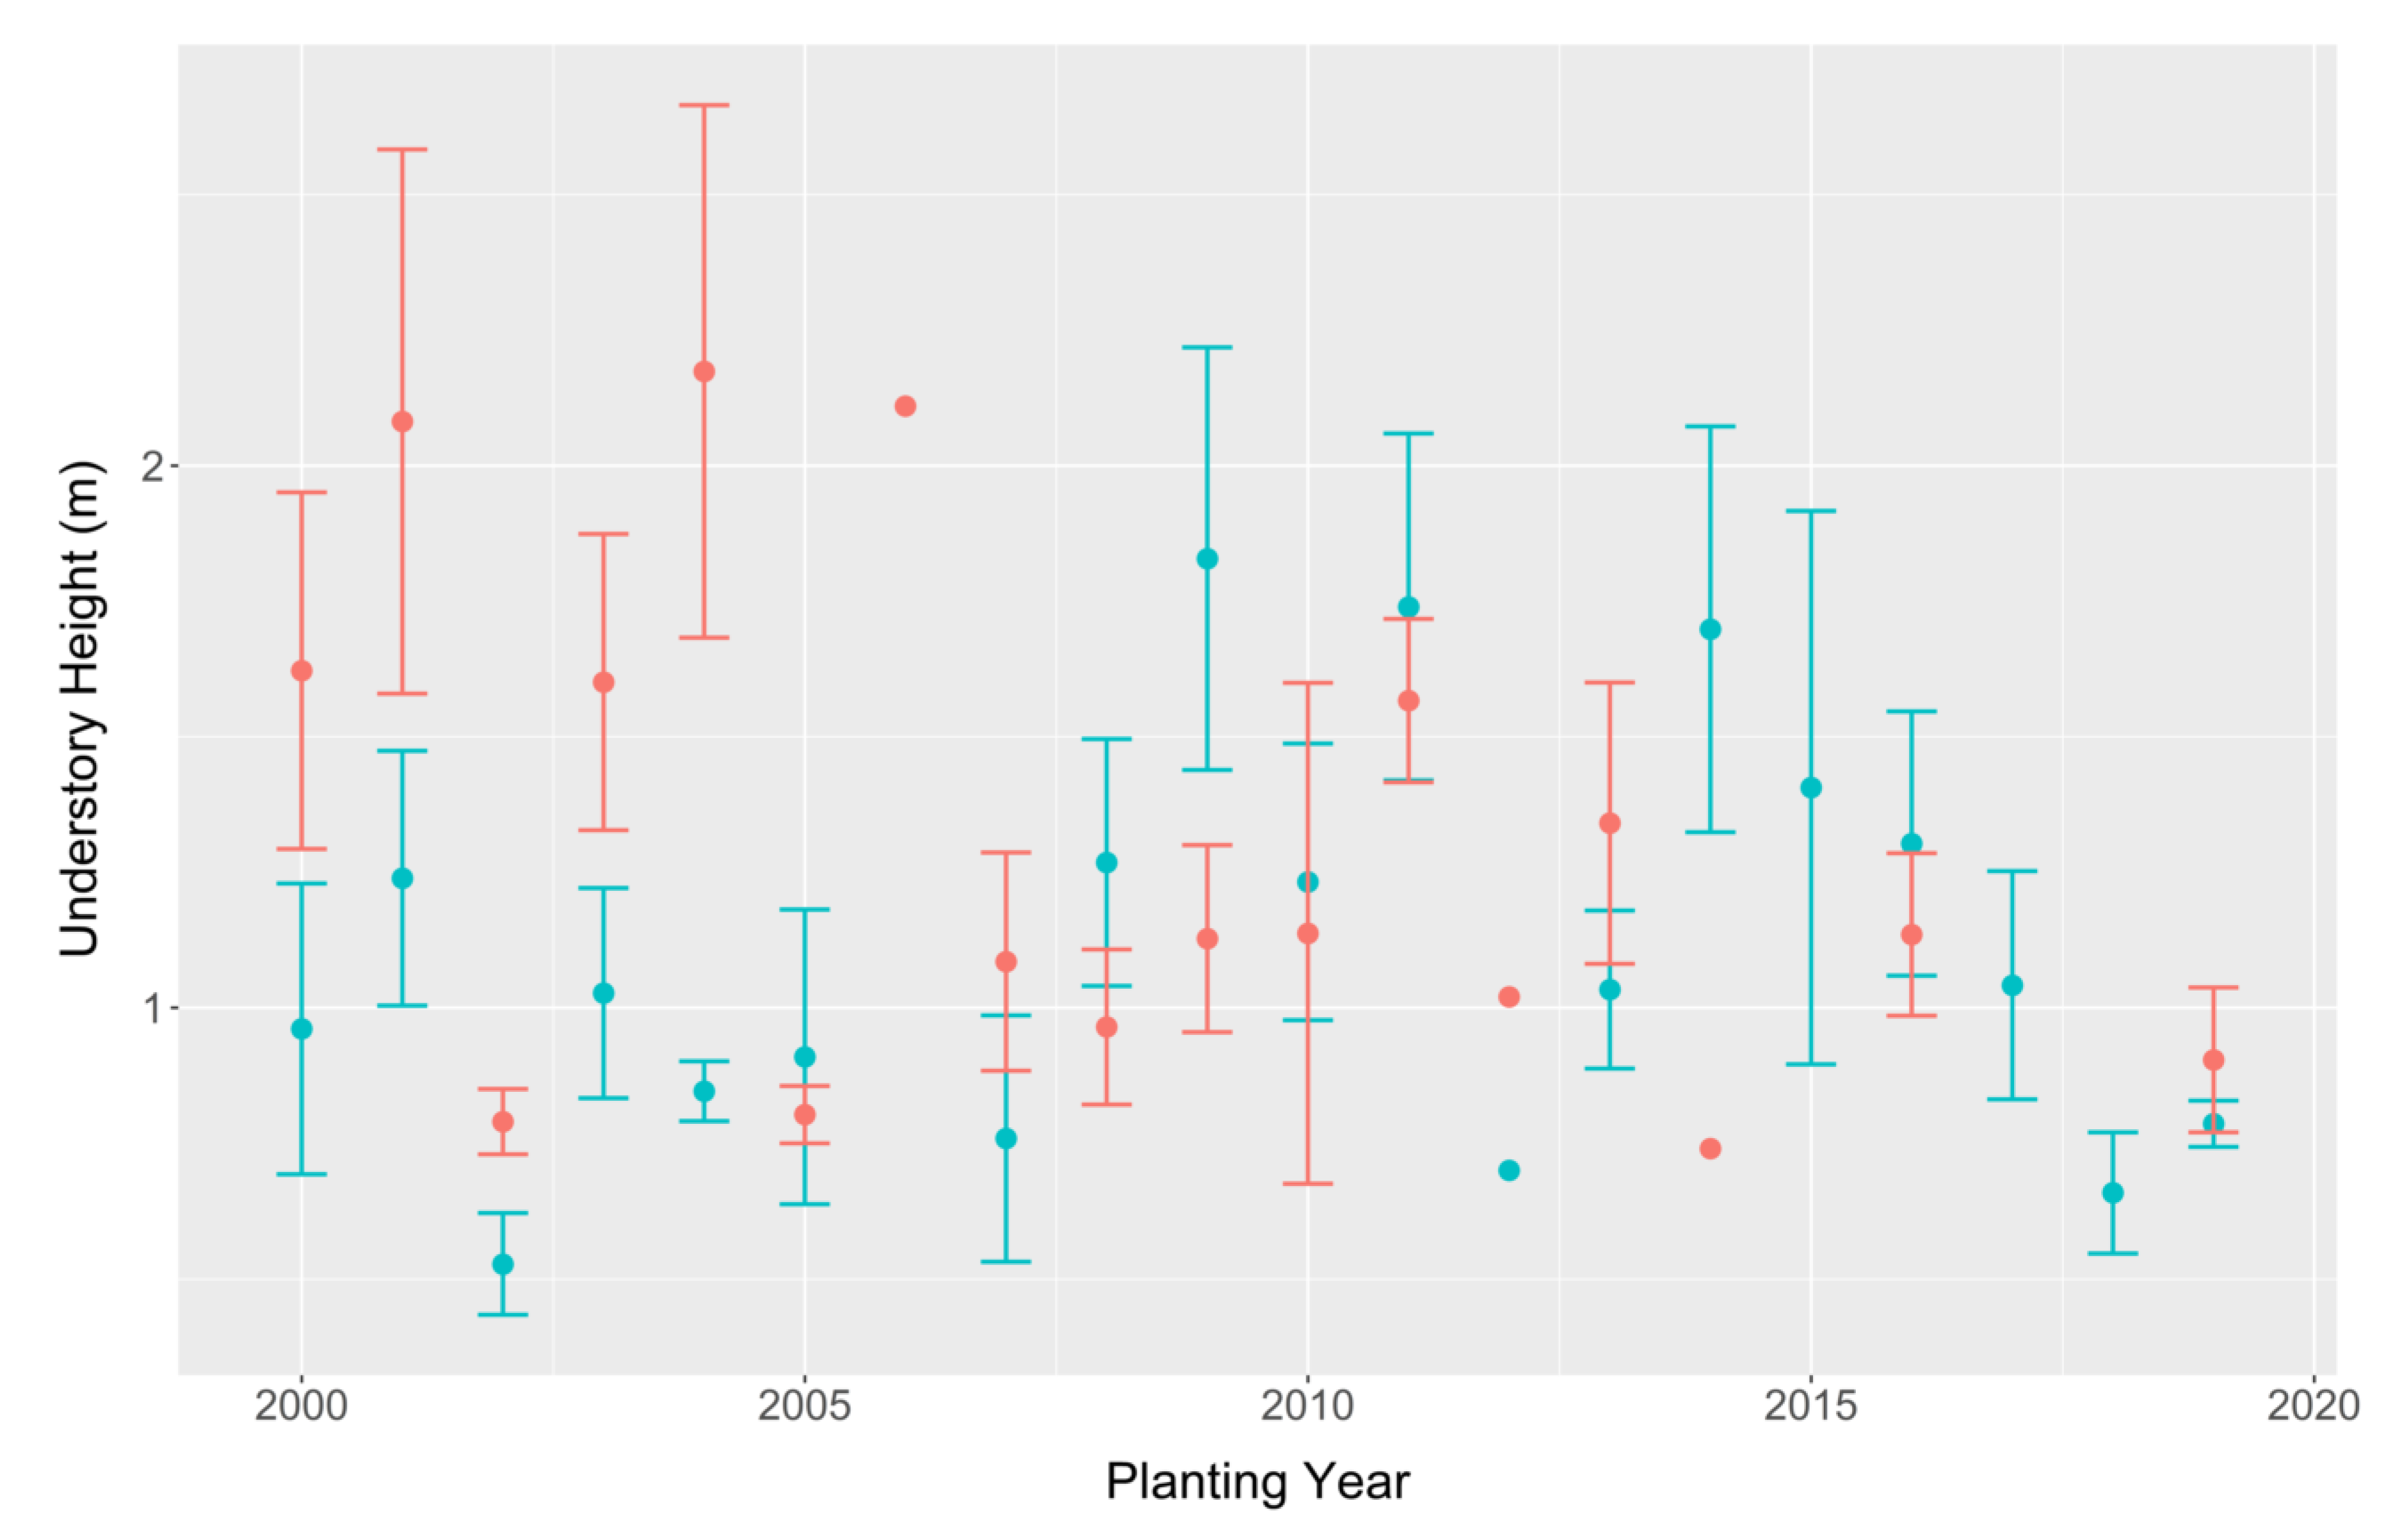
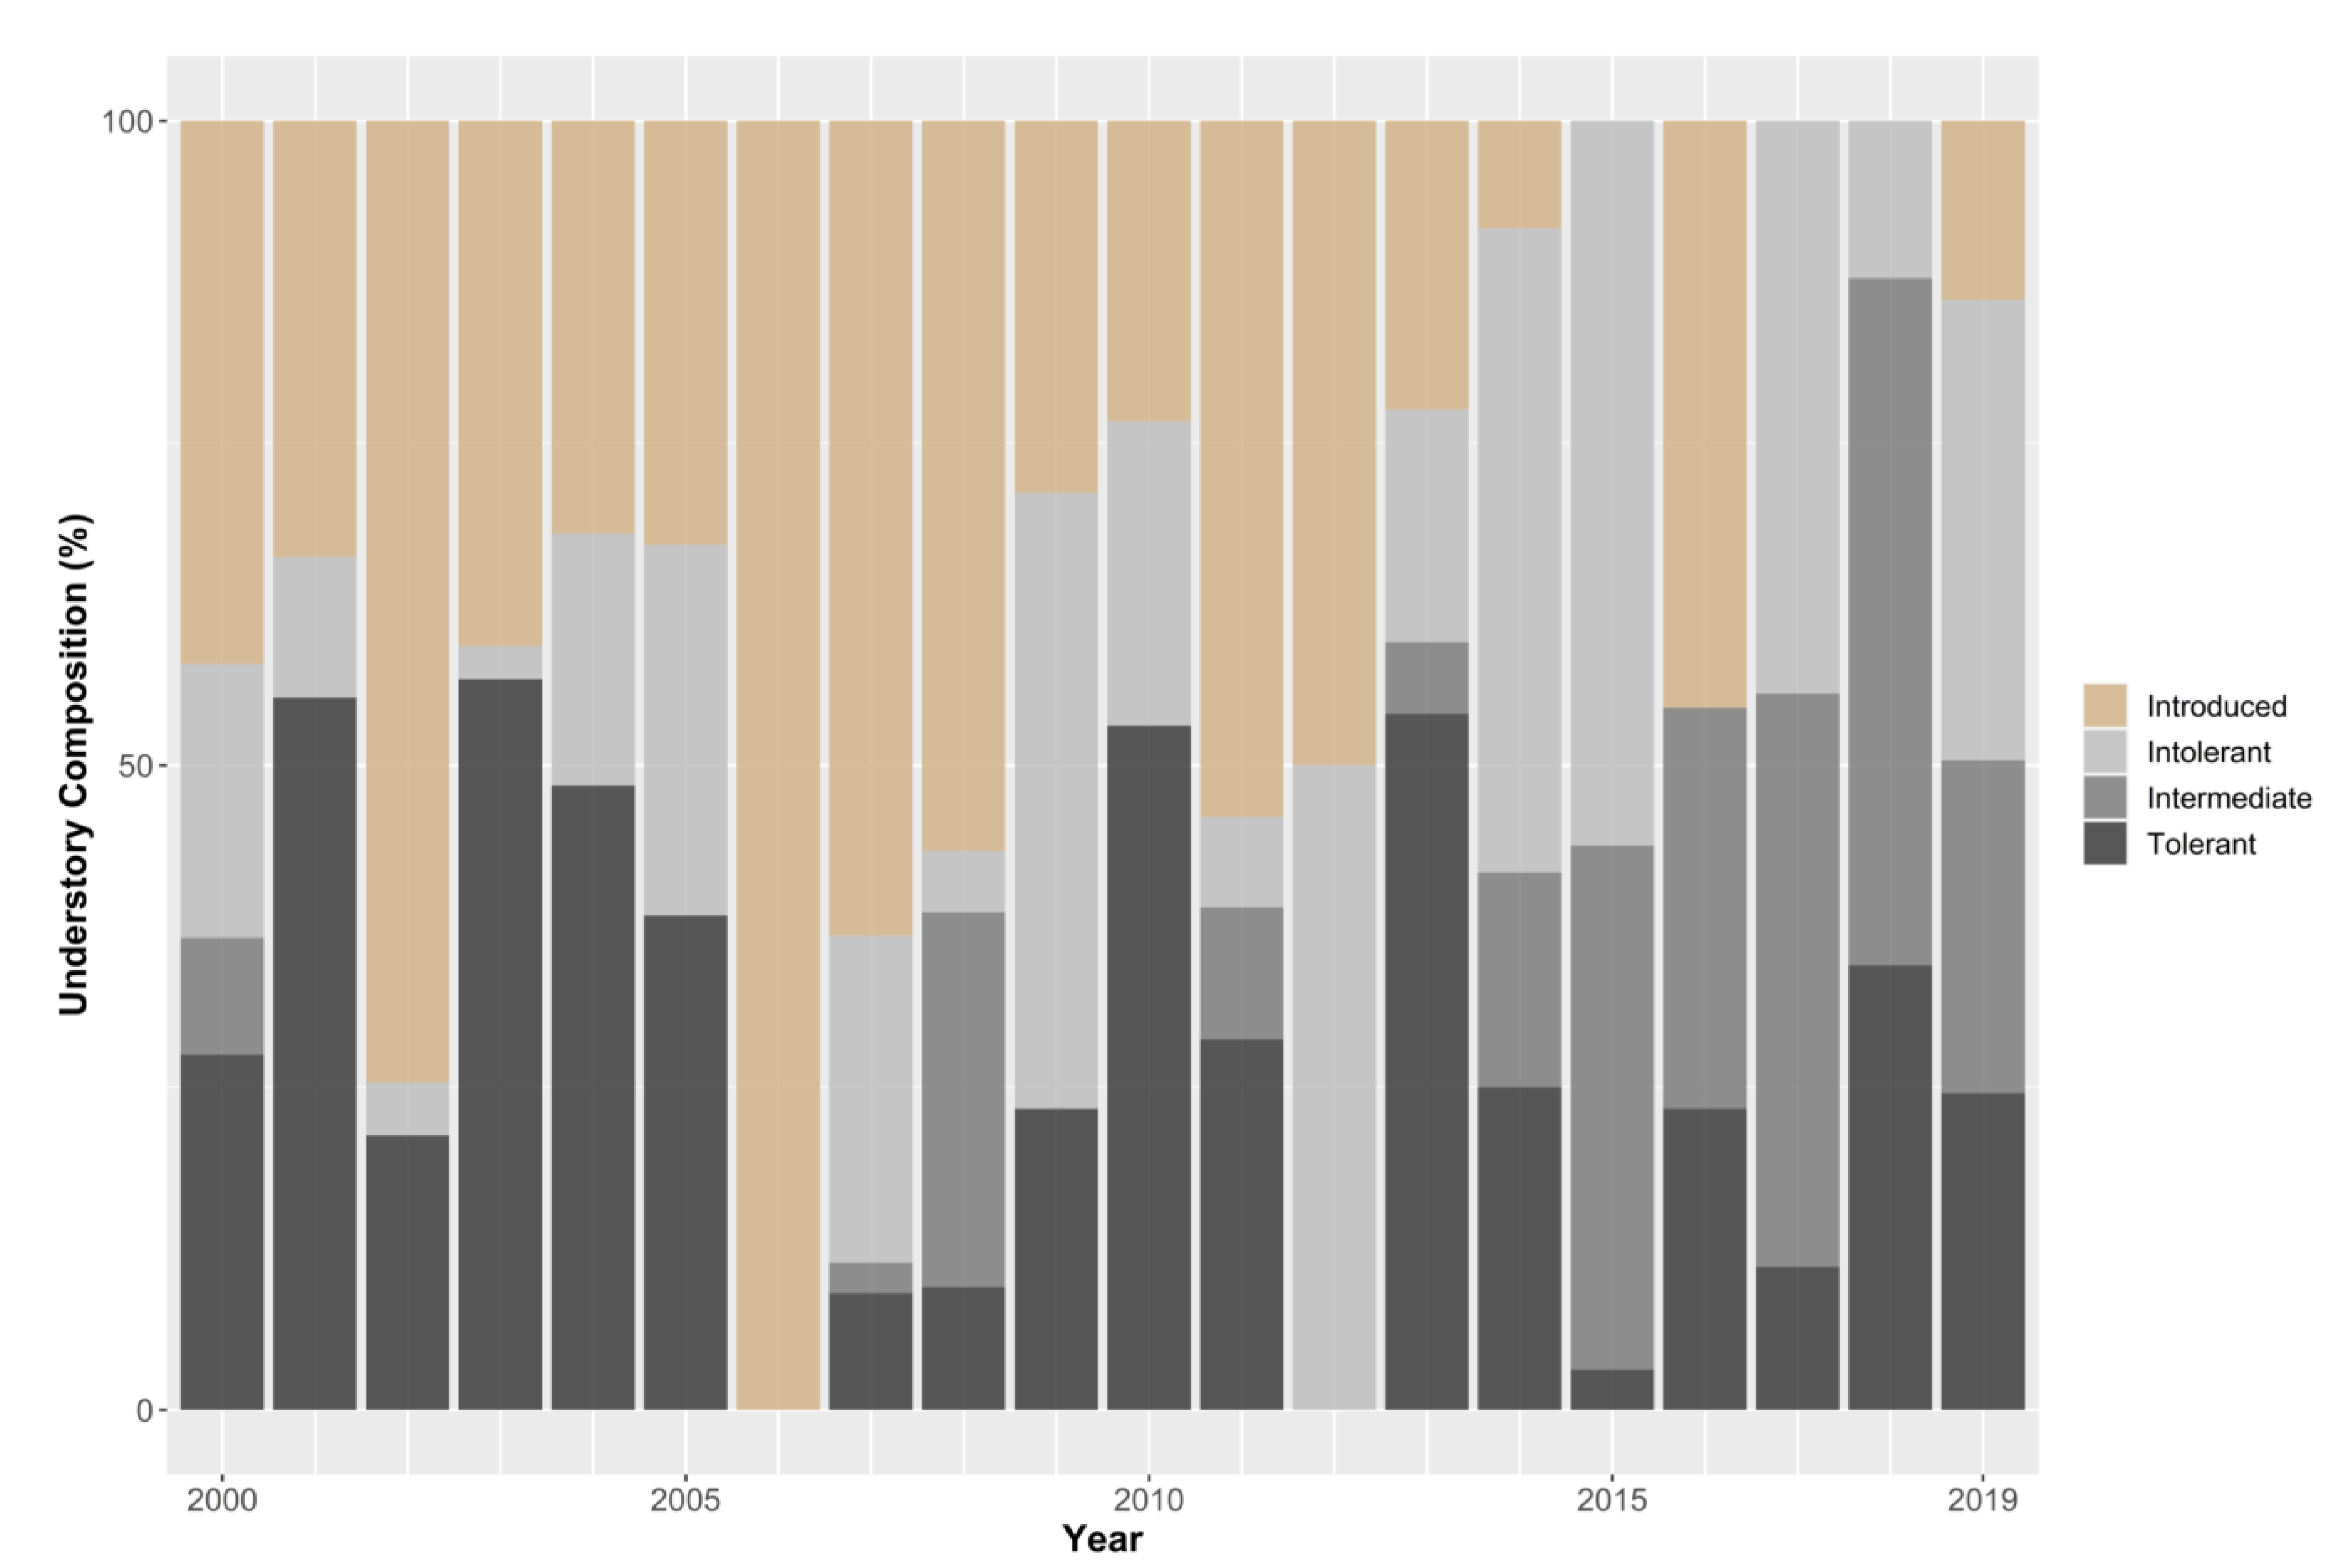
3.2. Understory
3.3. Soils
4. Discussion
5. Conclusions
Author Contributions
Funding
Data Availability Statement
Acknowledgments
Conflicts of Interest
References
- Miller, M.D. The impacts of Atlanta’s urban sprawl on forest cover and fragmentation. Appl. Geogr. 2012, 34, 171–179. [Google Scholar] [CrossRef]
- Zipperer, W.C.; Foresman, T.W.; Walker, S.P.; Daniel, C.T. Ecological consequences of fragmentation and deforestation in an urban landscape: A case study. Urban Ecosyst. 2012, 15, 533–544. [Google Scholar] [CrossRef]
- Walsh, C.J.; Roy, A.H.; Feminella, J.W.; Cottingham, P.D. The urban stream syndrome: Current knowledge and the search for a cure. J. N. Am. Benthol. Soc. 2005, 24, 706–723. [Google Scholar] [CrossRef]
- Rizwan, A.M.; Dennis, L.Y.; Chunho, L.I.U. A review on the generation, determination and mitigation of Urban Heat Island. J. Environ. Sci. 2008, 20, 120–128. [Google Scholar] [CrossRef]
- Scharenbroch, B.C.; Lloyd, J.E.; Johnson-Maynard, J.L. Distinguishing urban soils with physical, chemical, and biological properties. Pedobiologia 2005, 49, 283–296. [Google Scholar] [CrossRef]
- Wu, J.; Stewart, T.W.; Thompson, J.R.; Kolka, R.K.; Franz, K.J. Watershed features and stream water quality: Gaining insight through path analysis in a Midwest urban landscape, USA. Landsc. Urban Plan. 2015, 143, 219–229. [Google Scholar] [CrossRef] [Green Version]
- Stone, B., Jr. Urban sprawl and air quality in large US cities. J. Environ. Manag. 2008, 86, 688–698. [Google Scholar] [CrossRef] [PubMed]
- Shochat, E.; Lerman, S.B.; Anderies, J.M.; Warren, P.S.; Faeth, S.H.; Nilon, C.H. Invasion, Competition, and Biodiversity Loss in Urban Ecosystems. BioScience 2010, 60, 199–208. [Google Scholar] [CrossRef] [Green Version]
- Nowak, D.J.; Crane, D.E.; Stevens, J.C.; Hoehn, R.E.; Walton, J.T.; Bond, J. A ground-based method of assessing urban forest structure and ecosystem services. Aboricult. Urban For. 2008, 34, 347–358. [Google Scholar]
- Livesley, S.J.; McPherson, E.G.; Calfapietra, C. The Urban Forest and Ecosystem Services: Impacts on Urban Water, Heat, and Pollution Cycles at the Tree, Street, and City Scale. J. Environ. Qual. 2016, 45, 119–124. [Google Scholar] [CrossRef] [PubMed]
- Moss, J.L.; Doick, K.J.; Smith, S.; Shahrestani, M. Influence of evaporative cooling by urban forests on cooling demand in cities. Urban For. Urban Green. 2019, 37, 65–73. [Google Scholar] [CrossRef] [Green Version]
- Nowak, D.J.; Crane, D.E.; Stevens, J.C. Air pollution removal by urban trees and shrubs in the United States. Urban For. Urban Green. 2006, 4, 115–123. [Google Scholar] [CrossRef]
- Kuehler, E.; Hathaway, J.; Tirpak, A. Quantifying the benefits of urban forest systems as a component of the green infrastructure stormwater treatment network. Ecohydrology 2017, 10, e1813. [Google Scholar] [CrossRef]
- Magle, S.B.; Hunt, V.M.; Vernon, M.; Crooks, K.R. Urban wildlife research: Past, present, and future. Biol. Conserv. 2012, 155, 23–32. [Google Scholar] [CrossRef]
- Soulsbury, C.D.; White, P.C.L. Human–wildlife interactions in urban areas: A review of conflicts, benefits and opportunities. Wildl. Res. 2015, 42, 541–553. [Google Scholar] [CrossRef] [Green Version]
- Nowak, D.J.; Greenfield, E.J.; Hoehn, R.E.; Lapoint, E. Carbon storage and sequestration by trees in urban and community areas of the United States. Environ. Pollut. 2013, 178, 229–236. [Google Scholar] [CrossRef] [Green Version]
- Arnberger, A. Recreation use of urban forests: An inter-area comparison. Urban For. Urban Green. 2006, 4, 135–144. [Google Scholar] [CrossRef]
- Soga, M.; Gaston, K.J. Extinction of experience: The loss of human-nature interactions. Front. Ecol. Environ. 2016, 14, 94–101. [Google Scholar] [CrossRef] [Green Version]
- Kroeger, T.; Escobedo, F.J.; Hernandez, J.L.; Varela, S.; Delphin, S.; Fisher, J.R.B.; Waldron, J. Reforestation as a novel abatement and compliance measure for ground-level ozone. Proc. Natl. Acad. Sci. USA 2014, 111, E4204–E4213. [Google Scholar] [CrossRef] [PubMed] [Green Version]
- Hession, W.; Johnson, T.; Charles, D.; Hart, D.; Horwitz, R.; Kreeger, D.; Pizzuto, J.; Velinsky, D.; Newbold, J.; Cianfrani, C.; et al. Ecological Benefits of Riparian Reforestation in Urban Watersheds: Study Design and Preliminary Results. Environ. Monit. Assess. 2000, 63, 211–222. [Google Scholar] [CrossRef]
- Kang, W.; Minor, E.S.; Park, C.-R.; Lee, D. Effects of habitat structure, human disturbance, and habitat connectivity on urban forest bird communities. Urban Ecosyst. 2015, 18, 857–870. [Google Scholar] [CrossRef]
- Smith, D.A.; Gehrt, S.D. Bat Response to Woodland Restoration within Urban Forest Fragments. Restor. Ecol. 2009, 18, 914–923. [Google Scholar] [CrossRef]
- Simmons, B.L.; Hallett, R.A.; Sonti, N.F.; Auyeung, D.S.N.; Lu, J.W.T. Long-term outcomes of forest restoration in an urban park. Restor. Ecol. 2016, 24, 109–118. [Google Scholar] [CrossRef]
- Dreistadt, S.H.; Donald, L.D.; Gordon, W.F. Urban Forests and Insect Ecology. BioScience 1990, 40, 192. [Google Scholar] [CrossRef]
- DiCicco, J.M. Long-Term Urban Park Ecological Restoration: A Case Study of Prospect Park, Brooklyn, New York. Ecol. Restor. 2014, 32, 314–326. [Google Scholar] [CrossRef]
- Hobbs, E.R. Species richness of urban forest patches and implications for urban landscape diversity. Landsc. Ecol. 1988, 1, 141–152. [Google Scholar] [CrossRef]
- Overdyck, E.; Clarkson, B.D. Seed rain and soil seed banks limit native regeneration within urban forest restoration plantings in Hamilton City, New Zealand. N. Z. J. Ecol. 2012, 36, 177–190. [Google Scholar]
- Farmer, S.; Ward, J.; Horton, J.; Clarke, D. Southern Appalachian urban forest response to three invasive plant removal treatments. Manag. Biol. Invasions 2016, 7, 329–342. [Google Scholar] [CrossRef] [Green Version]
- Sjöman, H.; Morgenroth, J.; Sjöman, J.D.; Sæbø, A.; Kowarik, I. Diversification of the urban forest—Can we afford to exclude exotic tree species? Urban For. Urban Green. 2016, 18, 237–241. [Google Scholar] [CrossRef]
- Archibald, C.L.; McKinney, M.; Mustin, K.; Shanahan, D.F.; Possingham, H.P. Assessing the impact of revegetation and weed control on urban sensitive bird species. Ecol. Evol. 2017, 7, 4200–4208. [Google Scholar] [CrossRef]
- Clements, H.; Bierzychudek, P. Can the Persistent Seed Bank Contribute to the Passive Restoration of Urban Forest Fragments After Invasive Species Removal? Ecol. Restor. 2017, 35, 156–166. [Google Scholar] [CrossRef]
- Pregitzer, C.C.; Sonti, N.F.; Hallett, R.A. Variability in Urban Soils Influences the Health and Growth of Native Tree Seedlings. Ecol. Restor. 2016, 34, 106–116. [Google Scholar] [CrossRef]
- Oldfield, E.E.; Felson, A.J.; Auyeung, D.S.N.; Crowther, T.W.; Sonti, N.F.; Harada, Y.; Maynard, D.S.; Sokol, N.W.; Ashton, M.S.; Ii, R.J.W.; et al. Growing the urban forest: Tree performance in response to biotic and abiotic land management. Restor. Ecol. 2015, 23, 707–718. [Google Scholar] [CrossRef]
- McPhearson, P.T.; Feller, M.; Felson, A.; Karty, R.; Lu, J.W.; Palmer, M.I.; Wenskus, T. Assessing the Effects of the Urban Forest Restoration Effort of MillionTreesNYC on the Structure and Functioning of New York City Ecosystems. Cities Environ. 2010, 3, 7. [Google Scholar] [CrossRef]
- Johnson, L.R.; Handel, S.N. Restoration treatments in urban park forests drive long-term changes in vegetation trajectories. Ecol. Appl. 2016, 26, 940–956. [Google Scholar] [CrossRef] [PubMed]
- Johnson, L.R.; Handel, S.N. Management intensity steers the long-term fate of ecological restoration in urban woodlands. Urban For. Urban Green. 2019, 41, 85–92. [Google Scholar] [CrossRef]
- Hopfensperger, K.N.; Boyce, R.L.; Schenk, D. Potential reinvasion of Lonicera macckii after urban riparian forest restoration. Ecol. Restor. 2019, 37, 25–33. [Google Scholar] [CrossRef]
- Dybala, K.E.; Steger, K.; Walsh, R.G.; Smart, D.R.; Gardali, T.; Seavy, N.E. Optimizing carbon storage and biodiversity co-benefits in reforested riparian zones. J. Appl. Ecol. 2019, 56, 343–353. [Google Scholar] [CrossRef]
- Oldfield, E.E.; Warren, R.J.; Felson, A.J.; Bradford, M.A. FORUM: Challenges and future directions in urban afforestation. J. Appl. Ecol. 2013, 50, 1169–1177. [Google Scholar] [CrossRef]
- US Census Bureau. QuickFacts, Lexington-Fayette, Kentucky. 2019. Available online: https://www.census.gov/quickfacts/lexingtonfayettekentucky (accessed on 30 December 2020).
- Lexington-Fayette Urban County Government. “Reforest the Bluegrass at Home”. Available online: https://www.lexingtonky.gov/reforest (accessed on 15 January 2021).
- Soil and Plant Analysis Council. Soil and Plant Analysis Council. Soil pH, and exchangeable acidity and aluminum. In Soil Analysis Handbook of Reference Methods; CRC Press: Boca Raton, FL, USA, 2000; Chapter 3. [Google Scholar]
- Soil and Plant Analysis Council. Phosphorus. In Soil Analysis Handbook of Reference Methods; CRC Press: Boca Raton, FL, USA, 2000; Chapter 6. [Google Scholar]
- Soil and Plant Analysis Council. Major cations (potassium, calcium, magnesium, and sodium). In Soil Analysis Handbook of Reference Methods; CRC Press: Boca Raton, FL, USA, 2000; Chapter 7. [Google Scholar]
- Miller, W.P.; Miller, D.M. A micro-pipette method for soil mechanical analysis. Commun. Soil Sci. Plant Anal. 1987, 18, 1–15. [Google Scholar] [CrossRef]
- Burt, R.; Reinsch, T.G.; Miller, W.P. A micro-pipette method for water dispersible clay. Commun. Soil Sci. Plant Anal. 1993, 24, 2531–2544. [Google Scholar] [CrossRef]
- Nelson, D.W.; Sommers, L.E. Total carbon, organic carbon, and organic matter. In Methods of Soil Analysis, Part 2. Chemical and Microbiological Properties, 2nd ed.; Page, A.L., Miller, R.H., Keeney, D.R., Eds.; ASA-SSSA: Madison, WI, USA, 1982. [Google Scholar]
- R Core Team. R: A Language and Environment for Statistical Computing; R Foundation for Statistical Computing: Vienna, Austria, 2020. [Google Scholar]
- Chojnacky, D.C.; Heath, L.S.; Jenkins, J.C. Updated generalized biomass equations for North American tree species. Forestry 2013, 87, 129–151. [Google Scholar] [CrossRef] [Green Version]
- Rennolls, K. “Top Height”; its definition and estimation. Commonw. For. Rev. 1978, 57, 215–219. [Google Scholar]
- Barton, K. MuMIn: Multi-Model Inference. R Package Version 1.43.17. 2020. Available online: https://CRAN.R-project.org/package=MuMIn (accessed on 25 February 2021).
- Jacobs, S.L.; Hackworth, Z.J.; Comer, K.; Wittenbraker, W.; Maugans, J.J.; Jensen, K.L.; Sena, K.L. Species, DBH, and Height of Overstory Trees in a Chronosequence of Reforested Urban Sites, Lexington, KY, USA. Ver 1. Environmental Data Initiative. 2021. Available online: https://doi.org/10.6073/pasta/f22406ee858daeb0b8bf3e6f4ed2ba00 (accessed on 19 March 2021).
- Jacobs, S.L.; Hackworth, Z.J.; Comer, K.; Wittenbraker, W.; Maugans, J.J.; Jensen, K.L.; Sena, K.L. Species and Height of Understory Trees and Shrubs in a Chronosequence of Reforested Urban Sites, Lexington, KY USA. Ver 1. Environmental Data Initiative. 2021. Available online: https://doi.org/10.6073/pasta/fdcb15813501becc1ce898972a19378a (accessed on 16 April 2021).
- Jacobs, S.L.; Hackworth, Z.J.; Comer, K.; Wittenbraker, W.; Maugans, J.J.; Jensen, K.L.; Sena, K.L. Chemical and Physical Characteristics of Soil Samples Collected from a Chronosequence of Reforested Urban Sites in Lexington, KY USA. Ver 1. Environmental Data Initiative. 2021. Available online: https://doi.org/10.6073/pasta/247c204871488a6ba981386fc3731559 (accessed on 16 April 2021).
- Oliver, C.D. Forest development in North America following major disturbances. For. Ecol. Manag. 1980, 3, 153–168. [Google Scholar] [CrossRef]
- Skovsgaard, J.P.; Vanclay, J.K. Forest site productivity: A review of the evolution of dendrometric concepts for even-aged stands. Forestry 2008, 81, 13–31. [Google Scholar] [CrossRef] [Green Version]
- Vanclay, J.K. Tree diameter, height and stocking in even-aged forests. Ann. For. Sci. 2009, 66, 702. [Google Scholar] [CrossRef] [Green Version]
- Herms, D.A.; McCullough, D.G. Emerald Ash Borer Invasion of North America: History, Biology, Ecology, Impacts, and Management. Annu. Rev. Èntomol. 2014, 59, 13–30. [Google Scholar] [CrossRef] [Green Version]
- Jacobs, D.F.; Ross-Davis, A.L.; Davis, A.S. Establishment success of conservation tree plantations in relation to silvicultural practices in Indiana, USA. New For. 2004, 28, 23–36. [Google Scholar] [CrossRef]
- Burns, R.M.; Barbara, H. Honkala, technical coordinators. In Silvics of North America: Volume 2. Hardwoods; Agriculture Handbook 654; USDA Forest Service: Washington, DC, USA, 1990. [Google Scholar]
- Stanturf, J.; Schweitzer, C.; Gardiner, E. Afforestation of marginal agricultural land in the Lower Mississippi River Alluvial Valley, USA. Silva Fenn. 1998, 32, 281–297. [Google Scholar] [CrossRef] [Green Version]
- Dey, D.C.; Gardiner, E.S.; Kabrick, J.M.; Stanturf, J.A.; Jacobs, D.F. Innovations in afforestation of agricultural bottomlands to restore native forests in the eastern USA. Scand. J. For. Res. 2010, 25, 31–42. [Google Scholar] [CrossRef]
- Steele, K.L.; Kabrick, J.M.; Dey, D.C.; Jensen, R.G. Restoring Riparian Forests in the Missouri Ozarks. North. J. Appl. For. 2013, 30, 109–117. [Google Scholar] [CrossRef]

| Overstory | Understory | |||||
|---|---|---|---|---|---|---|
| Year | Shrub | Tree | Total | Shrub | Tree | Total |
| 2000–2004 | 1.5 ± 1.5 | 1.8 ± 1.8 | 3.2 ± 2.2 | 37.2 ± 4.6 | 8.5 ± 3.0 | 45.7 ± 5.0 |
| 2005–2009 | 0 | 6.4 ± 3.6 | 6.4 ± 3.6 | 40.4 ± 9.8 | 6.5 ± 2.6 | 46.9 ± 9.5 |
| 2010–2014 | 5 ± 5 | 11.8 ± 6.9 | 16.8 ± 8.1 | 21.1 ± 6.5 | 6.1 ± 2.9 | 27.2 ± 7.1 |
| 2015–2019 | 0 | 0 | 0 | 6.2 ± 3.7 | 5.5 ± 2.6 | 11.7 ± 4.2 |
| Planting Year | pH | P (mg/kg) | K (mg/kg) | Ca (mg/kg) | Mg (mg/kg) | Zn (mg/kg) | Sand (%) | Silt (%) | Clay (%) | Total C (%) | Total N (%) |
|---|---|---|---|---|---|---|---|---|---|---|---|
| 2000 | 5.41 ± 0.33 | 180.3 ± 11.3 | 109.3 ± 13.5 | 2791 ± 479 | 163.8 ± 9.1 | 3.45 ± 0.38 | 14.7 ± 1.2 | 74.8 ± 1.4 | 11.0 ± 0.36 | 3.8 ± 0.11 | 0.35 ± 0.005 |
| 2001 | 4.94 ± 0.27 | 239.9 ± 23.4 | 174.6 ± 15.6 | 2665 ± 428 | 237.9 ± 36.9 | 15.5 ± 10.9 | 19.6 ± 2.4 | 67.0 ± 3.9 | 13.4 ± 2.5 | 3.95 ± 0.36 | 0.36 ± 0.03 |
| 2002 | 5.60 ± 0.11 | 98.7 ± 16.8 | 188.0 ± 15.7 | 2449 ± 164 | 207.1 ± 14.5 | 2.7 ± 0.37 | 14.0 ± 0.65 | 70.3 ± 2.7 | 15.6 ± 2.6 | 2.87 ± 0.27 | 0.25 ± 0.02 |
| 2003 | 6.49 ± 0.13 | 228.8 ± 22.8 | 142.0 ± 30.8 | 4196 ± 217 | 241.6 ± 18.6 | 12.6 ± 2.58 | 14.4 ± 1.2 | 70.0 ± 1.2 | 15.7 ± 0.53 | 3.73 ± 0.16 | 0.33 ± 0.01 |
| 2004 | 5.93 ± 0.34 | 315.7 ± 42.3 | 180.0 ± 31.1 | 3589 ± 246 | 242.2 ± 14.0 | 4.15 ± 0.55 | 18.7 ± 0.67 | 65.3 ± 1.4 | 16.0 ± 1.0 | 3.73 ± 0.30 | 0.34 ± 0.03 |
| 2005 | 6.43 ± 0.11 | 142.0 ± 3.4 | 80.3 ± 4.8 | 3973 ± 290 | 188.5 ± 22.9 | 12.6 ± 5.63 | 16.4 ± 1.2 | 70.0 ± 1.4 | 13.4 ± 0.68 | 3.45 ± 0.22 | 0.29 ± 0.02 |
| 2006 | 6.58 ± 0.10 | 157.2 ± 5.0 | 87.3 ± 12.6 | 4444 ± 74.7 | 190.2 ± 23.2 | 11.2 ± 3.4 | 11.0 ± 0.58 | 73.7 ± 0.33 | 15.7 ± 0.67 | 3.56 ± 0.19 | 0.30 ± 0.02 |
| 2007 | 5.57 ± 0.05 | 172.7 ± 5.6 | 287.5 ± 34.6 | 2942 ± 100 | 203.5 ± 3.2 | 2.1 ± 0.2 | 13.3 ± 0.67 | 67.0 ± 1.5 | 19.7 ± 2.2 | 2.94 ± 0.21 | 0.28 ± 0.02 |
| 2008 | 4.36 ± 0.24 | 76.8 ± 14.4 | 65.0 ± 16.9 | 1248 ± 213 | 104.3 ± 17.9 | 1.38 ± 0.19 | 14.7 ± 0.88 | 75.3 ± 1.8 | 10.3 ± 0.88 | 2.70 ± 0.18 | 0.25 ± 0.02 |
| 2009 | 6.10 ± 0.38 | 108.5 ± 11.5 | 156.5 ± 52.5 | 2837 ± 421 | 184.5 ± 8.8 | 7.62 ± 0.22 | 20.7 ± 2.0 | 65.3 ± 2.7 | 13.7 ± 3.5 | 3.22 ± 0.44 | 0.29 ± 0.05 |
| 2010 | 6.36 ± 0.28 | 204.9 ± 11.2 | 126.9 ± 23.7 | 4376 ± 358 | 306.2 ± 28.5 | 5.31 ± 1.05 | 15.8 ± 0.92 | 67.1 ± 1.3 | 17.0 ± 0.71 | 4.08 ± 0.19 | 0.37 ± 0.02 |
| 2011 | 5.25 ± 0.32 | 58.0 ± 11.3 | 143.5 ± 25.7 | 2575 ± 442 | 217.2 ± 16.0 | 3.65 ± 0.21 | 12.3 ± 0.88 | 73.0 ± 3.0 | 15.3 ± 3.38 | 3.42 ± 0.03 | 0.31 ± 0.01 |
| 2012 | 6.33 ± 0.32 | 168.0 ± 4.4 | 181.2 ± 67.4 | 3645 ± 446 | 174.2 ± 31.8 | 6.35 ± 2.49 | 18.3 ± 2.9 | 65.0 ± 2.9 | 16.3 ± 0.33 | 3.52 ± 0.23 | 0.32 ± 0.03 |
| 2013 | 5.33 ± 0.15 | 55.3 ± 11.4 | 252.8 ± 13.4 | 2710 ± 144 | 258.1 ± 11.6 | 3.84 ± 0.66 | 15.8 ± 0.85 | 69.5 ± 1.3 | 15.8 ± 1.4 | 4.25 ± 0.28 | 0.39 ± 0.02 |
| 2014 | 4.64 ± 0.08 | 20.3 ± 2.5 | 77.6 ± 5.6 | 1727 ± 133 | 219.5 ± 14.8 | 1.75 ± 0.26 | 21.0 ± 0.58 | 67.2 ± 0.85 | 12.0 ± 0.41 | 3.76 ± 0.19 | 0.37 ± 0.02 |
| 2015 | 5.91 ± 0.26 | 189.5 ± 8.4 | 119.0 ± 24.9 | 3739 ± 295 | 163.1 ± 10.4 | 3.22 ± 0.35 | 20.7 ± 2.3 | 67.3 ± 2.2 | 11.8 ± 0.65 | 4.47 ± 0.24 | 0.44 ± 0.02 |
| 2016 | 5.60 ± 0.22 | 265.5 ± 11.1 | 98.2 ± 5.2 | 3181 ± 347 | 124.8 ± 6.1 | 1.63 ± 0.26 | 20.7 ± 0.67 | 58.0 ± 1.2 | 21.3 ± 0.67 | 1.48 ± 0.06 | 0.14 ± 0.01 |
| 2017 | 4.56 ± 0.14 | 44.3 ± 8.8 | 160.7 ± 44.1 | 2501 ± 219 | 263.5 ± 20.1 | 3.07 ± 0.75 | 15.3 ± 0.67 | 66.7 ± 2.3 | 18.3 ± 2.0 | 4.14 ± 0.04 | 0.42 ± 0.01 |
| 2018 | 6.78 ± 0.21 | 241.3 ± 49.1 | 205.8 ± 64.8 | 5774 ± 748 | 267.5 ± 46.8 | 4.05 ± 1.66 | 19.0 ± 0.58 | 59.3 ± 3.5 | 21.0 ± 3.6 | 3.50 ± 0.49 | 0.25 ± 0.07 |
| 2019 | 4.64 ± 0.09 | 121.1 ± 11.7 | 168.0 ± 19.6 | 1600 ± 108 | 190.4 ± 5.4 | 2.52 ± 0.32 | 14.7 ± 0.50 | 71.0 ± 1.0 | 14.6 ± 0.97 | 2.94 ± 0.11 | 0.30 ± 0.01 |
| Maximum | 6.78 | 315.67 | 287.50 | 5774.50 | 306.25 | 15.53 | 0.210 | 0.753 | 0.213 | 0.045 | 0.004 |
| Minimum | 4.36 | 20.25 | 65.00 | 1247.84 | 104.33 | 1.38 | 0.110 | 0.580 | 0.103 | 0.015 | 0.001 |
| Mean | 5.66 | 154.44 | 150.20 | 3148.21 | 207.40 | 5.43 | 0.165 | 0.681 | 0.154 | 0.035 | 0.003 |
| Regression Statistics † | |||||||||||
| Slope | 0.023 | 7.704 | −0.706 | 43.5 | 0.768 | 0.844 | −0.001 | 0.002 | −0.001 | 0.000 | −0.000 |
| p-value | 0.096 | 0.004 | 0.769 | 0.285 | 0.729 | 0.019 | 0.204 | 0.037 | 0.090 | 0.338 | 0.864 |
| R2 | 0.019 | 0.086 | 0.001 | 0.002 | 0.001 | 0.057 | 0.017 | 0.045 | 0.030 | 0.010 | 0.000 |
Publisher’s Note: MDPI stays neutral with regard to jurisdictional claims in published maps and institutional affiliations. |
© 2021 by the authors. Licensee MDPI, Basel, Switzerland. This article is an open access article distributed under the terms and conditions of the Creative Commons Attribution (CC BY) license (https://creativecommons.org/licenses/by/4.0/).
Share and Cite
Sena, K.L.; Hackworth, Z.J.; Lhotka, J.M. Forest Development over a Twenty-Year Chronosequence of Reforested Urban Sites. Forests 2021, 12, 614. https://doi.org/10.3390/f12050614
Sena KL, Hackworth ZJ, Lhotka JM. Forest Development over a Twenty-Year Chronosequence of Reforested Urban Sites. Forests. 2021; 12(5):614. https://doi.org/10.3390/f12050614
Chicago/Turabian StyleSena, Kenton L., Zachary J. Hackworth, and John M. Lhotka. 2021. "Forest Development over a Twenty-Year Chronosequence of Reforested Urban Sites" Forests 12, no. 5: 614. https://doi.org/10.3390/f12050614
APA StyleSena, K. L., Hackworth, Z. J., & Lhotka, J. M. (2021). Forest Development over a Twenty-Year Chronosequence of Reforested Urban Sites. Forests, 12(5), 614. https://doi.org/10.3390/f12050614