Article

Photosynthetic Acclimation and Growth Responses to Elevated CO2 Associate with Leaf Nitrogen and Phosphorus Concentrations in Mulberry (Morus multicaulis Perr.)

1
Centre of Excellence for Soil Biology, Chongqing Key Laboratory of Plant Resource Conservation and Germplasm Innovation, College of Resources and Environment, Southwest University, Chongqing 400716, China
2
Key Laboratory of Southwest China Wildlife Resources Conservation, China West Normal University, Nanchong 637009, China
3
School of Biological Sciences, University of Western Australia, Perth, WA 6009, Australia
*
Author to whom correspondence should be addressed.
Forests 2021, 12(6), 660; https://doi.org/10.3390/f12060660
Submission received: 8 April 2021 / Revised: 14 May 2021 / Accepted: 18 May 2021 / Published: 22 May 2021
(This article belongs to the Section Forest Ecology and Management)

Abstract

:
Mulberry (Morus spp.) is a multipurpose tree that is worldwide planted because of its economic importance. This study was to investigate the likely consequences of anticipated future elevated CO2 (eCO2) on growth, physiology and nutrient uptake of nitrogen (N), phosphorus (P) and potassium (K) in two most widely cultivated mulberry (Morus multicaulis Perr.) varieties, QiangSang-1 and NongSang-14, in southwest China. A pot experiment was conducted in environmentally auto-controlled growth chambers under ambient CO2 (ACO2, 410/460 ppm, daytime/nighttime) and eCO2 (710/760 ppm). eCO2 significantly increased plant height, stem diameter, leaf numbers and biomass production, and decreased chlorophyll concentrations, net photosynthetic rate, stomatal conductance and transpiration rate of these two mulberry varieties. Under eCO2 leaf N and P, and root N, P and K concentrations in both mulberry varieties decreased, while plant total P and K uptake in both varieties were enhanced, and an increased total N uptake in NongSang-4, but not in QiangSang-1. Nutrient dilution and transpiration rate were the main factors driving the reduction of leaf N and P, whereas changes in plant N and P demand had substantial impacts on photosynthetic inhibition. Our results can provide effective nutrient management strategies for a sustainable mulberry production under global atmosphere CO2 rising scenarios.

1. Introduction

Global atmospheric carbon dioxide (ACO2) concentration is predicted to exceed 700 ppm by the end of this century [1], mostly due to anthropogenic activities. The elevated CO2 (eCO2) concentration stimulates the photosynthesis especially in C3 plants, and above-ground biomass accumulation [2]. However, when the synthesis of carbohydrates exceeds the capacity to produce new sinks under eCO2, plants would reduce photosynthetic rate in order to balance source-sink, which triggers plant photosynthetic acclimation [3,4,5]. The photosynthetic acclimation during plant growth in response to eCO2 is often accompanied with reduced in both the amount and activity of ribulose-1, 5-bisphosphate carboxylase/oxygenase (Rubisco), stomatal conductance, leaf nutrient concentrations and chlorophyll content [6,7,8,9]. These effects of eCO2 have been reported in herbaceous species, such as faba bean [10], cucumber [11], rice [4], tomato [12] and wheat [13]. However, there was less information about the genotypic, inter- or intra-species variations in perennial woody species.
To maintain a high productivity plants need an enhanced supply of essential nutrients such as nitrogen (N), phosphorus (P) and potassium (K) to match their increase in C acquisition under eCO2. Previous studies showed that effects of eCO2 on N, P and K uptake varied with tree species and experimental conditions [14,15,16]. 550 ppm eCO2 decreased leaf N concentration during the initial stages of Cajanus cajan, but increased leaf N uptake by 6.5% and 17.5% in vegetative and reproductive stages, respectively [17]. N concentrations in fully expanded leaves declined by 8% under 550 ppm eCO2 in Eucalyptus tereticornis [18]. In addition, P concentrations in a mature eucalypt woodland [19] and Picea mariana [20] were significantly increased with 550 ppm eCO2. In contrast, P concentrations in Populus deltoides [21] and Quercus variabilis [22] were decreased with 660–700 ppm eCO2 in a pot experiment. Moreover, 700 ppm eCO2 effects on plant K uptake were species-specific, with enhanced K acquisition in Oligostachyum lubricum but not in Phyllostachys edulis [23]. However, 690 ppm eCO2 had no effect on tissue N, P and K concentrations and uptake rates of N, P and K of Larix kaempferi in a field experiment with open-top chambers [24]. Consequently, contradictions exist when comparing the results of different species and experimental conditions, and the response mechanisms of plants to eCO2 remain unknown about their uptake of N, P, and K.
Mulberry (Morus spp.) is a fast-growing multipurpose plant and has been widely planted in Asia, Africa, Europe, North and South America [25]. A total of 30 mulberry species and nine varieties are mainly grown in China, India and Japan [26]. Different tissues of mulberry plants are of great interest owing to their nutraceutical values. For instance, mulberry leaves contain an appreciable amount of antioxidants, carbohydrates, fats, fibers, minerals, proteins and vitamins [27], and have been used not only to rear silkworm, cattle, goat and other animals, but also to make tea and for consumption as a vegetable [28]. The root and bark of mulberry are employed as a component of anti-diabetic medicines in Traditional Oriental Medicine [29,30]. Stems of mulberry are used to produce some bioactive molecules and exhibit great antioxidant properties [31]. Given the high economic and medicinal value of mulberry plants, studies on its growth, photosynthesis and nutrient uptake response to global environmental change scenarios are indispensable. Previous studies have demonstrated that 550–800 ppm eCO2 enhance the growth of different mulberry species, e.g., Selection-13, Kanva-2, ‘Qinglong’ mulberry and Gui-sang-you 62 [32,33,34,35]. However, it remains unclear how eCO2 could affect uptake of N, P and K and their allocation in mulberry leaves, which are food source for silkworms.
The objectives of the present study were to quantify (a) the growth and photosynthetic response to eCO2 of two mulberry (Morus multicaulis Perr.) varieties, QiangSang-1 and NongSang-14, which are widely cultivated in the south of China and (b) the effects of eCO2 on tissue N, P and K uptake, concentrations and allocation in these mulberry varieties.

2. Materials and Methods

2.1. Experiment Design

This study was conducted in automatically controlled-environment growth chambers located in the National Monitoring Base for Purple Soil Fertility and Fertilizer Efficiency (29°48′ N, 106°24′ E, 266.3 m above sea level) on the campus of Southwest University, Chongqing, China (Figure S1A,B). Each growth chamber (1.5 × 1.0 × 2.5 m) has a rectangle floor base, which is supported by a steel frame that is hanging 50 cm above the cement ground base (Figure S1A). The bottom floors of the growth chamber are made up with polyvinyl chloride plates and the four-side walls and top roofs of the chamber are constructed by tempered glasses (10 mm thickness, 90% light transmission rate, Yutao Glass Company, Jiulongpo District, Chongqing, China) (Figure S1A,B). Detailed information of the automatically controlled-environment facility used in this study has also been described in our previous studies [35,36]. The experiment had a randomized block design with ACO2 and eCO2 levels as the main treatment (three chambers or replicates for each treatment) and two plant varieties as the sub-treatment. Two pots per variety were placed in each chamber and thus the three replicated chambers had a total of six replicated pots for each CO2 treatment. According to the observed daytime and nighttime atmosphere CO2 concentrations in the study site, we designed CO2 concentrations (±30 ppm) as followed: ACO2 (410 ppm daytime/460 ppm nighttime) and eCO2 (710 ppm daytime/760 ppm nighttime). Daytime was from 07:00 a.m. to 19:00 p.m. and nighttime was from 19:00 p.m. to 07:00 a.m. Except for the CO2 concentration, the chambers had similar growth conditions such as fertilization, light, air temperature, and humidity. The similar temperature and humidity between inside and outside the growth chambers were also automatically maintained by the above-mentioned CO2 auto-controlling facility [35,36]. The sunlight intensity and photosynthetic active radiation (PAR) were supplied by natural sunlight through the growth chamber’s four walls and top roof being made up with tempered glasses (90% light transmission rate, see Figure S1A,B).

2.2. Plant Materials

One-year-old mulberry seedlings of two varieties (Morus multicaulis Perr. var. Qiang Sang-1 and NongSang-14) with uniform growth status (diameter: 4.0 ± 0.08 mm; height: 25 ± 0.25 cm) were as the experiment materials. Two seedlings per variety were grown in a plastic pot (20 × 32 cm = height × diameter) filled with 11 kg soil (Eutric Regosol, FAO Soil Classification System) from 10 May to 16 September 2020. The soil (pH 6.8) was air-dried and sieved by passing through a 2 mm mesh, which contained 10.56 g kg−1 organic carbon, 0.66 g kg−1 total N, 0.61 g kg−1 total P, 97 mg kg−1 available N, 17 mg kg−1 available P and 197 mg kg−1 available K. Four weeks after growth, 0.5 g N, 0.25 g P and 0.25 g K per pot were applied to meet the nutrient requirement of plant growth. The plants were regularly irrigated to maintain soil moisture at 70–80%. The pots in the chambers were weekly relocated once to minimize differences in growth conditions.

2.3. Determination of Plant Growth

The plants were harvested on 16 September 2020 after 129 days of CO2 exposure. Plant height, stem diameter and leaf numbers were recorded prior to harvest. Plant height was measured from plant base to top of stem using a steel ruler, and the stem diameter was measured using a Vernier caliper. At harvest, plant samples were separated into leaf, stem and root, and then washed with distilled water and dried at 75 °C for 72 h to determine the biomass production.

2.4. Determination of Photosynthetic Parameters

The measurements were taken before harvest during the period of 9:00–11:00 a.m. on sunny days of September 8, 11 and 15, 2020 (Data were averaged from these three days). The fifth fully expanded leaf was selected to determine net photosynthetic rate, stomatal conductance, and transpiration rate using a Li-6800 portable photosynthesis system (LI-COR, Lincoln, USA). Throughout the measurements, the saturating photosynthetically active radiation was 1600 µmol m−2 s−1, leaf temperature in the leaf chamber was set to 25 ± 1 °C. Leaf gas exchange parameters were measured at 410 ppm and 710 ppm CO2 for plants grown under ACO2 and eCO2, respectively. Water use efficiency was calculated as the ratio of photosynthetic rate and transpiration rate. Meanwhile, leaf chlorophyll a and b concentrations were extracted with 80% (v/v) acetone and measured by spectrophotometry at 663 nm and 645 nm [37].

2.5. Plant N, P and K Measurements

The oven-dried leaf, stem and root samples were ground into fine powder and then digested with 98% sulfuric acid and 30% hydrogen peroxide. Concentrations of N, P and K were determined using the micro-Kjeldahl method, vanadium molybdate yellow colorimetric method and flame photometry, respectively [38]. The N, P or K accumulations were multiplied by the N, P or K concentrations with the biomass.

2.6. Statistical Analysis

The data were statistically analyzed using the IBM SPSS Statistics 19.0 (SPSS Inc., Chicago, IL, USA). The results were presented as means ± standard error (SE, n = 3). The effects of CO2 and variety on variables were analyzed using a two-way ANOVA. Significant differences among treatments were compared by the Tukey’s Multiple Range Test at p < 0.05.

3. Results

3.1. Plant Growth Traits

The eCO2 significantly increased the growth of both mulberry varieties (Table 1). The plant height was 8.6% and 16.8% higher for QiangSang and NongSang under eCO2 than under ACO2 (p < 0.01), respectively. Similarly, eCO2 also increased leaf number by 23.0% and 14.3% of QiangSang and NongSang (p < 0.01), respectively. CO2 enrichment increased stem diameter by 11% in both varieties compared to their respective controls (p < 0.05), whereas the difference between two varieties was not significant (p > 0.05). As a result, leaf, stem, root and total plant biomass production of QiangSang and NongSang grown under eCO2 were significantly increased by 29.9% and 25.5%, 30.8% and 33.0%, 10.5% and 42.0%, and 22.4% and 33.2% than their ACO2 counterparts, respectively. However, no significantly different effects on total plant biomass accumulation were found between these two varieties (p > 0.05).

3.2. Leaf Photosynthetic Traits

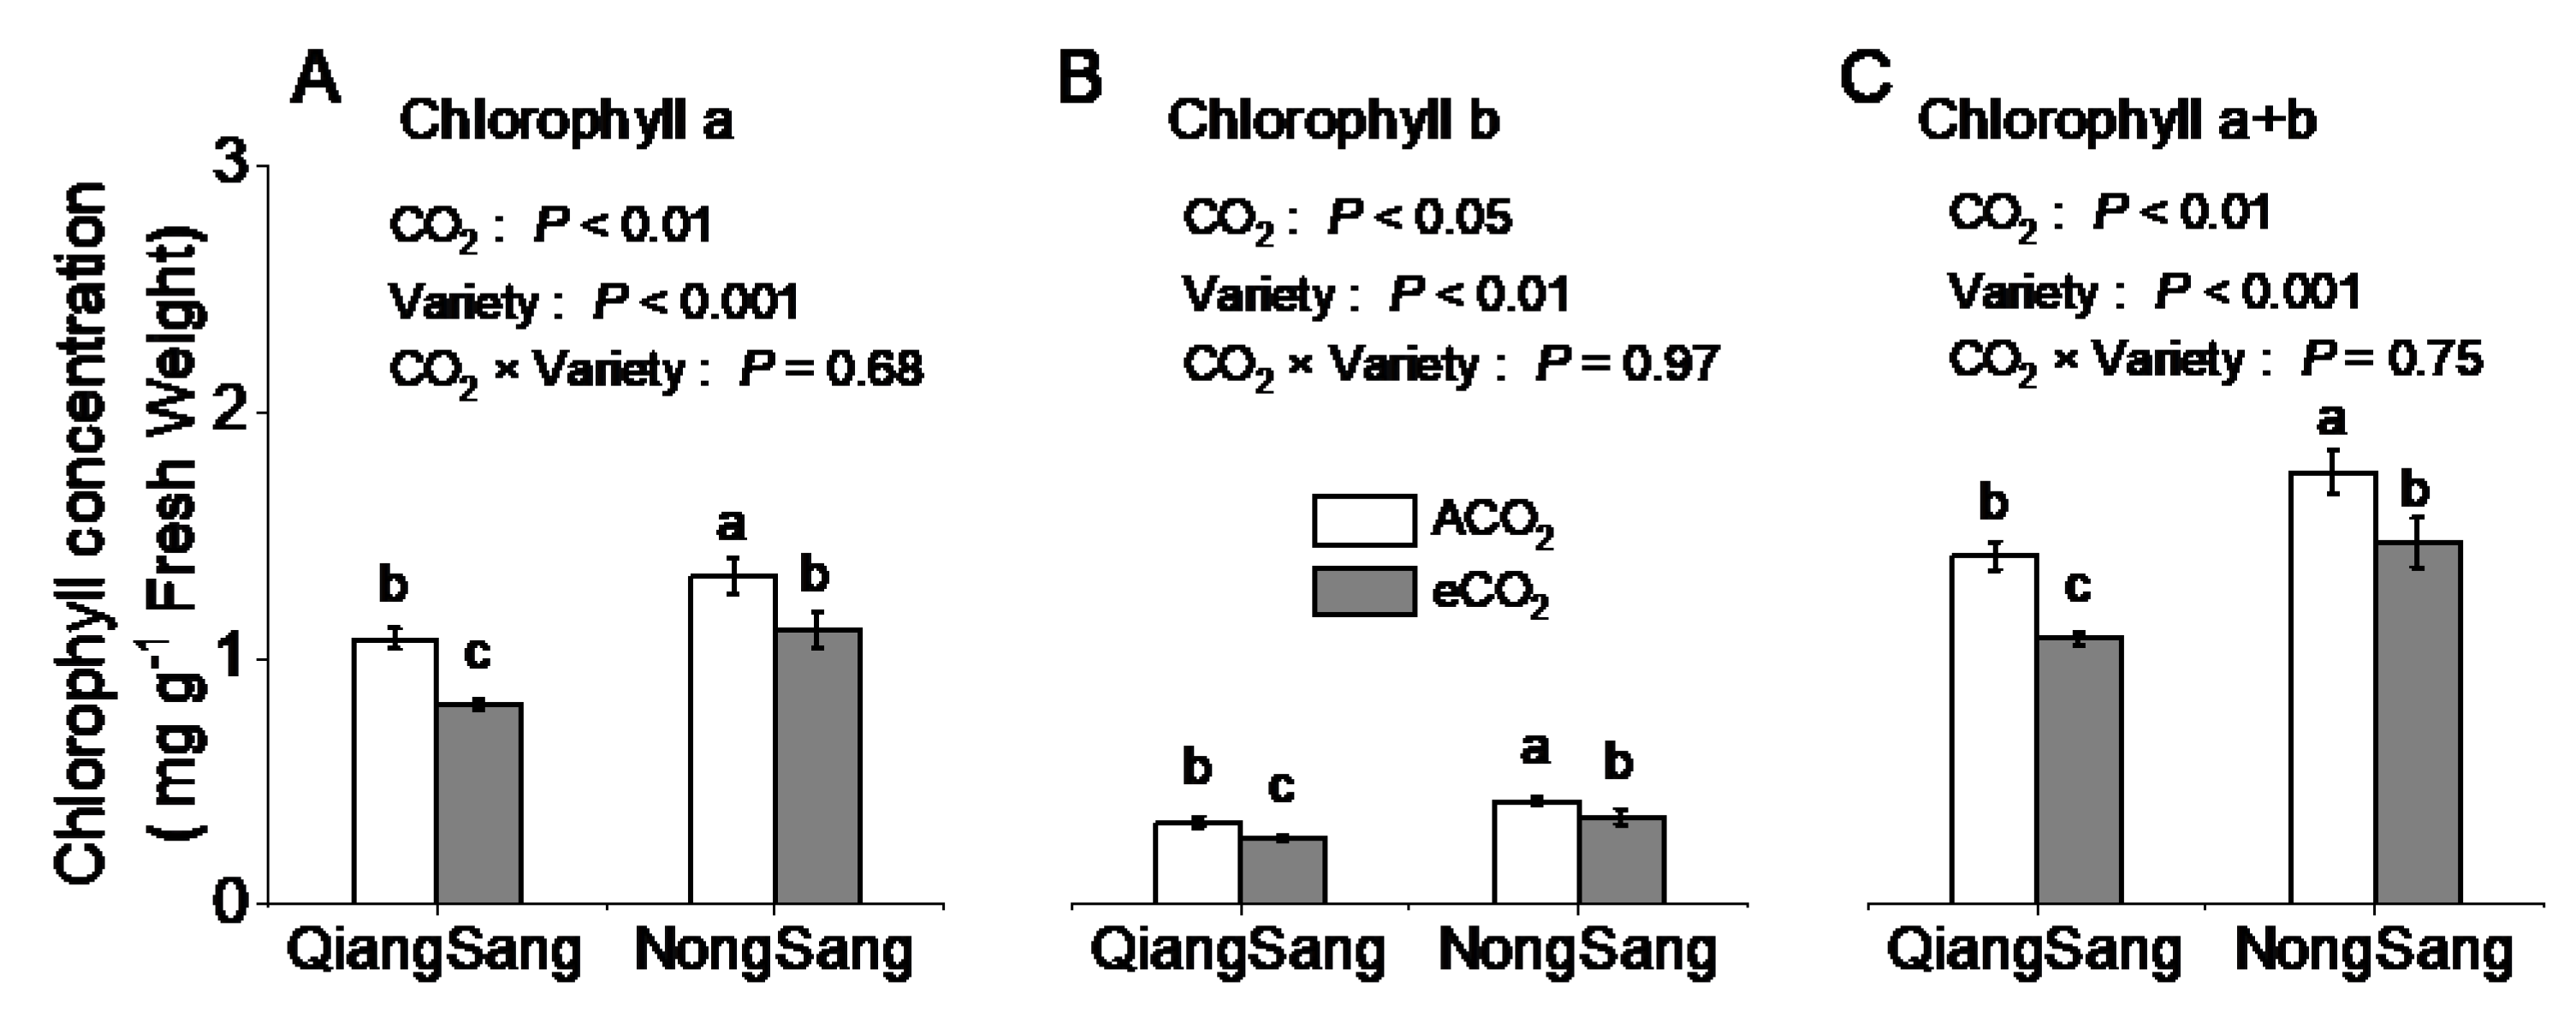
eCO2 induced significant changes in leaf gas exchange parameters of both mulberry varieties (Figure 1). Decreased net photosynthetic rate under eCO2 was recorded in both mulberry varieties (Figure 1A). Net photosynthetic rate decreased from 19.2 to 15.6 μmol m−2 s−1 (19.0%) in QiangSang whereas from 20.0 to 16.6 μmol m−2 s−1 (17.0%) in Nongsang (Figure 1A). Significant reductions in stomatal conductance of 39.7% and 41.8% (p < 0.001, Figure 1B), or transpiration rate of 44.9% and 47.7% (p < 0.001, Figure 1C) under eCO2 were recorded for QiangSang and NongSang, respectively. Because of lower transpiration rates, both varieties showed an increase in water use efficiency than their respective controls (Figure 1D). Meanwhile, concentrations of leaf chlorophyll a, chlorophyll b and chlorophyll a+b were significantly lower under eCO2 than in ACO2 for both mulberry varieties, but were significantly greater in NongSang than in QiangSang under both eCO2 and ACO2 (Figure 2).

3.3. Plant Tissue N, P, and K Concentrations

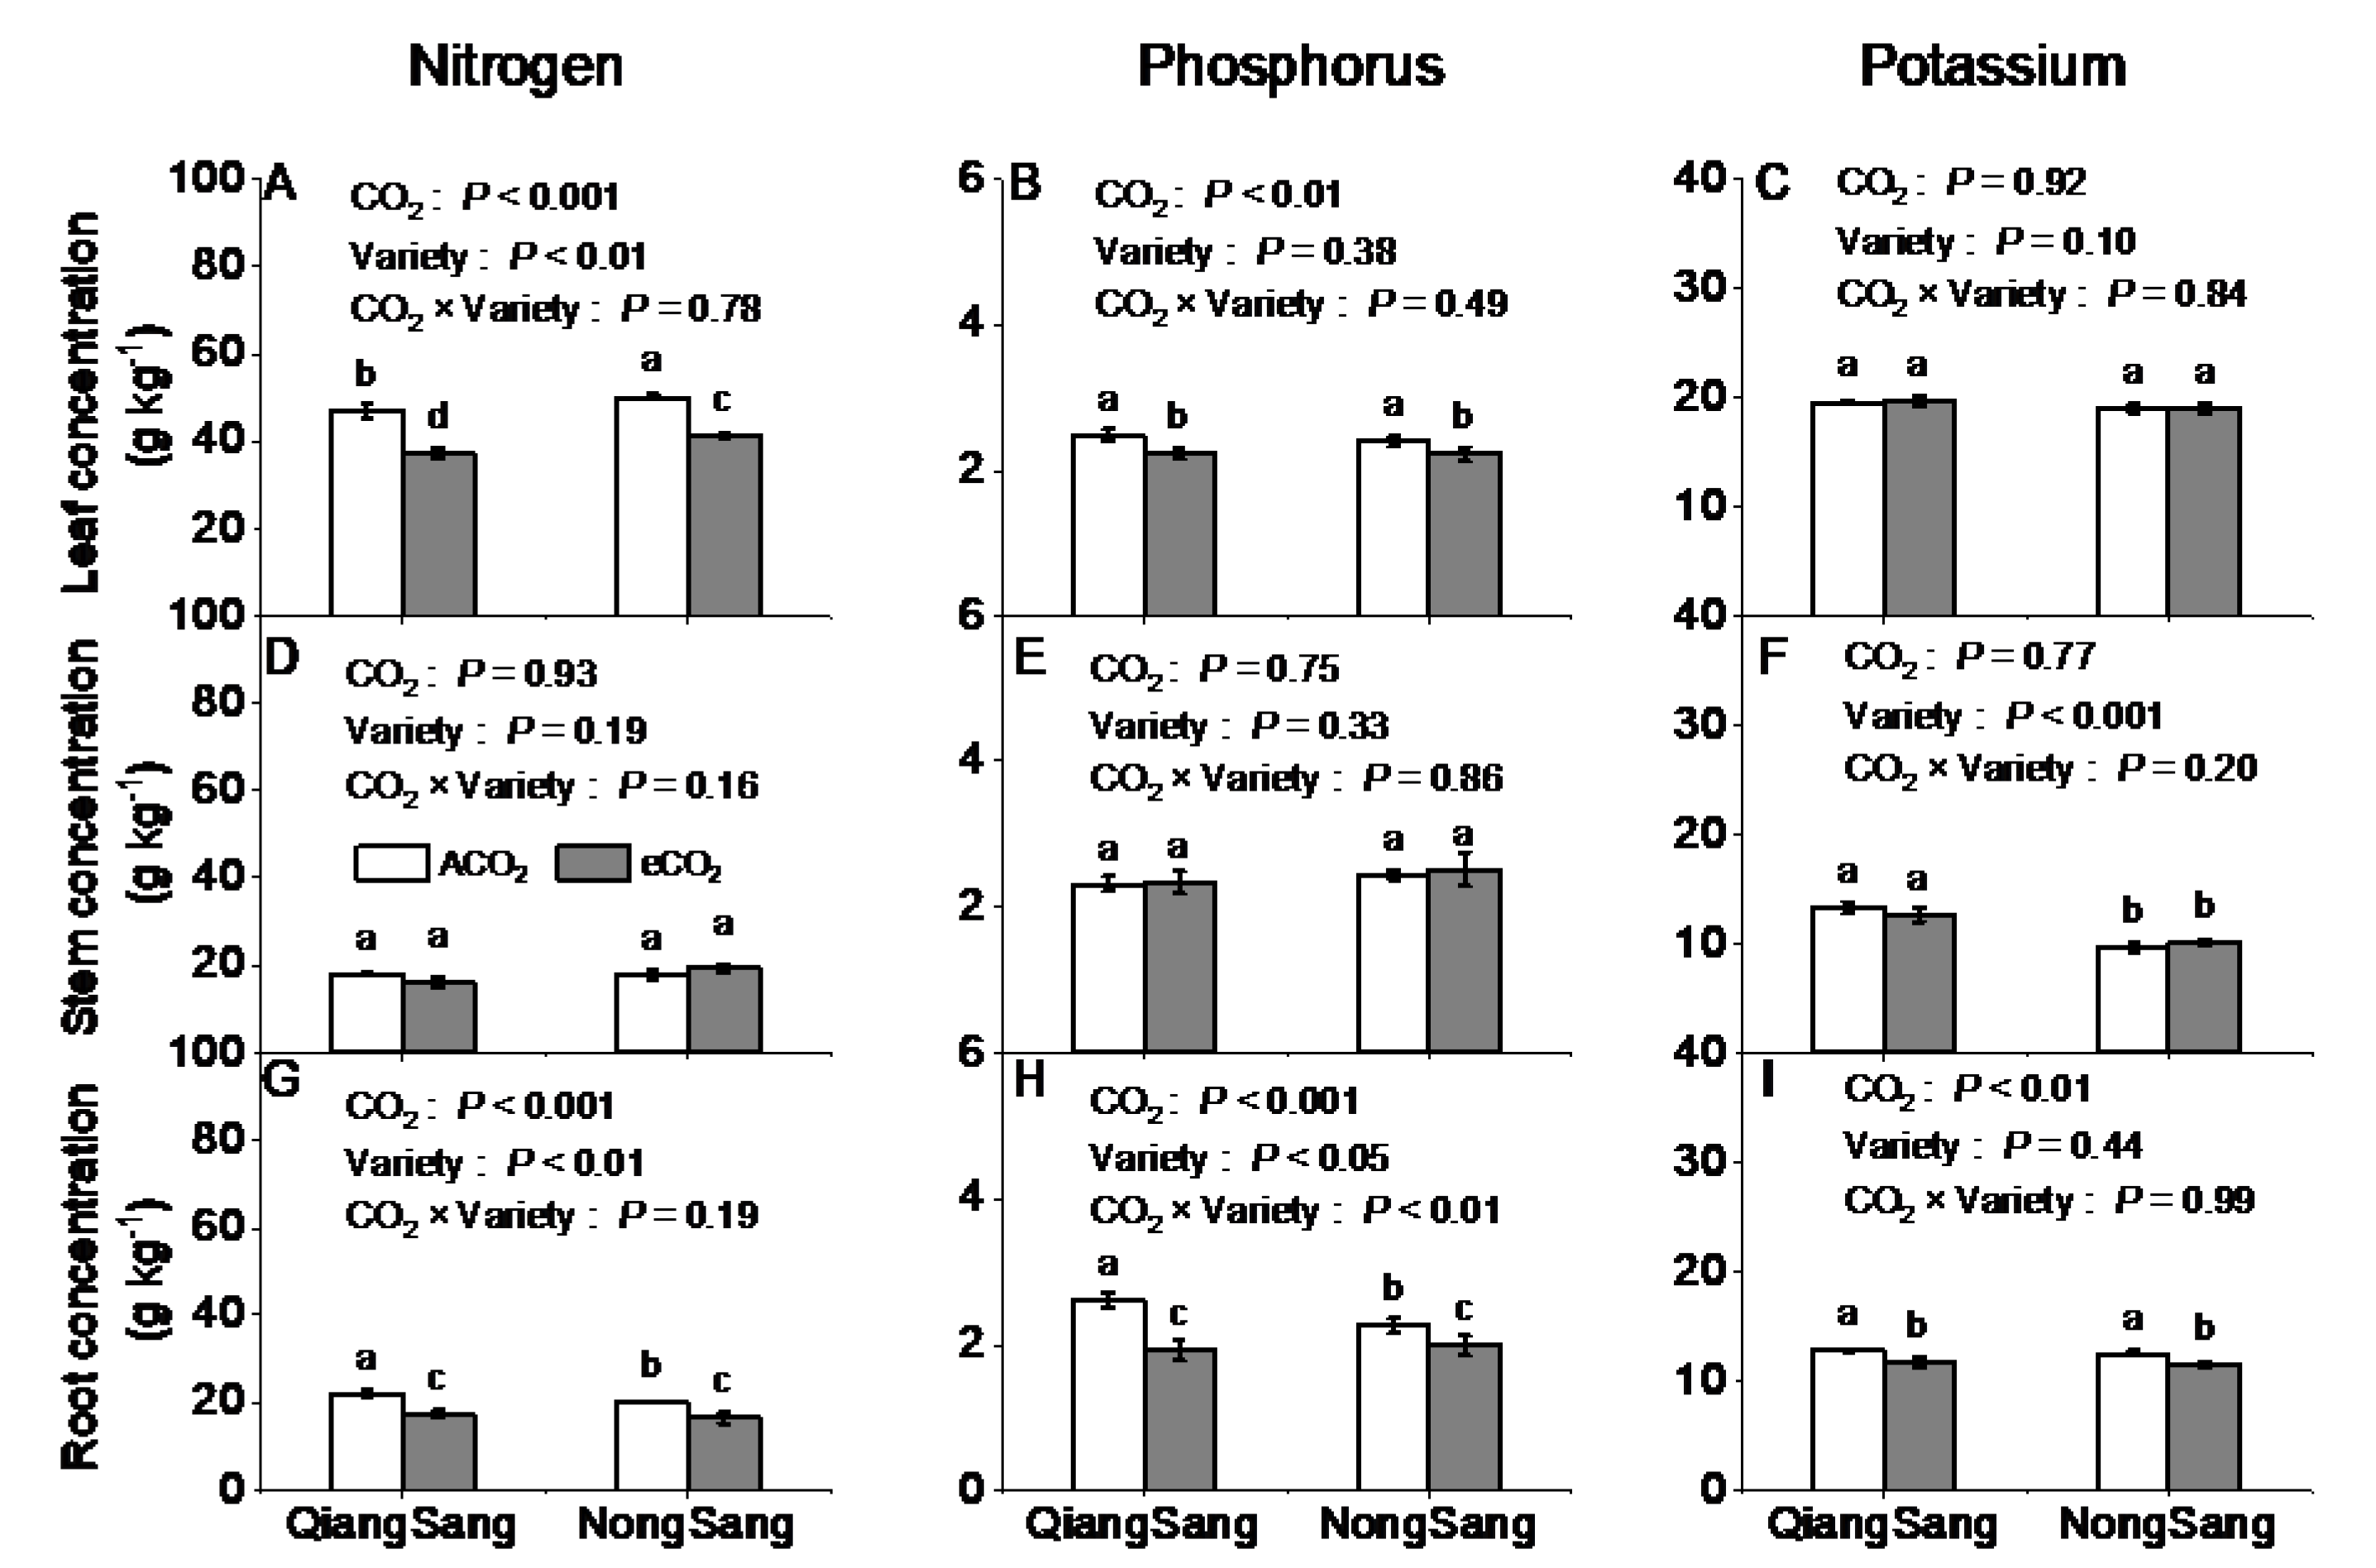
Concentrations of N and P in both leaves and roots under eCO2 were significantly lower in both mulberry varieties (Figure 3A,B,G,H), while stem N and P concentrations were not affected by CO2 enrichment (Figure 3D,E). Significant reductions of leaf and root N concentrations under eCO2 were 20.0% and 21.6% in QiangSang, while 17.6% and 18.0% in NongSang (Figure 3A,G). An average decrease of leaf and root P concentrations were 9.8% and 26.5% in QiangSang, while 7.3% and 12.2% in NongSang under eCO2 than under ACO2 (Figure 3B,H). Leaf and stem K concentrations were not affected (Figure 3C,F), but root K concentration (8.8%) were significantly decreased under eCO2 in both mulberry varieties (Figure 3I). In contrast, stem K concentration was higher in QiangSang than NongSang under both ACO2 and eCO2 (Figure 3F).

3.4. Plant N, P, and K Accumulations

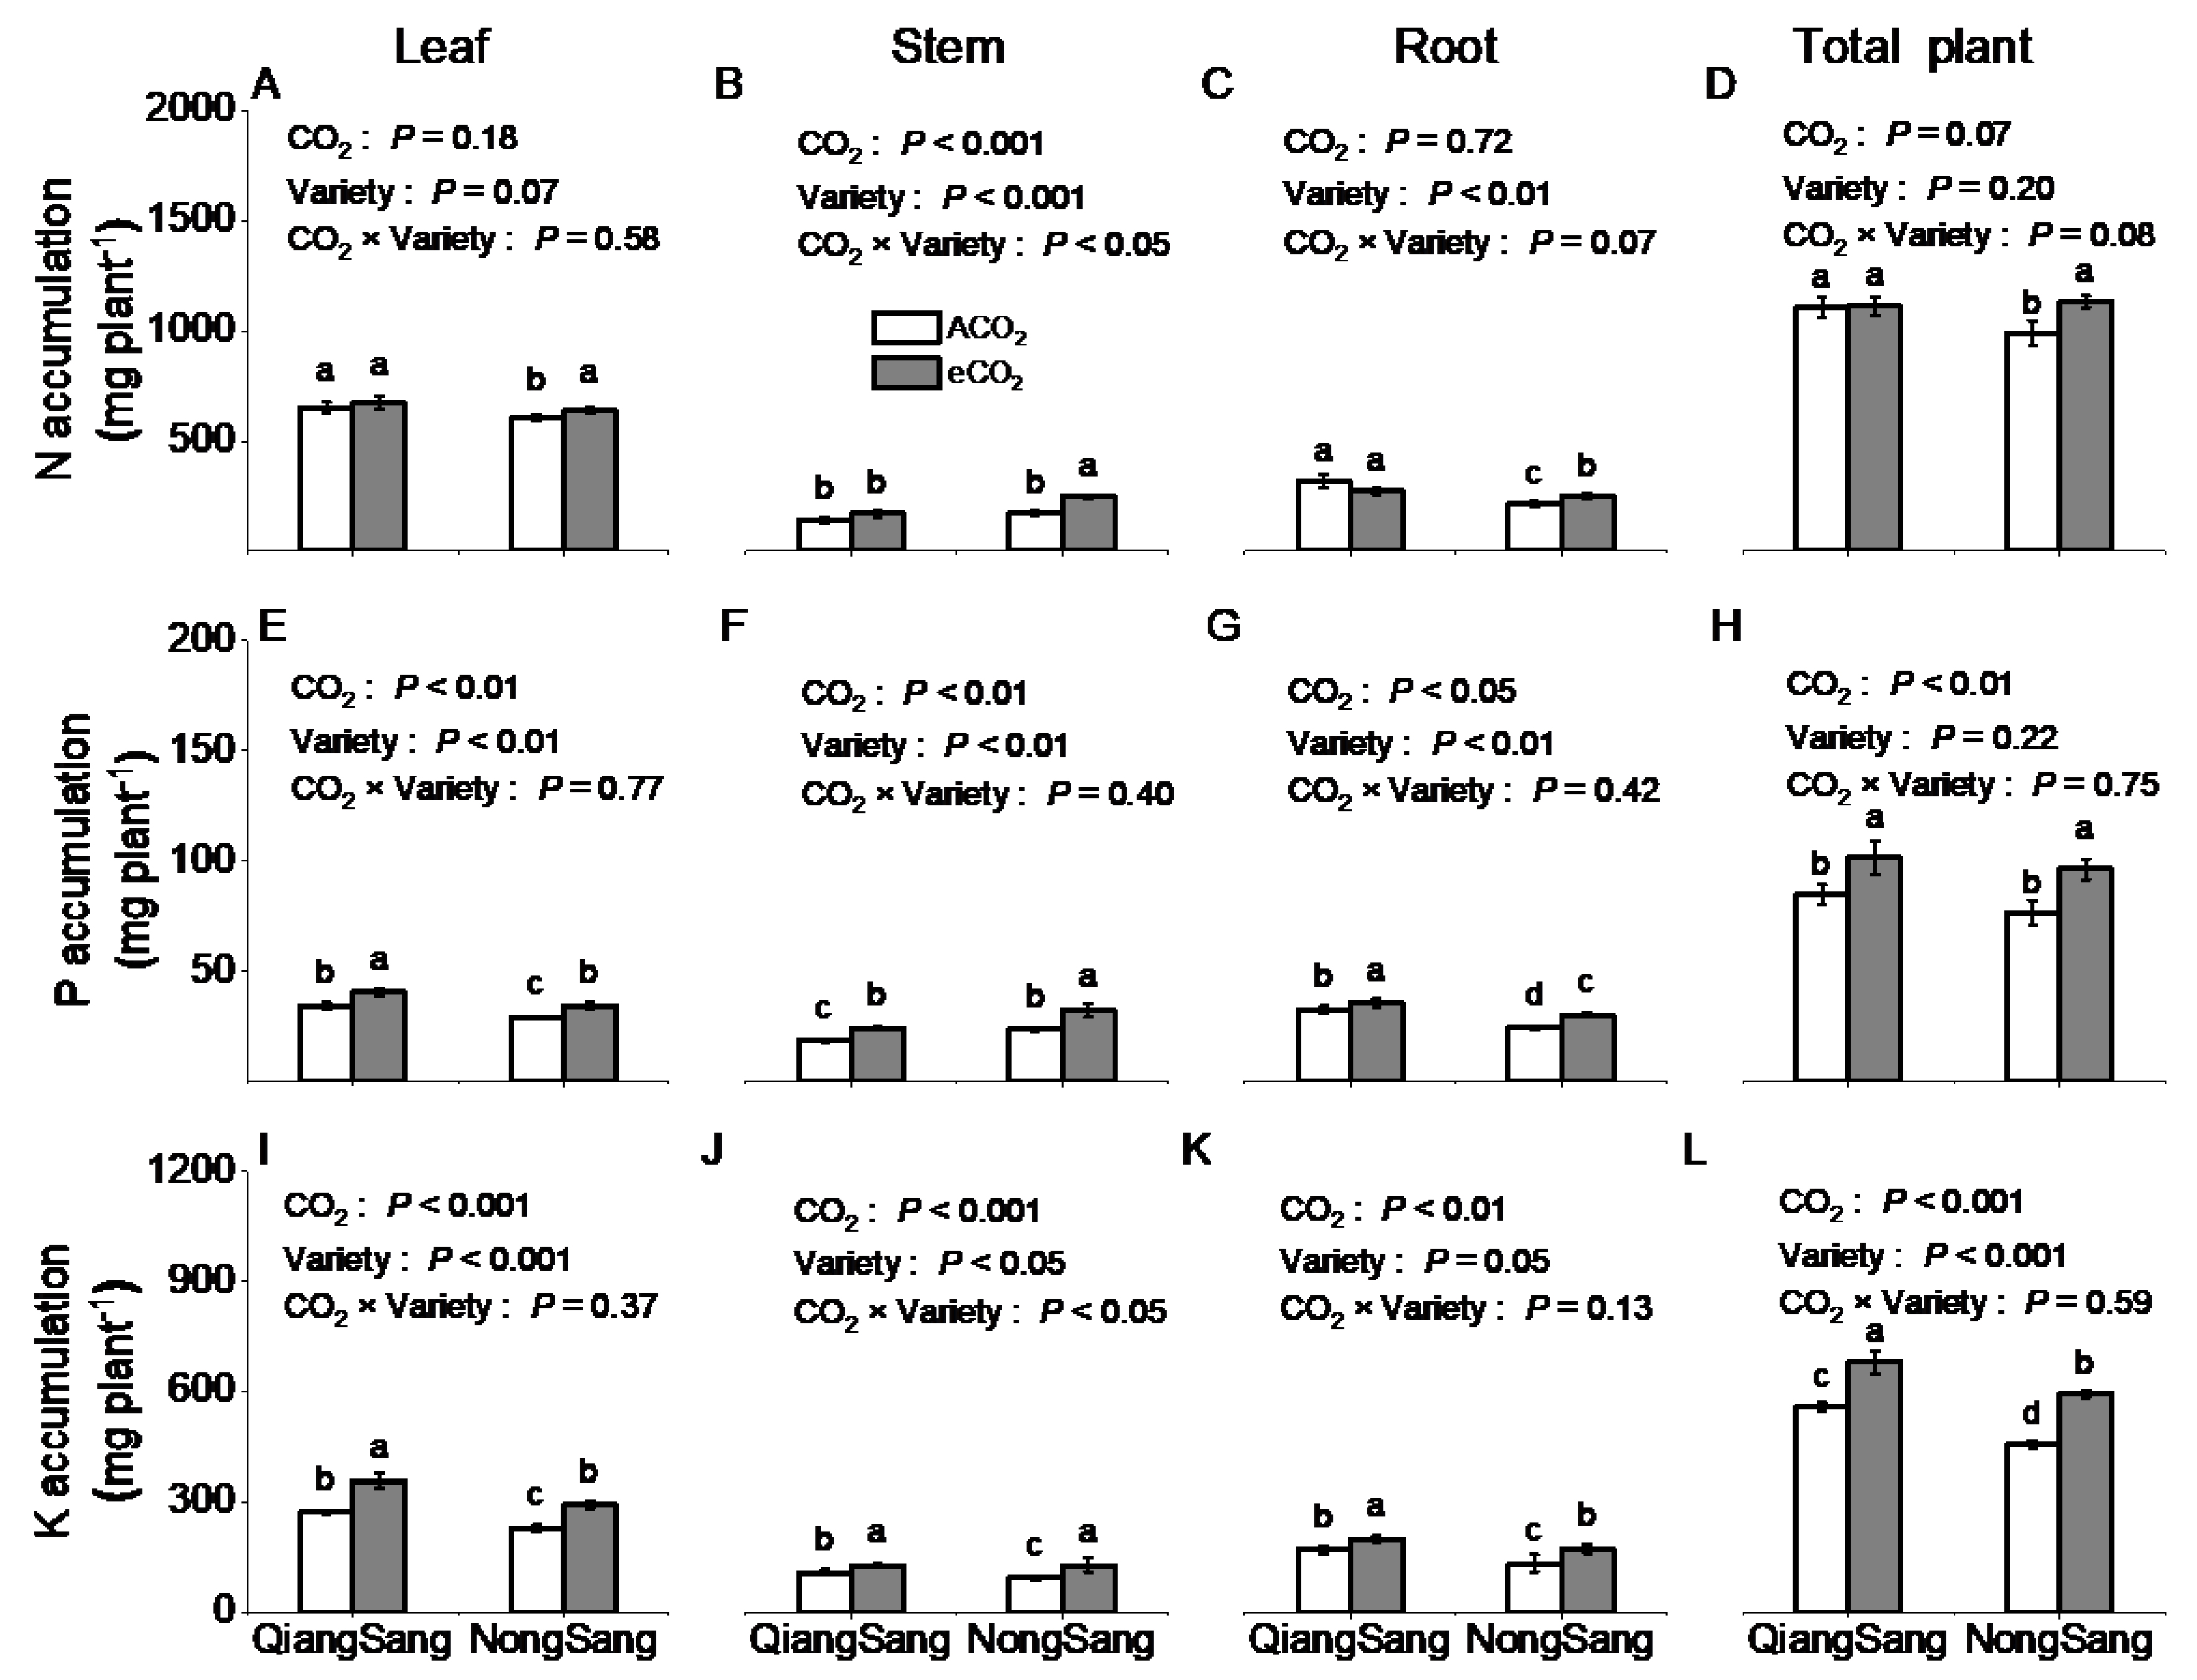
Compared to ACO2, N accumulations in leaves, stems, roots and total plants under eCO2 were significantly respectively increased by 6.7%, 43.7%, 14.5% and 18.8% in NongSang, but not in QiangSang (Figure 4A–D). Similar trends in P accumulations were observed in both mulberry varieties under eCO2 (Figure 4E–H). Compared to ACO2, P accumulations in leaves, stems, roots and total plants under eCO2 were significantly enhanced by 18.7%, 31.2%, 8.5% and 19% in QiangSang, and also by 18.8%, 37.1%, 23.9% and 26.0% in NongSang, respectively (Figure 4E–H). Both mulberry varieties showed significant increases of K accumulations in leaf, stem, root and total plant under eCO2 than their respective ACO2 counterparts. Meanwhile, More K accumulations in all of these plant tissues were in QiangSang than in NongSang under both ACO2 and eCO2 (Figure 4I–L).

3.5. Plant N, P, and K Partitioning

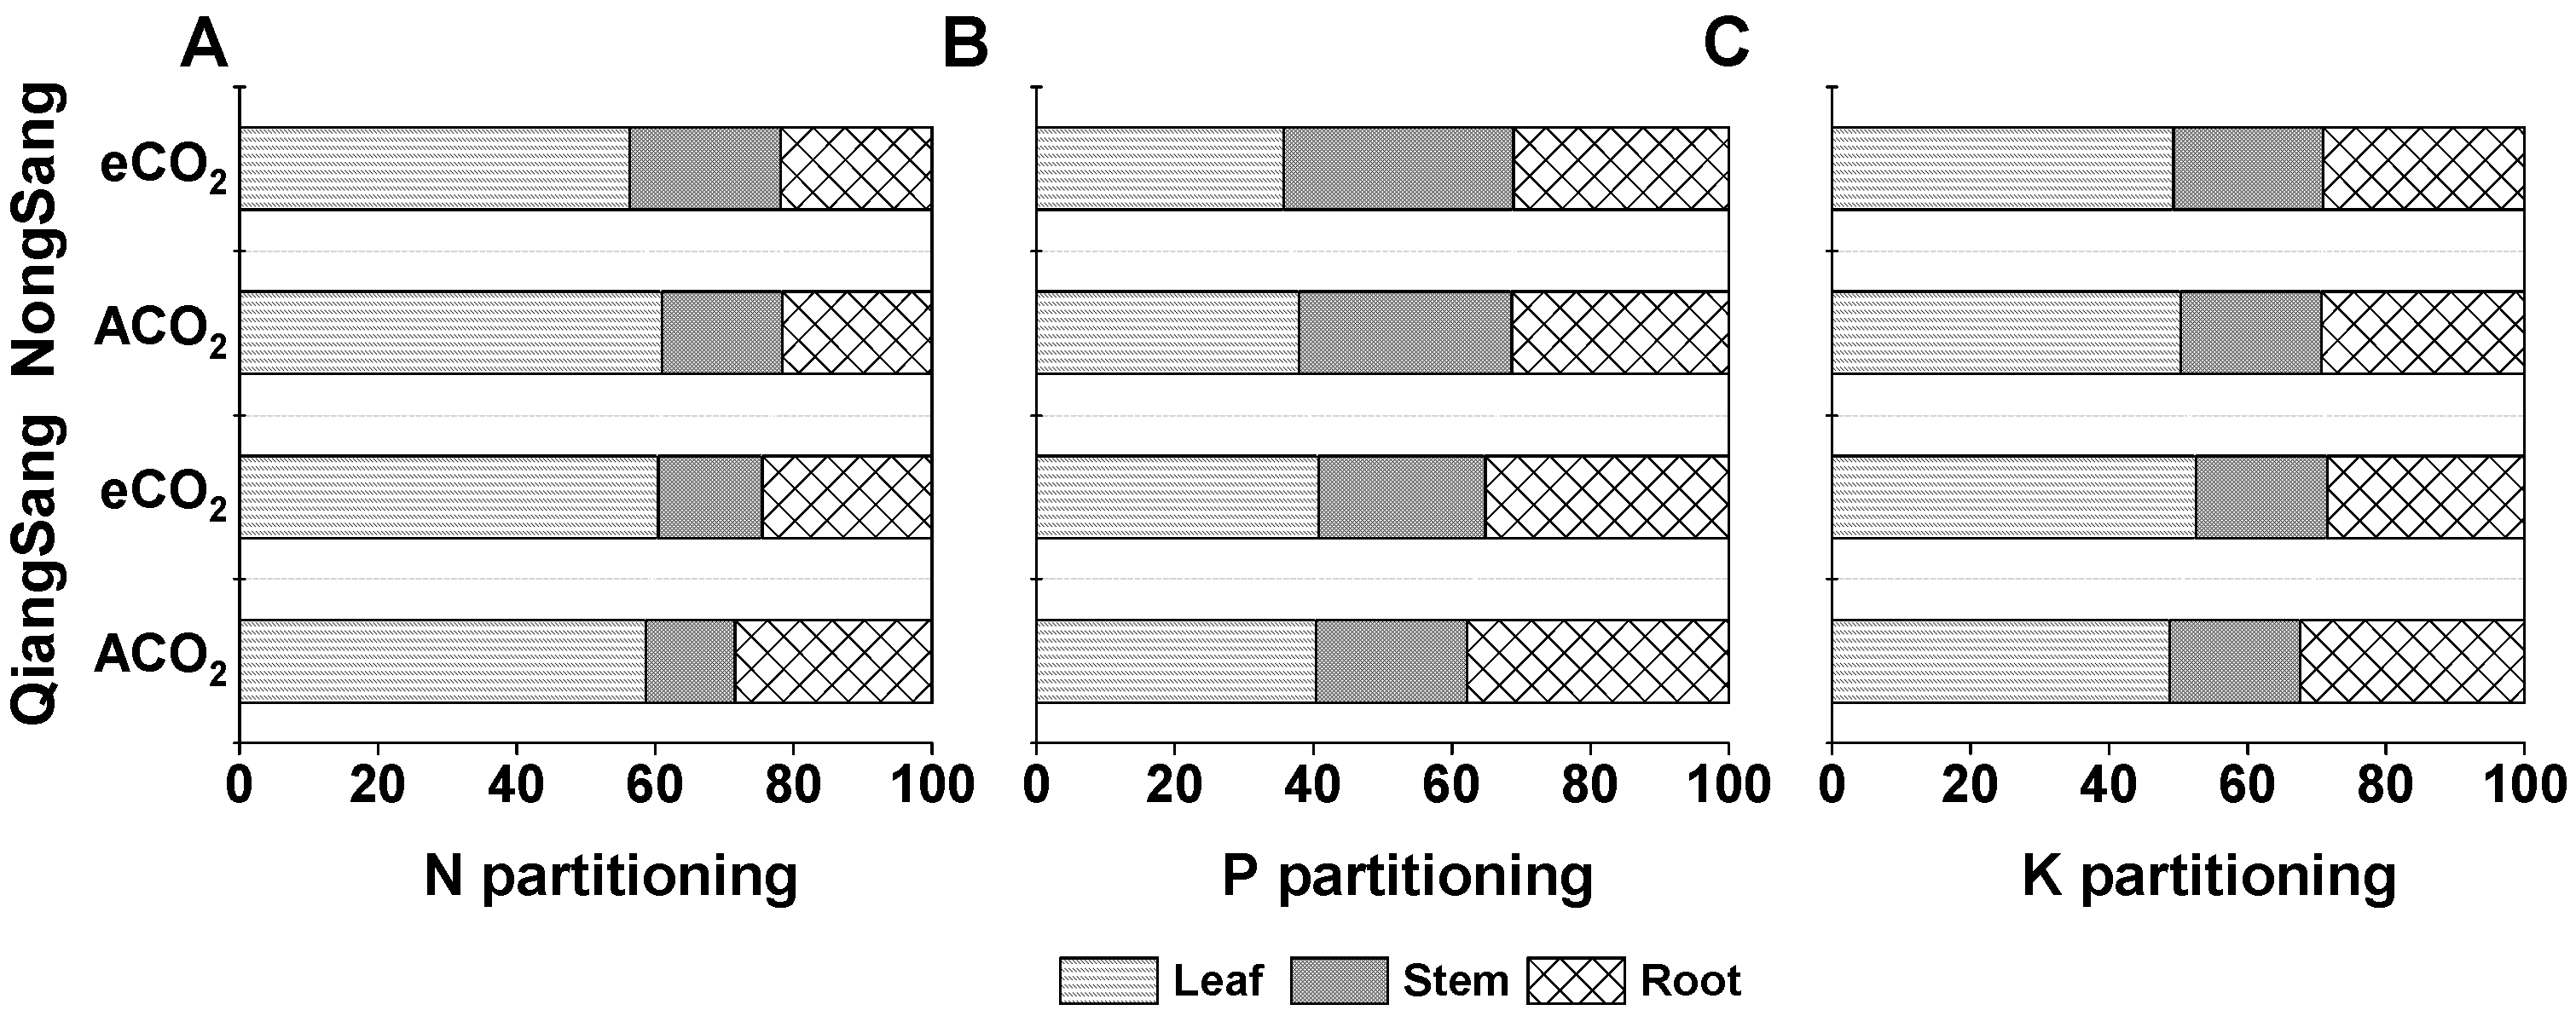
On the one hand, eCO2 significantly increased N and P partitioning into the stem in both mulberry varieties (p < 0.05, Figure 5A,B, Table 2), but had no effects on N, P and K partitioning among different plant tissues (p > 0.05, Figure 5, Table 2). On the other hand, QiangSang showed higher root N partitioning, leaf P and root P partitioning, whereas lower stem N and P partitioning, compared to NongSang (p < 0.05, Figure 5, Table 2). Although leaf N and K partitioning were not affected by neither CO2 nor variety, while a significant CO2 × variety interaction was observed (p < 0.05, Table 2).

3.6. Relationships between Physiological Parameters and Tissue Nutrient Concentrations

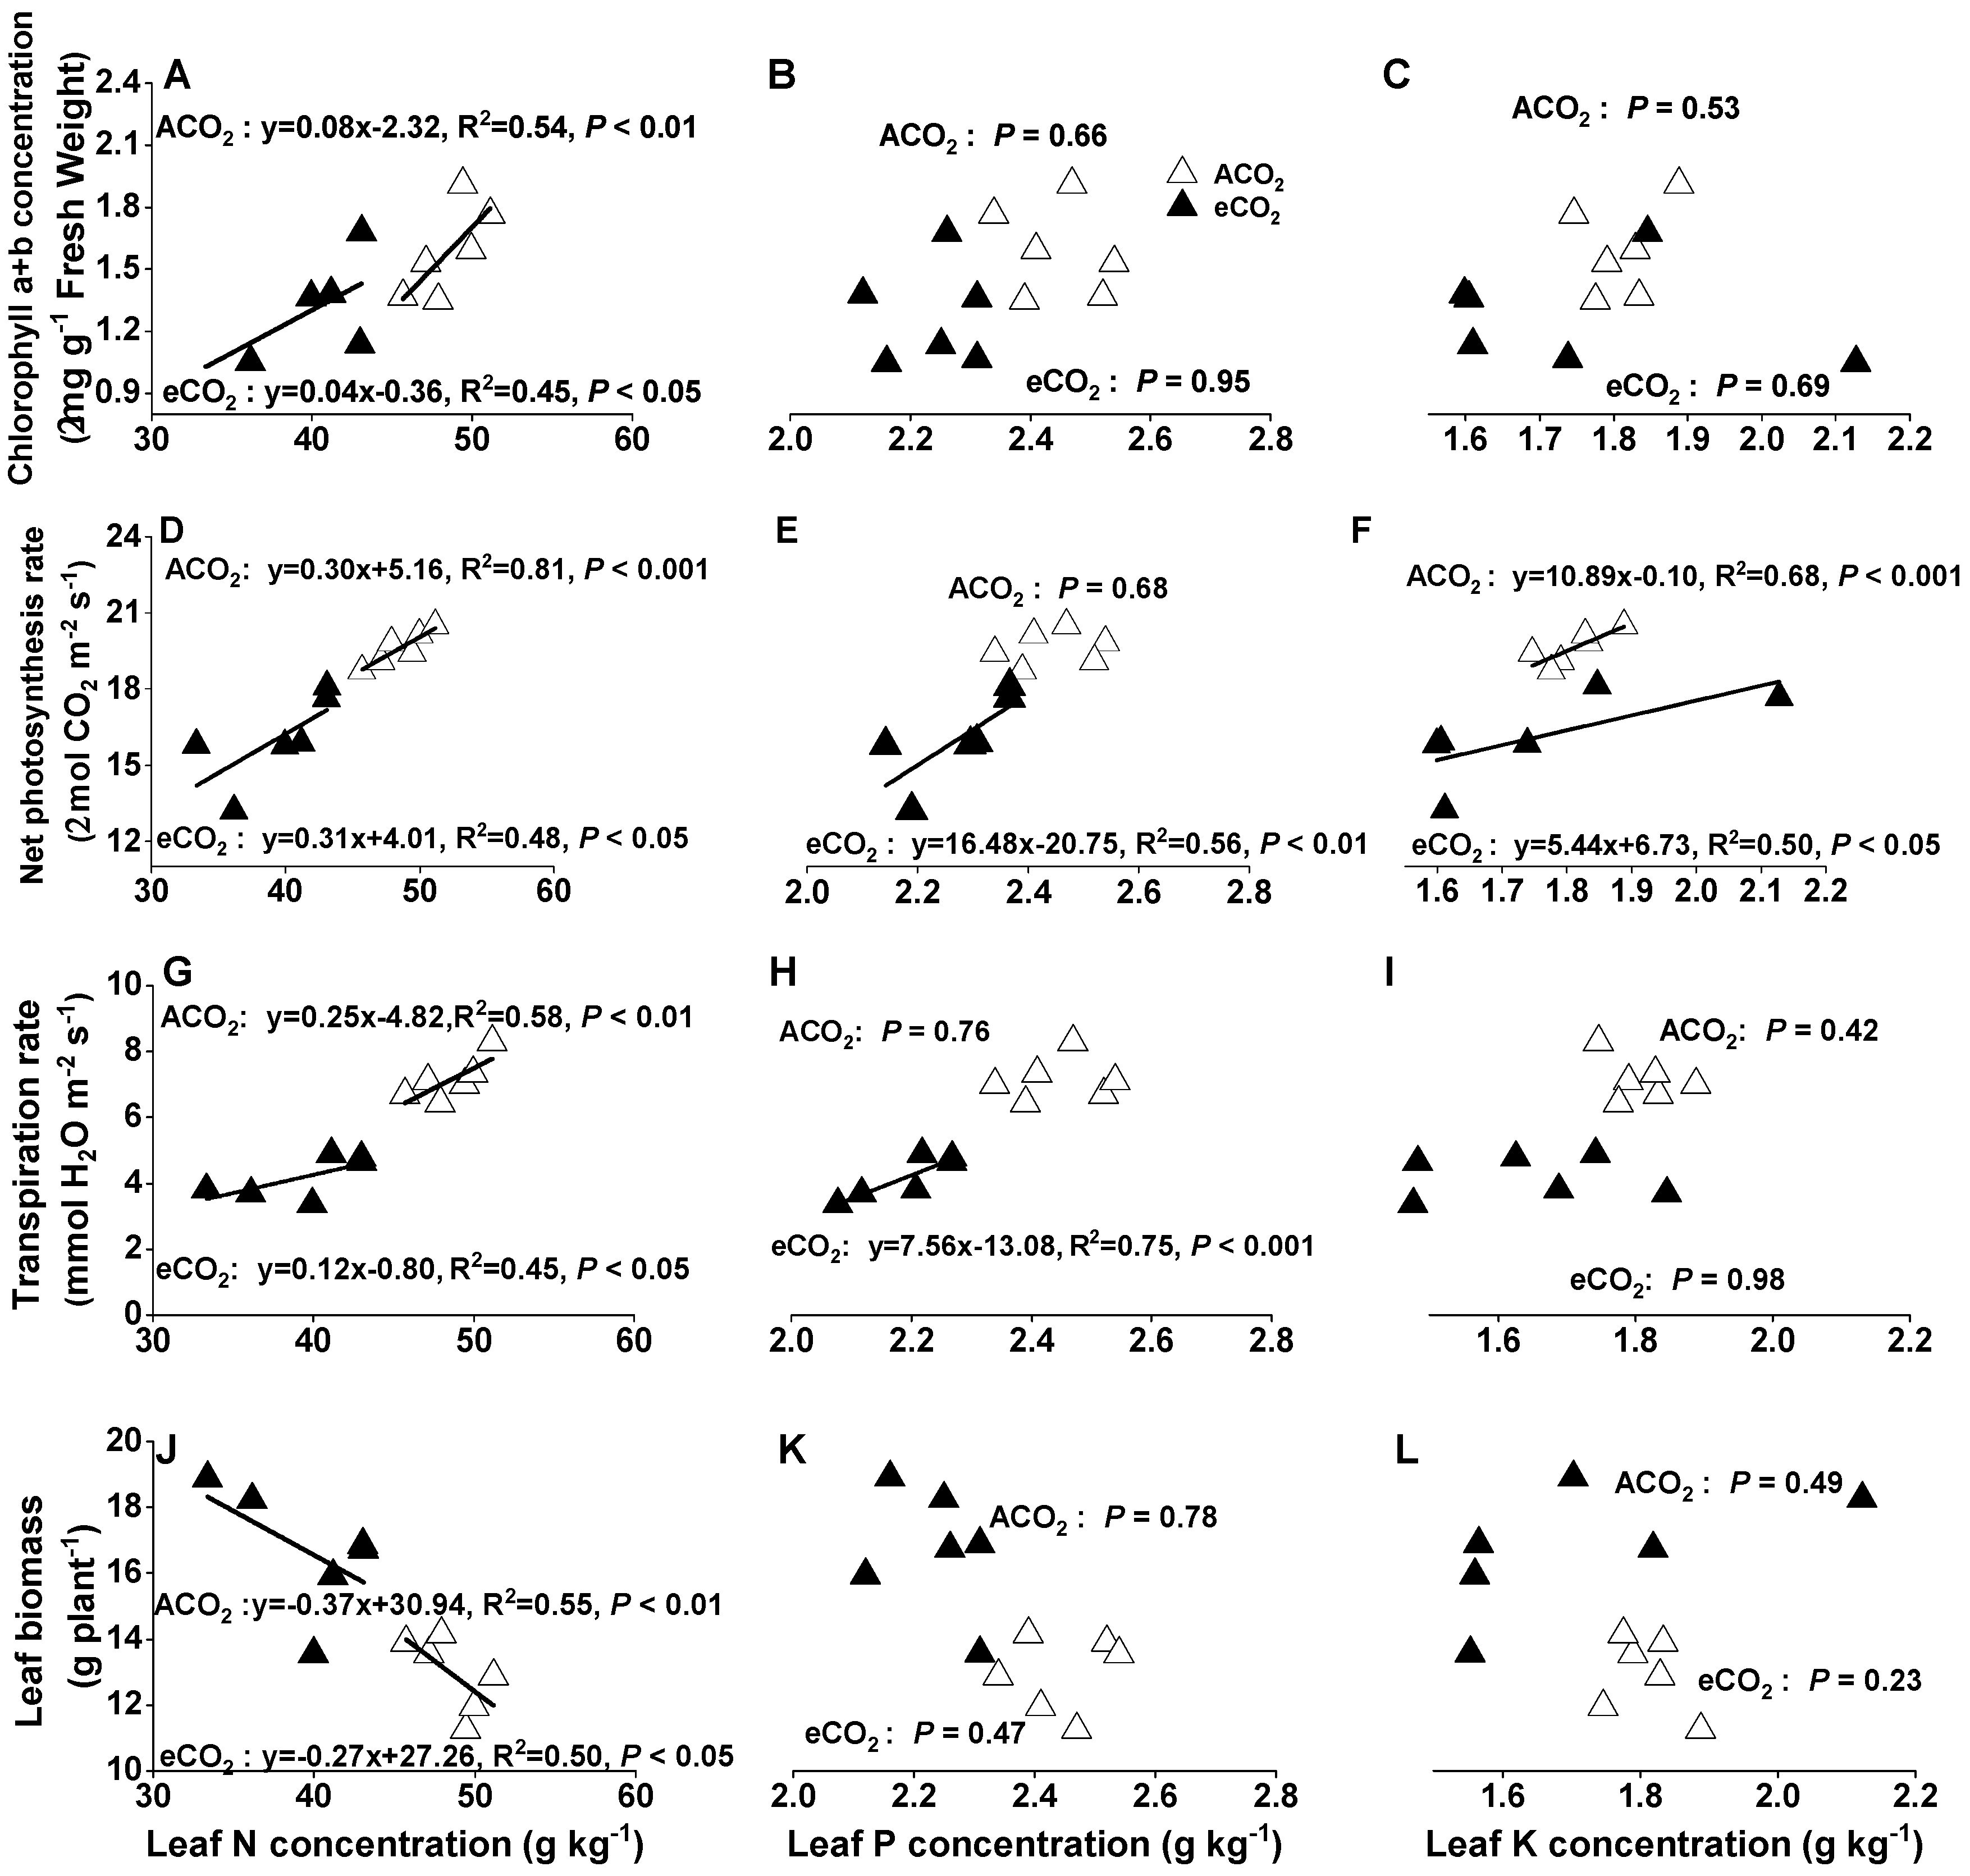
Chlorophyll a+b concentration, net photosynthetic rate and transpiration rate were significantly positively, while leaf biomass production was significantly negatively correlated to leaf N concentrations under both ACO2 and eCO2 (R2 = 0.45–0.81, p < 0.05, Figure 6A,D,G,J).
Significantly positively correlations were observed between net photosynthetic rate or transpiration rate and leaf P concentrations under eCO2 only (R2 = 0.56–0.75, p < 0.05, Figure 6E,H). Meanwhile, under both ACO2 and eCO2, only net photosynthetic rate was significantly positively correlated with leaf K concentration (R2 = 0.50–0.68, p < 0.05, Figure 6F). In contrast, no relationships under both ACO2 and eCO2 were observed between chlorophyll a+b or leaf biomass and leaf P (p = 0.47–0.95, Figure 6B,K), and between chlorophyll a+b, transpiration rate or leaf biomass and leaf K concentration (p = 0.23–0.98, Figure 6C,I,L).
In addition, significantly positive correlations under both ACO2 and eCO2 were observed between net photosynthetic rate and stomatal conductance (R2 = 0.48–0.82, p < 0.05, Figure 7A) or transpiration rate (R2 = 0.40–0.47, p < 0.05, Figure 7B), and between transpiration rate and stomatal conductance (R2 = 0.56, p < 0.01, Figure 7C).

4. Discussion

Stimulated plant growth and biomass production under eCO2 have been reported in a wide range of tree species [16,39,40,41]. Biomass accumulation is a complex process that is influenced by various morphological and biochemical adjustments. The increases in biomass due to higher plant height, branch number and leaf area were reported in Artemisia annua [42], Cajanus cajan [17] and Jatropha curcas [43] under 550 ppm eCO2. Similarly, our results showed that mulberry plants displayed morphological changes under 710/760 ppm eCO2, compared to 410/460 ppm ACO2 (Table 1). Both mulberry varieties had higher plant height, and more stem diameter and leaf number under 710/760 ppm eCO2, resulting in an enhanced shoot biomass production (Table 1, Figure S1C). Numerous studies on a variety of plant species have demonstrated that biomass production was generally enhanced under a range of eCO2 than under ACO2 [35,36,44,45]. Previous studies also showed that biomass production was increased by 39% and 44% in Morus alba var.Selection-13 and Kanva-2 under 550 ppm eCO2 for 90 days [33], and by 40% in Morus alba var. Gui-sang-you 62 under 710 ppm eCO2 for 120 days [35]. In the present study, plant biomass production of Morus multicauli var. QiangSang and NongSang were increased by 22% and 33% under 710/760 ppm eCO2 for 129 days, respectively (Table 1). Those results indicated that biomass production of mulberry in response to eCO2 varied with varieties. Such inconsistent responses to 550–710 ppm eCO2 between plant species or varieties were in agreement with previous studies [16,41,46]. For example, the magnitude in enhancing biomass production was greater in Tectona grandis than in Butea monosperma under 550 ppm eCO2, which attributed to a better nutrient use efficiency [39]. Besides, a lower transpiration rate and higher water use efficiency under eCO2 (Figure 1C,D) could be favorable for plant growth, due to a better water conservation in future eCO2 scenario [47]. Therefore, eCO2 may have a fertilizer effect, especially under favorable water and nutrient conditions.
The effect of eCO2 on plant biomass production largely occurs through increased photosynthetic rates [48], and the mechanisms of photosynthetic stimulation by eCO2 have been reported in many species, such as Artemisia annua [42], Camellia sinensis [49], cassava [50], grapevine [3] and Tabebuia rosea [51]. In mulberry, leaf photosynthetic rates were greatly increased by 27–32% by 550–800 ppm eCO2 [32,33,34]. This is because under ACO2, CO2 supply is often a limit to growth and eCO2 accelerates carboxylation processes. However, a down-regulation of leaf photosynthesis was also observed in pot experiments [21,52] or under field conditions [4]. The effect of eCO2 on growth and photosynthesis was variable throughout plant growth stage and/or time of CO2 exposure. For example, compared to Glycine max grown under ACO2, photosynthetic rates were higher after 8 weeks, while much lower after 12 weeks of exposure to 1,000 ppm eCO2 [53]. Carbon gain in rice under 695 ppm eCO2 was increased by 22–79% during the vegetative growth, but decreased to −12–+5% after grain-filling, leading to a 7–22% net increase for the whole season [54]. Net photosynthetic rate of Lycium barbarum displayed a downward trend at 90 and 120 days under 760 ppm eCO2 [55]. The positive effects of 600 ppm eCO2 on growth and chlorophyll content were greater in 20 days old than in 40 days old plants, but not on those in 41–65 days old mungbean plants [56]. Similarly, a down-regulation or decline of photosynthetic capacity and chlorophyll concentration for such photosynthetic acclimations was also evidenced for mulberry plants under 710 ppm eCO2 for 120 days (Figure 1A and Figure 2). The following mechanisms could explain these decreases in photosynthetic parameters under eCO2, as the limited pot space had most likely restricted both the growth and functioning of the root system, leading to a decrease of nutrient uptake and hence a decreased movement of photosynthates to roots. Soil nutrients might also not be sufficient for matching up with CO2 assimilation or photosynthesis to greater plant biomass production under eCO2. We observed that 18–22% and 7–10% of leaf N and P concentrations were decreased, and N and P partitioning into stems were increased in both mulberry varieties under eCO2 (Figure 5A,B). Greater positive relationships between net photosynthetic rate and leaf N concentration under ACO2 than under eCO2 (Figure 6D) confirmed that a photosynthetic down-regulation was due to reductions of resource availability [57]. Since RuBisco protein is determined by leaf N allocation [9], the fraction of N allocated to RuBisco would be decreased under eCO2 [21,54], leading to deficiencies in both amount and activity of Rubisco protein or surplus of C for synthesis of secondary compounds under eCO2 [58,59]. Moreover, significantly positively greater relationships between leaf N concentration and chlorophyll a+b, net photosynthesis rate or transpiration rate under 410/460 ppm CO2 than under 710/760 ppm eCO2 (Figure 6A,D,G), indicating that N limitation under eCO2 was the cause of photosynthetic acclimation, which was more pronounced in N-deficient plants [60]. Furthermore, eCO2 and low N supply decreased activities of some antioxidant enzymes and thus increased accumulation of reactive oxygen species [61,62]. These changes in oxidative stress could accelerate the degradation of chlorophyll (Figure 3) and eventually induce senescence [63], while eCO2-induced changes were mainly displayed as a general down-regulation of leaf carbohydrate metabolism [58,59]. Nevertheless, net assimilation rates measured at 350 or at 700 ppm CO2 were not significantly different, neither [60].
A reduction in mineral concentrations has been frequently reported in wood plants under 550–800 ppm eCO2 [14,18,64,65]. Similarly, the concentrations of N and P in both mulberry varieties were decreased under 710/760 ppm CO2 (Figure 3). A significantly negative linear correlation between leaf N concentration and leaf biomass production (R2 = 0.50–0.55, p < 0.05, Figure 6J) suggested that greater carbohydrate accumulation under eCO2 had diluted leaf nutrient concentrations. However, plant tissues with different metabolic pathways may exhibit different responses to eCO2. Meta-analysis showed that leaf N concentrations were reduced by 14%, which was higher than 9% of N decrease in roots [66]. In this present study, leaf and root N and P concentrations were decreased in both mulberry varieties, whereas stem N, P and K concentrations were not influenced by eCO2, indicating that stem as a support structure for plants had less sensitivity to eCO2. Therefore, it seems that the nutrient dilution effect may be plant tissue or organ dependent under eCO2. Bloom et al. [67] suggested that eCO2 inhibited NO3 assimilation into organic N-compounds in wheat and Arabidopsis, which plays a major role in the CO2 acclimation and decline of photosynthesis, so an inhibition of NO3 assimilation could be the explanation for the decrease of leaf N concentration in our study (Figure 3A,D,G). In addition, net photosynthetic rate was significantly positive correlated to transpiration rates and stomatal conductance (R2 = 0.40–0.72, p < 0.05, Figure 7A,B). The reduced stomatal conductance under eCO2 resulted in a decrease in transpiration rate (Figure 1B and Figure 7C), thus a declined transpiration-driven mass flow of nutrients from roots to leaves. In the present study, a significantly positive correlation between leaf N or P concentrations and transpiration rate under 710/760 ppm eCO2 (R2 = 0.45–0.75, p < 0.05, Figure 6G,H) did give such a piece of substantial evidence. Despite the fact that 700 or 790 ppm eCO2 decreased foliar K in Coffea [68] and Flindersia brayleyana [69], we found that leaf K concentration was not significant change in both mulberry varieties under 710/760 ppm eCO2 (Figure 3C), but the significantly positive correlation between net photosynthetic rate and leaf K concentration under eCO2 (R2 = 0.50, p < 0.05, Figure 6F) suggested that high level of leaf K might have accelerated the translocation of products of photosynthesis [70], and an increase of leaf K could alleviate photosynthetic acclimation [11,70].
We found that P and K accumulations in leaves, stems, roots and total plant were increased under 710/760 ppm eCO2 because of the corresponded biomass increase, while significant increases in N accumulation were only found in NongSang (Figure 4). These results suggested that mulberry would require more soil nutrients to maintain its constant growth under eCO2, so that nutrient dynamics in the soil-plant systems is most likely to be altered under a future climate change scenario. It had been proved that soil available N and P showed a decreasing trend under eCO2 [39], and an increasing N and P supply would alleviate or mitigate the photosynthetic acclimation [21,60]. Consequently, more fertilizers (especially N and P) would be necessary to minimize the adverse effect of future CO2 rising for a sustainable mulberry production.

5. Conclusions

eCO2 had contrasting effects on tissue N, P and K concentrations, but their total uptakes of both mulberry varieties were enhanced due to the stimulation of growth under 710/760 ppm eCO2. Photosynthesis in both mulberry varieties was co-limited by N and P, thus an external N and P application fertilizers is required to match up in parallel with a future increase of atmospheric CO2 levels for a sustainable enhancement of mulberry plantation.

Supplementary Materials

The following are available online at https://www.mdpi.com/article/10.3390/f12060660/s1, Figure S1: Overview of environmentally controlled growth chambers (A,B) and growth of two mulberry varieties.

Author Contributions

S.S., X.X. and X.H. conceived and designed the experiments. S.S., X.D., C.X. and Y.Q. performed the pots experiments, samples collection and experiment work. S.S. performed data analysis. S.S., X.X. and X.H. wrote and edited the manuscript. All authors have read and agreed to the published version of the manuscript.

Funding

This research was funded by National Natural Science Foundation of China (4111800096), Science and Technology Department of Sichuan Province (2018JZ0027), National Base of International S&T Collaboration on Water Environmental Monitoring and Simulation in the Three Gorges Reservoir Region, Biological Science Research Center at Southwest University (100030/2120054019) and Key Laboratory of Eco-environments of Three Gorges Reservoir Region, Ministry of Education, Chongqing 400716, China.

Conflicts of Interest

The authors declare no conflict of interest.

References

  1. IPCC. Climate Change 2014: Synthesis Report. Contribution of Working Groups I, II and III to the Fifth Assessment Report of the Intergovernmental Panel on Climate Change; IPCC: Geneva, Switzerland, 2014; p. 151. [Google Scholar]
  2. Ofori-Amanfo, K.K.; Klem, K.; Vesela, B.; Holub, P.; Agyei, T.; Marek, M.V.; Grace, J.; Urban, O. Interactive effect of elevated CO2 and reduced summer precipitation on photosynthesis is species-specific: The case study with soil-planted norway spruce and sessile oak in a mountainous forest plot. Forests 2021, 12, 14–29. [Google Scholar]
  3. Salazar-Parra, C.; Aranjuelo, I.; Pascual, I.; Erice, G.; Sanz-Sáez, Á.; Aguirreolea, J.; Sánchez-Díaz, M.; Irigoyen, J.J.; Araus, J.L.; Morales, F. Carbon balance, partitioning and photosynthetic acclimation in fruit-bearing grapevine (Vitis vinifera L. cv. Tempranillo) grown under simulated climate change (elevated CO2, elevated temperature and moderate drought) scenarios in temperature gradient greenhouses. J. Plant Physiol. 2015, 174, 97–109. [Google Scholar] [PubMed] [Green Version]
  4. Yuan, M.; Cai, C.; Wang, X.; Li, G.; Wu, G.; Wang, J.; Geng, W.; Liu, G.; Zhu, J.; Sun, Y. Warm air temperatures increase photosynthetic acclimation to elevated CO2 concentrations in rice under field conditions. Field Crop. Res. 2021, 262, 1–11. [Google Scholar] [CrossRef]
  5. Vicente, R.; Pérez, P.; Martínez-Carrasco, R.; Morcuende, R. Improved responses to elevated CO2 in durum wheat at a low nitrate supply associated with the upregulation of photosynthetic genes and the activation of nitrate assimilation. Plant Sci. 2017, 260, 119–128. [Google Scholar] [CrossRef]
  6. Ainsworth, E.; Long, S.P. What have we learned from 15 years of free-air CO2 enrichment (FACE)? A meta-analytic review of the responses of photosynthesis, canopy properties and plant production to rising CO2. New Phytol. 2005, 165, 351–372. [Google Scholar] [CrossRef]
  7. Ellsworth, D.S.; Reich, P.B.; Naumburg, E.S.; Koch, G.W.; Kubiske, M.E.; Smith, S.D. Photosynthesis, carboxylation and leaf nitrogen responses of 16 species to elevated pCO2 across four free-air CO2 enrichment experiments in forest, grassland and desert. Glob. Chang. Biol. 2004, 10, 2121–2138. [Google Scholar] [CrossRef] [Green Version]
  8. Nowak, R.S.; Ellsworth, D.S.; Smith, S.D. Functional responses of plants to elevated atmospheric CO2—Do photosynthetic and productivity data from FACE experiments support early predictions? New Phytol. 2010, 162, 253–280. [Google Scholar] [CrossRef] [Green Version]
  9. Makino, A.; Mae, T. Photosynthesis and plant growth at elevated levels of CO2. Plant Cell Physiol. 1999, 40, 999–1006. [Google Scholar] [CrossRef]
  10. Parvin, S.; Uddin, S.; Tausz-Posch, S.; Armstrong, R.; Tausz, M. Carbon sink strength of nodules but not other organs modulates photosynthesis of faba bean (Vicia faba) grown under elevated [CO2] and different water supply. New Phytol. 2020, 227, 132–145. [Google Scholar] [CrossRef]
  11. Dabu, X.; Li, S.; Cai, Z.; Ge, T.; Hai, M. The effect of potassium on photosynthetic acclimation in cucumber during CO2 enrichment. Photosynthetica 2019, 57, 640–645. [Google Scholar] [CrossRef] [Green Version]
  12. Halpern, M.; Bar-Tal, A.; Lugassi, N.; Egbaria, A.; Granot, D.; Yermiyahu, U. The role of nitrogen in photosynthetic acclimation to elevated [CO2] in tomatoes. Plant Soil 2019, 434, 397–411. [Google Scholar] [CrossRef]
  13. Tcherkez, G.; Ben-Mariem, S.; Larraya, L.; Garcia-Mina, J.M.; Zamarreno, A.M.; Paradela, A.; Cui, J.; Badeck, F.W.; Meza, D.; Rizza, F.; et al. Elevated CO2 has concurrent effects on leaf and grain metabolism but minimal effects on yield in wheat. J. Exp. Bot. 2020, 71, 5990–6003. [Google Scholar] [CrossRef] [PubMed]
  14. Nasto, M.K.; Winter, K.; Turner, B.L.; Cleveland, C.C. Nutrient acquisition strategies augment growth in tropical N2-fixing trees in nutrient-poor soil and under elevated CO2. Ecology 2019, 100, e02646. [Google Scholar] [CrossRef] [Green Version]
  15. Huang, W.; Zhou, G.; Liu, J.; Zhang, D.; Xu, Z.; Liu, S. Effects of elevated carbon dioxide and nitrogen addition on foliar stoichiometry of nitrogen and phosphorus of five tree species in subtropical model forest ecosystems. Environ. Pollut. 2012, 168, 113–120. [Google Scholar] [CrossRef] [PubMed]
  16. Thompson, J.B.; Slot, M.; Dalling, J.W.; Winter, K.; Turner, B.L.; Zalamea, P.C.; Ostertag, R. Species-specific effects of phosphorus addition on tropical tree seedling response to elevated CO2. Funct. Ecol. 2019, 33, 1871–1881. [Google Scholar] [CrossRef]
  17. Sreeharsha, R.V.; Sekhar, K.M.; Reddy, A.R. Delayed flowering is associated with lack of photosynthetic acclimation in Pigeon pea (Cajanus cajan L.) grown under elevated CO2. Plant Sci. 2015, 231, 82–93. [Google Scholar] [CrossRef]
  18. Wujeska-Klause, A.; Crous, K.Y.; Ghannoum, O.; Ellsworth, D.S. Lower photorespiration in elevated CO2 reduces leaf N concentrations in mature Eucalyptus trees in the field. Glob. Chang. Biol. 2019, 25, 1–14. [Google Scholar] [CrossRef]
  19. Ellsworth, D.S.; Anderson, I.C.; Crous, K.Y.; Cooke, J.; Drake, J.E.; Gherlenda, A.N.; Gimeno, T.E.; Macdonald, C.A.; Medlyn, B.E.; Powell, J.R.; et al. Elevated CO2 does not increase eucalypt forest productivity on a low-phosphorus soil. Nat. Clim. Chang. 2017, 7, 279–282. [Google Scholar] [CrossRef] [Green Version]
  20. Li, J.; Dang, Q.-L.; Man, R.; Marfo, J. Elevated CO2 alters N-growth relationship in spruce and causes unequal increases in N, P and K demands. For. Ecol. Manag. 2013, 298, 19–26. [Google Scholar] [CrossRef]
  21. Tissue, D.T.; Lewis, J.D. Photosynthetic responses of cottonwood seedlings grown in glacial through future atmospheric [CO2] vary with phosphorus supply. Tree Physiol. 2010, 30, 1361–1372. [Google Scholar] [CrossRef] [Green Version]
  22. Park, H.J.; Lim, S.S.; Yang, H.I.; Lee, K.S.; Kwak, J.H.; Park, S.I.; Kim, H.Y.; Lee, S.M.; Choi, W.J. Nitrogen effects on quantity, chemistry, and decomposability of Pinus densiflora and Quercus variabilis litters under elevated CO2 and warming. For. Ecol. Manag. 2020, 473, 1–14. [Google Scholar] [CrossRef]
  23. Zhuang, M.; Li, Y.; Guo, Z.; Li, Y.; Pan, W.; Chen, S. Elevated CO2 and O3 levels influence the uptake and leaf concentration of mineral N, P, K in Phyllostachys edulis (Carrière) J.Houz. and Oligostachyum lubricum (wen) King f. Forests 2018, 9, 195. [Google Scholar] [CrossRef] [Green Version]
  24. Shinano, T.; Yamamoto, T.; Tawaraya, K.; Tadokoro, M.; Koike, T.; Osaki, M. Effects of elevated atmospheric CO2 concentration on the nutrient uptake characteristics of Japanese larch (Larix kaempferi). Tree Physiol. 2007, 27, 97–104. [Google Scholar] [CrossRef]
  25. Özgen, M.; Serçe, S.; Kaya, C. Phytochemical and antioxidant properties of anthocyanin-rich Morus nigra and Morus rubra fruits. Sci. Hortic. 2009, 119, 275–279. [Google Scholar] [CrossRef]
  26. Lu, C.; Ji, F.D.; Zhu, F.R.; Zhao, A.C.; Luo, G.Q.; Su, C. Mulberry cultivation varieties in China. Chongqing Southwest Norm. Univ. 2017, 3–11. (In Chinese) [Google Scholar]
  27. Butt, M.S.; Nazir, A.; Sultan, M.T.; Schroën, K. Morus alba L. nature’s functional tonic. Trends Food Sci. Technol. 2008, 19, 505–512. [Google Scholar] [CrossRef]
  28. Papanastasis, V.P.; Yiakoulaki, M.D.; Decandia, M.; Dini-Papanastasi, O. Integrating woody species into livestock feeding in the Mediterranean areas of Europe. Anim. Feed Sci. Technol. 2008, 140, 1–17. [Google Scholar] [CrossRef]
  29. Lee, J.; Chae, K.; Ha, J.; Park, B.Y.; Lee, H.S.; Jeong, S.; Kim, M.Y.; Yoon, M. Regulation of obesity and lipid disorders by herbal extracts from Morus alba, Melissa officinalis, and Artemisia capillaris in high-fat diet-induced obese mice. J. Ethnopharmacol. 2008, 115, 263–270. [Google Scholar] [CrossRef]
  30. Singab, A.N.B.; El-Beshbishy, H.A.; Yonekawa, M.; Nomura, T.; Fukai, T. Hypoglycemic effect of Egyptian Morus alba root bark extract: Effect on diabetes and lipid peroxidation of streptozotocin-induced diabetic rats. J. Ethnopharmacol. 2005, 100, 333–338. [Google Scholar] [CrossRef]
  31. Sivaci, A.; Sökmen, M. Seasonal changes in antioxidant activity, total phenolic and anthocyanin constituent of the stems of two Morus species (Morus alba L. and Morus nigra L.). Plant Growth Regul. 2004, 44, 251–256. [Google Scholar] [CrossRef]
  32. Sekhar, K.M.; Sreeharsha, R.V.; Mudalkar, S.; Reddy, A.R. Persistent stimulation of photosynthesis in short rotation coppice mulberry under elevated CO2 atmosphere. J. Photoch. Photobiol. B 2014, 137, 21–30. [Google Scholar] [CrossRef] [PubMed]
  33. Sekhar, K.M.; Sreeharsha, R.V.; Reddy, A.R. Differential responses in photosynthesis, growth and biomass yields in two mulberry genotypes grown under elevated CO2 atmosphere. J. Photoch. Photobiol. B 2015, 151, 172–179. [Google Scholar] [CrossRef] [PubMed]
  34. Liu, X.; Zhang, H.; Wang, J.; Wu, X.; Ma, S.; Xu, Z.; Zhou, T.; Xu, N.; Tang, X.; An, B. Increased CO2 concentrations increasing water use efficiency and improvement PSII function of mulberry seedling leaves under drought stress. J. Plant Interact. 2019, 14, 213–223. [Google Scholar] [CrossRef] [Green Version]
  35. Shi, S.; Qiu, Y.; Wen, M.; Xu, X.; Dong, X.; Xu, C.; He, X. Daytime, not nighttime, elevated atmospheric carbon dioxide exposure improves plant growth and leaf quality of mulberry (Morus alba L.) seedlings. Front. Plant Sci. 2021, 11, 609031. [Google Scholar] [CrossRef] [PubMed]
  36. Shi, S.; Luo, X.; Dong, X.; Qiu, Y.; Xu, C.; He, X. Arbuscular mycorrhization enhances nitrogen, phosphorus and potassium accumulation in Vicia faba by modulating soil nutrient balance under elevated CO2. J. Fungi 2021, 7, 361–377. [Google Scholar] [CrossRef]
  37. Li, H.S. The Experiment Principle and Technique on Plant Physiology and Biochemistry; Higher Education Press: Beijing, China, 2000; pp. 78–102. (In Chinese) [Google Scholar]
  38. Yang, J.H.; Wang, C.L.; Dai, H.L. Soil Agrochemical Analysis and Environmental Monitoring Techniques; Chinese Dadi Press: Beijing, China, 2008; pp. 18–64. (In Chinese) [Google Scholar]
  39. Singh, A.K.; Rai, A.; Kushwaha, M.; Chauhan, P.S.; Pandey, V.; Singh, N. Tree growth rate regulate the influence of elevated CO2 on soil biochemical responses under tropical condition. J. Environ. Manag. 2019, 231, 1211–1221. [Google Scholar] [CrossRef] [PubMed]
  40. Li, L.; Wang, M.; Pokharel, S.S.; Li, C.; Parajulee, M.N.; Chen, F.; Fang, W. Effects of elevated CO2 on foliar soluble nutrients and functional components of tea, and population dynamics of tea aphid, Toxoptera aurantii. Plant Physiol. Biochem. 2019, 145, 84–94. [Google Scholar] [CrossRef]
  41. Dawes, M.A.; Hättenschwiler, S.; Bebi, P.; Hagedorn, F.; Handa, I.T.; Körner, C.; Rixen, C. Species-specific tree growth responses to 9 years of CO2 enrichment at the alpine treeline. J. Ecol. 2011, 99, 383–394. [Google Scholar] [CrossRef]
  42. Zhu, C.; Zeng, Q.; Yu, H.; Liu, S.; Dong, G.; Zhu, J. Effect of elevated CO2 on the growth and macronutrient (N, P and K) uptake of annual wormwood (Artemisia annua L.). Pedosphere 2016, 26, 235–242. [Google Scholar] [CrossRef]
  43. Kumar, S.; Chaitanya, B.S.K.; Ghatty, S.; Reddy, A.R. Growth, reproductive phenology and yield responses of a potential biofuel plant, Jatropha curcas grown under projected 2050 levels of elevated CO2. Physiol. Plant. 2014, 152, 501–519. [Google Scholar] [CrossRef]
  44. Xu, Z.; Jiang, Y.; Zhou, G. Response and adaptation of photosynthesis, respiration, and antioxidant systems to elevated CO2 with environmental stress in plants. Front. Plant Sci. 2015, 6, 701. [Google Scholar] [CrossRef] [PubMed] [Green Version]
  45. Reich, P.B.; Hobbie, S.E.; Lee, T.D.; Pastore, M.A. Unexpected reversal of C3 versus C4 grass response to elevated CO2 during a 20-year field experiment. Science 2018, 360, 317–320. [Google Scholar] [CrossRef] [PubMed] [Green Version]
  46. Poorter, H.; Navas, M.L. Plant growth and competition at elevated CO2 on winners, losers and functional groups. New Phytol. 2003, 157, 175–198. [Google Scholar] [CrossRef] [PubMed] [Green Version]
  47. Ainsworth, E.A.; Rogers, A. The response of photosynthesis and stomatal conductance to rising [CO2]: Mechanisms and environmental interactions. Plant Cell Environ. 2007, 30, 258–270. [Google Scholar] [CrossRef]
  48. Wang, S.H.; Zhang, Y.G.; Ju, W.M.; Chen, J.M.; Ciais, P.; Cescatti, A.; Sardans, J.; Janssens, I.A.; Wu, M.S.; Berry, J.A.; et al. Recent global decline of CO2 fertilization effects on vegetation photosynthesis. Science 2020, 370, 1295–1300. [Google Scholar] [CrossRef]
  49. Li, X.; Zhang, L.; Ahammed, G.J.; Li, Z.X.; Wei, J.P.; Shen, C.; Yan, P.; Zhang, L.P.; Han, W.Y. Stimulation in primary and secondary metabolism by elevated carbon dioxide alters green tea quality in Camellia sinensis L. Sci. Rep. 2017, 7, 7937. [Google Scholar] [CrossRef]
  50. Ruiz-Vera, U.M.; Souza, A.; Ament, M.R.; Gleadow, R.M.; Ort, D.R. High sink-strength prevents photosynthetic down-regulation in cassava grown at elevated CO2 concentration. J. Exp. Bot. 2021, 72, 542–560. [Google Scholar] [CrossRef]
  51. Slot, M.; Rifai, S.W.; Winter, K. Photosynthetic plasticity of a tropical tree species, Tabebuia rosea, in response to elevated temperature and [CO2]. Plant Cell Environ. 2021, 44. [Google Scholar] [CrossRef]
  52. Goicoechea, N.; Baslam, M.; Erice, G.; Irigoyen, J.J. Increased photosynthetic acclimation in alfalfa associated with arbuscular mycorrhizal fungi (AMF) and cultivated in greenhouse under elevated CO2. J. Plant Physiol. 2014, 171, 1774–1781. [Google Scholar] [CrossRef]
  53. Griffin, K.; Sims, D.; Seemann, J. Altered night-time CO2 concentration affects the growth, physiology and biochemistry of soybean. Plant Cell Environ. 1999, 22, 91–99. [Google Scholar] [CrossRef]
  54. Sakai, H.; Hasegawa, T.; Kobayashi, K. Enhancement of rice canopy carbon gain by elevated CO2 is sensitive to growth stage and leaf nitrogen concentration. New Phytologist. 2006, 170, 321–332. [Google Scholar] [CrossRef] [PubMed]
  55. Ma, Y.P.; Xie, Y.; Ha, R.; Cao, B.; Song, L.H. Effects of elevated CO2 on photosynthetic accumulation, sucrose metabolism-related enzymes, and genes identification in Goji Berry (Lycium barbarum L.). Front. Plant Sci. 2021, 12, 643555. [Google Scholar] [CrossRef] [PubMed]
  56. Das, M.; Zaidi, P.H.; Pal, M.; Sengupta, U.K. Stage sensitivity of mungbean (Vigna radiata L. Wilczek) to an elevated level of carbon dioxide. J. Agron. Crop Sci. 2002, 188, 219–224. [Google Scholar] [CrossRef]
  57. Niinemets, Ü.J.D.; Tenhunen, N.R.; Canta, M.M.; Chavis, T.F.; Pereira, J.S.; Reynolds, J.F. Interactive effects of nitrogen and phosphorus on the acclimation potential of foliage photosynthetic properties of cork oak, Quercus suber, to elevated atmospheric CO2 concentrations. Glob. Chang. Biol. 2010, 5, 455–470. [Google Scholar] [CrossRef]
  58. Kontunen-Soppela, S.; Parviainen, J.; Ruhanen, H.; Brosche, M.; Keinänen, M.; Thakur, R.C.; Kolehmainen, M.; Kangasjärvi, J.; Oksanen, E.; Karnosky, D.F. Gene expression responses of paper birch (Betula papyrifera) to elevated CO2 and O3 during leaf maturation and senescence. Environ. Pollut. 2010, 158, 959–968. [Google Scholar] [CrossRef] [PubMed]
  59. Kontunen-Soppela, S.; Riikonen, J.; Ruhanen, H.; Brosche, M.; Somervuo, P.; Peltonen, P.; Kangasjärvi, J.; Auvinen, P.; Paulin, L.; Keinänen, M.; et al. Differential gene expression in senescing leaves of two silver birch genotypes in response to elevated CO2 and tropospheric ozone. Plant Cell Environ. 2010, 33, 1016–1028. [Google Scholar] [CrossRef]
  60. Del Pozo, A.; Pérez, P.; Gutiérrez, D.; Alonso, A.; Morcuende, R.; Martínez-Carrasco, R. Gas exchange acclimation to elevated CO2 in upper-sunlit and lower-shaded canopy leaves in relation to nitrogen acquisition and partitioning in wheat grown in field chambers. Environ. Exp. Bot. 2007, 59, 371–380. [Google Scholar] [CrossRef]
  61. Gillespie, K.M.; Rogers, A.; Ainsworth, E.A. Growth at elevated ozone or elevated carbon dioxide concentration alters antioxidant capacity and response to acute oxidative stress in soybean (Glycine max). J. Exp. Bot. 2011, 62, 2667–2678. [Google Scholar] [CrossRef]
  62. Agüera, E.; Haba, P.D. Leaf senescence in response to elevated atmospheric CO2 concentration and low nitrogen supply. Biol. Plant. 2018, 62, 1–8. [Google Scholar] [CrossRef]
  63. Geissler, N.; Hussin, S.; Koyro, H.W. Elevated atmospheric CO2 concentration ameliorates effects of NaCl salinity on photosynthesis and leaf structure of Aster tripolium L. J. Exp. Bot. 2009, 60, 137–151. [Google Scholar] [CrossRef] [Green Version]
  64. Watanabe, M.; Watanabe, Y.; Kitaoka, S.; Utsugi, H.; Kita, K.; Koike, T. Growth and photosynthetic traits of hybrid larch F1 (Larix gmelinii var. japonica × L. kaempferi) under elevated CO2 concentration with low nutrient availability. Tree Physiol. 2011, 31, 965–975. [Google Scholar]
  65. Li, L.; Manning, W.; Wang, X. Elevated CO2 increases root mass and leaf nitrogen resorption in Red Maple (Acer rubrum L.). Forests 2019, 10, 420. [Google Scholar] [CrossRef] [Green Version]
  66. Cotrufo, M.F.; Ineson, P.; Scott, A. Elevated CO2 reduces the nitrogen concentration of plant tissues. Glob. Chang. Biol. 1998, 4, 43–54. [Google Scholar] [CrossRef]
  67. Bloom, A.J.; Burger, M.; Asensio, J.S.R.; Cousins, A.B. Carbon dioxide enrichment inhibits nitrate assimilation in wheat and Arabidopsis. Science 2010, 328, 899–903. [Google Scholar] [CrossRef] [PubMed] [Green Version]
  68. Martins, L.D.; Tomaz, M.A.; Lidon, F.C.; DaMatta, F.M.; Ramalho, J.C. Combined effects of elevated [CO2] and high temperature on leaf mineral balance in Coffea spp. plants. Clim. Chang. 2014, 126, 365–379. [Google Scholar] [CrossRef]
  69. Kanowski, J. Effects of elevated CO2 on the foliar chemistry of seedlings of two rainforest trees from north-east Australia implications for folivorous marsupials. Austral. Ecol. 2001, 26, 165–172. [Google Scholar] [CrossRef]
  70. Conti, T.R.; Geiger, D.R. Potassium nutrition and translocation in sugar beet. Plant Physiol. 1982, 70, 168–172. [Google Scholar] [CrossRef] [PubMed]
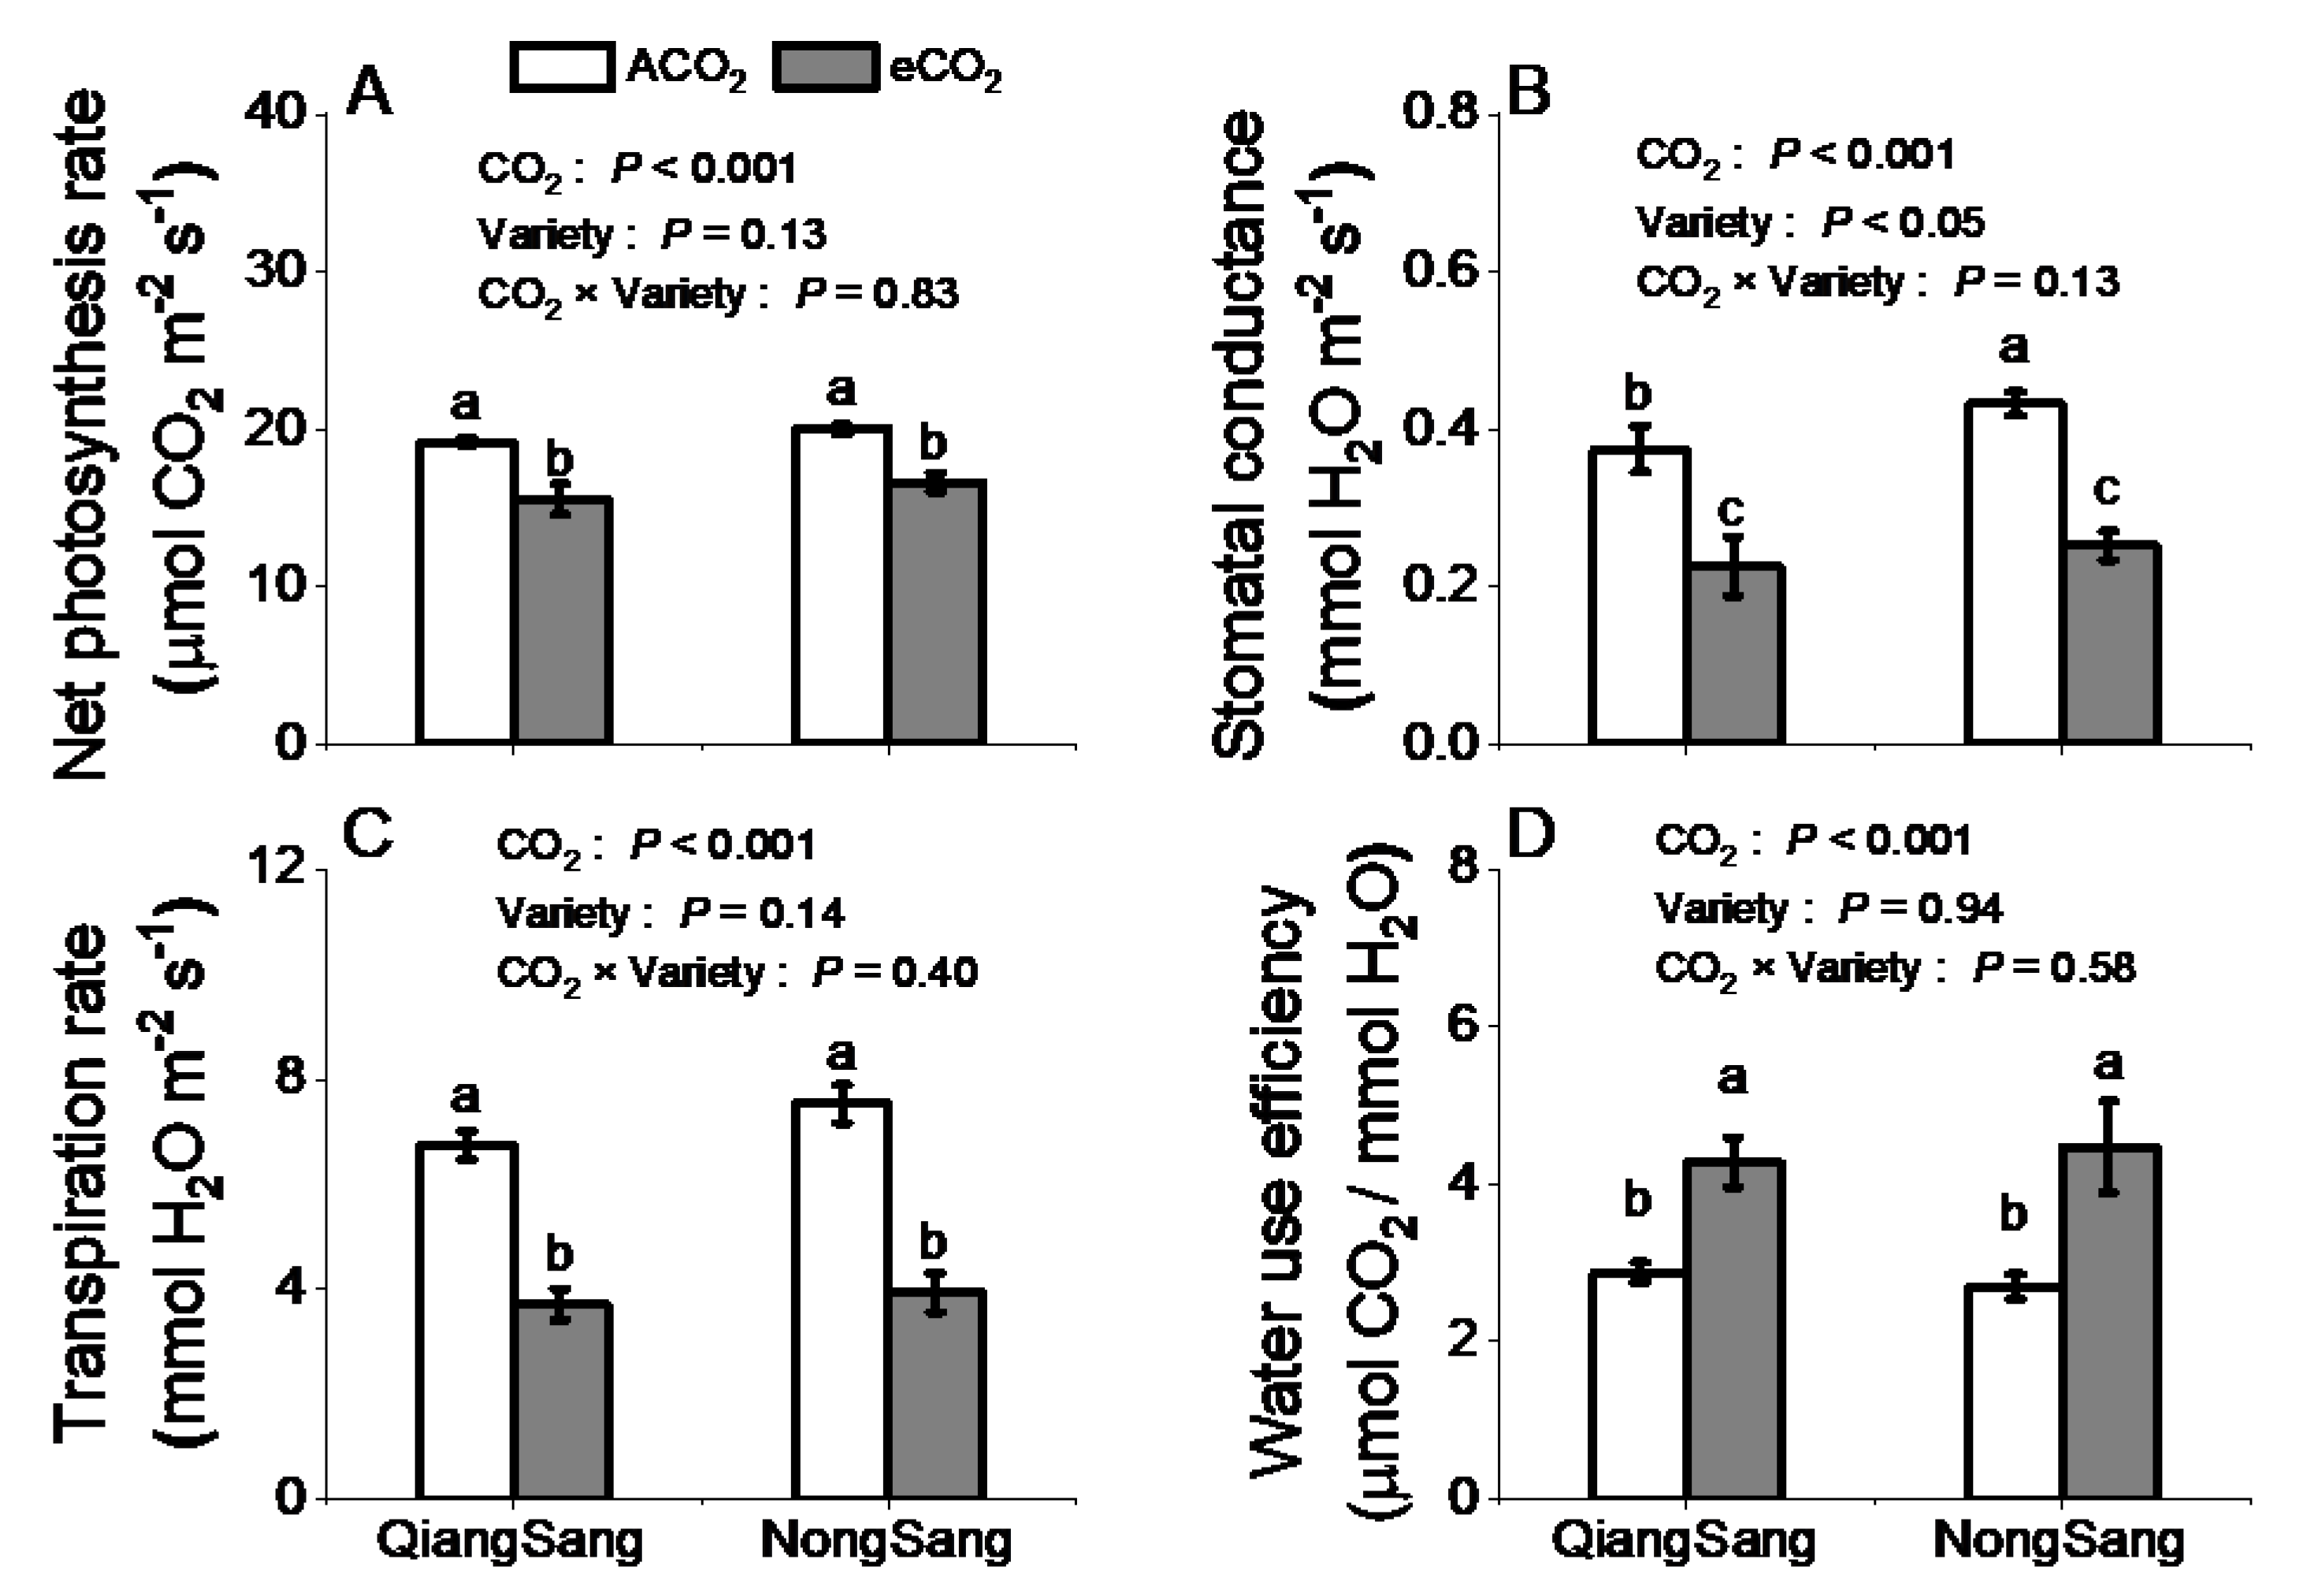
Figure 1. Gas exchange characteristics of two mulberry varieties (Morus multicaulis Perr. var. QiangSang and NongSang) grown under ambient CO2 (ACO2, 410/460 ppm, daytime/nighttime) and elevated CO2 (eCO2, 710/760 ppm) levels: (A) net photosynthetic rate; (B) stomatal conductance; (C) transpiration rate; and (D) water use efficiency. Data (means ± SE, n = 3) followed by different letters indicate significant differences (p < 0.05) as revealed by Tukey’s test. Statistical comparisons (two-way ANOVA) between varieties and CO2 treatments as well as their interaction (CO2 × variety) are presented for each variable.
Forests 12 00660 g001
Figure 2. Concentrations of leaf chlorophyll a (A), chlorophyll b (B) and chlorophyll a+b (C) in two mulberry varieties (Morus multicaulis Perr. var. QiangSang and NongSang) grown under ambient CO2 (ACO2, 410/460 ppm, daytime/nighttime) and elevated CO2 (eCO2, 710/760 ppm) levels. Data (means ± SE, n = 3) followed by different letters indicate significant differences (p < 0.05) as revealed by Tukey’s test. Statistical comparisons (two-way ANOVA) between varieties and CO2 treatments as well as their interaction (CO2 × variety) are presented for each variable.
Forests 12 00660 g002
Figure 3. Concentrations of nitrogen (A,D,G), phosphorus (B,E,H) and potassium (C,F,I) in leaves, stems and roots of two mulberry varieties (Morus multicaulis Perr. var. QiangSang and NongSang) grown under ambient CO2 (ACO2, 410/460 ppm, daytime/nighttime) and elevated CO2 (eCO2, 710/760 ppm) levels. Data (means ± SE, n = 3) followed by different letters indicate significant differences (p < 0.05) as revealed by Tukey’s test. Statistical comparisons (two-way ANOVA) between varieties and CO2 treatments as well as their interaction (CO2 × variety) are presented for each variable.
Forests 12 00660 g003
Figure 4. Accumulation of nitrogen (N: AD), phosphorus (P: EH) and potassium (K: IL) in leaves, stems, roots and total plants of two mulberry varieties (Morus multicaulis Perr. var. QiangSang and NongSang) grown under ambient CO2 (ACO2, 410/460 ppm, daytime/nighttime) and elevated CO2 (eCO2, 710/760 ppm) levels. Data (means ± SE, n = 3) followed by different letters indicate significant differences (p < 0.05) as revealed by Tukey’s test. Statistical comparisons (two-way ANOVA) between varieties and CO2 treatments as well as their interaction (CO2 × variety) are presented for each variable.
Forests 12 00660 g004
Figure 5. Leaf, stem and root nitrogen (N), (A), phosphorus (P), (B) and potassium (K), (C) partitioning in two mulberry varieties (Morus multicaulis Perr. var. QiangSang and NongSang) grown under ambient CO2 (ACO2, 410/460 ppm, daytime/nighttime) and elevated CO2 (eCO2, 710/760 ppm) levels.
Forests 12 00660 g005
Figure 6. Relationships between chlorophyll a+b concentration and leaf nitrogen (N), phosphorus (P) and potassium (K) concentrations (AC); net photosynthetic rate and leaf N, P and K concentrations (DF); transpiration rate and leaf N, P and K concentrations (GI); leaf biomass and leaf N, P and K concentrations (JL). Linear regressions were fitted to data for two mulberry varieties (Morus multicaulis Perr. var. QiangSang and NongSang) grown under ambient CO2 (ACO2, 410/460 ppm, daytime/nighttime) and elevated CO2 (eCO2, 710/760 ppm) levels. Open triangles and closed triangles represent data under ACO2 and eCO2, respectively.
Forests 12 00660 g006
Figure 7. Relationships between net photosynthetic rate and stomatal conductance (A), and transpiration rate (B); transpiration rate and stomatal conductance (C).Linear regressions were fitted to data for two mulberry varieties (Morus multicaulis Perr. var. QiangSang and NongSang) grown under ambient CO2 (ACO2, 410/460 ppm, daytime/nighttime) and elevated CO2 (eCO2, 710/760 ppm) levels. Open triangles and closed triangles represent data under ACO2 and eCO2, respectively.
Forests 12 00660 g007
Table 1. Plant growth parameters of two mulberry varieties (Morus multicaulis Perr. var. QiangSang and NongSang) grown under ambient CO2 (ACO2, 410/460 ppm, daytime/nighttime) and elevated CO2 (eCO2, 710/760 ppm) levels. Data (means ± SE, n = 3) followed by different letters indicate significant differences (p < 0.05) as revealed by Tukey’s test. ANOVA: ns, not significant; *, ** and *** significant at p ≤ 0.05, p ≤ 0.01 and p ≤ 0.001, respectively.
VariableCO2 (ppm)Plant Height (cm)Stem Diameter (mm)Leaf Number (plant−1)Leaf Biomass (g plant−1)Stem Biomass (g plant−1)Root Biomass (g plant−1)Total Biomass (g plant−1)
QiangSang410/46038.83 ± 0.83 c6.05 ± 0.09 b18.83 ± 0.44 b13.87 ± 0.17 c7.85 ± 0.29 c14.19 ± 0.61 a35.91 ± 1.02 b
710/76042.17 ± 1.69 b6.70 ± 0.17 a23.17 ± 1.09 a18.02 ± 0.59 a10.27 ± 0.60 b15.68 ± 0.68 a43.97 ± 1.61 a
NongSang410/46042.25 ± 0.88 b6.21 ± 0.34 b16.25 ± 0.66 c12.03 ± 0.47d9.59 ± 0.11 b10.64 ± 0.73 b32.26 ± 1.08 b
710/76049.33 ± 1.76 a6.94 ± 0.17 a18.58 ± 0.71 b15.09 ± 0.92 b12.75 ± 0.55 a15.11 ± 0.75 a42.95 ± 1.54 a
ANOVA
CO2 ****************
Variety **ns********ns
CO2×variety nsnsnsnsnsnsns
Table 2. Results of two-way ANOVA for the main effects and factor interactions between varieties and CO2 on N, P and K partitioning in different plant tissues of two mulberry varieties (Morus multicaulis Perr. var. QiangSang and NongSang) grown under ambient CO2 (ACO2, 410/460 ppm, daytime/nighttime) and elevated CO2 (eCO2, 710/760 ppm) levels.
VariableN PartitioningP PartitioningK Partitioning
LeafStemRootLeafStemRootLeafStemRoot
CO20.070.0010.1290.4410.0020.2510.2080.3120.119
Variety0.2440.0010.0030.0110.0010.0020.4010.0260.326
CO2×variety0.0020.1460.0900.3120.7710.3880.0410.5760.167
Publisher’s Note: MDPI stays neutral with regard to jurisdictional claims in published maps and institutional affiliations.