
Wildlife Response to Wildfire in a Northern New York Jack Pine Barrens

 , ,
, , 
Abstract
:
1. Introduction
2. Materials and Methods
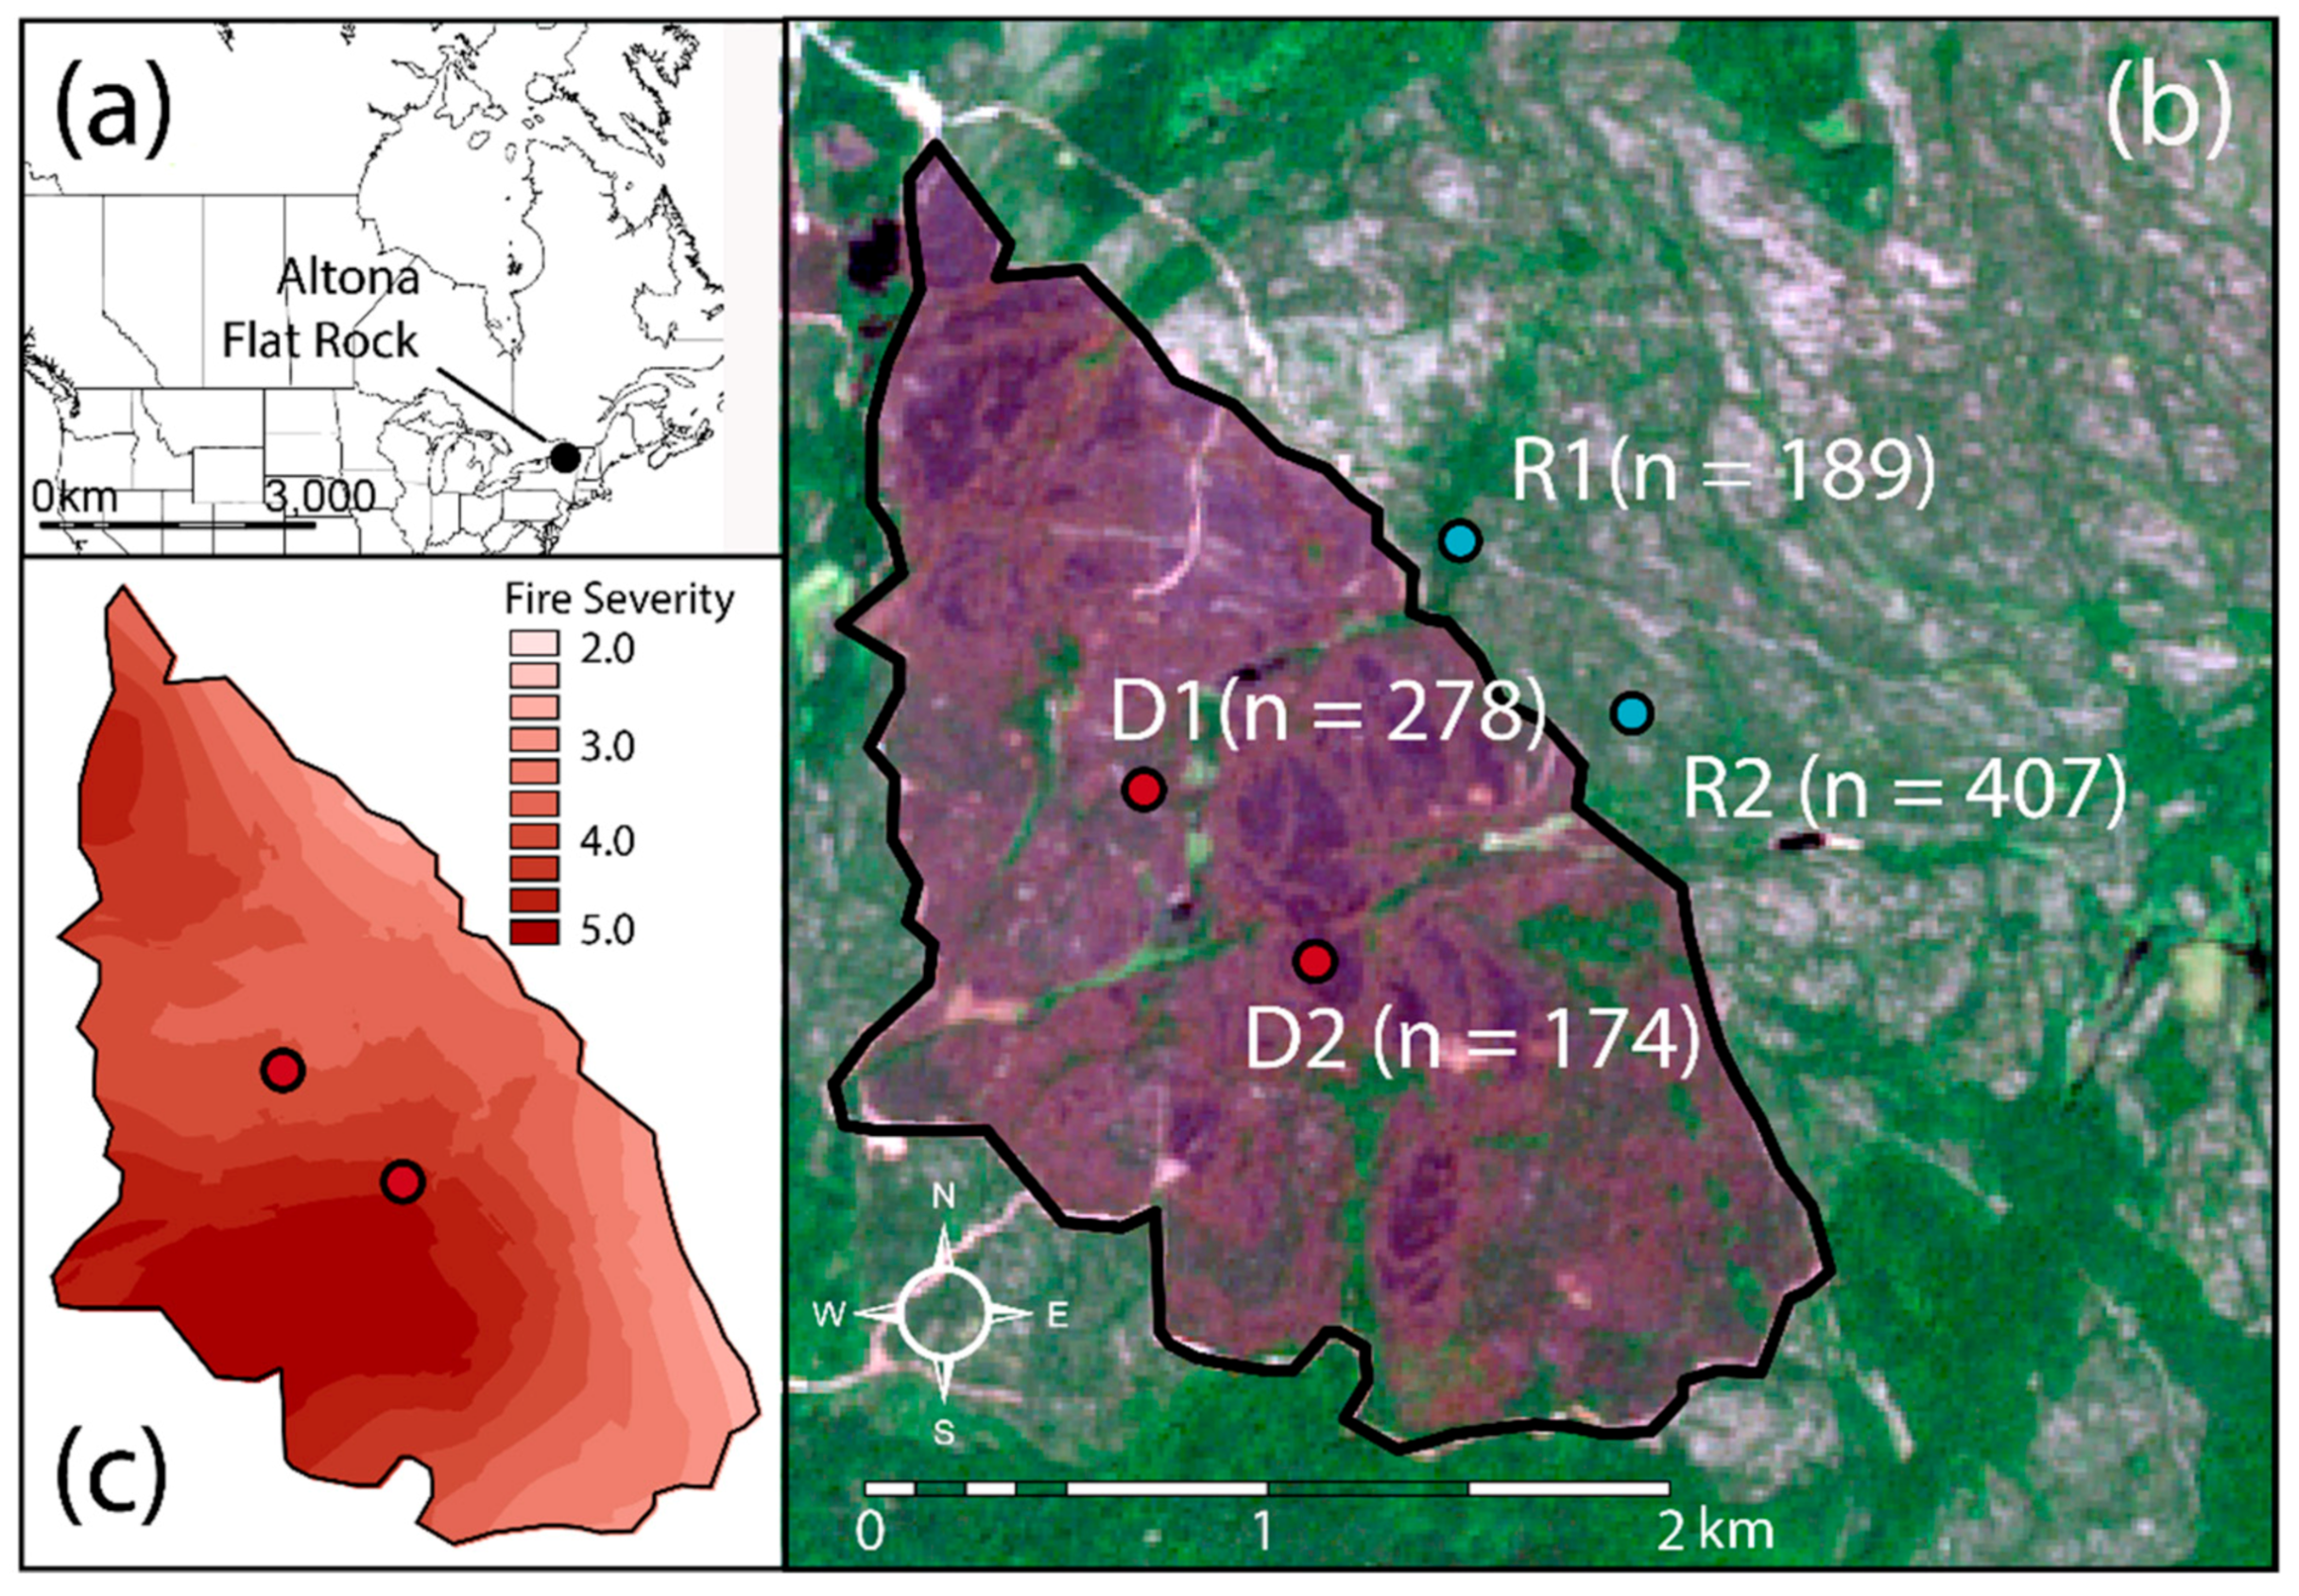
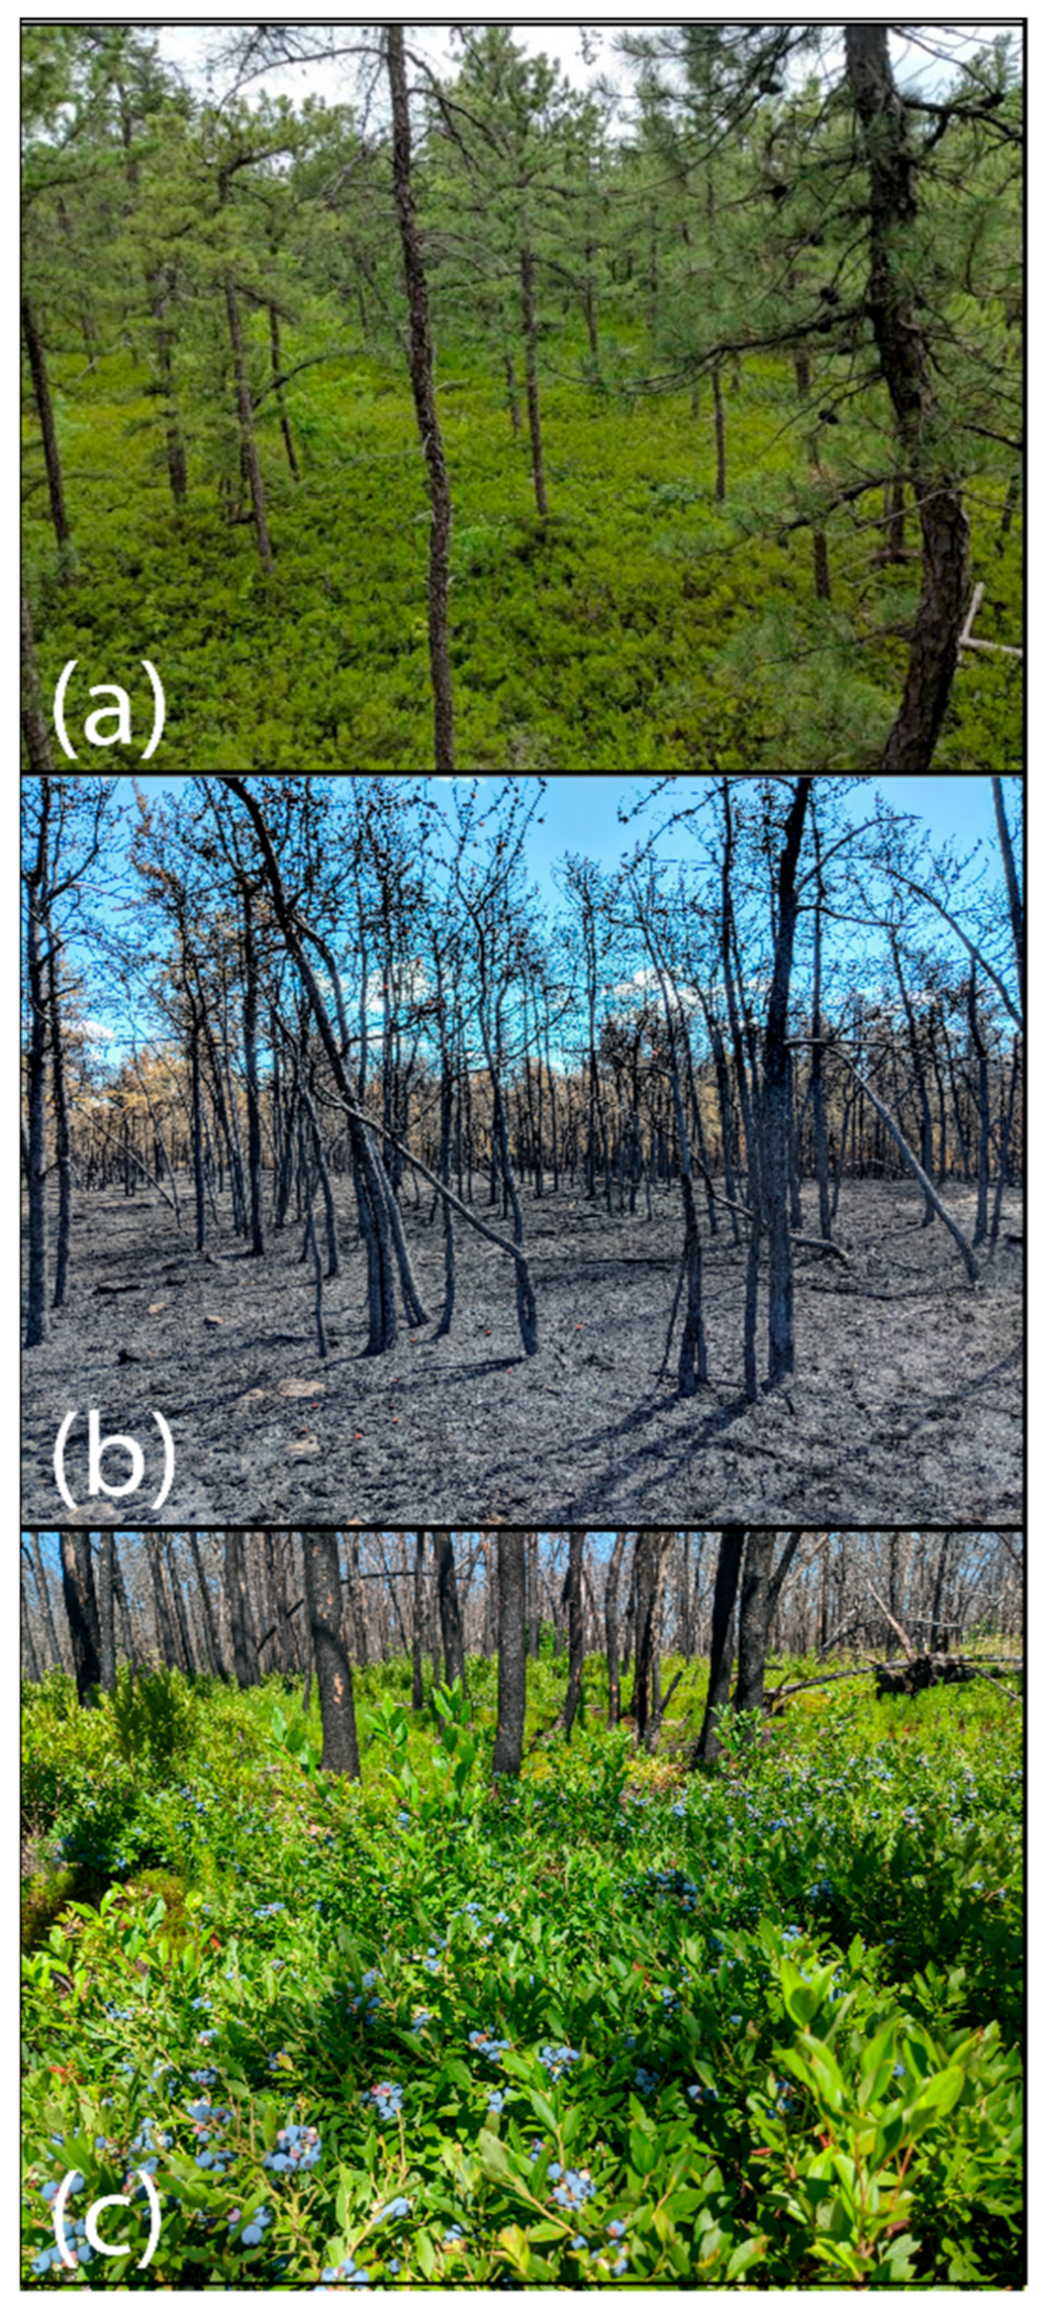
2.1. Study Site
2.2. Study Design and Data Collection

2.3. Data Analysis
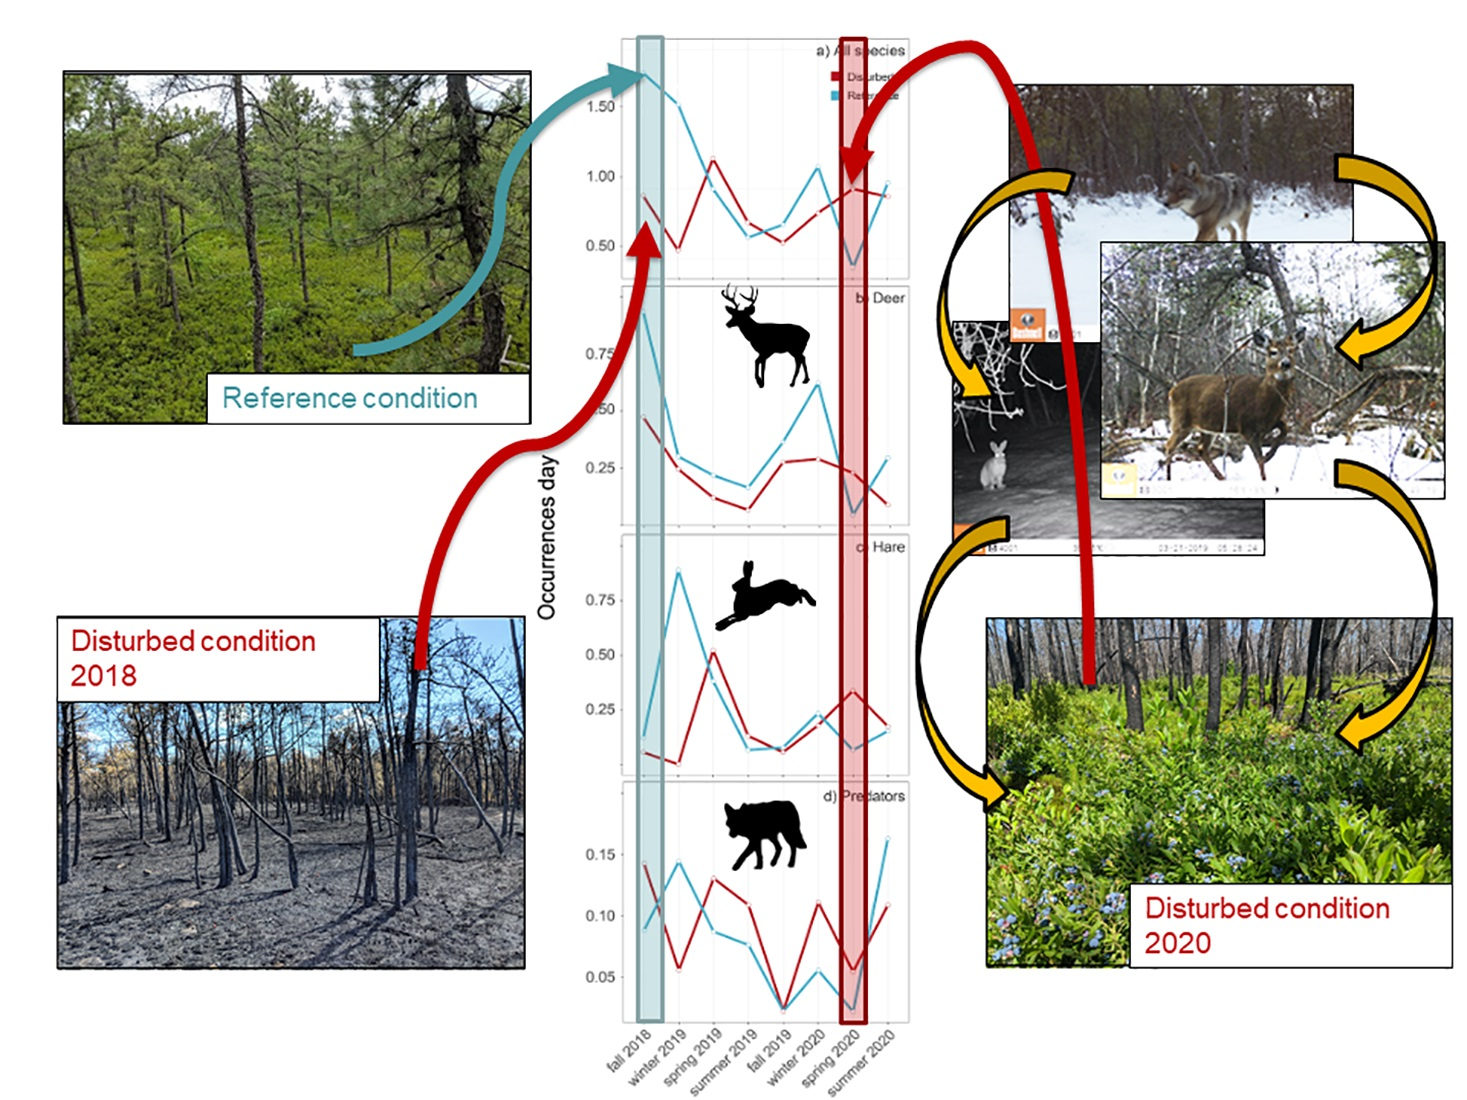
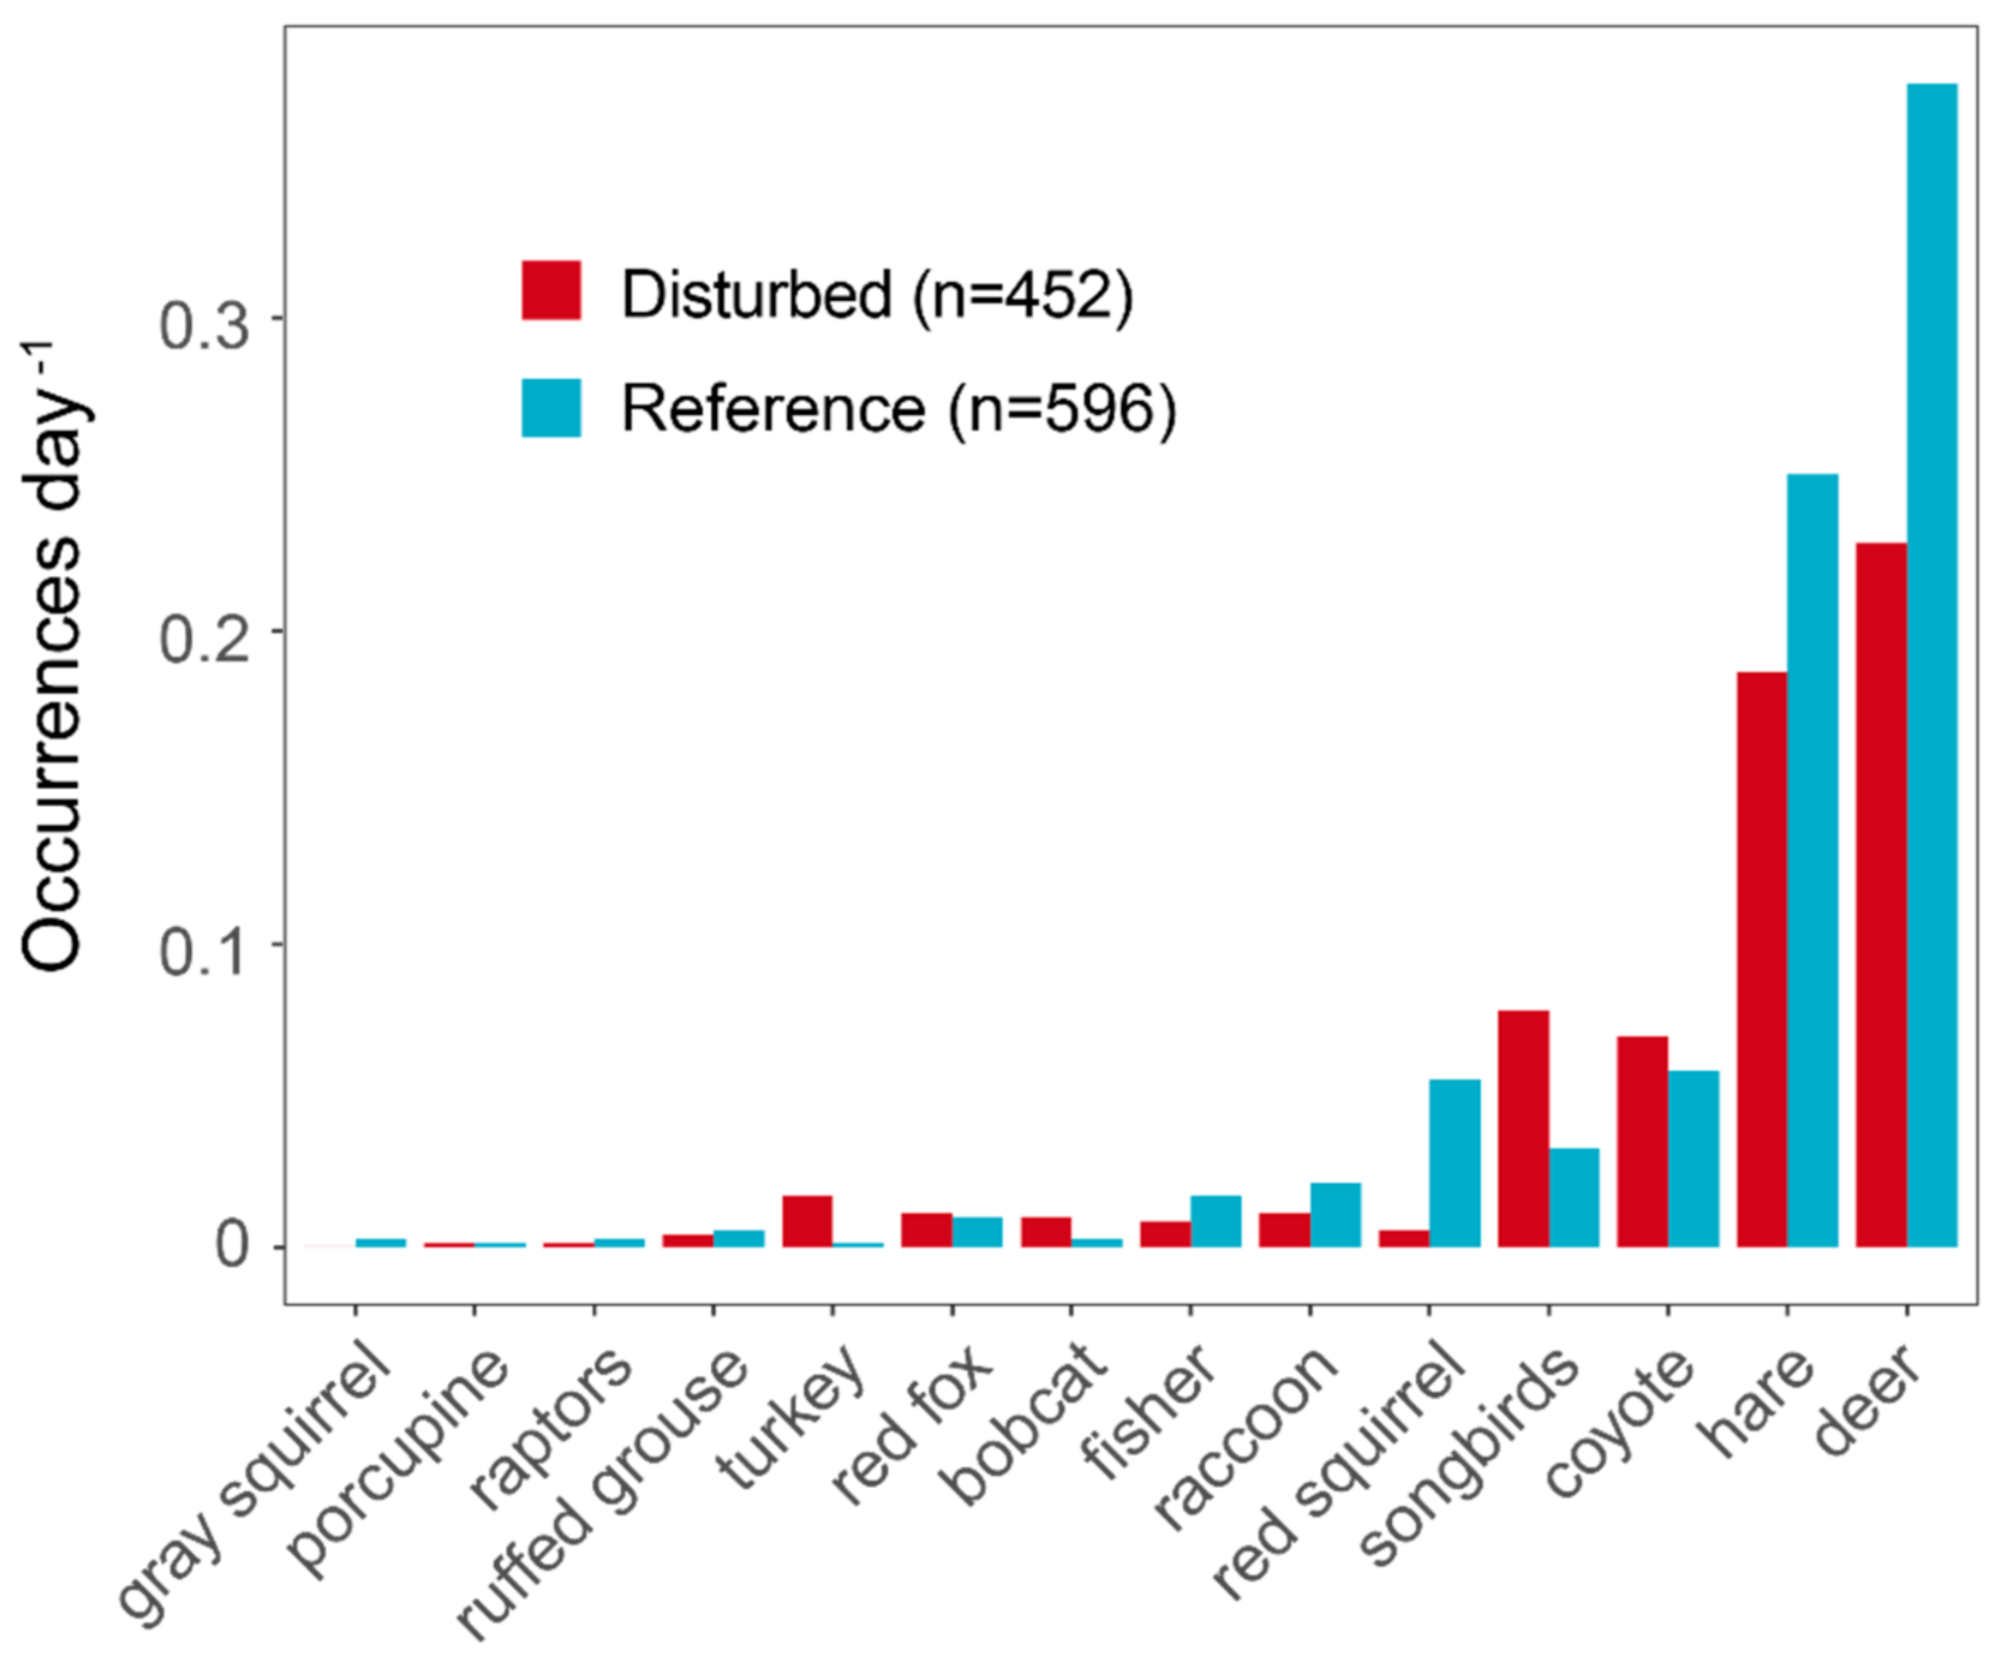
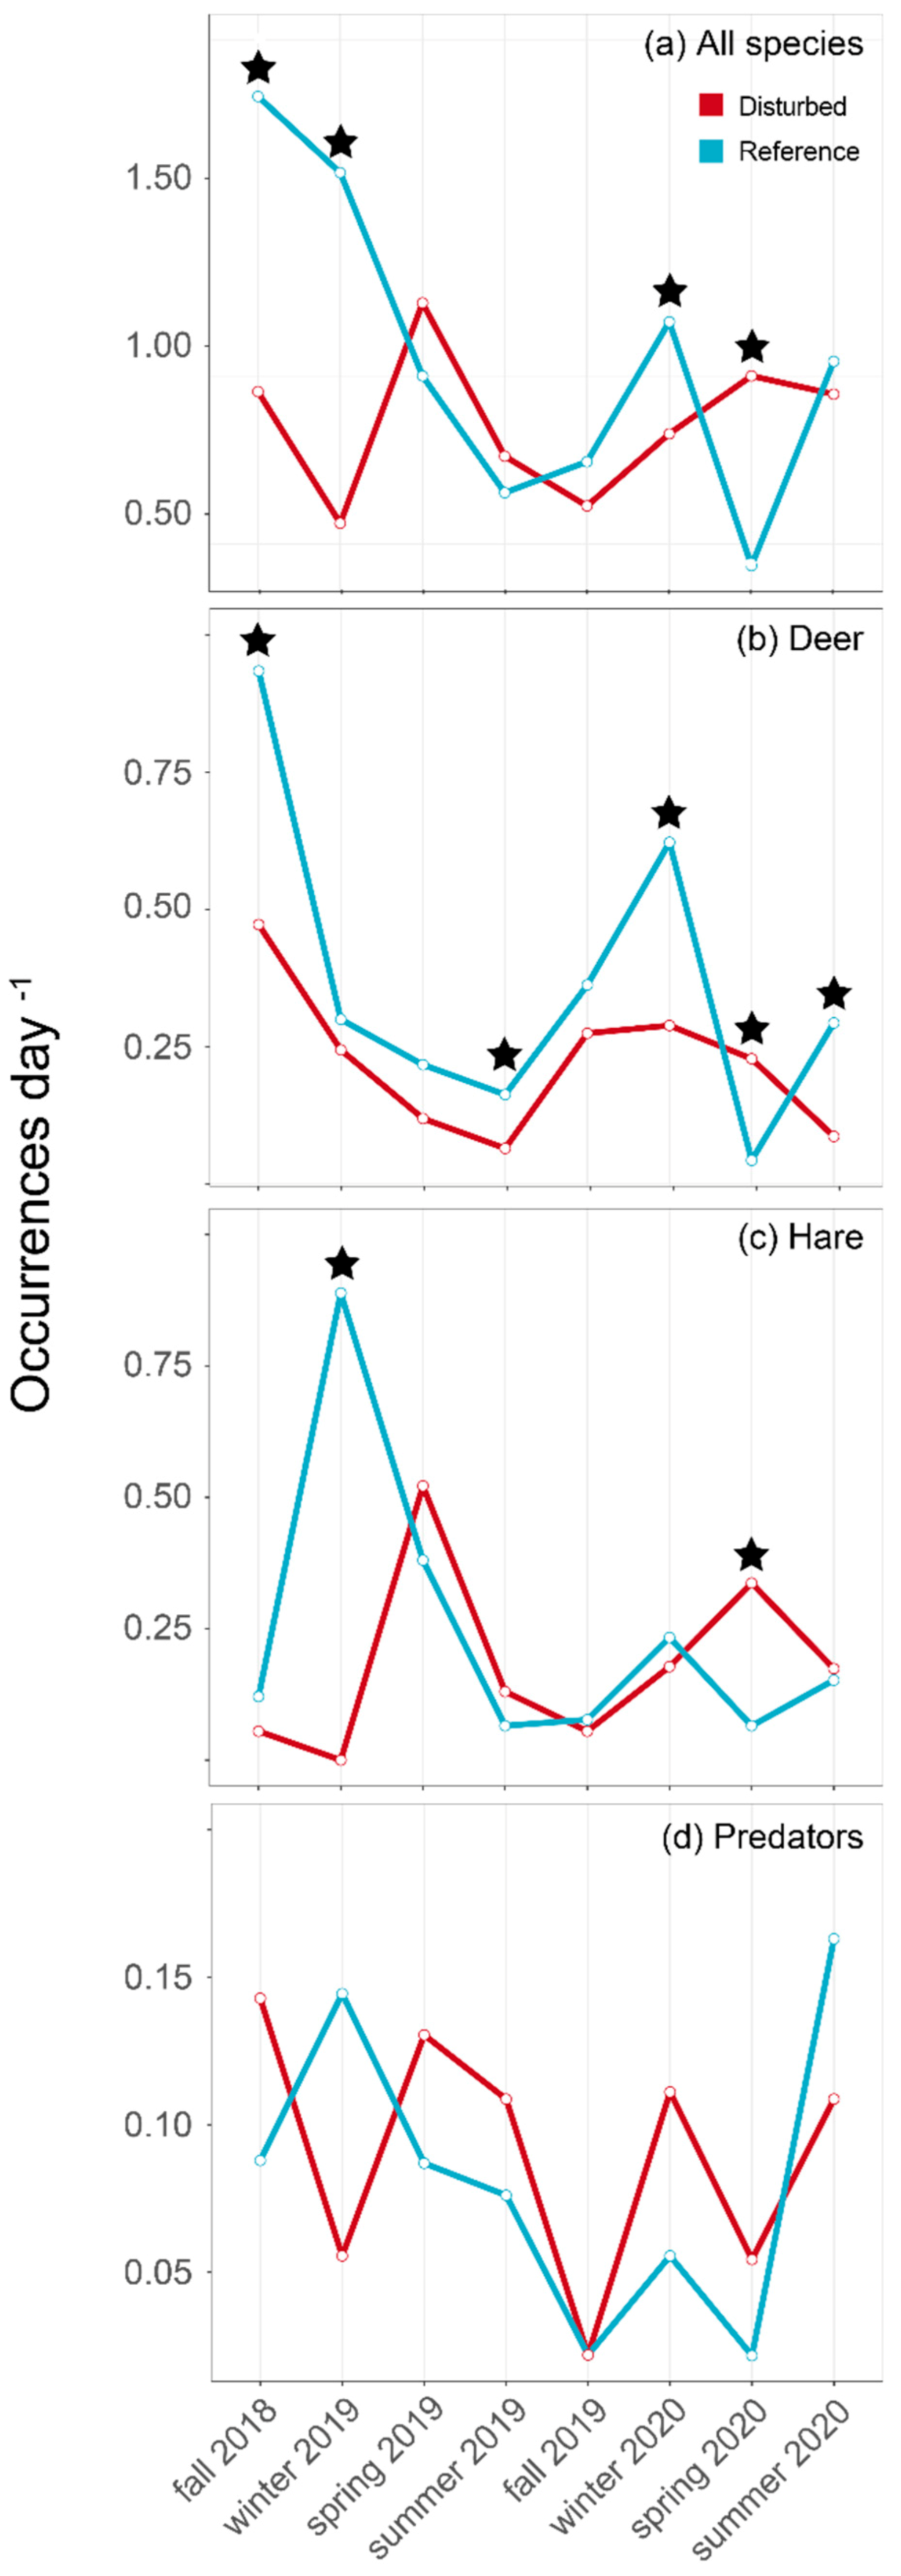
3. Results
4. Discussion
4.1. Herbivore Habitat Use
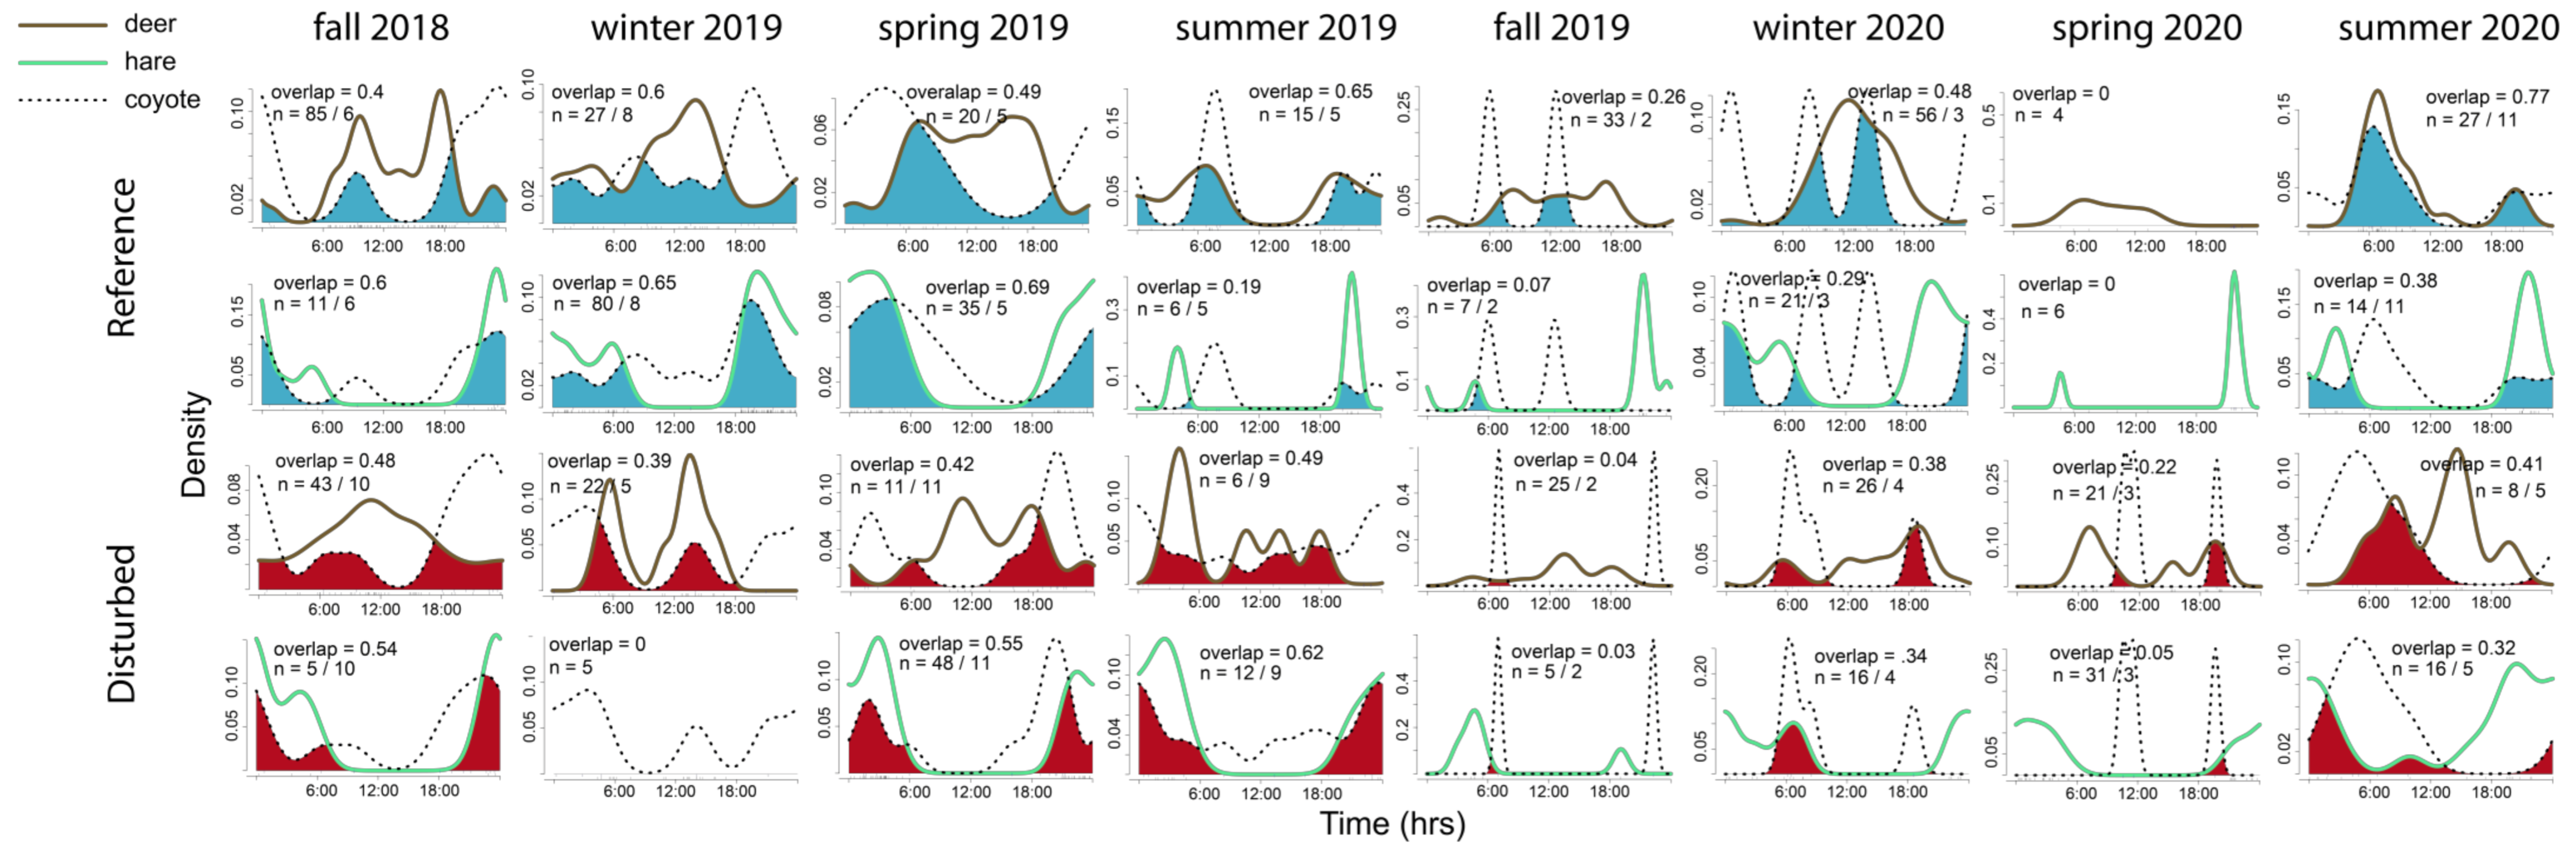
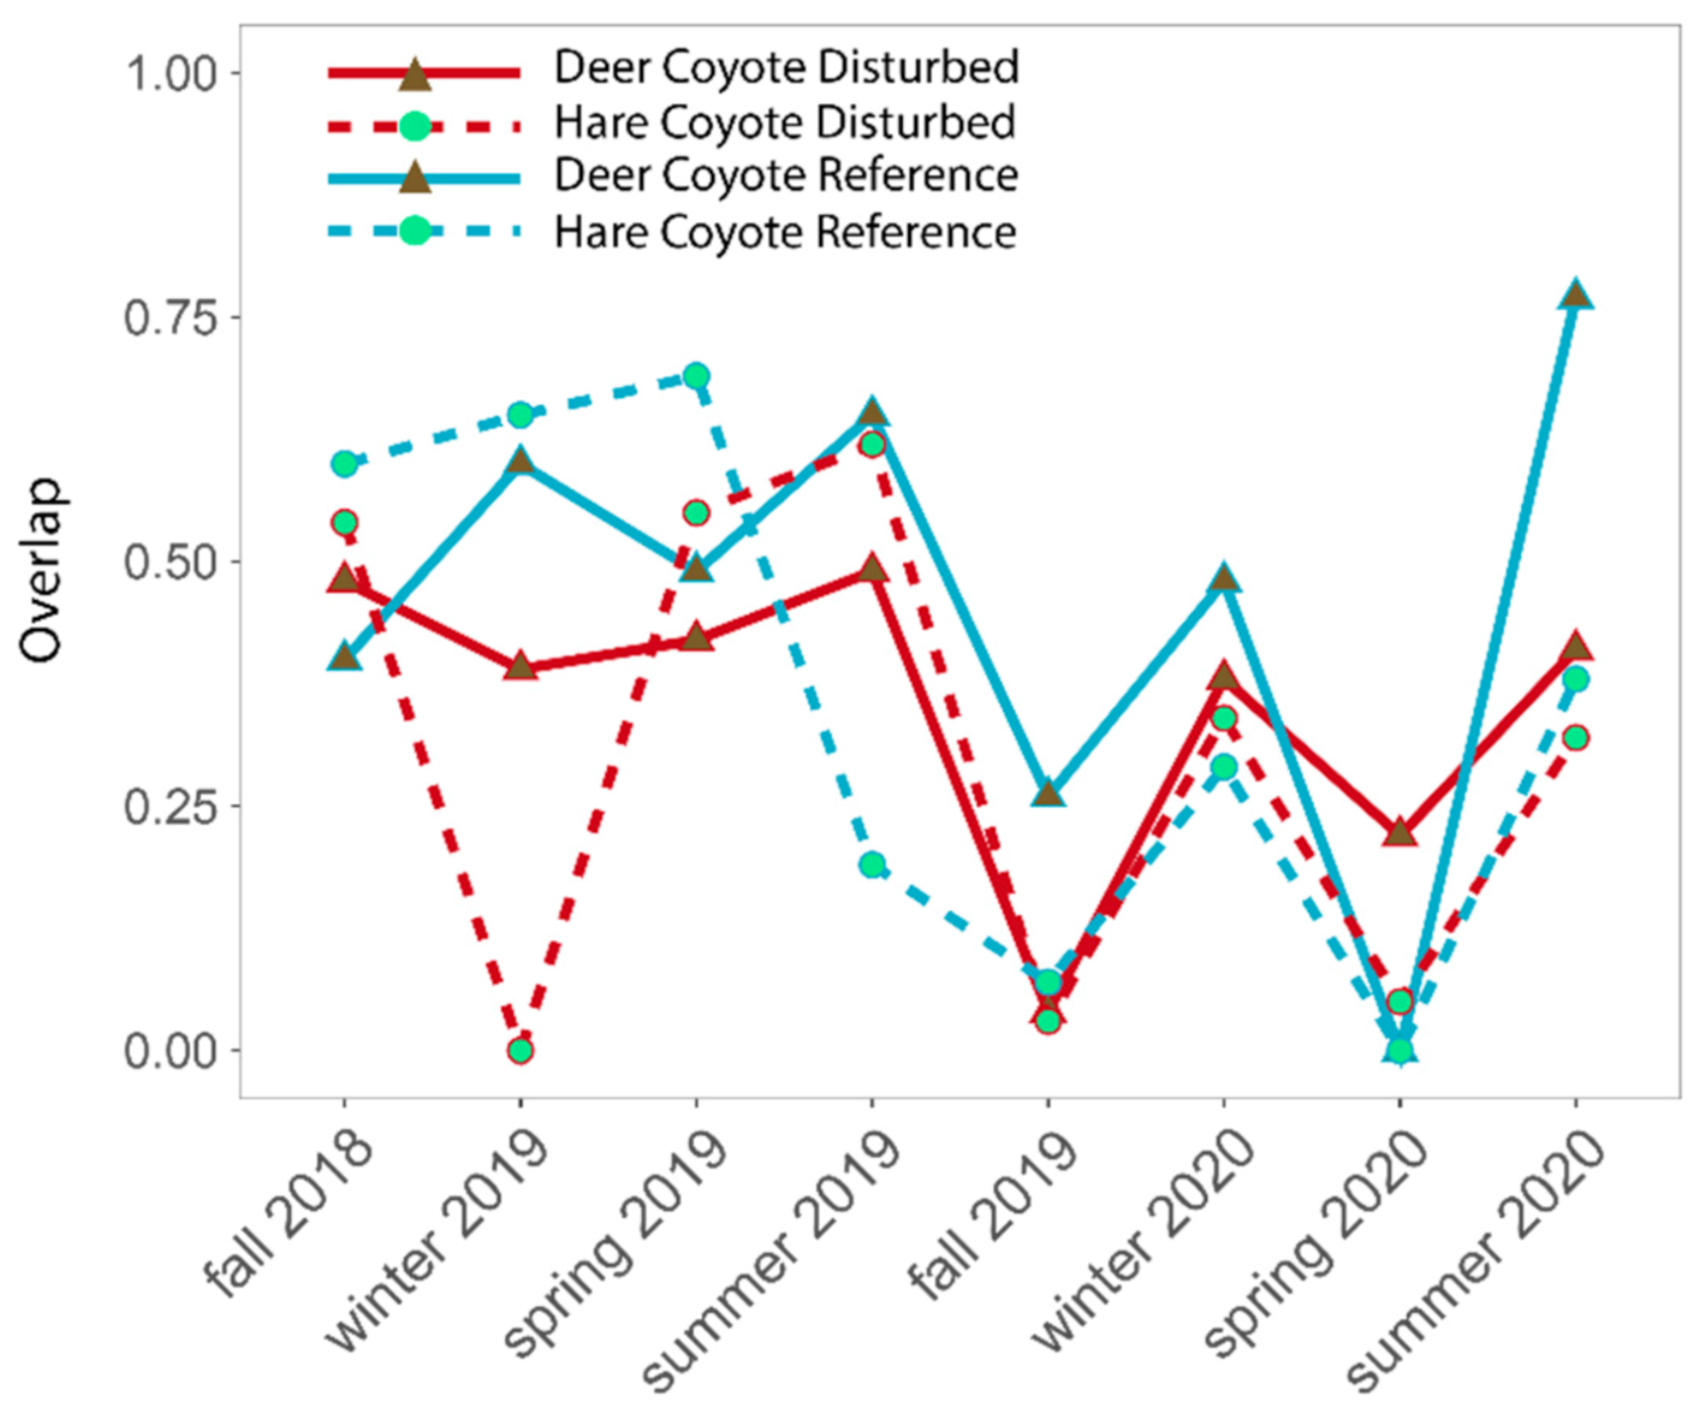
4.2. Predator–Prey Relationships
5. Conclusions
Author Contributions
Funding
Institutional Review Board Statement
Data Availability Statement
Acknowledgments
Conflicts of Interest
Appendix A

| Species | Scientific Name | Reference | Disturbed |
|---|---|---|---|
| American crow | Corvus brachyrhynchos, Brehm | 1 | 5 |
| American robin | Turdus migratorius, Linnaeus | 11 | 43 |
| Blue jay | Cyanocitta cristata, Linnaeus | 1 | 0 |
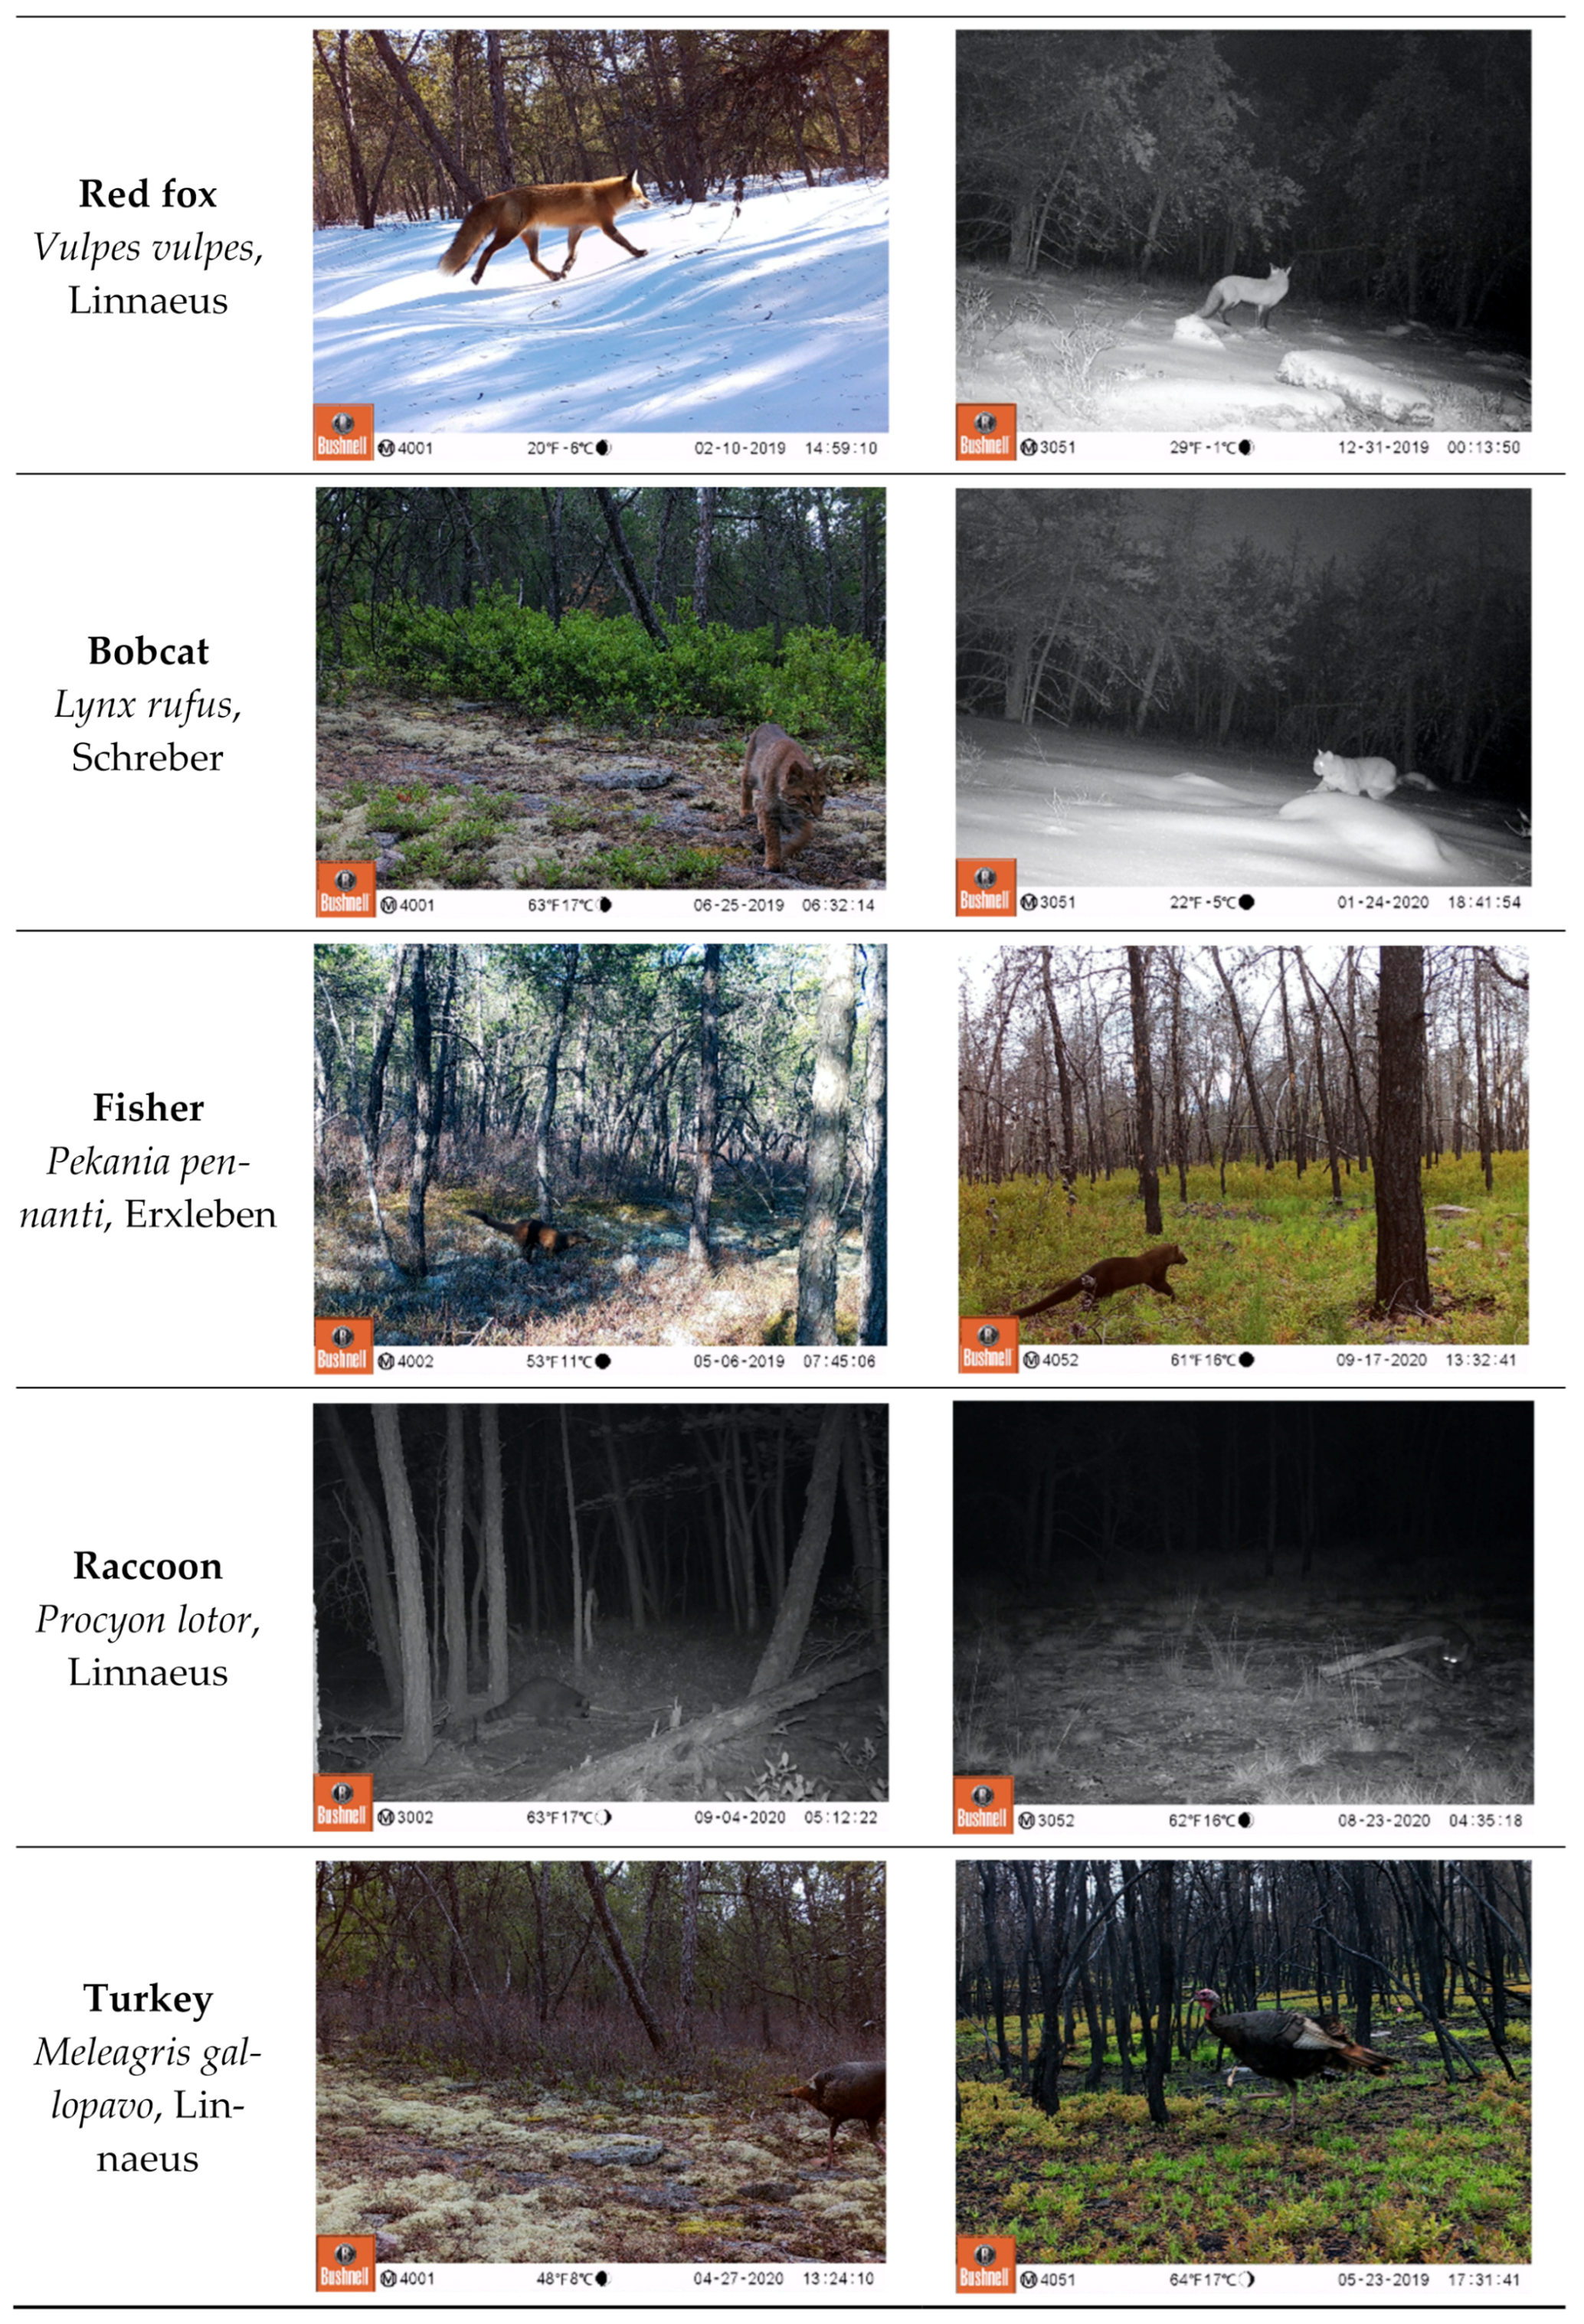
| Bobcat | Lynx rufus, Schreber | 2 | 7 |
| Cedar waxwing | Bombycilla cedrorum, Vieillet | 0 | 1 |
| Cooper’s hawk | Accipiter cooperii, Bonaparte | 1 | 0 |
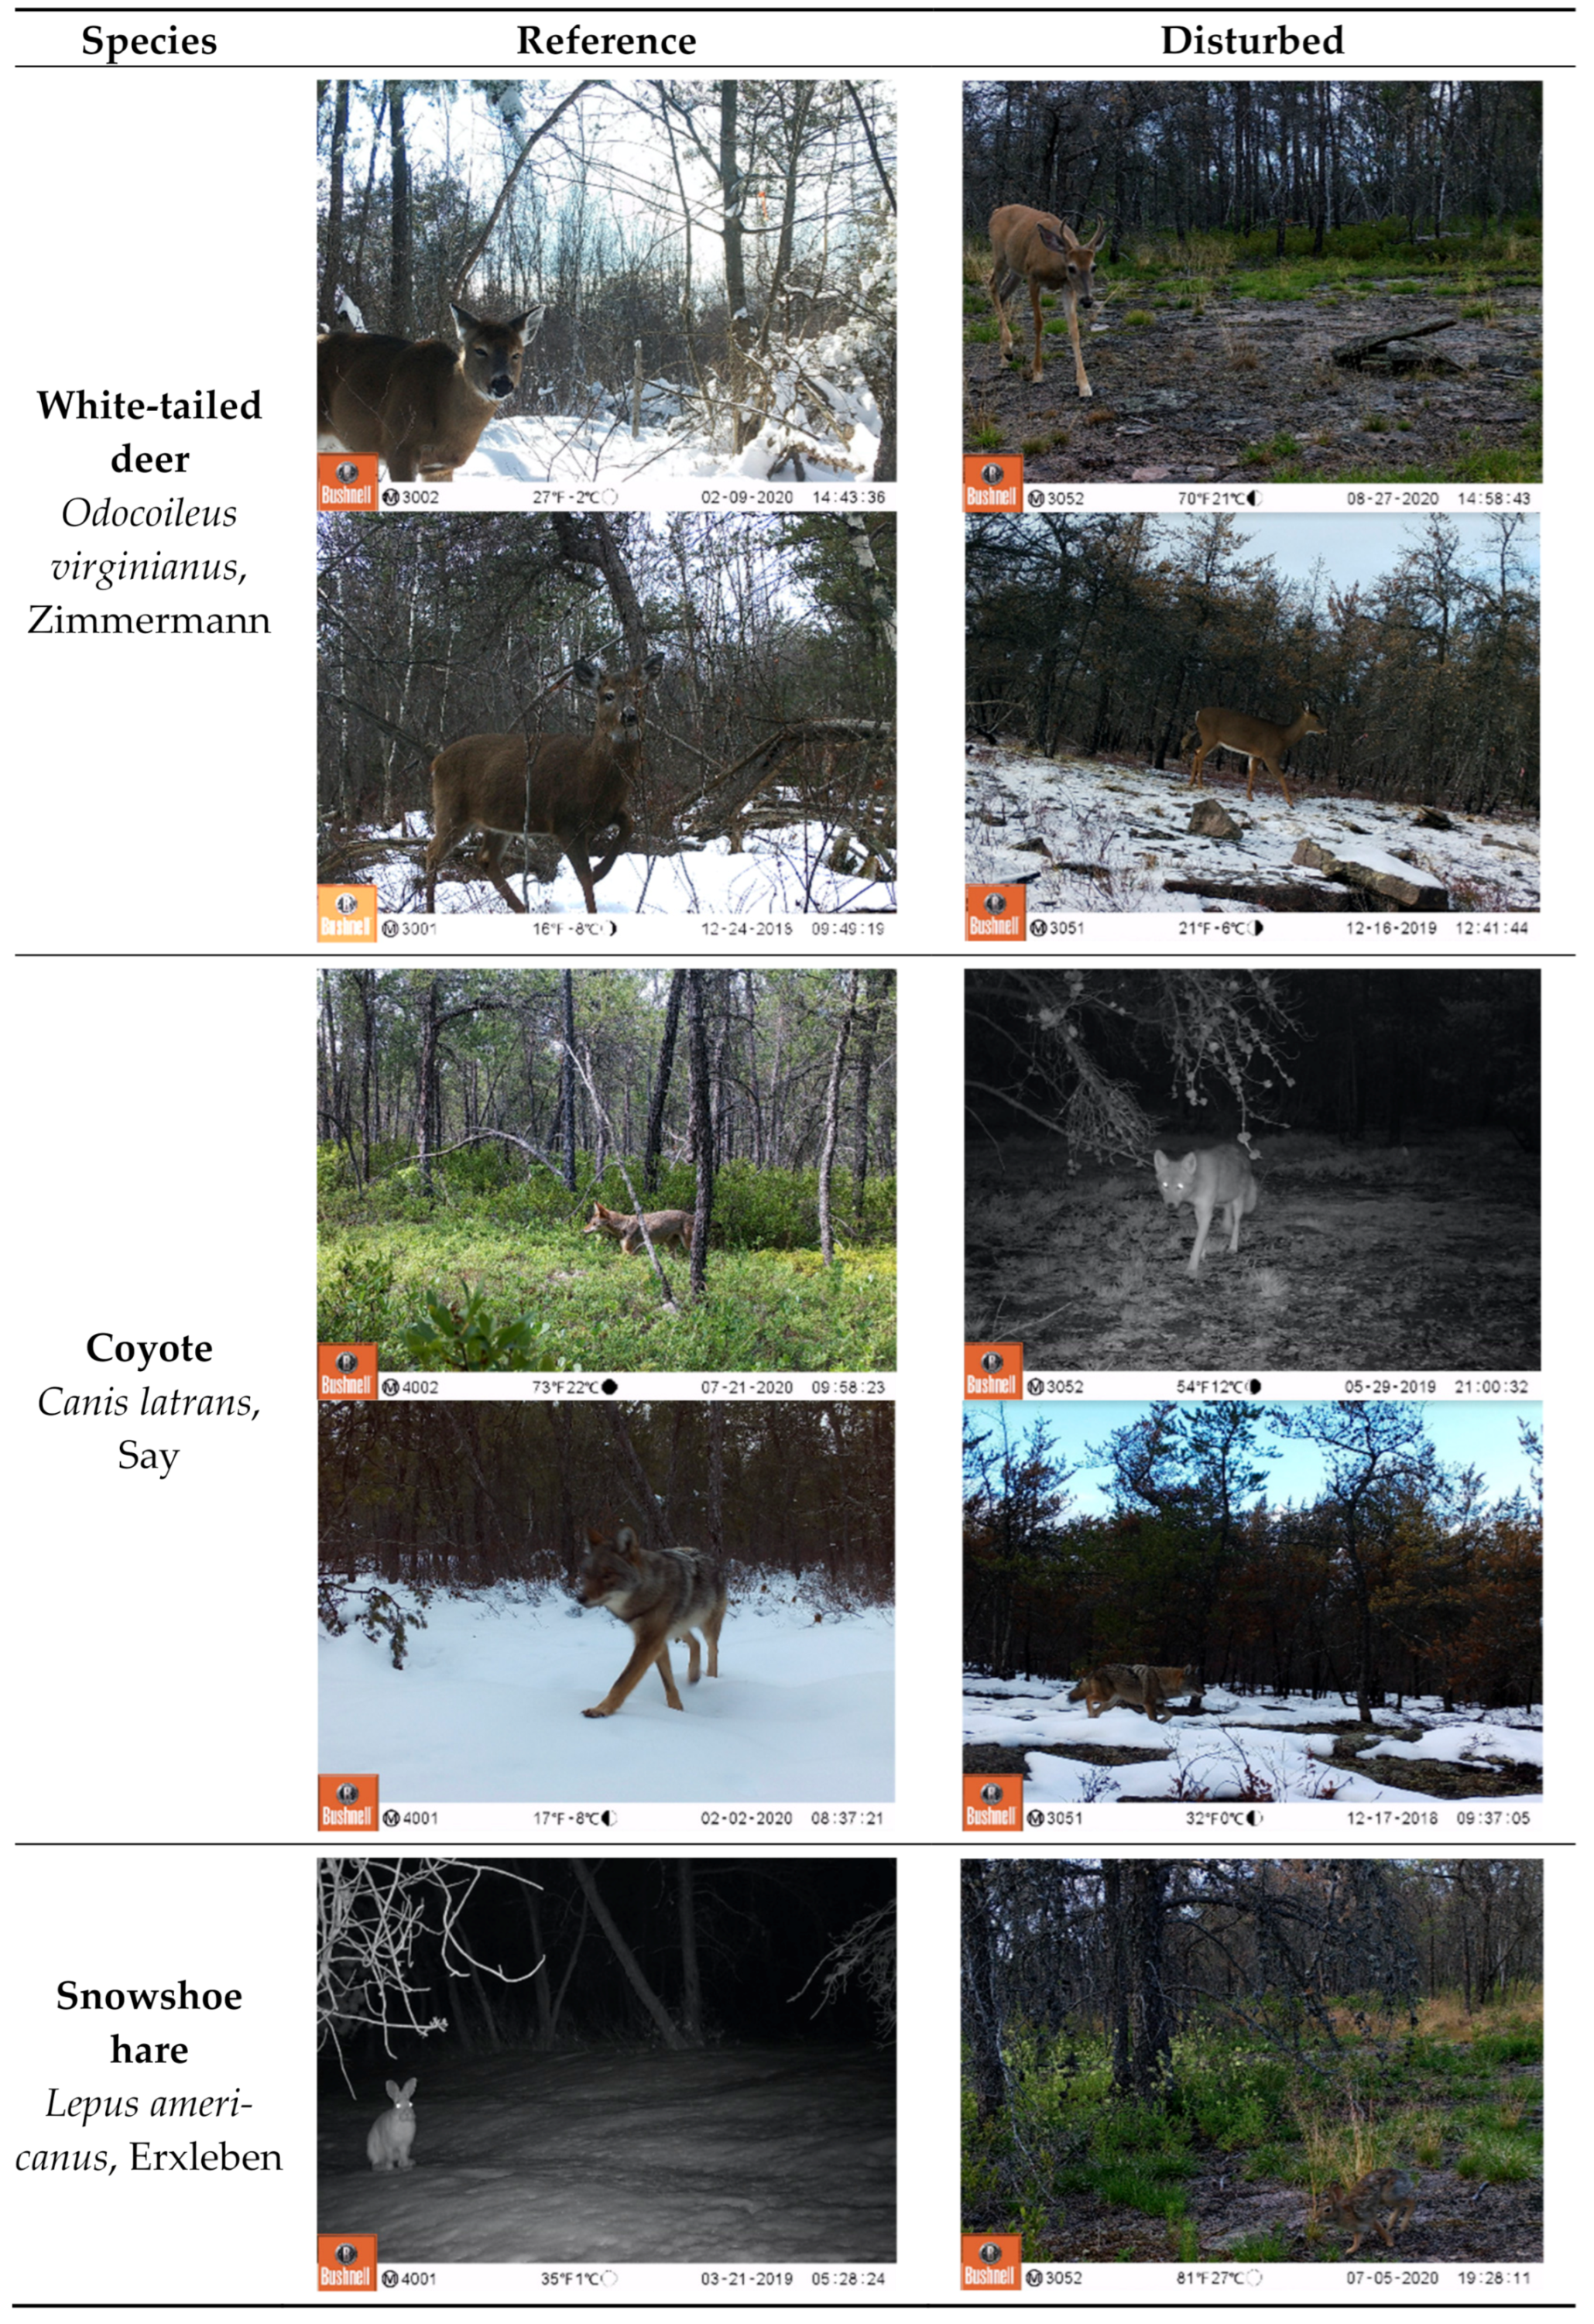
| Eastern coyote | Canis latrans, Say | 41 | 49 |
| Eastern phoebe | Sayornis phoebe, Latham | 0 | 1 |
| Eastern turkey | Meleagris gallopavo, Linnaeus | 1 | 12 |
| Fisher | Pekania pennanti, Erxleben | 12 | 6 |
| Gray squirrel | Sciurus carolinensis, Gmelin | 2 | 0 |
| Hermit thrush | Catharus guttatus, Pallas | 5 | 1 |
| Dark-eyed junco | Junco hyemalis, Linnaeus | 0 | 1 |
| Northern flicker | Colaptes auratus, Linnaeus | 1 | 3 |
| Porcupine | Erethizon dorsatum, Linnaeus | 1 | 1 |
| Raccoon | Procyon lotor, Linnaeus | 15 | 8 |
| Red fox | Vulpes vulpes, Linnaeus | 7 | 8 |
| Red squirrel | Sciurus vulgaris, Linnaeus | 39 | 4 |
| Red-tailed hawk | Buteo jamaicensis, Gmelin | 0 | 1 |
| Ruffed grouse | Bonasa umbellus, Linnaeus | 4 | 3 |
| Sharp-shinned hawk | Accipiter striatus, Vieillot | 1 | 0 |
| Snowshoe hare | Lepus americanus, Erxleben | 180 | 134 |
| White-tailed deer | Odocoileus virginianus, Zimmermann | 271 | 164 |
Appendix B


References
- De Grandpré, L.; Waldron, K.; Bouchard, M.; Gauthier, S.; Beaudet, M.; Ruel, J.C.; Hébert, C.; Kneeshaw, D.D. Incorporating insect and wind disturbances in a natural disturbance-based management framework for the boreal forest. Forests 2018, 9, 471. [Google Scholar] [CrossRef] [Green Version]
- Turner, M.G.; Collins, S.L.; Lugo, A.E.; Magnuson, J.J.; Scott Rupp, T.; Swanson, F.J. Disturbance dynamics and ecological response: The contribution of long-term ecological research. Bioscience 2003, 53, 46–56. [Google Scholar] [CrossRef] [Green Version]
- Attiwill, P.M. The disturbance of forest ecosystems: The ecological basis for conservative management. For. Ecol. Manag. 1994, 63, 247–300. [Google Scholar] [CrossRef]
- Lovett, G.M.; Canham, C.D.; Arthur, M.A.; Weathers, K.C.; Fitzhugh, R.D. Forest ecosystem responses to exotic pests and pathogens in eastern North America. Bioscience 2006, 56, 395–405. [Google Scholar] [CrossRef] [Green Version]
- Pickett, S.T.A.; White, P.S. The Ecology of Natural Disturbance and Patch Dynamics; Academic Press: Orlando, FL, USA, 1985. [Google Scholar]
- Keiser, A.D.; Knoepp, J.D.; Bradford, M.A. Disturbance decouples biogeochemical cycles across forests of the southeastern US. Ecosystems 2016, 19, 50–61. [Google Scholar] [CrossRef]
- Dukes, J.S.; Pontius, J.; Orwig, D.; Garnas, J.R.; Rodgers, V.L.; Brazee, N.; Cooke, B.; Theoharides, K.A.; Stange, E.S.; Harrington, R.; et al. Responses of insect pests, pathogens, and invasive plant species to climate change in the forests of northeastern North America: What can we predict? Can. J. For. Res. 2009, 39, 231–248. [Google Scholar] [CrossRef]
- Sergio, F.; Blas, J.; Hiraldo, F. Animal responses to natural disturbance and climate extremes: A review. Glob. Planet. Chang. 2018, 161, 28–40. [Google Scholar] [CrossRef]
- Thompson, J.R.; Spies, T.A. Vegetation and weather explain variation in crown damage within a large mixed-severity wildfire. For. Ecol. Manag. 2009, 258, 1684–1694. [Google Scholar] [CrossRef]
- Lampainen, J.; Kuuluvainen, T.; Wallenius, T.H.; Karjalainen, L.; Vanha-Majamaa, I. Long-term forest structure and regeneration after wildfire in Russian Karelia. J. Veg. Sci. 2004, 15, 245–256. [Google Scholar] [CrossRef]
- Ballard, T.M. Impacts of forest management on northern forest soils. For. Ecol. Manag. 2000, 133, 37–42. [Google Scholar] [CrossRef]
- Certini, G. Effects of fire on properties of forest soils: A review. Oecologia 2005, 143, 1–10. [Google Scholar] [CrossRef]
- Boerner, R.E.J. Fire and nutrient cycling in temperate ecosystems. Bioscience 1982, 32, 187–192. [Google Scholar] [CrossRef]
- Ahlgren, I.F.; Ahlgren, C.E. Ecological effects of forest fires. Bot. Rev. 1960, 26, 483–533. [Google Scholar] [CrossRef]
- Bond, M.L. Mammals and mixed- and high-severity fire. In The Ecological Importance of Mixed-Severity Fires: Nature’s Phoenix; Elsevier Inc.: Amsterdam, The Netherlands, 2015; pp. 89–117. ISBN 9780128027608. [Google Scholar]
- Fisher, J.T.; Wilkinson, L. The response of mammals to forest fire and timber harvest in the North American boreal forest. Mamm. Rev. 2005, 35, 51–81. [Google Scholar] [CrossRef]
- Converse, S.J.; White, G.C.; Block, W.M. Small mammal responses to thinning and wildfire in ponderosa pine–dominated forests of the southwestern United States. J. Wildl. Manag. 2006, 70, 1711–1722. [Google Scholar] [CrossRef]
- Gigliotti, L.C.; Jones, B.C.; Lovallo, M.J.; Diefenbach, D.R. Snowshoe hare multi-level habitat use in a fire-adapted ecosystem. J. Wildl. Manag. 2018, 82, 435–444. [Google Scholar] [CrossRef]
- Vogl, R.J.; Beck, A.M. Response of white-tailed deer to a Wisconsin wildfire. Am. Midl. Nat. 1970, 84, 270–273. [Google Scholar] [CrossRef]
- Cherry, M.J.; Warren, R.J.; Conner, L.M. Fire-mediated foraging tradeoffs in white-tailed deer. Ecosphere 2017, 8, e01784. [Google Scholar] [CrossRef]
- O’Brien, C.S.; Krausman, P.R.; Boyd, H.M.; Ballard, W.B.; Cunningham, S.C.; Devos, J.C. Influence of coyotes on habitat use by mule deer following a Wildfire. Calif. Fish Game 2010, 96, 7–22. [Google Scholar]
- Badry, M.; Proulx, G.; Woodward, P. Home-range and habitat use by fishers translocated to the aspen parkland of Alberta. In Martes: Taxonomy, Ecology, Techniques, and Management; Provincial Museum of Alberta: Edmonton, AB, Canada, 1997; pp. 235–251. [Google Scholar]
- Paragi, T.F.; Johnson, W.N.; Katnik, D.D.; Magoun, A.J. Marten selection of postfire seres in the Alaskan taiga. Can. J. Zool. 1996, 74, 2226–2237. [Google Scholar] [CrossRef]
- Lino, S.; Sillero, N.; Torres, J.; Santos, X.; Álvares, F. The role of fire on wolf distribution and breeding-site selection: Insights from a generalist carnivore occurring in a fire-prone landscape. Landsc. Urban Plan. 2019, 183, 111–121. [Google Scholar] [CrossRef]
- Bried, J.T.; Langwig, K.E.; Dewan, A.A.; Gifford, N.A. Habitat associations and survey effort for shrubland birds in an urban pine barrens preserve. Landsc. Urban Plan. 2011, 99, 218–225. [Google Scholar] [CrossRef]
- Swengel, A.B. Effects of management on butterfly abundance in tallgrass prairie and pine barrens. Biol. Conserv. 1998, 83, 77–89. [Google Scholar] [CrossRef]
- Radeloff, V.C.; Mladenoff, D.J.; Gustafson, E.J.; Scheller, R.M.; Zollner, P.A.; He, H.S.; Resit Akçakaya, H. Modeling forest harvesting effects on landscape pattern in the Northwest Wisconsin Pine Barrens. For. Ecol. Manag. 2006, 236, 113–126. [Google Scholar] [CrossRef]
- Volkmann, L.A.; Hutchen, J.; Hodges, K.E. Trends in carnivore and ungulate fire ecology research in North American conifer forests. For. Ecol. Manag. 2020, 458, 117691. [Google Scholar] [CrossRef]
- Hallisey, D.M.; Wood, G.W. Prescribed fire in scrub oak habitat in central Pennsylvania. J. Wildl. Manag. 1976, 40, 507–516. [Google Scholar] [CrossRef]
- Franzi, D.A.; Adams, K.B. The Origin and fate of the sandstone pavement pine barrens in northeastern New York. In New England Intercolllegiate Geologic Conference Guidebook, Proceedings of the New England Intercollegiate Geologic Conference, Burlington, VT, USA, 1–3 October 1999; Wright, S.F., Ed.; University of Vermont Graphics and Printing: Burlington, VT, USA, 1999; pp. 201–212. [Google Scholar]
- Reschke, C. Ecological Communities of New York State; New York Natural Heritage Program; N.Y.S. Department of Environmental Conservation: Troy, NY, USA, 1990. [Google Scholar]
- Keeley, J.E. Fire intensity, fire severity and burn severity: A brief review and suggested usage. Int. J. Wildl. Fire 2009, 18, 116–126. [Google Scholar] [CrossRef]
- Meek, P.D.; Ballard, G.; Claridge, A.; Kays, R.; Moseby, K.; O’Brien, T.; O’Connell, A.; Sanderson, J.; Swann, D.E.; Tobler, M.; et al. Recommended guiding principles for reporting on camera trapping research. Biodivers. Conserv. 2014, 23, 2324–2343. [Google Scholar] [CrossRef]
- ArcGIS Release for Desktop; Version 10.5; Environmental Systems Research Institute (ESRI): Redlands, CA, USA, 2018.
- Niedballa, J.; Sollmann, R.; Courtiol, A.; Wilting, A. camtrapR: An R package for efficient camera trap data management. Methods Ecol. Evol. 2016, 7, 1457–1462. [Google Scholar] [CrossRef]
- Watts, D.E.; Parker, I.D.; Lopez, R.R.; Silvy, N.J.; Davis, D.S. Distribution and abundance of endangered Florida Key deer on outer islands. J. Wildl. Manag. 2008, 72, 360–366. [Google Scholar] [CrossRef]
- Kelly, M.J.; Holub, E.L. Camera trapping of carnivores: Trap success among camera types and across species, and habitat selection by species, on Salt Pond Mountain, Giles County, Virginia. Northeast. Nat. 2008, 15, 249–262. [Google Scholar] [CrossRef]
- Wolfe, M.L.; Debyle, N.V.; Mccabe, T.R. Snowshoe hare cover relationships in northern Utah. Behav. Biol. 1982, 46, 662–670. [Google Scholar] [CrossRef]
- Litvaitis, J.A.; Sherburne, J.A.; Bissonette, J.A. Influence of understory characteristics on snowshoe hare habitat use and density. Source J. Wildl. Manag. 1985, 49, 866–873. [Google Scholar] [CrossRef]
- Litvaitis, J.A.; Sherburne, J.A.; Bissonette, J.A. A comparison of methods used to examine snowshoe hare habitat use. J. Wildl. Manag. 1985, 49, 693–695. [Google Scholar] [CrossRef]
- Keith, L.B.; Surrendi, D.C. Effects of fire on a snowshoe hare population. J. Wildl. Manag. 1971, 35, 16–26. [Google Scholar] [CrossRef]
- Sievert, P.R.; Keith, L.B. Survival of snowshoe hares at a geographic range boundary. J. Wildl. Manag. 1985, 49, 854–866. [Google Scholar] [CrossRef]
- Meek, M.G.; Cooper, S.M.; Owens, M.K.; Cooper, R.M.; Wappel, A.L. White-tailed deer distribution in response to patch burning on rangeland. J. Arid Environ. 2008, 72, 2026–2033. [Google Scholar] [CrossRef]
- Lashley, M.A.; Chitwood, M.C.; Kays, R.; Harper, C.A.; DePerno, C.S.; Moorman, C.E. Prescribed fire affects female white-tailed deer habitat use during summer lactation. For. Ecol. Manag. 2015, 348, 220–225. [Google Scholar] [CrossRef]
- Cairns, A.L.; Telfer, E.S. Habitat use by 4 sympatric ungulates in boreal mixedwood forest. J. Wildl. Manag. 1980, 44, 849–857. [Google Scholar] [CrossRef]
- Johnson, A.S.; Hale, P.E.; Ford, W.M.; Wentworth, J.M.; French, J.R.; Anderson, O.F.; Pullen, G.B. White-tailed deer foraging in relation to successional stage, overstory type and management of Southern Appalachian forests. Am. Midl. Nat. 1995, 133, 18–35. [Google Scholar] [CrossRef]
- Archibald, S.; Bond, W.J.; Stock, W.D.; Fairbanks, D.H.K. Shaping the landscape: Fire-grazer interactions in an African savanna. Ecol. Appl. 2005, 15, 96–109. [Google Scholar] [CrossRef]
- Duchesne, L.C.; Wetzel, S. Effect of fire intensity and depth of burn on lowbush blueberry, Vaccinium angustifolium, and velvet leaf blueberry, Vaccinium myrtilloides, production in eastern Ontario. Can. Field-Nat. 2004, 118, 195–200. [Google Scholar] [CrossRef] [Green Version]
- Lyon, L.J.; Jensen, C.E. Management implications of elk and deer use of clear-cuts in Montana. Source J. Wildl. Manag. 1980, 44, 352–362. [Google Scholar] [CrossRef]
- Carl, G.R.; Robbins, C.T. The energetic cost of predator avoidance in neonatal ungulates: Hiding versus following. Can. J. Zool. 1988, 66, 239–246. [Google Scholar] [CrossRef]
- Oehler, J.D.; Litvaitis, J.A. The role of spatial scale in understanding responses of medium-sized carnivores to forest fragmentation. Can. J. Zool. 1996, 74, 2070–2079. [Google Scholar] [CrossRef]
- Thibault, I.; Ouellet, J.P. Hunting behaviour of eastern coyotes in relation to vegetation cover, snow conditions, and hare distribution. Ecoscience 2005, 12, 466–475. [Google Scholar] [CrossRef]
- Ellington, E.H.; Muntz, E.M.; Gehrt, S.D. Seasonal and daily shifts in behavior and resource selection: How a carnivore navigates costly landscapes. Oecologia 2020, 194, 87–100. [Google Scholar] [CrossRef]
- Foresman, K.R.; Earson, D.E.P.; Pearso, D.E. Activity patterns of American martens, Martes americana, snowshoe hares, Lepus americanus, and red squirrels, Tamiasciurus hudsonicus, in westcentral Montana. Can. F. Nat. 1999, 113, 386–389. [Google Scholar]
- Feierabend, D.; Kielland, K. Movements, activity patterns, and habitat use of snowshoe hares (Lepus americanus) in interior Alaska. J. Mammal. 2014, 95, 525–533. [Google Scholar] [CrossRef] [Green Version]
- Mech, L.D.; Heezen, K.L.; Siniff, D.B. Onset and cessation of activity in cottontail rabbits and snowshoe hares in relation to sunset and sunrise. Anim. Behav. 1966, 14, 410–413. [Google Scholar] [CrossRef]
- Higdon, S.D.; Diggins, C.A.; Cherry, M.J.; Ford, W.M. Activity patterns and temporal predator avoidance of white-tailed deer (Odocoileus virginianus) during the fawning season. J. Ethol. 2019, 37, 283–290. [Google Scholar] [CrossRef]
- Crawford, D.A.; Conner, L.M.; Morris, G.; Cherry, M.J. Predation risk increases intraspecific heterogeneity in white-tailed deer diel activity patterns. Behav. Ecol. 2020, 32, 41–48. [Google Scholar] [CrossRef]
- Jacobsen, N.K. Changes in 24-hour activity patterns with growth of white-tailed deer fawns (Odocoileus virginianus). J. Interdiscipl. Cycle Res. 1984, 15, 213–226. [Google Scholar] [CrossRef]
- Monamy, V.; Fox, B.J. Small mammal succession is determined by vegetation density rather than time elapsed since disturbance. Austral Ecol. 2000, 25, 580–587. [Google Scholar] [CrossRef]
- Fox, B.J. Changes in the structure of mammal communities over successional time scales. Oikos 1990, 59, 321–329. [Google Scholar] [CrossRef]
- Johnstone, J.F.; Allen, C.D.; Franklin, J.F.; Frelich, L.E.; Harvey, B.J.; Higuera, P.E.; Mack, M.C.; Meentemeyer, R.K.; Metz, M.R.; Perry, G.L.W.; et al. Changing disturbance regimes, ecological memory, and forest resilience. Front. Ecol. Environ. 2016, 14, 369–378. [Google Scholar] [CrossRef]
- Aitken, S.N.; Yeaman, S.; Holliday, J.A.; Wang, T.; Curtis-McLane, S. Adaptation, migration or extirpation: Climate change outcomes for tree populations. Evol. Appl. 2008, 1, 95–111. [Google Scholar] [CrossRef]
- Hampe, A.; Petit, R.J. Conserving biodiversity under climate change: The rear edge matters. Ecol. Lett. 2005, 8, 461–467. [Google Scholar] [CrossRef] [Green Version]


| Condition | n | Occurrences | Richness | Diversity 1 | Similarity 2 |
|---|---|---|---|---|---|
| Disturbed (burned) | 452 | 226 (±73.54) | 14 (±1.41) | 5.56 (±0.48) | 0.66 (±0.14) |
| Reference (unburned) | 596 | 298 (±154.15) | 14 (±5.66) | 4.41 (±1.21) | / |
Publisher’s Note: MDPI stays neutral with regard to jurisdictional claims in published maps and institutional affiliations. |
© 2021 by the authors. Licensee MDPI, Basel, Switzerland. This article is an open access article distributed under the terms and conditions of the Creative Commons Attribution (CC BY) license (https://creativecommons.org/licenses/by/4.0/).
Share and Cite
Cave, H.; Adams, M.; Jaeger, T.; Peet, T.; Staats, L.; Garneau, D.; Lesser, M. Wildlife Response to Wildfire in a Northern New York Jack Pine Barrens. Forests 2021, 12, 676. https://doi.org/10.3390/f12060676
Cave H, Adams M, Jaeger T, Peet T, Staats L, Garneau D, Lesser M. Wildlife Response to Wildfire in a Northern New York Jack Pine Barrens. Forests. 2021; 12(6):676. https://doi.org/10.3390/f12060676
Chicago/Turabian StyleCave, Hannah, Matthew Adams, Tristan Jaeger, Taylor Peet, Lloyd Staats, Danielle Garneau, and Mark Lesser. 2021. "Wildlife Response to Wildfire in a Northern New York Jack Pine Barrens" Forests 12, no. 6: 676. https://doi.org/10.3390/f12060676
APA StyleCave, H., Adams, M., Jaeger, T., Peet, T., Staats, L., Garneau, D., & Lesser, M. (2021). Wildlife Response to Wildfire in a Northern New York Jack Pine Barrens. Forests, 12(6), 676. https://doi.org/10.3390/f12060676