Article

Pinus Pollen Emission Patterns in Different Bioclimatic Areas of the Iberian Peninsula

by
María Fernández-González
1,*,
Beatriz Lara
2,
Estefanía González-Fernández
1,
Jesús Rojo
2,3,
Rosa Pérez-Badia
2 and
Fco. Javier Rodríguez-Rajo
1
1
Department of Plant Biology and Soil Sciences, University of Vigo, 32004 Ourense, Spain
2
Institute of Environmental Sciences—Botany, University of Castilla-La Mancha, 45071 Toledo, Spain
3
Department of Pharmacology, Pharmacognosy and Botany, Complutense University, 28040 Madrid, Spain
*
Author to whom correspondence should be addressed.
Forests 2021, 12(6), 688; https://doi.org/10.3390/f12060688
Submission received: 5 May 2021 / Revised: 21 May 2021 / Accepted: 25 May 2021 / Published: 27 May 2021
(This article belongs to the Special Issue Tree Pollen and Floral Biology)

Abstract

:
Background: In the Northern Hemisphere, pine forests predominate due to their natural distribution and silvicultural importance. Pinus tree species are large pollen producers. Nowadays, the context of climate change influences their distribution, abundance, growth and productivity. The objectives of the study were to assess the patterns of the Pinus flowering behavior regarding their pollen presence in the atmosphere and intensity in different bioclimatic areas of the Iberian Peninsula during recent years. Methods: The survey was carried out in three different biogeographic zones of Spain: Vigo (Eurosiberian region) and Ourense (transition area between the Eurosiberian and Mediterranean areas) located in northwest Spain and Toledo (Mediterranean area) placed in the center of the Iberian Peninsula. Airborne pollen was collected with volumetric traps in each study area from 1995 to 2019. Results: Pinus pollen showed a marked single pollination period during late March in the Eurosiberian region and April in the transition zone between the Eurosiberian and the Mediterranean area. Two different peaks with lower pollen intensity were detected during the pollen season in Toledo (Mediterranean area), the first during late March and the second from the end of May to the beginning of June. The trends detected revealed changes in the timing of the phenological cycle, such us longer pollen seasons and later end dates of the Main Pollen Season (MPS) in some cases. The mean Annual Pollen Integral (API) in the Eurosiberian area (Vigo) and transition zone (Ourense) was similar, with about 4400 pollen grains. In the Mediterranean area (Toledo), a lower API amount of 1618 pollen grains was recorded. A trend towards an increase of 126 and 80 pollen grains per year in the airborne pine load was detected in the transition and Mediterranean areas studied, respectively. Conclusions: The rates of the annual integral Pinus pollen percentage with respect to the total pollen of forest species in the atmosphere of the areas studied showed a decreasing percentage trend during the last years.

1. Introduction

The Pinus genus is very important from an ecological point of view in the Northern Hemisphere as its species are often dominant in forests [1] with a high representativeness in the pollen spectra of some regions [2]. In the south of Europe, numerous pine species naturally grow, forming mixed and pure coniferous forests [3]. In Mediterranean areas, pine species have been greatly influenced by humans who favored the extension of the forests for native species and included new allochthonous pine species in forest plantations [4].
In the Iberian Peninsula, pine forests together with oaks and holm oaks occupy most of the forest area. Native pine species are represented by P. halepensis Mill., P. pinaster Aiton, P. pinea L., P. nigra J.F. Arnold subsp. salzmanii (Dunal) Franco, P. sylvestris L. and P. uncinata Ram. In northwest Spain, the main pine forests are represented for P. pinaster, P. sylvestris and the introduced P. radiata D. Don, while, in the central part of the country, the main species are P. pinaster, P. sylvestris, P. pinea, P. nigra subsp. salzmanii and P. halepensis [5]. The real context of climatic change influences their distribution, abundance, growth and productivity during recent years [6]. The main effects of climatic change will be visible in Southern Europe in 2080, as the worst projection scenario has predicted an increase in the average annual temperature of 4–6 °C and a decrease in average annual precipitation of 15–20% [7]. These environmental changes will influence the expansion or restriction in the distribution area of some species [8,9]. In particular, forest is especially sensitive to climate change, since trees have a long lifespan, and this condition does not allow these plants to adapt quickly to environmental changes [10]. In addition, forest species are more vulnerable to climate change during the juvenile and reproductive phases, since the root system is not yet fully developed for young plants, and, during the reproductive phase, forest species need favorable climatic conditions to produce more seeds [11]. Other factors, such as fires, diseases, changes in the atmospheric composition [12] or anthropogenic activities, also have important impacts on biological systems [13].
Some investigations identified the Pinus pollen as one of the most abundant airborne forest pollen taxa in the atmosphere of some regions of the Iberian Peninsula during spring or early summer [2,14,15]. Together with Quercus pollen, they constitute the main pollens coming from arboreal species associated with non-riparian forests, and thus have high ecological value for monitoring [16]. Pine forests produce a higher quantity of pollen than other plants such as grasses or herbs, reaching values of 100–1000 kg/ha [17]. All the Southern Europe Pinus species are recognized as large pollen producers, estimated as between 20.9 and 32.3 million pollen grains per tree in the case of P. pinaster [18].
The knowledge of airborne pollen in a given area is a useful tool to obtain information on the phenology and distribution of plants [19,20,21], crop production [22,23,24] and conservation of biodiversity [16,25,26]. Furthermore, airborne pollen data and their trends can be used as accurate indicators of environmental changes [27,28,29,30].
The main goals of the study were to study the patterns of the Pinus pollen production and flowering behavior in different bioclimatic areas of the Iberian Peninsula and analyze the long-term trends in pollen timing and intensity. The climatic variables that influence long-term changes of airborne pollen and their trends were also assessed, since Pinus pollen plays an important ecological role in native forest ecosystems and human-managed forest stands.

2. Materials and Methods

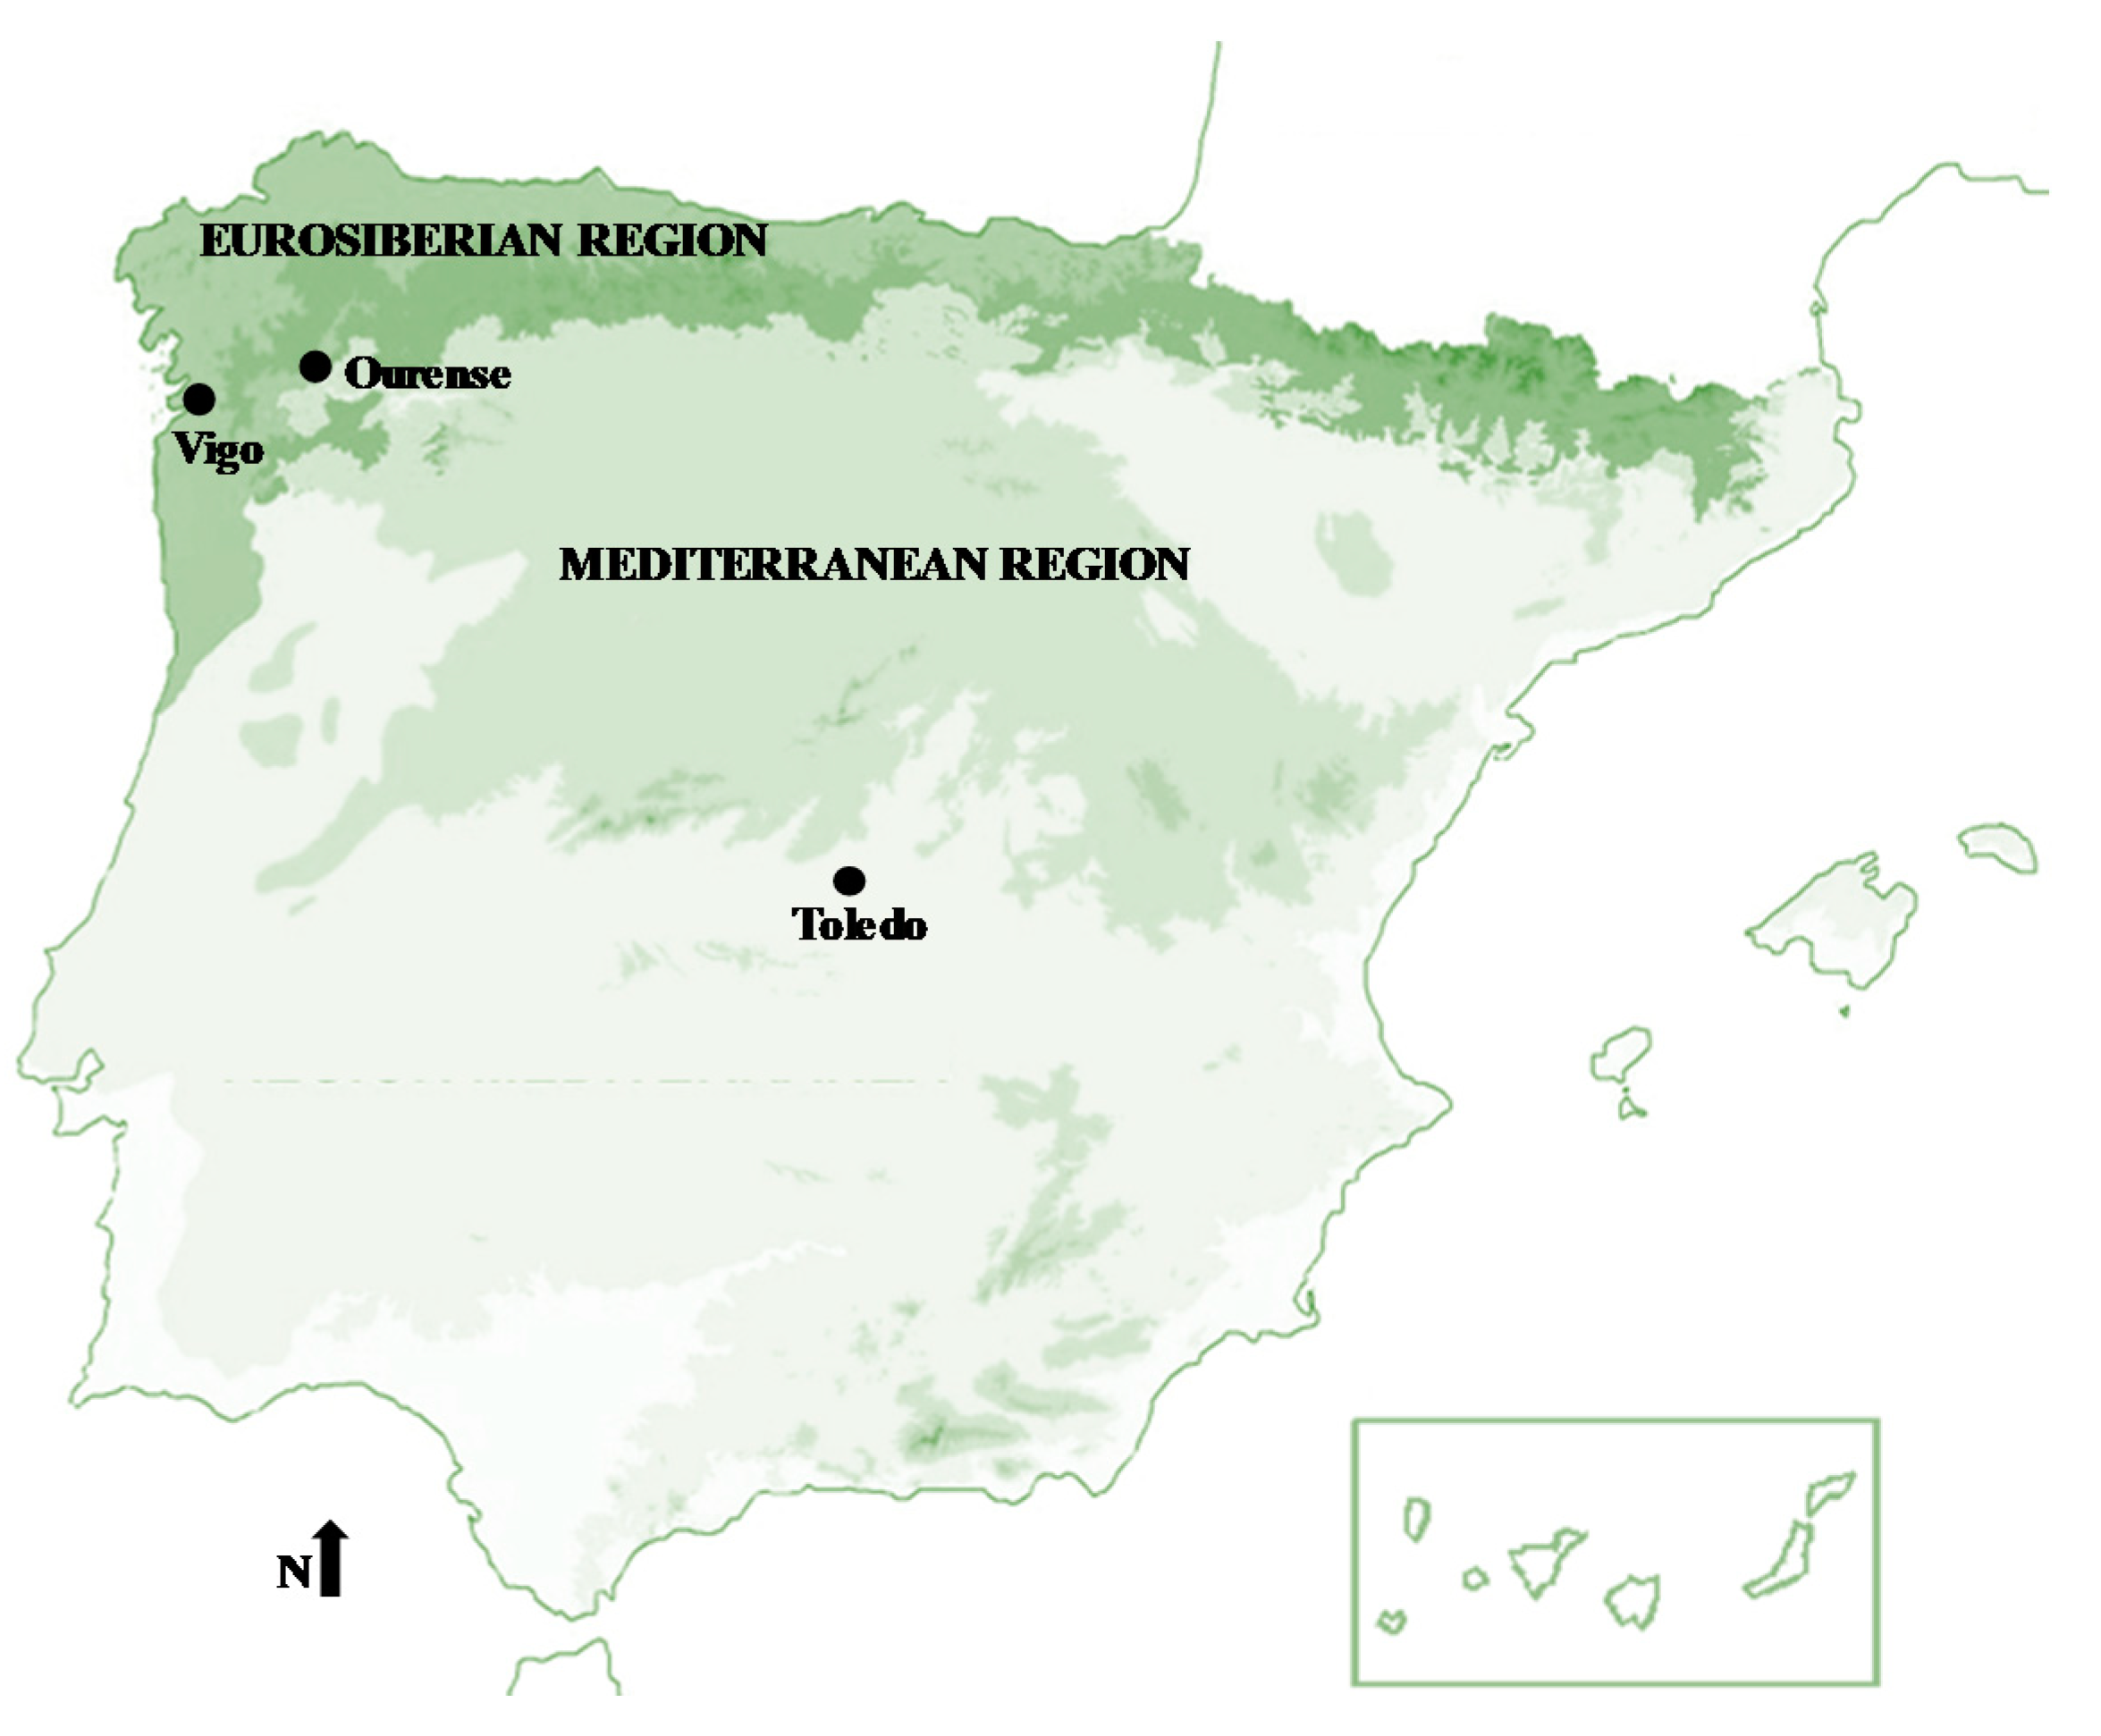
2.1. Characterization and Locations of Study Areas

The study was carried out in different bioclimatic and biogeographic areas of Spain: Vigo (Eurosiberian biogeographic region) and Ourense (transition area between the Eurosiberian and Mediterranean areas) located in northwest Spain and Toledo (Mediterranean biogeographic region) placed in the central area of the Iberian Peninsula (Figure 1). The city of Vigo (42°14′ N; 8°44′ W) is located on the southern bank of an estuary on the Atlantic coast; its climate is temperate maritime, although with some Mediterranean aspects, with an average annual temperature of 14 °C and annual total rainfall of 1791 mm [31]. Ourense (42°20′ N; 7°52′ W) is located in a depression at 139 m above sea level with a climate of greater Mediterranean influence represented by warm temperatures and low humidity, with an average annual temperature of 14.9 °C and annual total rainfall of 811 mm [31]. Toledo (39°51′ N; 4°02′ W) is located at 450 m above sea level in central Spain with a warmer and drier climate characterized by an average annual temperature of 15.8 °C and annual total rainfall of 342 mm [31].

2.2. Airborne Pollen Study

Airborne pollen was collected using Lanzoni VPPS-2000 volumetric traps [32], from 1995 to 2019 in Vigo and Ourense (Northwest Iberian Peninsula) and from 2003 to 2019 in Toledo (central Iberian Peninsula). The samples obtained were processed following the standardized methodology of the Spanish Aerobiological Network [33]. Pollen data were expressed as pollen grains per cubic meter of air for the Annual Pollen Integral (API) and the daily pollen concentrations [34]. To calculate the Main Pollen Season (MPS) parameters, we used the AeRobiology software package [35]. The MPS was calculated using a pollen emission model that fits a nonlinear logistic regression model to the values of the accumulated sum of daily airborne pollen concentration sampled over a year [36,37].

2.3. Meteorological Data

The meteorological data, namely maximum, minimum and average temperatures (°C), rainfall (mm) and relative humidity (%), were continuously monitored by the meteorological stations of the Galician Institute for Meteorology and Oceanography METEOGALICIA “Ourense” and “Vigo” placed in both areas at 300 m from the pollen samplers. In the city of Toledo, the weather data were provided by the Spanish Meteorological Agency (AEMET) located 2 km from the pollen trap.

2.4. Statistical Analysis

To estimate the increasing or decreasing trends of the aerobiological and meteorological parameters, we performed linear regression analysis. Spearman correlation analyses were conducted between the MPS characteristics (start, end and length dates of the MPS, pollen integral, pollen peak concentration and pollen peak day) and the meteorological variables (maximum, minimum and average temperatures, rainfall and relative humidity) to test the statistical dependence. For the statistical analyses, IBM SPSS Statistics 24.0 software was applied.

3. Results

Pinus airborne pollen was recorded in the atmosphere of Vigo (Eurosiberian area) from Week 4 to Week 26 (late January–late June) of the year (Figure 2), two weeks later in the transition area of Ourense from Week 7 to Week 28 (mid-February–early July) and in the Mediterranean area between Week 11 and Week 26 (mid-March–late June).
The main pollen concentrations were observed in the atmosphere of northwestern Spain during the spring months. In the Eurosiberian study area of Vigo, the MPS began on average on 25 February and ended two months later on 24 April (following the logistic method for the definition of the pollen season), registering a similar relative standard deviation (around 18%) for the start and end dates. The earliest start of the MPS occurred on 2 January 2001 and the latest on 27 March 2018. The earliest date of the end of the MPS was observed on 24 March 2000 and the latest on 12 June 2013. The average duration of the MPS was 60 days, with a range from 22 days in 2000 to 138 days in 2001. The average API was 4420 pollen grains/m3 with a maximum pollen peak (1222 pollen grains/m3) on 26 March 2002 (Table 1).
The mean MPS began in the transition area of Ourense on 13 March and ended on 30 April, with a relative standard deviation around 12%. The year with the earliest start date of the MPS was 1998 (22 February) and the latest in 2018 (17 April). The earliest end date was 7 April 1997 and the latest one was recorded on 31 May 2016. The average duration of the MPS was 50 days, ranging from 26 days in 2003 to 99 days in 2016. The average API was 4405 pollen grains/m3 with a maximum pollen peak of 1003 pollen grains/m3 recorded on 25 March 2002 (Table 2).
In the Mediterranean area of Toledo, the Pinus pollen MPS occurred during spring and early summer. The average start date during the study period was registered on 6 March and the end date on 29 June, with relative standard deviations of around 13% and 15%, respectively. The earliest start date was observed on 18 February 2008, while 2015 registered the latest date (11 April). The earliest MPS end date was on 2 June 2017 and the latest one occurred on 25 July in both 2016 and 2018. The average duration of the MPS was 116 days, with a range from 74 days in 2015 to 154 days in 2016. The average API was 1618 pollen grains/m3 with a pollen peak of 503 pollen grains/m3 on 1 April 2014 (Table 3).
Pinus pollen represented on average around 28–41% of the total annual pollen of forest tree species registered in the atmosphere of Vigo and Ourense, respectively. Figure 3 shows a negative trend in the percentage of Pinus pollen registered in the atmosphere over the year with respect to the total airborne pollen of forest tree species present, being more pronounced in Vigo (decrease of 1.498% of relative abundance by year) than in Ourense (decrease of 0.731% by year). This reduction may indicate that the Pinus forests in both study areas are decreasing and being replaced by other taxa, such as Quercus, which showed an increase of around 0.7% of relative abundance in the total pollen of trees registered in the atmosphere of the Eurosiberian and transition areas (Figure 3). In the case of Toledo (Mediterranean area), there is no significant trend for either Pinus or Quercus.
To elucidate the meteorological parameters that influence the seasonal dynamics and intensity of the airborne pine pollen, a Spearman correlation study was carried out with the average values of the meteorological variables registered during the MPS and the previous month in the years of the study (Table 4). The start date of the MPS was synchronized with the main meteorological parameters, since water-related variables (rainfall and relative humidity) were negatively correlated with the MPS start date in the Eurosiberian and transition areas, while they were positively correlated in the Mediterranean area. Temperatures were positively correlated with the MPS start date in the Eurosiberian region. The end of the MPS was delayed as a consequence of higher values of the variables related to water (rainfall and relative humidity) in the Eurosiberian region and the minimum temperature in the transition and Mediterranean areas. The length of the MPS increased with higher rainfall and minimum temperature, depending on the bioclimatic area. The API was positively influenced by rainfall and maximum temperatures in the Mediterranean area, whereas it was negatively influenced by the water-related parameters (rainfall and relative humidity) in the Eurosiberian area and the rainfall and minimum temperatures in the transition area. The peak dates were delayed as a consequence of higher minimum temperatures in the Eurosiberian area and high values of the water-related parameters in the Mediterranean area.
In addition, a regression study was carried out to elucidate the trends observed in recent years (Table 5 and Figure 4). Considering the weather variables during the MPS, we obtained significant trends in the Eurosiberian bioclimatic area for minimum and average temperatures with increases of 0.169 and 0.078 °C per year, respectively. The same behavior was observed over the pollen pre-peak period for the minimum temperatures and over the post-peak period for the average temperature (Table 5). Significant statistical trends were obtained in the Eurosiberian region for the end of the MPS and the pollen peak date, since the average dates happened in both cases 0.994 days later per year (Figure 4). In the transition zone between the Eurosiberian and Mediterranean areas, a significant trend was detected towards a delay in the end of the MPS of 0.961 days per year, as well as an increase in the API of 126 pollen grains per year (Figure 4). Considering the meteorological variables, we detected a significant and positive increased trend with the minimum temperatures during the post-peak period. Finally, in the Mediterranean area, an increasing trend in the API of 80 pollen grains per year was found.
Finally, the correlations between the API and rainfall during the MPS in all years in the three bioclimatic areas of the study showed a negative relationship, with the highest Spearman coefficient observed in Vigo (0.504 p < 0.01). The years with less precipitation produced more pollen (Figure 5).

4. Discussion

During the last decades, several studies have investigated the vulnerability of forests to pressures related to the environmental impacts of global climate change [38,39], pests and diseases [40,41], wildfires or anthropological actions such us changes in land use [42] and pollution [43]. Aerobiological variables represent a useful tool to evaluate the variation in the seasonal dynamics of these ecosystems with multiple applications [16,44,45].
Pinus forests cover an extensive area on the Northern Hemisphere, often being the predominant species in boreal, subalpine, temperate and even arid conditions [1,46]. Pines belong to the natural Mediterranean vegetation [3], but this genus was profoundly favored and used as a key tree for land afforestation during the first half of the 20th century throughout the Eurosiberian and Mediterranean areas [4,47]. The choice of pine species in afforestation programs is the results of their suitability for timber, resin and food industries, as well as their fast growth and resistance for the recovery of deforested or fire-damaged areas, where they act as pioneer species [48]. Currently, pine forests represent around 28% of the area occupied by wooded forest formations in Spain [5]. However, the distribution throughout the Iberian Peninsula is very irregular, not only following natural areas with optimal environmental characteristics for pine forests, but also because of the different afforestation efforts in different regions using different pine species depending on the area [49]. Plantations using the native P. pinaster and the allochthonous P. radiata have been extended in the northwest areas of the Iberian Peninsula (surroundings of Vigo and Ourense). In the vicinity of the city of Toledo, however, pine afforestation is less common, although the native P. halepensis and P. pinea have been often used in parks and recreational areas. Therefore, the human influence on the Pinus pollen concentrations is very relevant.
Pinus pollen showed a marked single pollination period (one main pollen peak) during late March in the Eurosiberian region and the month of April in the transition zone between the Eurosiberian and the Mediterranean area. Otherwise, two pollination periods were detected in the Mediterranean area: the first period recorded from mid-March to the early April and the second period recorded between the late May to the early June. The distribution of the species of the genus and the differences on the timing of their flowering periods in each study area can explain these differences. Several investigations have indicated that the phenology and MPS of different pine species are regulated by their sensitivity to biometeorological and weather conditions [50,51]. For example, P. halepensis, P. pinea and P. pinaster show less sensitivity to winter temperatures and better withstand the summer drought in the first months of the year [50,51]. Other species such as P. halepensis shows relationships with mid-winter temperatures and intermediate annual rainfall values [52]. These differences between species can explain the temporal variations in the MPS among the three bioclimatic areas, since the flowering period takes place first in Vigo, then in Ourense and later in Toledo. However, this phenological pattern may also be due to the altitudinal gradient from northwestern to central areas of the Iberian Peninsula (from 0 to 450 m above sea level) [53].
Temperature is the meteorological variable with the greatest influence on the synchronization of ecological processes [2,28,54,55]. Not only are changes observed at shorter time scales, but longer-term trends in climate also impact biological processes [56]. Climate change has already been shown to be an important factor in timing and intensity of pollination [21,29]. Our study detected a statistically significant positive trend in minimum and average temperatures throughout all study years in the Eurosiberian region. In addition, a decrease in relative humidity was detected in the Mediterranean study area throughout the year. These weather variations can induce changes in the phenological cycle of the pine genus members, such us a longer pollen season. In the case of the Eurosiberian and the transition areas, a significant trend was detected towards the delay of the end of the MPS of around one day per year. Similar results have been observed in other studies conducted across Europe [2,57].
The average API in the Eurosiberian and transition areas studied was similar, with around 4400 pollen grains. A trend towards an increase of 126 and 80 pollen grains per year in the airborne pollen load of pine was detected in Ourense (transition site) and Toledo (Mediterranean site), respectively, according to the findings noted by several authors [27,58]. In the Eurosiberian area, a not significant decrease in the trend of the API was detected, as a consequence of the expansion in the area of invasive species of pine tree pests such as Leptoglossus occidentalis (Hemiptera, Coreidae) [59]. In the Mediterranean area studied, a lower API amount of 1618 pollen grains was registered; these results agree with the data presented by De Linares et al. [2]. The high Pinus pollen concentrations recorded in northwestern Spain induces important ecological modifications in the timings of other bio-ecosystems, increasing their primary productivity in the non-favorable season of the year [60,61,62]. Pollen grains decompose rapidly in aquatic and terrestrial ecosystems, releasing large amounts of nutrient-rich matter [63,64,65,66]. Several authors pointed out that input pulses of individual elements by pine pollen rains can reach 0.3–0.5 kg/ha N, 0.04–0.07 kg/ha P, 0.1–0.2 kg/ha K, 0.02 kg/ha S and 0.01 kg/ha Mg [64,67,68] during the atmospheric pine pollen season. Terrestrial detritivores and fungi are some of the most benefited organisms, providing ecosystems with other additional limiting elements such as C:N:P, and especially K, S and Cu [62]. Maggs [69] showed that, although pollen grains only constitute 3.5% of the total annual biomass of pine litter for decomposition, they represent more than 30% of the total amount of N, P and K deposited in their associated bio-ecosystems. Thus, intensive pollen rains can temporally mitigate limiting nutritional periods for primary production experienced in terrestrial and aquatic ecosystems [62]. The highest concentrations of pine pollen recorded in the Eurosiberian area of northwestern Spain can act as a temporary pulse of nutrients during early spring for their important maritime fisheries for fish and shellfish. Spring pollen rains dominated by anemophilic trees have been shown to move considerable amounts of nutrients from terrestrial to aquatic ecosystems [60,66] when young detritivores develop and have their largest nutritional requirements [70]. This fact allows the proliferation of microalgae in early spring, increasing the primary productivity rates of the maritime area [60] in the Eurosiberian zone of northwestern Spain.
Pine pollen grains represent 22–32% of the annual total of tree pollen in the atmosphere of northwestern Spain, even though Pinus spp. forests only represent 17–25% of the forest areas in the provinces studied [5]. Likewise, the National Forest Inventory of Spain registered that Pinus spp. forests represent 3% of the total area of forests, while 8% of the tree pollen grains registered during the year in the atmosphere belongs to the genus Pinus [5]. When we analyze these rates of Pinus pollen percentage with respect to the total pollen of the forest species in the areas studied, a decreasing percentage trend was detected in recent years in the northwest of the Iberian Peninsula. This tendency could indicate a restoration of natural oak forests in the Eurosiberian area as a sign of ecological maturity of the vegetation distribution [71,72,73,74]. Previous studies in the Eurosiberian and transition areas observed a trend of continuous growth of autochthonous oak forest during the last two decades [74,75,76]. The changes were mainly due to variations in land use through reforestation or the natural regeneration of abandoned agricultural lands. On the contrary, natural oak forests have been replaced by dry olive groves, reducing their representation in the atmosphere in some Mediterranean areas [77] and resulting in low percentages of pine forest areas compared to the total surface of tree forests.
Pollen production and dispersal are more strongly modulated by water-related climate variables. Our study shows that rainy years registered a lower API, and vice versa for dry years. This behavior was pointed out by several authors in different areas [73,78,79,80,81]. Furthermore, relative humidity during the MPS showed a significant negative correlation with pollen concentrations. The behavior of these two variables could indicate that pollen absorbs humidity from the air, which induces an increase in the weight of the pollen and a deposition closer to the pollinating tree.

5. Conclusions

Pinus pollen showed a marked single pollination period during late March in the Eurosiberian region or in April in the transition zone between the Eurosiberian and Mediterranean areas. Two pollination periods were observed in the Mediterranean area, the first recorded at the end of March and the second between late May and the beginning of June. The trends detected in the meteorological variables for the three study areas induced changes in the phenological cycle of the pine genus, such us longer pollen seasons and delays in the end of the MPS. The mean API in the studied Eurosiberian and transition areas was 2–3 times higher than the one recorded in the Mediterranean area studied. A trend towards an increase of 126 and 80 pollen grains per year in the atmospheric load of pine was detected in the transition and Mediterranean areas studied, respectively. The annual percentage of the Pinus integral with respect to the total pollen of forest species in the areas studied showed a decreasing trend during recent years. This tendency could indicate a restoration of natural oak forests in the Eurosiberian area as a sign of ecological maturity of the vegetation distribution.

Author Contributions

Conceptualization, M.F.-G., J.R., R.P.-B. and F.J.R.-R.; methodology, M.F.-G., J.R., E.G.-F. and B.L.; formal analysis, M.F.-G. and J.R.; data curation, M.F.-G., J.R., E.G.-F. and B.L.; writing—original draft preparation, M.F.-G. and J.R.; writing—review and editing, M.F.-G., J.R., R.P.-B. and F.J.R.-R.; and supervision, R.P.-B. and F.J.R.-R. All authors have read and agreed to the published version of the manuscript.

Funding

This research received no external funding.

Institutional Review Board Statement

Not applicable.

Informed Consent Statement

Not applicable.

Data Availability Statement

Data sharing is not applicable to this article.

Acknowledgments

We thank the Xunta de Galicia under Project ED431C 2017/62-GRC “Programa de Consolidación e Estruturación de Unidades de Investigación Competitivas (Grupos de Referencia Competitiva)” and the Ministry of Science and Innovation of the Spanish Government through the project SICAAP-CPI RTI2018-096392-B-C22, as well as the Consejería de Desarrollo Sostenible de la Junta de Comunidades de Castilla–La Mancha, for its support for the Castilla-La Mancha Aerobiology Network (AEROCAM).

Conflicts of Interest

The authors declare no conflict of interest.

References

  1. Richardson, D.M.; Rundel, P.W. Ecology and biogeography of Pinus: An introduction. In Ecology and Biogeography of Pinus; Richardson, D.M., Ed.; Cambridge University Press: Cambridge, UK, 1998; pp. 3–49. [Google Scholar]
  2. De Linares, C.; Delgado, R.; Aira, M.J.; Alcázar, P.; Alonso-Pérez, S.; Boi, M.; Cariñanos, P.; Cuevas, E.; Díaz de la Guardia, C.; Elvira-Rendueles, B.; et al. Changes in the Mediterranean pine forest: Pollination patterns and annual trends of airborne pollen. Aerobiologia 2017, 33, 375–391. [Google Scholar] [CrossRef]
  3. San-Miguel-Ayanz, J.; De Rigo, D.; Caudullo, G.; Houston Durrant, T.; Mauri, A. European Atlas of Forest Tree Species; European Commission: Luxembourg, 2016. [Google Scholar]
  4. Barberó, M.; Loisel, R.; Quézel, P.; Richardson, D.M.; Romane, F. Pines of the Mediterranean basin. In Ecology and Biogeography of Pinus; Richardson, D.M., Ed.; Cambridge University Press: Cambridge, UK, 1998; pp. 153–170. [Google Scholar]
  5. DGCN; IFN3. Tercer Inventario Forestal Nacional, IFN3 (1997–2007) [Third National Forest Inventory, IFN3 (1997–2007)]; Ministerio de Medio Ambiente: Madrid, Spain, 2007; Available online: http://www.magrama.gob.es/es/biodiversidad/servicios/banco-datos-naturaleza/informacion-disponible/ifn3.aspx (accessed on 15 November 2020).
  6. Barrio-Anta, M.; Castedo-Dorado, F.; Cámara-Obregón, A.; López-Sánchez, C.A. Predicting current and future suitable habitat and productivity for Atlantic populations of maritime pine (Pinus pinaster Aiton) in Spain. Ann. For. Sci. 2020, 77, 41. [Google Scholar] [CrossRef]
  7. EEA. Climate Change, Impacts and Vulnerability in Europe 2016; An Indicator-Based Report, European Environment Agency Report N° 1; EEA: Copenhagen, Denmark, 2017. [Google Scholar]
  8. Monzón, J.; Moyer-Horner, L.; Palamar, M.B. Climate change and species range dynamics in protected areas. BioScience 2011, 61, 752–761. [Google Scholar] [CrossRef] [Green Version]
  9. Bellard, C.; Bertelsmeier, C.; Leadley, P.; Thuiller, W.; Courchamp, F. Impacts of climate change on the future of biodiversity. Ecol. Lett. 2012, 15, 365–377. [Google Scholar] [CrossRef] [PubMed] [Green Version]
  10. Davis, M.E.; Shaw, R.G.; Etterson, J.R. Evolutionary responses to climate change. Ecology 2005, 86, 1704–1714. [Google Scholar] [CrossRef]
  11. Pereira, J.S.; Correia, A.V.; Correia, C.V.; Ferreira, M.T.; Onofre, N.; Freitas, H.; Godinho, F. Florestas e biodiversidade. In Alterações Climáticas em Portugal. Cenários, Impactos e Medidas de Adaptação (Projecto SIAM II); Santos, F.D., Miranda, P.M.A., Eds.; Gradiva: Lisbon, Portugal, 2006; pp. 301–344. [Google Scholar]
  12. Lindner, M.; Maroschek, M.; Netherer, S.; Kremer, A.; Barbati, A.; Garcia-Gonzalo, J.; Seidl, R.; Delzon, S.; Corona, P.; Kolström, M.; et al. Climate change impacts, adaptive capacity, and vulnerability of European forest ecosystems. For. Ecol. Manag. 2010, 259, 698–709. [Google Scholar] [CrossRef]
  13. Rosenzweig, C.; Karoly, D.; Vicarelli, M.; Neofotis, P.; Wu, Q.; Casassa, G.; Menzel, A.; Root, T.L.; Estrella, N.; Seguin, B.; et al. Attributing physical and biological impacts to anthropogenic climate change. Nature 2008, 453, 353–357. [Google Scholar] [CrossRef]
  14. Rodríguez-Rajo, F.J.; Jato, V.; Aira, M.J. Pollen content in the atmosphere of Lugo (NW Spain) with reference to meteorological factors (1999–2001). Aerobiologia 2003, 19, 213–225. [Google Scholar] [CrossRef]
  15. Docampo, S.; Recio, M.; Trigo, M.M.; Melgar, M.; Cabezudo, B. Risk of pollen allergy in Nerja (southern Spain): A pollen calendar. Aerobiologia 2007, 23, 189–199. [Google Scholar] [CrossRef]
  16. Schermer, É.; Bel-Venner, M.C.; Fouchet, D.; Siberchicot, A.; Boulanger, V.; Caignard, T.; Thibaudon, M.; Oliver, G.; Nicolas, M.; Gaillard, J.M.; et al. Pollen limitation as a main driver of fruiting dynamics in oak populations. Ecol. Lett. 2019, 22, 98–107. [Google Scholar] [CrossRef] [Green Version]
  17. Greenfield, L. Plant pollen production in selected tree species. Canterb. Bot. Soc. J. 1996, 31, 10–13. [Google Scholar]
  18. Tormo, R.; Muñóz, A.; Silva, I.; Gallardo, F. Pollen production in anemophilous trees. Grana 1996, 35, 38–46. [Google Scholar]
  19. Lo, F.; Bitz, C.M.; Battisti, D.S.; Hess, J.J. Pollen calendars and maps of allergenic pollen in North America. Aerobiologia 2019, 35, 613–633. [Google Scholar] [CrossRef] [Green Version]
  20. Lugonja, P.; Brdar, S.; Simović, I.; Mimić, G.; Palamarchuk, Y.; Sofiev, M.; Šikoparija, B. Integration of in situ and satellite data for top-down mapping of Ambrosia infection level. Remote Sens. Environ. 2019, 235, 111455. [Google Scholar] [CrossRef]
  21. Rojo, J.; Orlandi, F.; Ben Dhiab, A.; Lara, B.; Picornell, A.; Oteros, J.; Msallem, M.; Fornaciari, M.; Pérez-Badia, R. Estimation of Chilling and Heat Accumulation Periods Based on the Timing of Olive Pollination. Forests 2020, 11, 835. [Google Scholar] [CrossRef]
  22. Fernández-González, M.; Rodríguez-Rajo, F.J.; Jato, V.; Escuredo, O.; Aira, J.M. Estimation of yield ‘‘Loureira’’ variety with an aerobiological and phenological model. Grana 2011, 50, 63–72. [Google Scholar] [CrossRef]
  23. Tormo-Molina, R.; Gonzalo-Garijo, M.A.; Silva-Palacios, I.; Muñoz-Rodríguez, A.F. General trends in airborne pollen production and pollination periods at a Mediterranean site (Badajoz, Southwest Spain). J. Investig. Allergol. Clin. Immunol. 2010, 20, 567–574. [Google Scholar] [PubMed]
  24. Orlandi, F.; Rojo, J.; Picornell, A.; Oteros, J.; Pérez-Badia, R.; Fornaciari, M. Impact of Climate Change on Olive Crop Production in Italy. Atmosphere 2020, 11, 595. [Google Scholar] [CrossRef]
  25. Cariñanos, P.; Galán, C.; Alcázar, P.; Domínguez, E. Airborne pollen records and status of the anemophilous flora in arid areas of the Iberian Peninsula. J. Arid. Environ. 2010, 74, 1102–1105. [Google Scholar] [CrossRef]
  26. Womack, A.M.; Bohannan, B.J.M.; Green, J.L. Biodiversity and biogeography of the atmosphere. Philos. Trans. R. Soc. B 2010, 365, 3645–3653. [Google Scholar] [CrossRef] [Green Version]
  27. Ziello, C.; Sparks, T.H.; Estella, N.; Belmonte, J.; Bergmann, K.; Bucher, E.; Brighetti, M.; Damialis, A.; Detandt, M.; Galán, C.; et al. Changes to airborne pollen counts across Europe. PLoS ONE 2012, 7, e34076. [Google Scholar] [CrossRef]
  28. Galán, C.; Alcázar, P.; Oteros, J.; García-Mozo, H.; Aira, M.J.; Belmonte, J.; Diaz de la Guardia, C.; Fernández-González, D.; Gutierrez-Bustillo, M.; Moreno-Grau, S.; et al. Airborne pollen trends in the Iberian Peninsula. Sci. Total Environ. 2016, 550, 53–59. [Google Scholar] [CrossRef]
  29. Ziska, L.H.; Makra, L.; Harry, S.K.; Bruffaerts, N.; Hendrickx, M.; Coates, F.; Saarto, A.; Thibaudon, M.; Oliver, G.; Damialis, A.; et al. Temperature-related changes in airborne allergenic pollen abundance and seasonality across the northern hemisphere: A retrospective data analysis. Lancet Planet. Health 2019, 3, e124–e131. [Google Scholar] [CrossRef] [Green Version]
  30. Rojo, J.; Picornell, A.; Oteros, J.; Werchan, M.; Werchan, B.; Bergmann, K.-C.; Smith, M.; Weichenmeier, I.; Schmidt-Weber, C.B.; Buters, J. Consequences of climate change on airborne pollen in Bavaria, Central Europe. Reg. Environ. Chang. 2021, 20, 9. [Google Scholar] [CrossRef]
  31. AEMET Agencia Estatal de Meteorología. Guía Resumida del Clima en España 1981–2010; Ministerio de Agricultura y Pesca, Alimentación y Medio Ambiente: Madrid, Spain, 2017. [Google Scholar]
  32. Hirst, J.M. An automatic volumetric spore-trap. Ann. Appl. Biol. 1952, 36, 257–265. [Google Scholar] [CrossRef]
  33. Galán, C.; Cariñanos, P.; Alcázar, P.; Domínguez, E. Spanish Aerobiology Network: Management and Quality Manual; University of Córdoba: Córdoba, Spain, 2007; pp. 1–61. [Google Scholar]
  34. Galán, C.; Ariatti, A.; Bonini, M.; Clot, B.; Crouzy, B.; Dahl, A.; Fernandez-González, D.; Frenguelli, G.; Gehrig, R.; Isard, S.; et al. Recommended terminology for aerobiological studies. Aerobiologia 2017, 33, 293–295. [Google Scholar] [CrossRef]
  35. Rojo, J.; Picornell, A.; Oteros, J. AeRobiology: The computational tool for biological data in the air. Methods Ecol. Evol. 2019, 10, 1371–1376. [Google Scholar] [CrossRef] [Green Version]
  36. Cunha, M.; Abreu, I.; Pinto, P.; Castro, R. Airborne pollen samples for early-season estimates of wine production in a Mediterranean climate of Northern Portugal. Am. J. Enol. Vitic. 2003, 54, 189–194. [Google Scholar]
  37. Ribeiro, H.; Cunha, M.; Abreu, I. Definition of the main pollen season using a logistic model. Ann. Agric. Environ. Med. 2007, 14, 159–167. [Google Scholar]
  38. Anderegg, W.R.; Kane, J.M.; Anderegg, L.D. Consequences of widespread tree mortality triggered by drought and temperature stress. Nat. Clim. Chang. 2013, 3, 30–36. [Google Scholar] [CrossRef]
  39. Li, D.; Wu, S.; Liu, L.; Zhang, Y.; Li, S. Vulnerability of the global terrestrial eco-systems to climate change. Glob. Chang. Biol. 2018, 24, 4095–4106. [Google Scholar] [CrossRef]
  40. Seidl, R.; Schelhaas, M.J.; Rammer, W.; Verkerk, P.J. Increasing forest disturbances in Europe and their impact on carbon storage. Nat. Clim. Chang. 2014, 4, 806. [Google Scholar] [CrossRef] [Green Version]
  41. Thom, D.; Seidl, R. Natural disturbance impacts on ecosystem services and bio-diversity in temperate and boreal forests. Biol. Rev. 2016, 91, 760–781. [Google Scholar] [CrossRef]
  42. Smith, P.; House, J.I.; Bustamante, M.; Sobocká, J.; Harper, R.; Pan, G.; West, P.C.; Clark, J.M.; Adhya, T.; Rumpel, C.; et al. Global change pressures on soils from land use and management. Glob. Chang. Biol. 2016, 22, 1008–1028. [Google Scholar] [CrossRef]
  43. Kume, A.; Fujimoto, M.; Mizoune, N.; Honoki, H.; Nakajima, H.; Ishida, M. Impact of reduced ozone concentration on the mountain forests of Mt. Tateyama, Japan. Environ. Pollut. 2020, 267, 115407. [Google Scholar] [CrossRef] [PubMed]
  44. Skjøth, C.A.; Baker, P.; Sadyś, M.; Adams-Groom, B. Pollen from alder (Alnus sp.), birch (Betula sp.) and oak (Quercus sp.) in the UK originate from small woodlands. Urban Clim. 2015, 14, 414–428. [Google Scholar] [CrossRef]
  45. Ghasemifard, H.; Ghada, W.; Estrella, N.; Lüpke, M.; Oteros, J.; Damialis, A.; Traidl-Hoffmann, C.; Buters, J.; Menzel, A. High post-season Alnus pollen loads successfully identified as long-range transport of an alpine species. Atmos. Environ. 2020, 231, 117453. [Google Scholar] [CrossRef]
  46. Gernandt, D.S.; López, G.G.; García, S.O.; Liston, A. Phylogeny and classification of Pinus. Taxon 2005, 54, 29–42. [Google Scholar] [CrossRef] [Green Version]
  47. Montero, G. Pinus Pine (“Pinus pinea L.”) in Andalusia: Ecology, Distribution and Forestry; Junta de Andalucia: Seville, Spain, 2004. [Google Scholar]
  48. Sheffer, E. A review of the development of Mediterranean pine–oak ecosystems after land abandonment and afforestation: Are they novel ecosystems? Ann. For. Sci. 2012, 69, 429–443. [Google Scholar] [CrossRef] [Green Version]
  49. Tapias, R.; Climent, J.; Pardos, J.A.; Gil, L. Life histories of Mediterranean pines. Plant Ecol. 2004, 171, 53–68. [Google Scholar] [CrossRef]
  50. Frenguelli, G.; Tedeschini, E.; Veronesi, F.; Bricchi, E. Airborne pine (Pinus spp.) pollen in the atmosphere of Perugia (Central Italy): Behaviour of pollination in the two last decades. Aerobiologia 2002, 18, 223–228. [Google Scholar] [CrossRef]
  51. Castroviejo, S. Flora Iberica. Nord. J. Bot. 2003, 22, 686. [Google Scholar] [CrossRef]
  52. Thuiller, W.; Vayreda, J.; Pino, J.; Sabate, S.; Lavorel, S.; Garcia, C. Large-scale environmental correlates of forest tree distributions in Catalonia (NE Spain). Glob. Ecol. Biogeogr. 2003, 12, 313–325. [Google Scholar] [CrossRef] [Green Version]
  53. Rojo, J.; Pérez-Badia, R. Effects of topography and crown-exposure on olive tree phenology. Trees 2014, 28, 449–459. [Google Scholar] [CrossRef]
  54. Fu, Y.H.; Zhao, H.; Piao, S.; Peaucelle, M.; Peng, S.; Zhou, G.; Ciais, P.; Huang, M.; Menzel, A.; Peñuelas, J.; et al. Declining global warming effects on the phenology of spring leaf unfolding. Nature 2015, 526, 104–107. [Google Scholar] [CrossRef] [Green Version]
  55. Orlandi, F.; García-Mozo, H.; Galán, C.; Romano, B.; Díaz de la Guardia, C.; Ruiz, L. Olive flowering trends in a large Mediterranean area (Italy and Spain). Int. J. Biometeorol. 2010, 54, 151–163. [Google Scholar] [CrossRef]
  56. Garcia, R.A.; Cabeza, M.; Rahbek, C.; Araujo, M.B. Multiple Dimensions of Climate Change and Their Implications for Biodiversity. Science 2014, 344, 1247579. [Google Scholar] [CrossRef] [PubMed] [Green Version]
  57. Makra, L.; Matyasovszky, I.; Deák, A.J. Trends in the characteristics of allergenic pollen circulation in central Europe based on the example of Szeged, Hungary. Atmos. Environ. 2011, 45, 6010–6018. [Google Scholar] [CrossRef]
  58. Damialis, A.; Halley, J.M.; Gioulekas, D.; Vokou, D. Long-term trends in atmospheric pollen levels in the city of Thessaloniki, Greece. Atmos. Environ. 2007, 41, 7011–7021. [Google Scholar] [CrossRef]
  59. Valcarcel, J.P.; Pilona, F.P. The contribution of registers photographs for wildlife studies: The case of the iberobalear expansion of the invasive species Leptoglossus Occidentalis Heidemann, 1910 (Hemiptera, Coreidae). Arq. Entomol. 2010, 4, 42–52. [Google Scholar]
  60. Graham, M.D.; Vinebrooke, R.D.; Turner, M. Coupling of boreal forests and lakes: Effects of conifer pollen on littoral communities. Limnol. Oceanogr. 2006, 51, 1524–1529. [Google Scholar] [CrossRef]
  61. Masclaux, H.; Perga, M.E.; Kagami, M.; Desvilettes, C.; Bourdier, G.; Bec, A. How pollen organic matter enters fresh water food webs. Limnol. Oceanogr. 2013, 58, 1185–1195. [Google Scholar] [CrossRef]
  62. Filipiak, M. Pollen Stoichiometry May Influence Detrital Terrestrial and Aquatic Food Webs. Front. Ecol. Evol. 2016, 4, 138. [Google Scholar] [CrossRef] [Green Version]
  63. Greenfield, L. Weight loss and release of mineral nitrogen from decomposing pollen. Soil Biol. Biochem. 1999, 31, 353–361. [Google Scholar] [CrossRef]
  64. Cho, Y.J.; Sung Kim, I.; Kim, P.; Ju Lee, E. Deposition of airborne pine pollen in a temperate pine forest. Grana 2003, 42, 178–182. [Google Scholar] [CrossRef]
  65. Webster, E.A.; Tilston, E.L.; Chudek, J.A.; Hopkins, D.W. Decomposition in soil and chemical characteristics of pollen. Eur. J. Soil Sci. 2008, 59, 551–558. [Google Scholar] [CrossRef]
  66. Rösel, S.; Rychła, A.; Wurzbacher, C.; Grossart, H. Effects of pollen leaching and microbial degradation on organic carbon and nutrient availability in lake water. Aquat. Sci. 2012, 74, 87–99. [Google Scholar] [CrossRef]
  67. Lee, E.J.; Booth, T. Macronutrient input from pollen in two regenerating pine stands in southeast Korea. Ecol. Res. 2003, 18, 423–430. [Google Scholar] [CrossRef]
  68. Lee, E.J.; Kenkel, N.; Booth, T. Atmospheric deposition of macronutrients by pollen in the boreal forest. Ecoscience 1996, 3, 304–309. [Google Scholar] [CrossRef]
  69. Maggs, J. Litter fall and retranslocation of nutrients in a refertilized and prescribed burned Pinus elliottii plantation. For. Ecol. Manag. 1985, 12, 253–268. [Google Scholar] [CrossRef]
  70. Bullejos, F.J.; Carrillo, P.; Gorokhova, E.; Medina-Sánchez, J.M.; Balseiro, E.G.; Villar-Argaiz, M. Shifts in food quality for herbivorous consumer growth: Multiple golden means in the life history. Ecology 2014, 95, 1272–1284. [Google Scholar] [CrossRef] [PubMed] [Green Version]
  71. Jato, V.; Rodríguez-Rajo, F.J.; Méndez, J.; Aira, M.J. Phenological behaviour of Quercus in Ourense (NW Spain) and its relationship with the atmospheric pollen season. Int. J. Biometeorol. 2002, 46, 176–184. [Google Scholar]
  72. Recio, M.; Picornell, A.; Trigo, M.M.; Gharbia, D.; García-Sánchez, J.; Cabezudo, B. Intensity and temporality of airborne Quercus pollen in the southwest Mediterranean area: Correlation with meteorological and phenoclimatic variables, trends and possible adaptation to climate change. Agric. For. Meteorol. 2018, 250, 308–318. [Google Scholar] [CrossRef]
  73. Fernández-González, M.; González-Fernández, E.; Ribeiro, H.; Abreu, I.; Rodríguez-Rajo, F.J. Pollen Production of Quercus in the North-Western Iberian Peninsula and Airborne Pollen Concentration Trends during the Last 27 Years. Forests 2020, 11, 702. [Google Scholar] [CrossRef]
  74. Xunta Galicia. Primera Revisión del Plan Forestal de Galicia: Documento de Diagnóstico del Monte y el Sector Forestal Gallego; Xunta de Galicia: Santiago, Spain, 2018; Available online: https://distritoforestal.es/images/DIAGNOSTICO_PFG_CAST_1.pdf (accessed on 21 October 2020).
  75. Foley, J.A.; DeFries, R.; Asner, G.P.; Barford, C.; Bonan, G.; Carpenter, S.R.; Snyder, P.K. Global consequences of land use. Science 2005, 309, 570–574. [Google Scholar] [CrossRef] [Green Version]
  76. Garcia-Mozo, H.; Oteros, J.; Galán, C. Impact of land cover changes and climate on the main airborne pollen types in Southern Spain. Sci. Total Environ. 2016, 548–549, 221–228. [Google Scholar] [CrossRef]
  77. Ruiz-Valenzuela, L.; Aguilera, F. Trends in airborne pollen and pollen-season-related features of anemophilous species in Jaen (South Spain): A 23-year perspective. Atmos. Environ. 2018, 80, 234–243. [Google Scholar] [CrossRef]
  78. Bishan, C.; Bing, L.; Chixin, C.; Junxia, S.; Shulin, Z.; Cailang, L.; Siqiao, Y.; Chuanxiu, L. Relationship between airborne pollen assemblages and major meteorological parameters in Zhanjiang, South China. PLoS ONE 2020, 15, e0240160. [Google Scholar] [CrossRef]
  79. Kluska, K.; Piotrowicz, K.; Kasprzyka, I. The impact of rainfall on the diurnal patterns of atmospheric pollen concentrations. Agric. For. Meteorol. 2020, 291, 108042. [Google Scholar] [CrossRef]
  80. Pérez, C.F.; Gassmann, M.I.; Covi, M. An evaluation of the airborne pollen–precipitation relationship with the superposed epoch method. Aerobiologia 2009, 25, 313–320. [Google Scholar] [CrossRef]
  81. Pecero-Casimiro, R.; Maya-Manzano, J.M.; Fernández-Rodríguez, S.; Tormo-Molina, R.; Silva-Palacios, I.; Monroy-Colín, A.; Gonzalo-Garijo, A. Pollen calendars and regional gradients as information tools in the Extremadura pollen monitoring network (SW Spain). Aerobiologia 2020, 36, 731–748. [Google Scholar] [CrossRef]
Figure 1. Location of the areas studied.
Forests 12 00688 g001
Figure 2. Weekly distribution of Pine pollen during the study years in each area studied (Eurosiberian, Vigo; transition, Ourense; and Mediterranean, Toledo).
Forests 12 00688 g002
Figure 3. Trend of the percentage of airborne Pinus pollen concentration compared to the total forest tree species airborne pollen content during the entire study period in each study area.
Forests 12 00688 g003aForests 12 00688 g003b
Figure 4. Significant trends of the airborne Pinus main pollen season (MPS) during the entire study period in each study area.
Forests 12 00688 g004
Figure 5. The relationship between airborne Pinus pollen and rainfall during the main pollen season (MPS) of all study years in each study area.
Forests 12 00688 g005
Table 1. Pinus MPS during the 25 study years in the Eurosiberian area (Vigo): start date, end date, length, API (pollen grains), daily pollen peak (pollen grains/m3) and peak date. Average, minimum and maximum values, standard deviation (SD) and relative standard variation in percentage (%RSD) are included. The logistic method was used.
MPS—Vigo
YearStart
(MPS)
End
(MPS)
Length
(MPS)
APIPollen
Peak
Peak
Day
199528-Feb.23-Apr.55561654225-Mar.
19963-Mar.30-Apr.59358829422-Mar.
199721-Feb.4-Apr.43599360610-Mar.
199811-Feb.27-Mar.45529711053-Mar.
199928-Feb.17-Apr.4940804897-Apr.
20003-Mar.24-Mar.227704113111-Mar.
20012-Jan.19-May13815294085-Mar.
20023-Mar.15-Apr.446894122226-Mar.
20034-Mar.8-Apr.36559898917-Mar.
200410-Feb.1-May8247493513-Mar.
200514-Mar.17-Apr.353343112931-Mar.
200613-Mar.8-May5749628633-Apr.
200726-Feb.7-May71548837417-Apr.
20085-Feb.24-Apr.80215818519-Mar.
200927-Feb.12-Apr.45400434717-Mar.
201015-Mar.6-May53295132111-Apr.
20111-Mar.27-Apr.5844695761-Apr.
20125-Mar.8-Apr.35433857523-Mar.
201327-Jan.12-Jun.137236516718-Apr.
20144-Mar.6-May6430423239-Apr.
201519-Mar.21-Apr.34878010278-Apr.
201612-Feb.18-May97261722021-Mar.
201725-Feb.22-Apr.57573484425-Mar.
201827-Mar.21-May56365752225-Apr.
201927-Feb.15-Apr.48153814726-Mar.
Mean25-Feb.24-Apr.60442059026-Mar.
Max27-Mar.12-Jun.1388780122226-Mar.
Min2-Jan.24-Mar.22152914726-Mar.
SD17.51918.35328.6661840.404345.09614.325
RSD%31.01915.89347.77741.64158.46316.712
Table 2. Pinus MPS during the 25 study years in the transition Eurosiberian (Orense): start date, end date, length, API (pollen grains), daily pollen peak (pollen grains/m3) and peak date. Average, minimum and maximum values, standard deviation (SD) and relative standard variation in percentage (%RSD) are included. The logistic method was used.
MPS—Ourense
YearStart
(MPS)
End
(MPS)
Length
(MPS)
APIPollen
Peak
Peak
Day
19956-Mar.22-Apr.48369662725-Mar.
199622-Mar.9-May4935054429-Apr.
19974-Mar.7-Apr.35242228718-Mar.
199822-Feb.21-Apr.59311429222-Mar.
199920-Mar.21-Apr.3316943236-Apr.
20003-Mar.19-Apr.48260023327-Mar.
200123-Feb.3-May7017782901-Apr.
200211-Mar.24-Apr.456262100325-Mar.
200319-Mar.13-Apr.2633698181-Apr.
20042-Mar.3-May6332943144-Apr.
200524-Mar.22-Apr.3028516567-Apr.
200631-Mar.7-May38561572810-Apr.
200711-Mar.8-May59581428716-Apr.
200813-Mar.26-Apr.4536905526-Apr.
20095-Mar.22-Apr.49598646424-Mar.
20102-Apr.8-May37553264412-Apr.
201118-Mar.28-Apr.42549464911-Apr.
201212-Mar.15-Apr.35550756530-Mar.
201325-Mar.14-May51455228517-Apr.
201415-Mar.3-May50799089910-Apr.
201511-Mar.5-May5667835483-Apr.
201623-Feb.31-May99525027828-Feb.
20179-Mar.6-May5955762958-Apr.
20187-Apr.17-May41609560427-Apr.
201924-Feb.10-May76166017831-Mar.
Mean13-Mar.30-Apr.5044054903-Apr.
Max7-Apr.31-May997990100325-Mar.
Min22-Feb.7-Apr.26166017831-Mar.
SD12.12312.06616.0171833.928226.16511.394
RSD%16.91310.02132.21440.99246.11712.241
Table 3. Pinus MPS during the 25 study years in the Mediterranean area (Toledo): start date, end date, length, API (pollen grains), daily pollen peak (pollen grains/m3) and peak date. Average, minimum and maximum values, standard deviation (SD) and relative standard variation in percentage (%RSD) are included. The logistic method was used.
MPS—Toledo
YearStart
(MPS)
End
(MPS)
Length
(MPS)
APIPollen
Peak
Peak
Day
200324-Feb.10-Jun.1077814322-Mar.
200422-Feb.15-Jul.14510929831-Mar.
200515-Mar.6-Jul.1141491895-Jun.
20068-Mar.14-Jun.99788814-Apr.
20074-Mar.1-Jul.120163312730-Mar.
200818-Feb.15-Jun.119175523530-Mar.
20093-Mar.30-Jun.120162911727-May
201020-Mar.11-Jul.1141332814-Jun.
20115-Mar.20-Jun.10810391523-Apr.
20125-Mar.21-Jun.10913327010-Apr.
20135-Mar.3-Jul.121127310311-Apr.
201427-Feb.23-Jun.11726955031-Apr.
201511-Apr.23-Jun.74265433920-May
201623-Feb.25-Jul.15417751483-Apr.
201721-Feb.2-Jun.102161515526-Mar.
201822-Mar.25-Jul.126239017817-Jun.
20198-Mar.7-Jul.122222813128-May
Mean6-Mar.29-Jun.116161815623-Apr.
Max11-Apr.25-Jul.15426955031-Apr.
Min18-Feb.2-Jun.747814322-Mar.
SD12.96715.12017.569588.611113.40430.658
RSD%19.8968.39415.15436.38572.75027.089
Table 4. Spearman correlations between the MPS characteristics (start, end and length dates of the MPS, API and pollen peak day) and the meteorological variables (maximum, minimum and average temperatures, total rainfall and relative humidity). Significance level was represented as * p < 0.05, ** p < 0.01, *** p < 0.01.
AreaMaxTMinTAvgTRainfallHumidity
MPS
Start date
Eurosiberian (Vigo)0.406 **0.437 **0.489 **−0.721 ***−0.383 *
Transition (Orense) −0.467 **−0.340 *
Mediterranean (Toledo)0.787 *** −0.430 *0.731 ***0.827 ***
MPS
End date
Eurosiberian (Vigo) 0.561 ***0.427 **
Transition (Orense) 0.592 ***
Mediterranean (Toledo) 0.472 *
MPS
Length
Eurosiberian (Vigo)−0.375 * 0.801 ***0.509 ***
Transition (Orense)−0.337 *0.454 ** 0.414 **
Mediterranean (Toledo) 0.581 **
APIEurosiberian (Vigo) −0.532 ***−0.340 *
Transition (Orense) −0.369 * −0.451 **
Mediterranean (Toledo)0.444 * −0.473 *0.469 *
Peak dateEurosiberian (Vigo) 0.616 **0.458 **
Transition (Orense) 0.364 *
Mediterranean (Toledo)0.757 ** −0.546 **0.718 **0.778 **
Table 5. Trends of the MPS characteristics (start, end and length dates of the MPS, pollen integral, pollen peak concentration and pollen peak day) and meteorological variables (maximum, minimum and average temperatures, total rainfall and relative humidity). The shown parameters of the linear regression analysis are slope, R2 value and p-value. The significant results are shown in bold.
Eurosiberian
Vigo
(1995–2019)
Transition
Ourense
(1995–2019)
Mediterranean
Toledo
(2003–2019)
SlopeR2pSlopeR2pSlopeR2p
MPSStart MPS0.4930.0430.3310.2650.0260.4620.6450.0630.329
End MPS0.9940.1580.0490.9610.3460.0020.6490.0480.410
Length MPS0.5060.0170.5360.7020.1040.116−0.0070.0000.994
Pollen integral−68.5230.0750.185126.1300.2560.00979.7170.4680.002
Pollen peak−13.7180.0850.1560.2700.0000.9678.8430.1550.118
Peak date0.9940.2550.0090.3910.0630.2281.7500.0820.265
YearMax T0.0220.0090.6500.0030.0000.9580.1730.1760.093
Min T0.1690.4910.0000.0370.0390.3430.1060.1190.175
Average T0.0780.1690.041−0.0130.0090.6470.1390.1560.116
Rainfall−0.7410.0000.9311.6320.0180.520−2.9220.0430.422
Rel Hum0.0670.0120.608−0.1730.1020.118−0.4640.1850.085
Pre-peak
Period
Max T0.0160.0040.766−0.0400.0120.5940.1330.0440.419
Min T0.1510.3220.003−0.0400.0240.4560.0950.0380.454
Average T0.0670.0850.157−0.0750.1290.0770.1140.0440.148
Rainfall1.6460.0060.715−0.5880.0050.73415820.0330.486
Rel Hum0.0100.0000.950−0.2270.0730.192−0.1210.0060.761
Post-peak
Period
Max T0.0420.0230.4690.0160.0020.8310.3070.1520.121
Min T0.2020.4930.7020.0090.1720.0390.1940.0940.231
Average T0.1030.2190.0180.0270.01530.5560.2500.1250.163
Rainfall−2.3880.0120.6022.2200.0500.281−45040.1390.140
Rel Hum0.1320.0320.393−0.1130.0370.356−0.9140.2650.034
Publisher’s Note: MDPI stays neutral with regard to jurisdictional claims in published maps and institutional affiliations.

