Article

Nitrogen Addition Exacerbates the Negative Effect of Throughfall Reduction on Soil Respiration in a Bamboo Forest

1
Key Laboratory of Bamboo and Rattan Science and Technology of National Forestry and Grassland Administration, Research Institute of Resources and Environment, International Centre for Bamboo and Rattan, Beijing 100102, China
2
Changning Bamboo Forest Ecosystem National Research Station, Yibin 644300, China
3
Key Laboratory of Forest Ecology and Environment of National Forestry and Grassland Administration, Research Institute of Forest Ecology, Environment and Protection, Chinese Academy of Forestry, Beijing 100091, China
*
Author to whom correspondence should be addressed.
Forests 2021, 12(6), 724; https://doi.org/10.3390/f12060724
Submission received: 25 April 2021 / Revised: 20 May 2021 / Accepted: 30 May 2021 / Published: 2 June 2021
(This article belongs to the Section Forest Ecology and Management)

Abstract

:
Impacts of drought events and nitrogen (N) deposition on forests are increasingly concerning in the context of global climate change, but their effects, in particular, their interactive effects on soil respiration and its components remain unclear. A two-factor random block field experiment was conducted at a subtropical Moso bamboo forest in Southwest China to explore the response of soil respiration (Rs), autotrophic respiration (Ra), and heterotrophic respiration (Rh) to throughfall re-duction and N addition. Our results showed that throughfall reduction significantly decreased Rs, which is mainly attributed to the decrease in Ra as a result of the decline in fine roots biomass. The N addition led to microbial carbon limitation hence significantly decreased Rh, and thus Rs. We also observed the negative effect of throughfall reduction on Rs was exacerbated by N addition, which is attributed to the significant reduction in Ra under the interaction between throughfall reduction N addition. Our findings suggest that Ra tended to respond more sensitively to potential drought, while Rh responds more sensitively to N deposition, and consequently, increased soil N availability caused by N deposition might aggravate the negative effect of expected drought on soil carbon cycling.

Graphical Abstract

1. Introduction

As the second-largest fluxes in the global terrestrial carbon (C) cycle, soil respiration (Rs) consequently exerts a strong influence on the feedbacks between soil C pools and atmospheric CO2 concentration [1]. Changes in Rs in response to global change scenarios [2] can have a tremendous effect on the terrestrial C cycle and subsequently global climate change. Amongst, change in precipitation patterns (intensity and frequency) results in frequent extreme droughts during the 21st century [2], which has been exerting a large impact on soil C cycling [3,4]. Nitrogen (N) deposition, another important global change feature, had been intensified due to increasing human activities, such as fossil fuel combustion and use of fertilizers [5,6,7], which were also demonstrated to affect soil C cycling [8]. The global change characterized by the concurrence of multiple environmental factors, like N deposition and drought events, and therefore, leading to large uncertainties in predicting impacts of the combined factors [9], because both N deposition and drought will be very likely to affect soil N availability and soil water availability and consequently, further impact on ecological process in future [5,10]. However, their combined effects have inadequately been addressed from the perspective of coupled relationships between N and water, which often interact together to alter the direction and magnitudes of the response of the ecological process [11,12].
Rs is composed of two components, including autotrophic respiration (Ra) and heterotrophic respiration (Rh), and their different response to environmental changes finally determine the variation of Rs [13,14]. For example, Hinko-Najera et al. [15] attributed drought-induced reductions in Rs to a decrease in Ra in a dry temperate broadleaved evergreen forest, while Zhou et al. [3] found the decreased Ra and the increased Rh contributed to the non-responsive Rs under throughfall reduction in a tropical rainforest. Contrastingly, Ra was increased by throughfall reduction and combined with the non-responsive Rh; all of them finally contributed to the increase of Rs in the temperate oak forest [16]. Moreover, soil N availability also determines the soil C cycling in response to climate changes [17]. Previous studies showed that N addition promoted Ra and Rh and subsequently triggered an increase of Rs in a temperate forest [18], while inhibited both Ra and Rh hence leading to the decline of Rs in a subtropical forest [19,20]. The highly variable effects of throughfall reduction or N addition on Rs, Ra, and Rh may be brought by the diverse plant types, natural precipitation, and nutrient status of ecosystems [18,21,22,23]. Interestingly, Yan et al. [24] found N addition had a neutral effect on Ra in dry years but a positive effect on Ra in wet years in a semi-arid temperate steppe. In other cases, throughfall exclusion promoted Rh in subtropical and temperate forests, while the positive response diminished under the combined effects of throughfall exclusion and N addition [18,25]. Thus, it is crucial to quantify the respective response of Ra and Rh to N addition and throughfall reduction to achieve a comprehensive perspective on the interactive effects of N addition and throughfall reduction on soil C cycling.
Bamboo is one of the important forest types in the subtropical area in China [26], which currently accounts for about 6.41 million hm2 of forested area, of which 72.9% is dominated by Moso bamboo (Phyllostachys heterocycla) (the Ninth National Forest Resource Inventory Report). The subtropical region of China is controlled by a West Pacific Subtropical High-Pressure System, which was also subjected to a prevailing descending airflow, leading to severe drought in summer [27]. Moreover, this region is projected to experience an increasing intensity and frequency of drought events in the 21st century [28] and has been suffering N deposition since the 1980s [29,30]. The former studies implied that N addition could change the response direction and extent of Ra and Rh to drought, making the effects of throughfall reduction, N addition, and their interactions on Rs uncertain. Therefore, a two-factorial field manipulation experiment was conducted in a subtropical Moso bamboo forest, we aim to investigate the effects of throughfall reduction, N addition, and their interaction on soil respiration and its components. We hypothesized that: (1) The negative response of Rs to throughfall reduction might primarily result from the decline of Ra; (2) N addition might relieve the negative effect of throughfall reduction on Ra; thus the differential responses between components must be figured to accurately predict the total soil respiration in response to future climate change scenarios, particularly to drought.

2. Material and Methods

2.1. Site Description

The study site is located in Changning Bamboo Forest National Ecosystem Research Station, Changning country, Sichuan province of China (28°27′–28°27′ N, 105°00′–105°01′ E). The local climate is characterized by a humid mid-subtropical climate influenced largely by the southeast monsoon, with mean annual air temperature of 18.3 °C and an average annual precipitation of 1141.7 mm. The soil in the study site was Cambisols (FAO classification). The dominant tree species at the study site was Moso bamboo (Phyllostachys heterocycla). The initial stand density and diameter at breast height (DBH) are summarized in Table S1.

2.2. Experimental Design

To explore the effects of throughfall reduction and nitrogen addition and their interaction on Rs and its components, we fenced four blocks, with each block consisting of four 20 m × 20 m plots (Ambient plot: A, Throughfall reduction plot: TR, Nitrogen addition plot: N, Nitrogen addition and Throughfall reduction plot: TR + N), and a more than 5 m wide buffer strip was set between the neighboring plots. We trenched the plots to bedrock (approximately 70–80 cm), then inserted a 3 mm thick and 80 cm width polyvinyl chloride board along the trench to prevent horizontal transport of soil lateral water and clonal integration by rhizome from bamboos outside the plot. The throughfall reduction experiment was installed using plastic roofs made of agricultural polyolefin film attached to rails about 2 m above the ground, and the roofs cover about 50% area in the throughfall reduction plot. The throughfall reduction experiment was initiated in April 2017 [31]. The N addition was conducted once every two months with the total amount of 100 kg N ha−1 yr−1 by applying ammonium nitrate (NH4NO3), which was weighed and dissolved in 100 L water, and then sprayed with an automatic sprinkler system under the canopy in the plots. The ambient and through-fall reduction plots simultaneously supplied 100 L water without NH4NO3 additions, which was equal to 1.5 mm precipitation every year. The N addition experiment was initiated in June 2017.

2.3. Soil Respiration Measurements

Three polyvinyl chloride (PVC) collars (19.5 cm inner diameter, 8 cm deep) were randomly installed in the plots to determine soil respiration (Rs), and another three PVC collars in trenched quadrats were installed to determine soil heterotrophic respiration (Rh). A total of six PVC collars were inserted 3 cm deep into the soil and kept the position unchanged throughout the experiment. In trenched quadrat, 1 m × 1 m area to 60 cm depth (approximately the bottom of the root zone in study site) was randomly selected and trenched in April 2017, then a 3 mm thick and 80 cm width polyvinyl chloride board was inserted to avoid root growth into the quadrat [16]. All plants were removed before trench establishment, and living vegetation were kept free from trench quadrats by periodically manual removal throughout the experiment. To minimize the effect of dead roots caused by trenching, Rh was measured 4 months later after trenching. Rs and Rh were measured approximately once a month from September of 2017 to August of 2018 (14 times in the whole monitored period) by using the Li-8100 (Li-Cor Inc., Lincoln, NE, USA), respectively. The measurement time was selected before NH4NO3 was added or 15 days later after NH4NO3 added, starting from 09:00 a.m. to 3:00 p.m. Accordingly, soil autotrophic respiration (Ra) was represented as the difference between Rs and Rh. The soil temperature (T) and the soil moisture (SWC: volumetric water content, %v/v) at the 5 cm depth were monitored simultaneously by using a ProCheck (METER Group Inc., Pullman, WA, USA) and soil temperature and moisture probes (Decagon: 5TE, Pullman, WA, USA) at three measurement sites nearby the collar.

2.4. Soil Sampling and Analysis

The soil samples were collected in August of 2018, respectively. After carefully removing the litter layer from the topsoil, three soil cores from each plot were randomly sampled at a depth of 0–10 cm using a 5 cm diameter stainless steel auger for the measurement of fine root biomass (diameter ≤ 2 mm). Overall, the soil samples were separately homogenized and sieved through a 2 mm screen to obtain the final soil sample for a given plot. All the fine roots were rinsed with water and weighed to determine fine root biomass (FRB) after oven drying at 75 °C for 72 h. A portion of each soil sample was air-dried at room temperature and for pH measurement using a pH meter (PHS-3C, INESA Scientific Instrument Co. Ltd., Shanghai, China) with a 1:2.5 ratio of soil dry weight to deionized water volume. Another portion of air-dried soil sample was sieved through a 0.15 mm screen for chemical properties analysis. The soil total C (TOC) and N (TN) were measured by using Elemental Analyzer (ECS 4010 CHNSO, Costech Analytical Tecnologies Inc., Vlencia, CA, USA), and soil total phosphorus (TP) were measured colorimetrically by using Smartchem Discrete Auto Analyzer (Smartchem 300, Westco Scientific Instruments, Rome, Italy) after wet digestion with HClO4-H2SO4. The other portion of each soil sample was transported to the laboratory in a 4 °C cooler for the later measurement of soil ammonium nitrogen (NH4-N), nitrate-nitrogen (NO3-N), soil microbial biomass, and extracellular enzyme activities (EEAs). The NH4-N and NO3-N were measured by using Smartchem Discrete Auto Analyzer (Smartchem 300, Westco Scientific Instruments, Rome, Italy) after extraction with 50 mL of 2M KCl solution (wet soil weight: solution volume = 1:5). Soil phospholipid fatty acid (PLFA) content was analyzed following the methods of Bossio and Scow [32]. Briefly, PLFA was extracted from soil equivalent to 8 g dry weight and measured by gas chromatography combustion mass spectrometry (Agilent N6890, Agilent Technologies, PaloAlto, CA, USA) fitted with a MIDI Sherlocks microbial identification system (Version 4.5, MIDI Inc., Newark, DE, USA). For each sample, PLFAs were quantified relative to the C19:0 internal standard and expressed as nmol PLFA g−1 soil. Total PLFAs concentration has been used to represent soil total microbial biomass [33], and the sum of the PLFAs was used as an estimate of the total microbial biomass. The activities of β-Glucosidase (BG), leucine aminopeptidase (LAP), N-acetylglucosaminidase (NAG), and acid phosphatase (AP) were assayed using the modified method by Saiya-Cork et al. [34] and Wang et al. [14]. In brief, 1.25 g (wet weight) of soil (0–10 cm depth) closed to collar in trench quadrats were homogenized for one minute with 125 mL 50mM acetate buffer (pH = 4.2) in a blender. Two hundred microliters of soil slurry and 50 µL of 200 µM 4-methylumbelliferyl or l-leucine-7-amido-4-methyl substrate were added to each well on the microplate, eight replicates for one kind of EEAs. Eight control quench replicates were made for each soil (200 µL soil slurries plus 50 µL of 10 µM 4-methylumbellifferone [MUB] or 50 µL of 10 µM 7-amino-4-methylcoumarin [AMC]). Background fluorescence of soil slurry, substrates, and standard solution of MUB and AMC were also measured. The microplates were incubated in the dark at 25 °C for 3 h, and reactions were stopped with 5 µL 0.5 N NaOH. Finally, the microplates were read on a PerkinElmer LAMBDA 35 plate reader (excitation filter at 355 nm and emission filter at 460 nm). According to Sinsabaugh et al. [35] and Sistla and Schimel [36], EEAs were divided into carbon acquiring enzyme activities (BG), nitrogen acquiring enzyme activities (NAG and LAP) and phosphorus acquiring enzyme activities (AP), and EEAs are expressed as nmol h−1 g−1 soil.
We used the vector analysis of soil enzymatic stoichiometry proposed by Moor-head et al. [37] and Jing et al. [38] to address the clear metrics of soil microbial carbon and nutrient limitations. Vector length (relative carbon vs. nutrient limitation) were calculated as the square root of the sum of the squared values of x and y, where x represents the relative carbon vs. phosphorus acquiring enzyme activities [(BG + CB)/(BG + AP)] and y represents the relative carbon vs. nitrogen acquiring enzyme activities [(BG + CB)/(BG + CB + NAG + LAP)] (Equation (1)), and vector degree (relative phosphorus vs. nitrogen limitation) was calculated as the angles between the x-axis and the vector from the plot origin to point (x, y) (Equation (2)):
V e c t o r   l e n g t h = S Q R T ( x 2 + y 2 )
V e c t o r   d e g r e e = D E G R E E S ( A T A N 2 ( x   ,     y ) )

2.5. Statistical Analyses

We used the bivariate exponential equation to describe the relationship between R and SWC and T [18]:
R = a . e b T . S W C c
where R represents the rate of soil respiration or its components (Rs, Ra, and Rh, μmol m−2 s−1); T represents soil temperature at 5 cm depth; SWC (% v/v) represents soil moisture at 5 cm depth; a, b and c represent model parameters.
Temperature sensitivity of R (Q10) was calculated using b values in the bivariate model as follows (Equation (4)):
Q 10 = e 10 b
The estimation of accumulated C efflux of Rs, Ra, and Rh was calculated as follows (Equation (5)) [39]:
F ( c ) = ( R i + 1 + R i ) / 2 × ( t i + 1 t i ) × 3600 × 24 × 44 × 10 8
where F(c) is the accumulative CO2 emission (t CO2 ha−1 a−1) of Rs, Ra, and Rh, R is the rates of Rs, Ra and Rh (μmolm−2 s−1), i is the sampling number, and t is the Julian day between two sampling time.
Three-way ANOVA was used to examine the effect of measuring time, throughfall reduction, and N addition on soil respiration (Rs, Ra, and Rh). In the general linear model, throughfall reduction and N addition were treated as fixed factors, and the block was treated as a random factor to examine throughfall reduction, N addition and their interactive effect on environmental factors (T and SWC), soil properties (pH, TOC, TN, TP, NO3-N, and NH4-N), FRB, Total PLFAs, vector analysis of soil enzymatic stoichiometry (vector length and vector degrees) and Q10 values. Pearson analysis was used to elucidate the relationships of Rs, Ra, and Rh and soil properties, FRB, Total PLFAs, vector length, and vector degrees. For A, TR, N, and TR+N treatments, principle component analysis (PCA) for Rs, Ra, and Rh were performed by using Canoco 4.5, in which Rs, Ra, and Rh at every turn were treated as “species”. Statistical analyses were carried out using SPSS 17.0 (SPSS Inc., Chicago, IL, USA).

3. Results

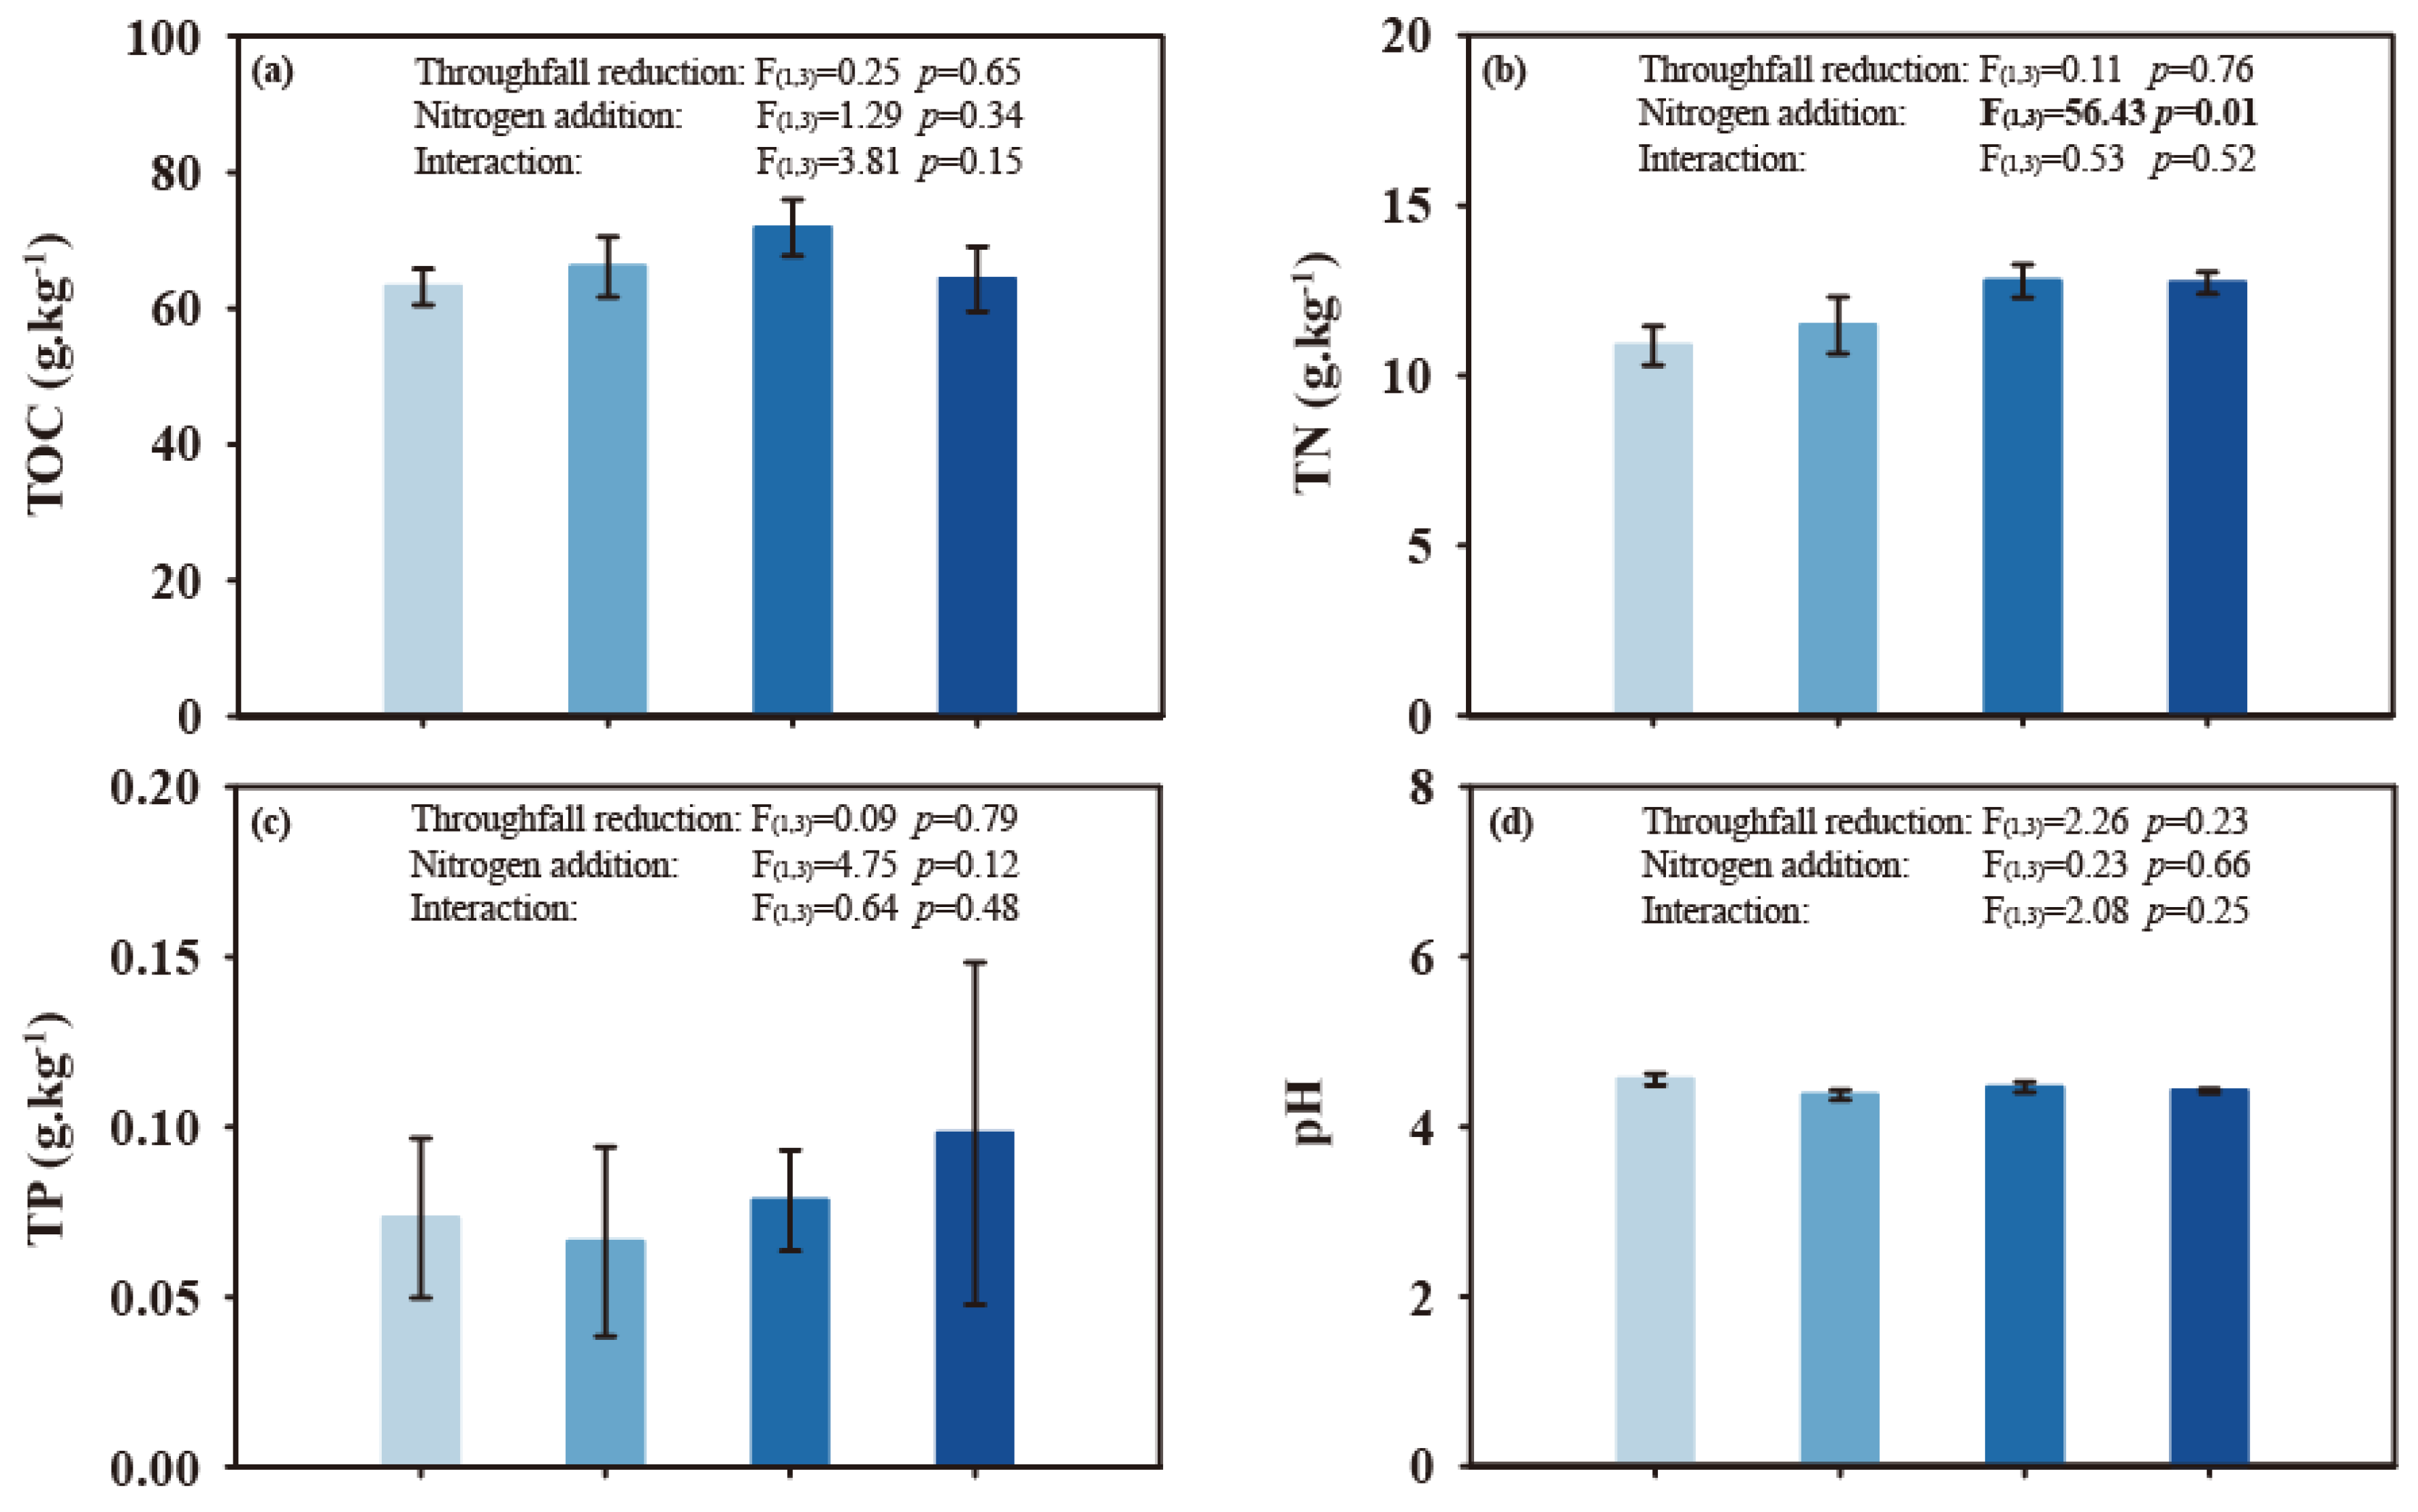
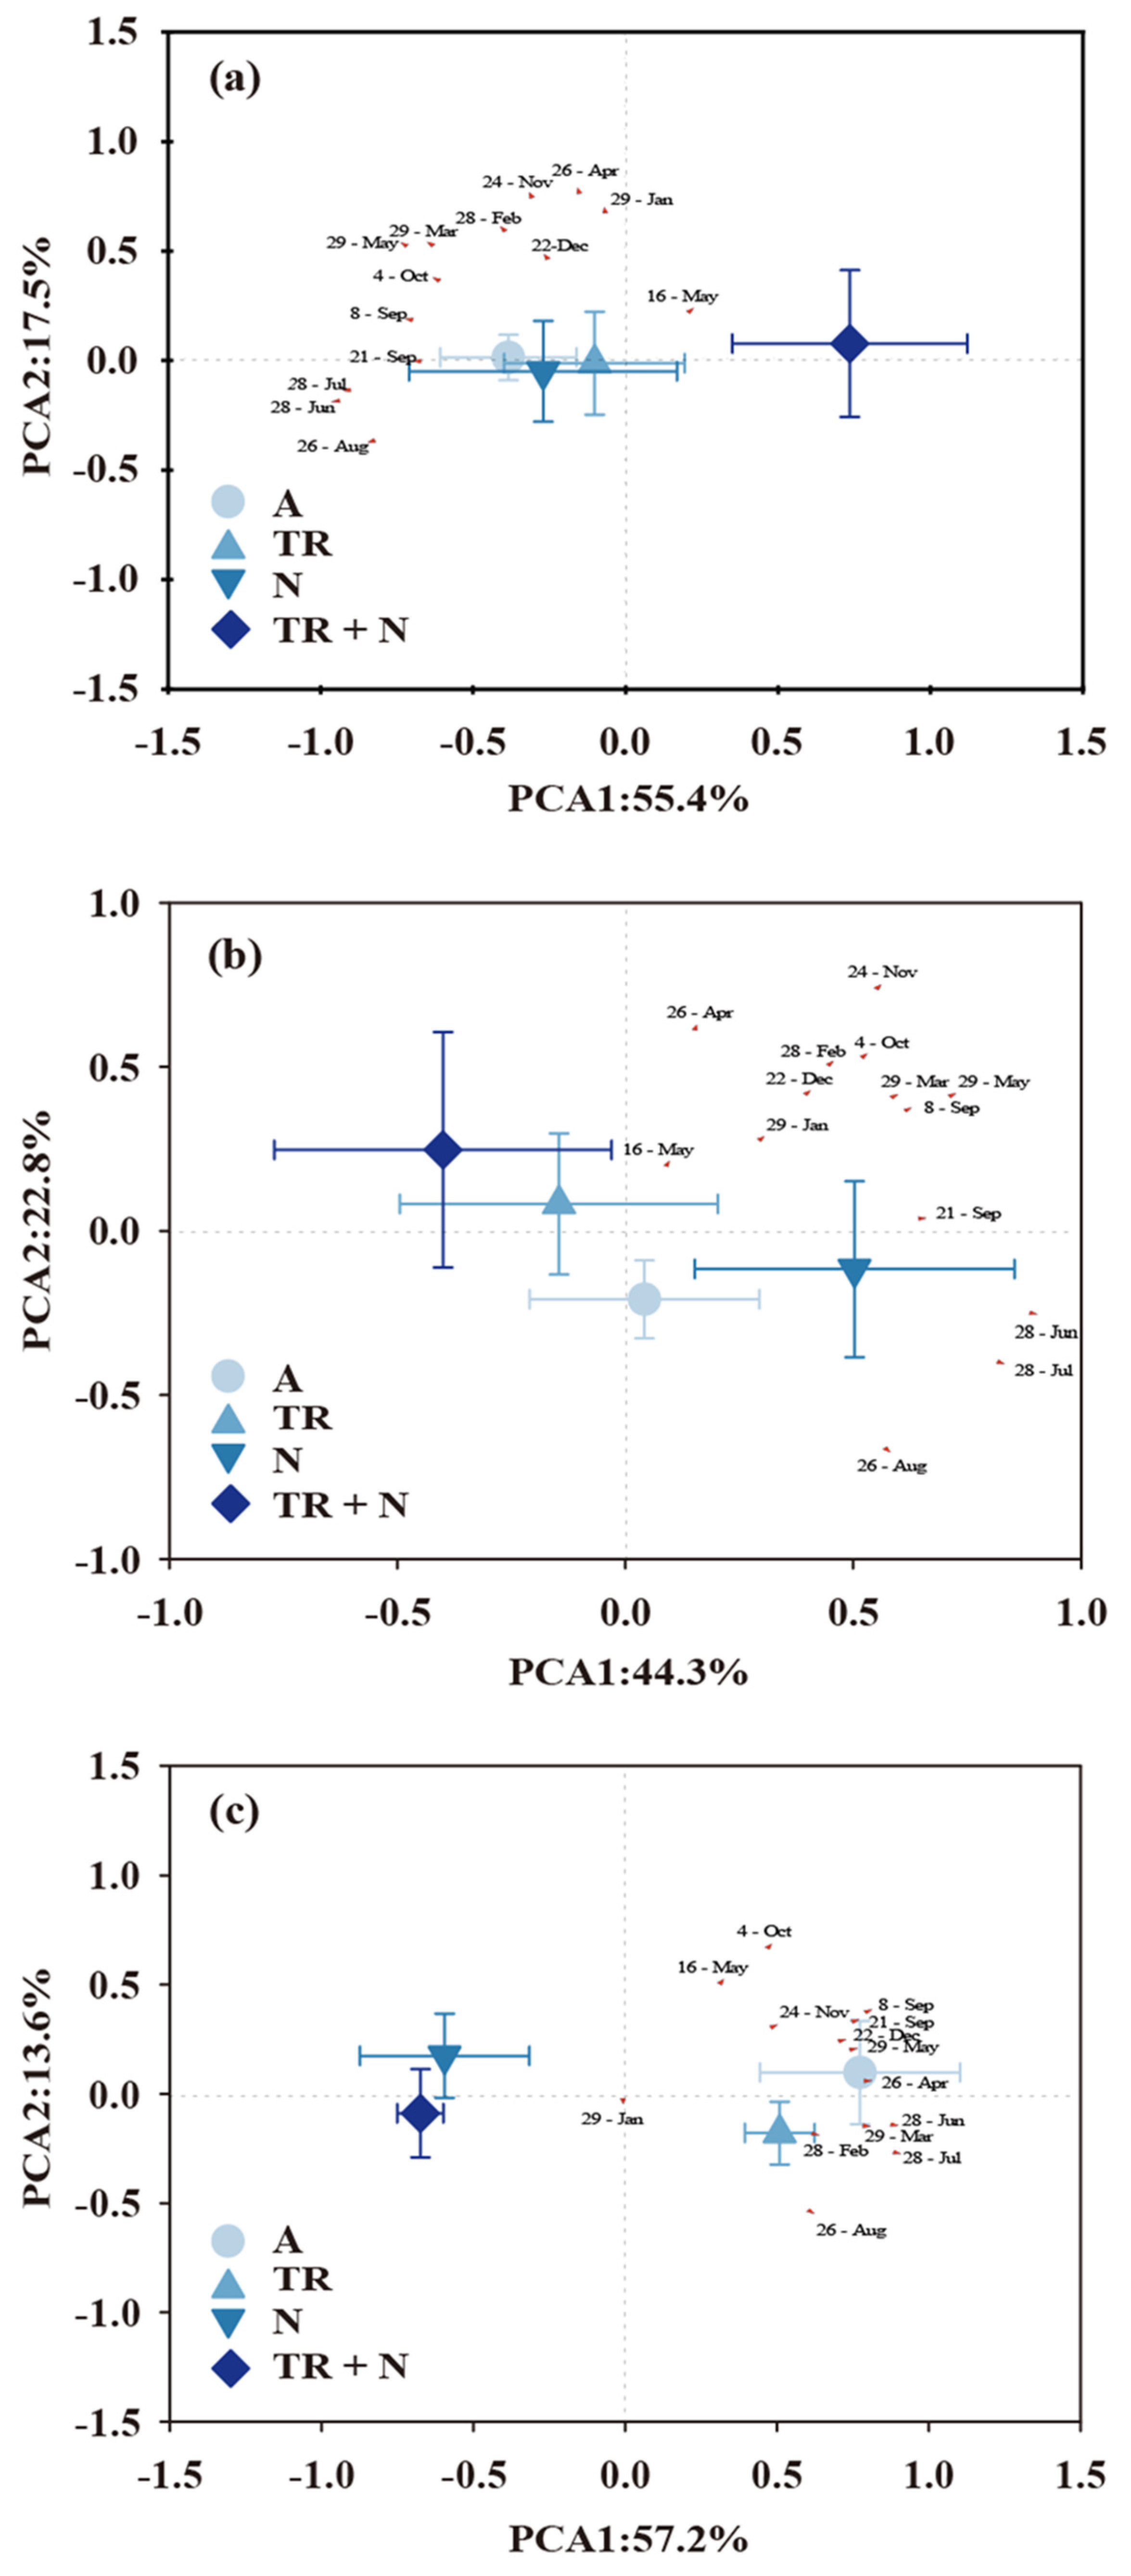
3.1. Throughfall Reduction and N Addition on Soil Environment, Fine Root Biomass and Microbial Properties

Soil temperature at the 5 cm soil depth showed strong seasonal patterns with the higher soil temperatures from June to August regardless of treatments (Figure 1a). Soil temperatures ranged from 5.44 °C to 29.35 °C during the study period. The seasonal pattern of soil moisture was different from that of soil temperature, and the variation fluctuated over seasons (Figure 1c). Throughfall reduction, N addition, and their interaction did not affect soil temperature; while throughfall reduction significantly decreased soil moisture (p < 0.001) by 27.6%, respectively (Figure 1b,d).
Throughfall reduction, N addition, and their interaction neither affect soil TOC, TP, pH, NO3-N, and NH4-N (Figure 2). N addition significantly increased TN by 17.5% and 17.0% for the N and TR + N treatments (p = 0.01), and throughfall reduction significantly decreased FRB by 21.1% (p = 0.03, Figure 2b). In vector analysis of soil enzymatic stoichiometry, the interaction of throughfall reduction and N addition on vector degree was significant (p = 0.03), showing that the vector degree was decreased by 8.1% for TR treatment, while combined with N addition, the decline was largely offset and only decreased by 2.0% (Figure 2h). Furthermore, N addition alone significantly increased vector length by 21.3%, compared to the A treatment (p = 0.03, Figure 2i). We did not observe treatment effects on total PLFAs (Figure 2j).

3.2. Effects of Throughfall Reduction and N Addition on Soil Respiration and Its Components

Across the year, Rs was significantly influenced by throughfall reduction, N addition, and their interaction. Throughfall reduction and N addition alone significantly decreased annual cumulative Rs by 5.1% (p = 0.021) and 1.2% (p < 0.001), and their combined effect further limited Rs, leading to a decline of 18.4% in annual cumulative Rs (p = 0.034, Figure 3b and Table 1). In PCA plots, the symbols of A, TR, N, and TR + N treatments were distributed in 3 quadrants, indicating that the effect of TR and N on Rs had the same negative influence (Figure 3b and Figure 4a). The symbol of TR + N separated from the other symbols implied the effect of TR + N on Rs was different from those under A, TR, and N treatments, and the results verified the negative response of Rs to the interactive effects of throughfall reduction and N addition (Figure 3b and Table 1). The effect of throughfall reduction significantly decreased annual cumulative Ra by 5.4% (p = 0.002), while the effect of N addition on annual cumulative Ra was not significant (p = 0.174). Overall, the interaction of throughfall reduction and N addition significantly decreased annual cumulative Ra by 8.8% (p = 0.020, Figure 3d and Table 1). The symbols of A and N treatments were situated in one quadrant, while the symbols of TR and TR + N were situated in the other quadrant, which illustrated the same negative response of TR and TR + N on Ra (Figure 3d and Figure 4b). Different from Ra, throughfall reduction and the interaction combined with N addition did not affect annual cumulative Rh (p = 0.063 and p = 0.633, respectively), but N addition significantly decreased annual cumulative Rh by 25.2% (p < 0.001, Figure 3f and Table 1). The differences of Rh stood in line with the symbols of A, TR, N, and TR + N treatments in PCA plots (Figure 3f and Figure 4c).

3.3. Controls for Soil Respiration and Its Components

Across the year, the variations of Rs, Ra, and Rh mainly tracked T and combined with SWC, which explained 76–89%, 51–78%, 75–86% of the monthly variations in Rs, Ra, and Rh (Figure 3 and Table 2). The Rs, Ra, and Rh were not affected by soil chemical properties, but significantly and positively correlated with fine root biomass (p = 0.004, p = 0.033, and p = 0.026, respectively, Table 3). Moreover, the Rs and Rh were not linked to total PLFAs or vector degree (Table 3), but Rh was negatively related to vector lengths (p = 0.002, Table 3).

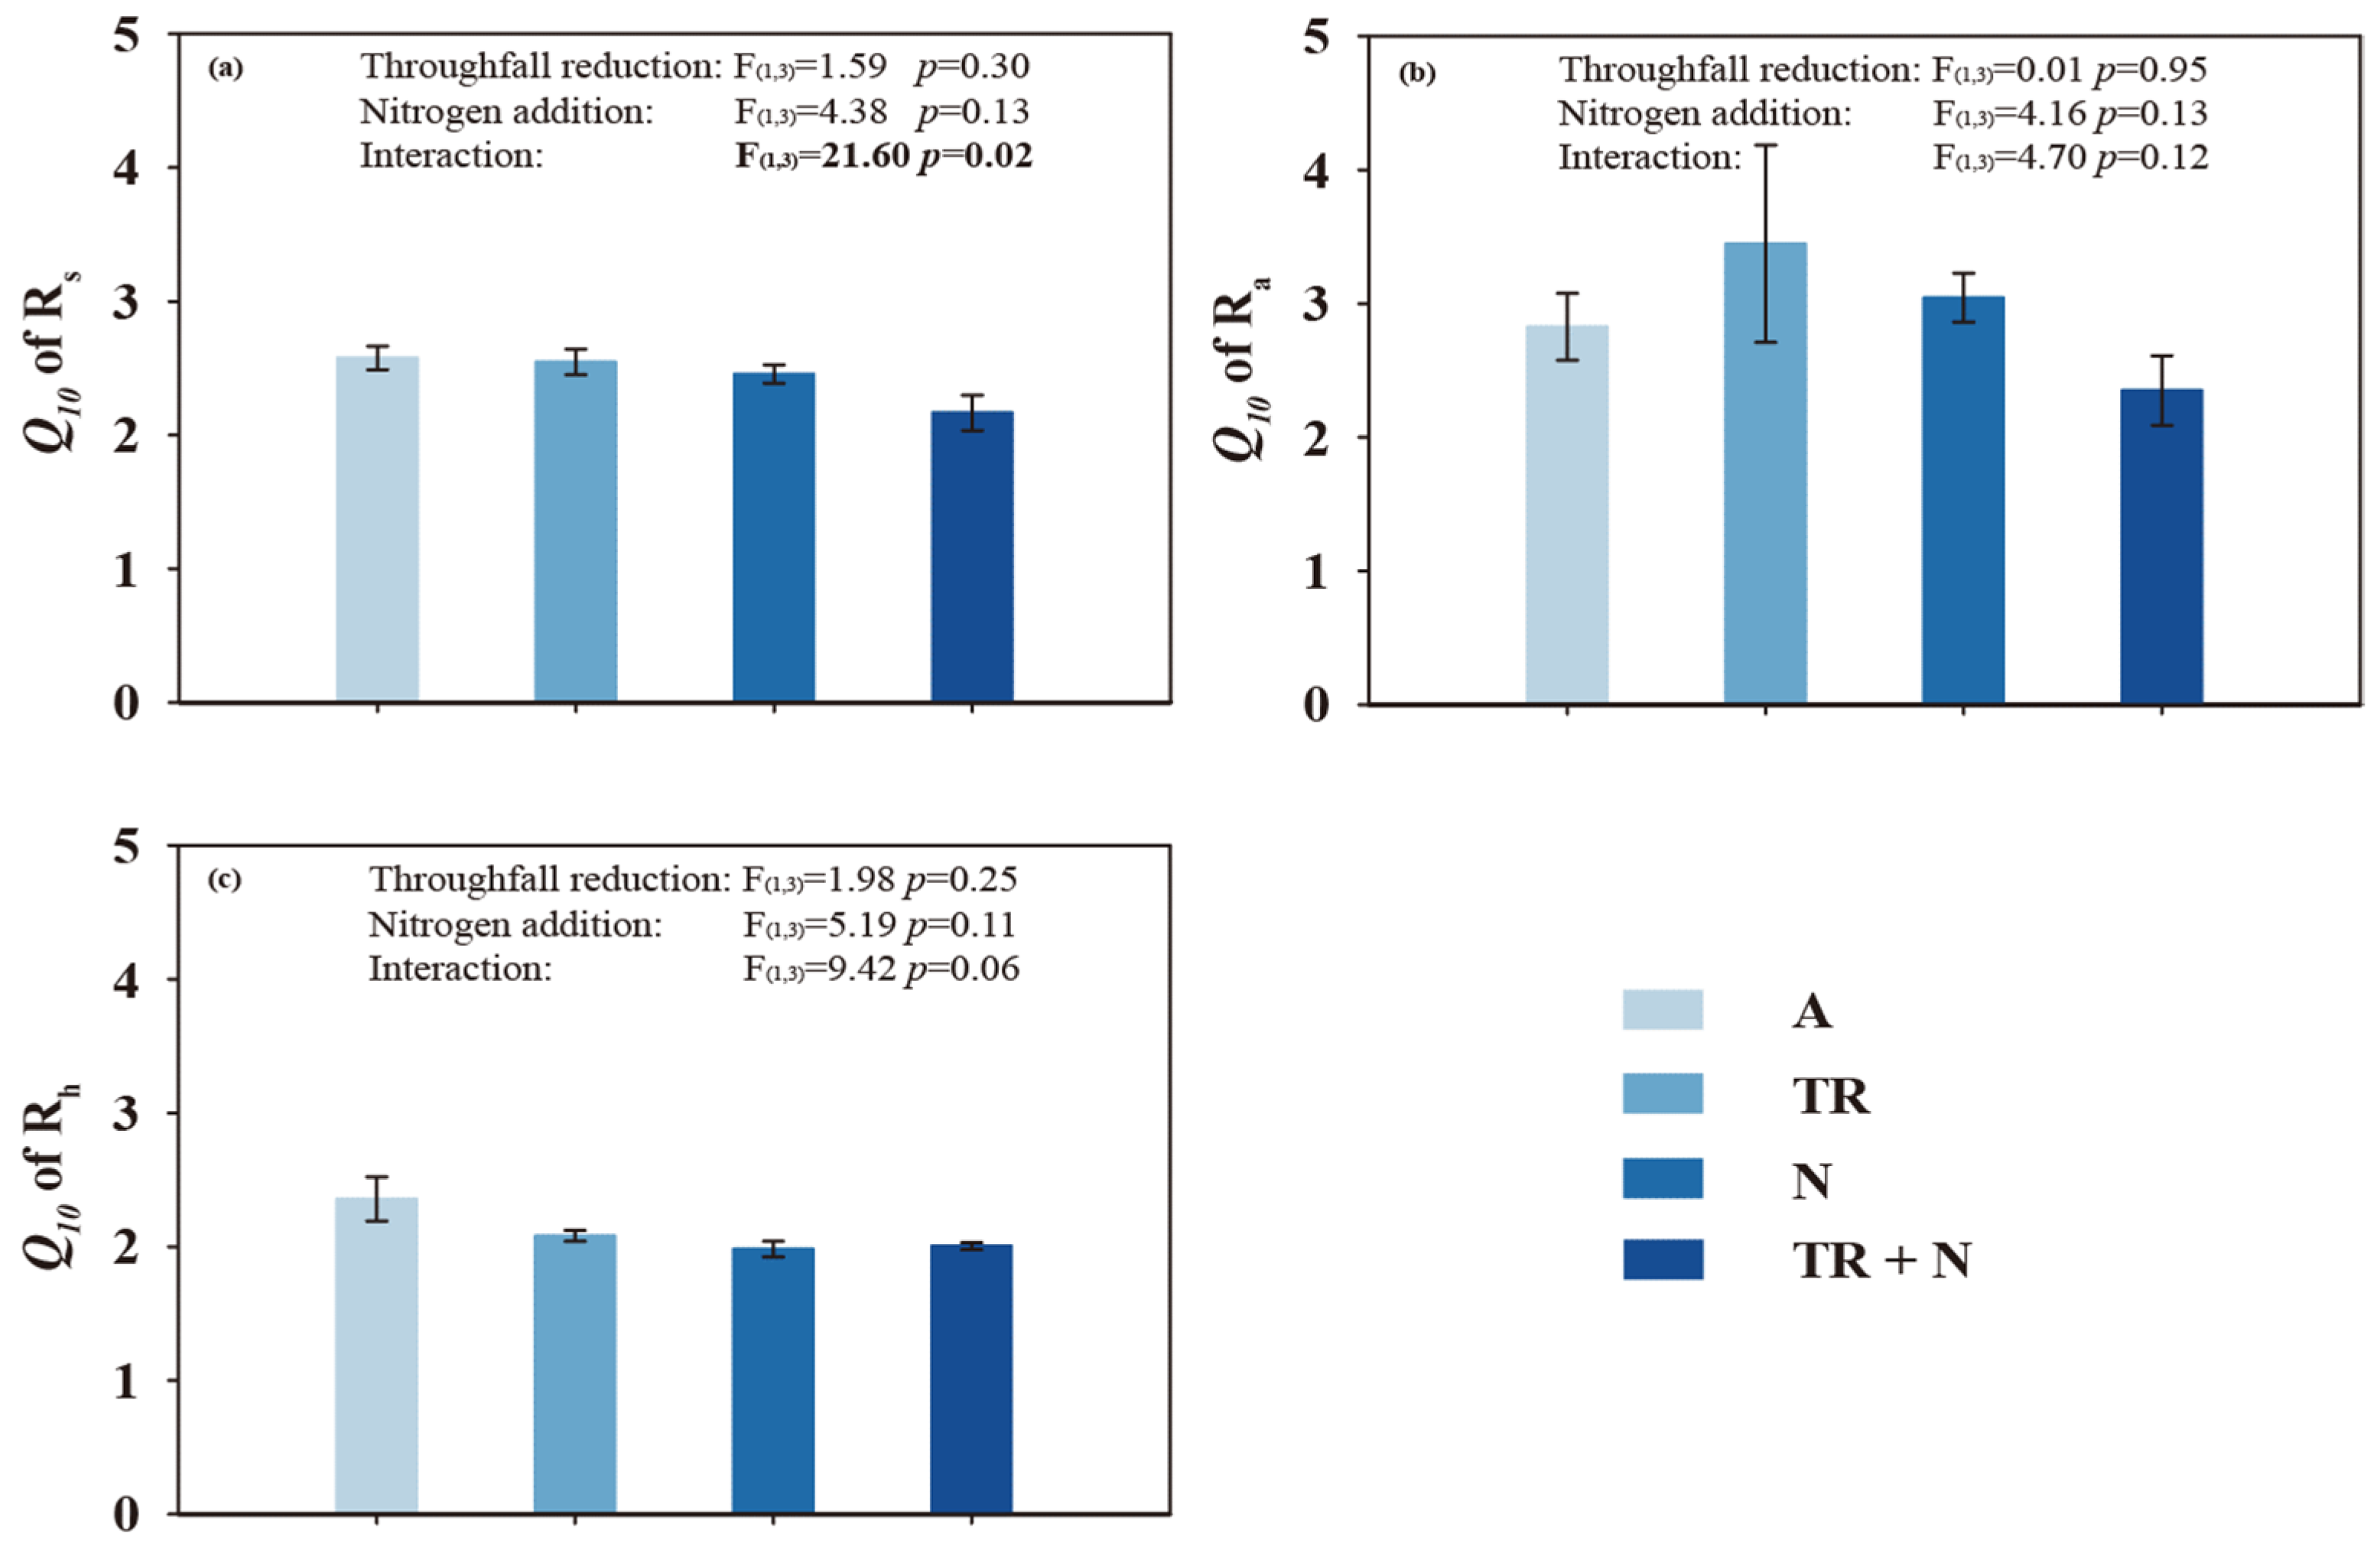
3.4. Throughfall Reduction and N Addition on Temperature Sensitivity of Soil Respiration and Its Components

The fitted Q10 values of Rs ranged from 2.17 to 2.58, the Q10 values of Ra ranged from 2.35 to 3.45 and the Q10 values of Rh ranged from 1.98 to 2.36 (Figure 5). Moreover, there was no significant difference in the Q10 values of Ra and Rh among throughfall reduction, N addition, and their interaction (Figure 5b,c). The effects of the interaction of N addition and throughfall reduction on Q10 values of Rs were significant (p = 0.02). The Q10 values of Rs decreased by 1.21% under TR treatment, but when combined with N addition, it was decreased by 15.93% under TR + N treatment (Figure 5a).

4. Discussion

4.1. Effects of Throughfall Reduction on Soil Respiration and Its Components

Although the previous study had synthesized the diverse responses of Rs to simulated precipitation reduction [40], Rs showed a negative response in most ecosystems around the world [41], indicating the limitation of SWC for soil CO2 emissions in many terrestrial ecosystems. We also found Rs responded negatively to throughfall reduction across the years (Table 1 and Figure 3a), and the result was in full agreement with the findings by Liu et al. [42] and Sun et al. [43], who found Rs was limited under drought conditions. As the two main sources of Rs, the co-response of Ra and Rh determines the responsive directions and magnitudes of Rs to throughfall reduction [16]. The bi-directional responses (positive vs. negative) of Ra and Rh could mask the response of Rs under TR treatment, respectively. Owing to the unequal sensitivities of microbes and plants to soil moisture across different ecosystems, changes in soil moisture could have different impacts on Ra and Rh [16,25]. In our study, we found Ra negatively responds to throughfall reduction (Table 1 and Figure 3d), and our findings were consistent with those of Huang et al. [25] and Zhou et al. [3], who observed Ra was inhibited in subtropical and tropical forests. This is possibly due to drought reduces plant primary productivity and the amount of C allocated to respiration [44]. We also found the decline of FRB and Ra under TR and TR + N treatments (Figure 2g and Figure 3c). It is known that the variation of Ra was correlated with fine root properties [45,46], which could be verified by the positive relationships between Ra and FRB (Table 3), and consequently, change in FRB brought about the decline of Ra under drought conditions.
Different from Ra, throughfall reduction did not affect Rh across the year (Table 1), and our results were in line with those findings in a subtropical forest in China and a Eucalyptus spp. dominating forest in Australia, who reported Rh was less suppressed than Ra during drought conditions [15,25]. Various responses in Ra and Rh to throughfall reduction might result from different responses in FRB and soil microbial biomass to throughfall reduction. Our findings were supported by the significantly negative effect of throughfall reduction on FRB and neutral effect on total PLFAs (Figure 2g,j), which agreed with the results of Huang et al. [25], who found a more pronounced negative effect of drought on FRB than on microbial biomass C. Thus, the unchanged total PLFAs could cause the neutral response of Rh to throughfall reduction. As the important substrate for soil microbes, fine roots supply C to the soil in the form of exudation [47]. Though Rh was tightly coupled with FRB and significant negative effects of throughfall reduction on FRB were obtained, Rh was nonresponsive to throughfall reduction (Table 1 and Table 3). This may be caused by a greater share of photosynthetic C was allocated to exudation, rather than biomass production, under drought conditions [48,49]. In addition to these changes in the amount of exudation, plants also could alter the composition of root exudation when trapped in drought [50]. Therefore, in the case of FRB negatively respond to throughfall reduction (Figure 2g), the labile C substrate such as root exudation, may be not changed and did not limit microbial utilization. The vector length, as an indicator of microbial C limitation [37], was not affected by throughfall reduction (Figure 2i), which further verified Rh was not constrained by C substrate under drought conditions, and thus Rh in our study (Figure 3f and Figure 4c). Therefore, our results showed that the inhibition effect of throughfall reduction on Rs was mainly the result of a decline in Ra and the non-responsive Rh, which supports our first hypothesis.

4.2. Effects of N Addition on Soil Respiration and Its Components

Nitrogen addition did not affect Ra during the observation period (Table 1). Similarly, Chen et al. [51] showed that Ra maintains relative stability by N fertilization. However, Wang et al. [20] reported that N addition alone reduced Ra from subtropical Cunninghamia lanceolata forest. The low response of Ra to N addition in our study was largely attributed to the insignificant response of FRB to N addition (Figure 2g). It has been acknowledged that Ra is driven by belowground C allocation, such as fine root biomass [16], and the close relationship between Ra and FBR was observed in our study (Table 3). Zeng and Wang [52] found that N addition significantly suppressed fine root biomass in N-limited Pinus sylvestris plantations. However, in this study, FRB did not significantly change after N addition. This may be due to the bamboo ecosystem in our study area was P limited [53], and N addition could not affect FRB according to Liebig’s law of the minimum [54] and thus respiration of roots. On the other hand, soil water status could modify the role of N addition on soil C emissions. Chen et al. [55] observed Ra was significantly increased by N fertilization in a year with much less precipitation (544 mm). Accordingly, it was speculated that excessive soil moisture conditions might inhibit the response of Ra to N addition. The precipitation in our study site was 1141 mm, which may alleviate the promoting role of N addition by leaching, hence the neutral response of Ra under N addition was found (Table 1).
Unlike Ra, N addition significantly decreased Rh (Figure 3e and Table 1), this result agreed with that in a subtropical forest, temperate forest, and grassland ecosystems [20,23]. Previous studies found N addition suppressed soil organic matter (SOM) decomposition, leading to a reduction in Rh [30,56]. The retarding effect of N addition on SOM decomposition was supported by the negative correlation between patterns of Rh and vector lengths (Table 3), and the higher value of vector length in our study indicates the more C limitation on soil microbes [37]. Furthermore, N addition may increase chemical stabilization of SOM by increasing the proportion of recalcitrant C that resists microbial decomposition [30], thus soil microbes could be limited by C and lead to the drop of Rh in our study. Consequently, we found that N addition did not affect Ra while decreased Rh by broadening the C limitation on microorganisms in this P-limited bamboo forest, thus led to the negative response of Rs to N addition.

4.3. Interactive Effects of N Addition and Throughfall Reduction on Soil Respiration and Its Components

According to hypothesis 2, N addition relieved the negative response of Ra to throughfall reduction. However, the synergistic non-additive effect of throughfall reduction and N addition on Rs was detected. Interestingly, throughfall reduction significantly decreased Rs by 5.1% and N addition significantly decreased Rs by 1.2%, while their combination further limited Rs and decreased by 18.4% (Figure 3b and Table 1). Our results were opposite to the conclusions drawn by Chen et al. [18] in a temperate forest, who observed N addition or throughfall reduction alone increased Rs, but the increment decreased under their combination. The distinct findings may be attributed to different nutrient limitations across different ecosystems. It has been proved that N addition increases Rs in N-limited ecosystems, while it decreased in N-rich ecosystems [57,58]. Our study site is suffering from P-limited but not from N-limited, thus it may have led to the negative response to N addition or throughfall reduction. As the main components in Rs, Ra contributed more proportions than Rh (Figure 3), hence the negative response of Rs may stem from Ra. Throughfall reduction significantly decreased Ra by 5.4% and N addition did not change Ra, but the combined effect of throughfall reduction and N addition significantly decreased Ra by 8.8% (Figure 3d and Table 1). A previous study showed N deposition enhanced photosynthesis and led to the increment of evapotranspiration in Moso bamboo, and the relatively high evapotranspiration of Moso bamboo may aggravate the role of SWC in regulating root activities [59,60]. Accordingly, the interactive effect of throughfall reduction and N addition may promote the limiting effect of water deficit on root activities, and therefore constrained Ra in our study. Different from the interaction of throughfall reduction and N addition on Rs and Ra, N addition significantly decreased Rh by 25.2%, but combined with throughfall reduction, the interaction had no effect on Rh (Figure 3f and Table 1). N addition alone significantly increased microbial C limitation and led to the decline of Rh [20]. Nevertheless, the vector length was not affected by the combination of N addition and throughfall reduction in our study (Figure 2i), which means drought condition had a barely negative role on microbial C limitation under N addition and thus nonresponsive Rh.
Though N addition or throughfall reduction alone changed Rh and Ra, the effect of N addition or throughfall reduction on Q10 of Rh and Ra was not obvious. Furthermore, the interactive effect of N addition and throughfall reduction on Q10 of Rs was significant (Table 1). The Q10 values of Rs at soil depths of 5 cm ranged from 2.02 to 2.43 and were similar to the observations (2.00–2.30) in bamboo plantation, which was a little lower than that reported global median of 2.4 [39,61,62]. Mo et al. [63] and Jia et al. [64] found ammonium nitrate addition or drier soil could significantly decrease Q10 values of Rs, however, the interaction of N addition and throughfall reduction on Q10 of Rs was rarely reported in the field. Our observations found that N addition or throughfall reduction slightly decreased Q10 values of Rs, but what is interesting is that the combined effect of N addition and throughfall reduction on Q10 values of Rs was significantly decreased. The decline of Q10 values of Rs may reflect variations of the metabolic activity of plant roots and soil microbes under N addition [65]. Though T was not affected by N addition, throughfall reduction, and their combination, Ra and Rh were still lowest under TR + N treatment and determined the response of Rs and Q10 values to the combined effect of N addition or throughfall reduction (Figure 3d,f). Possible reasons for the decreased Q10 values of Rs are: (1) the decreased FRB under TR + N treatment and contributed most in the variations of Rs and Ra; (2) such a decrease in Rh in response to TR + N treatment may be related to physiological acclimatization of microbes [66]; (3) N addition in our study exceeds a certain threshold (90 kg N ha−1 yr−1), and thus led to the reduced Q10 values of Rs [63,67].

5. Conclusions

In this subtropical Moso bamboo forest, Ra was suppressed by throughfall reduction and contribute to the decline of Rs, all of which was governed by FRB. Furthermore, N addition reduced Rh, potentially due to microbial C limitation, leading to the decreased Rs. We also found the interaction of throughfall reduction and N addition further negatively affected Rs and Ra, and the non-additive effect was synergistic. Our findings highlight the need to account for the response to throughfall reduction, N addition, and their interaction between Rs, Ra, and Rh when accurately predicting the responses of ecosystem C cycling on the scenario of concurrence of multiple climate changes.

Supplementary Materials

The following are available online at https://www.mdpi.com/article/10.3390/f12060724/s1, Table S1: Stand density and DBH in ambient, throughfall reduction, N addition and throughfall reduction and N addition sites. Data are arithmetic means ± stand errors for four replicates.

Author Contributions

Conceptualization, S.L. and Y.W.; methodology, F.Z. and Y.D.; investigation, C.C. (Chen Chen). and X.G.; resources, C.C. (Chenjun Cai); writing—original draft preparation, Y.W.; writing—review and editing, S.L. and J.L. All authors have read and agreed to the published version of the manuscript.

Funding

The research was jointly funded by the Basic Scientific Research Funds of the International Center for Bamboo and Rattan (No. 1632017016; No. 1632019015; No. 1632019006) and the National Key R&D Program of China (2016YFD000902; 2018YFD060010402).

Acknowledgments

We sincerely thank the anonymous reviewers for their insightful comments and suggestions to improve our manuscript. We also thank the Changning Bamboo Forest Ecosystem National Research Station for experimental maintenance. Special appreciation goes to Lei Lei of the Chinese Academy of Forestry for the assay and analysis of soil enzyme activities.

Conflicts of Interest

The authors declare no conflict of interest.

References

  1. Bond-Lamberty, B.; Thomson, A. Temperature-associated increases in the global soil respiration record. Nature 2010, 464, 579–582. [Google Scholar] [CrossRef]
  2. IPCC. Climate Change 2013: The Physical Science Basis. Contribution of Working Group I to the Fifth Assessment Report of the Intergovernmental Panel on Climate Change; Cambridge University Press: Cambridge, UK, 2013. [Google Scholar]
  3. Zhou, L.; Liu, Y.; Zhang, Y.; Sha, L.; Song, Q.; Zhou, W.; Balasubramanian, D.; Palingamoorthy, G.; Gao, J.; Lin, Y.; et al. Soil respiration after six years of continuous drought stress in the tropical rainforest in Southwest China. Soil Biol. Biochem. 2019, 138, 107564. [Google Scholar] [CrossRef]
  4. Zhou, X.; Zhou, L.; Nie, Y.; Fu, Y.; Du, Z.; Shao, J.; Zheng, Z.; Wang, X. Similar responses of soil carbon storage to drought and irrigation in terrestrial ecosystems but with contrasting mechanisms: A meta-analysis. Agric. Ecosyst. Environ. 2016, 228, 70–81. [Google Scholar] [CrossRef]
  5. Vitousek, P.M.; Aber, J.D.; Howarth, R.W.; Likens, G.E.; Matson, P.A.; Schindler, D.W.; Schlesinger, W.H.; Tilman, D.G. Human alteration of the global nitrogen cycle sources and consequences. Ecol. Appl. 1997, 7, 737–750. [Google Scholar] [CrossRef] [Green Version]
  6. Galloway, J.N. The global nitrogen cycle: Past, present and future. Sci. China Ser. C Life Sci. 2005, 48, 669–677. [Google Scholar]
  7. Liu, X.; Zhang, Y.; Han, W.; Tang, A.; Shen, J.; Cui, Z.; Vitousek, P.; Erisman, J.W.; Goulding, K.; Christie, P.; et al. Enhanced nitrogen deposition over China. Nature 2013, 494, 459–462. [Google Scholar] [CrossRef]
  8. Song, X.; Peng, C.; Ciais, P.; Li, Q.; Xiang, W.; Xiao, W.; Zhou, G.; Deng, L. Nitrogen addition increased CO2 uptake more than non-CO2 greenhouse gases emissions in a Moso bamboo forest. Sci. Adv. 2020, 6, eaaw5790. [Google Scholar] [CrossRef] [PubMed] [Green Version]
  9. Lehmann, J.; Rillig, M. Distinguishing variability from uncertainty. Nat. Clim. Chang. 2014, 4, 153. [Google Scholar] [CrossRef]
  10. Davidson, E.A.; Belk, E.; Boone, R.D. Soil water content and temperature as independent or confounded factors controlling soil respiration in a temperate mixed hardwood forest. Glob. Chang. Biol. 1998, 4, 217–227. [Google Scholar] [CrossRef] [Green Version]
  11. Rillig, M.C.; Ryo, M.; Lehmann, A.; Aguilar-Trigueros, C.A.; Buchert, S.; Wulf, A.; Iwasaki, A.; Roy, J.; Yang, G. The role of multiple global change factors in driving soil functions and microbial biodiversity. Science 2019, 366, 886–890. [Google Scholar] [CrossRef]
  12. Felzer, B.S.; Cronin, T.W.; Melillo, J.M.; Kicklighter, D.W.; Schlosser, C.A.; Dangal, S.R.S. Nitrogen effect on carbon-water coupling in forests, grasslands, and shrublands in the arid western United States. J. Geophys. Res. 2011, 116. [Google Scholar] [CrossRef] [Green Version]
  13. Kuzyakov, Y. Sources of CO2 efflux from soil and review of partitioning methods. Soil Biol. Biochem. 2006, 38, 425–448. [Google Scholar] [CrossRef]
  14. Wang, Y.; Liu, S.; Wang, J.; Chang, S.X.; Luan, J.; Liu, Y.; Lu, H.; Liu, X. Microbe-mediated attenuation of soil respiration in response to soil warming in a temperate oak forest. Sci. Total Environ. 2020, 711, 134563. [Google Scholar] [CrossRef]
  15. Hinko-Najera, N.; Fest, B.; Livesley, S.J.; Arndt, S.K. Reduced throughfall decreases autotrophic respiration, but not heterotrophic respiration in a dry temperate broadleaved evergreen forest. Agric. For. Meteorol. 2015, 200, 66–77. [Google Scholar] [CrossRef]
  16. Liu, Y.; Liu, S.; Wan, S.; Wang, J.; Luan, J.; Wang, H. Differential responses of soil respiration to soil warming and experimental throughfall reduction in a transitional oak forest in central China. Agric. For. Meteorol. 2016, 226–227, 186–198. [Google Scholar] [CrossRef] [Green Version]
  17. Luan, J.; Wu, J.; Liu, S.; Roulet, N.; Wang, M. Soil nitrogen determines greenhouse gas emissions from northern peatlands under concurrent warming and vegetation shifting. Commun. Biol. 2019, 2, 132. [Google Scholar] [CrossRef]
  18. Chen, F.; Yan, G.; Xing, Y.; Zhang, J.; Wang, Q.; Wang, H.; Huang, B.; Hong, Z.; Dai, G.; Zheng, X.; et al. Effects of N addition and precipitation reduction on soil respiration and its components in a temperate forest. Agric. For. Meteorol. 2019, 271, 336–345. [Google Scholar] [CrossRef]
  19. Wang, Q.; Liu, S.; Wang, Y.; Tian, P.; Sun, T. Influences of N deposition on soil microbial respiration and its temperature sensitivity depend on N type in a temperate forest. Agric. For. Meteorol. 2018, 260–261, 240–246. [Google Scholar] [CrossRef]
  20. Wang, Q.; Zhang, W.; Sun, T.; Chen, L.; Pang, X.; Wang, Y.; Xiao, F. N and P fertilization reduced soil autotrophic and heterotrophic respiration in a young Cunninghamia lanceolata forest. Agric. For. Meteorol. 2017, 232, 66–73. [Google Scholar] [CrossRef]
  21. Wang, B.; Zha, T.S.; Jia, X.; Wu, B.; Zhang, Y.Q.; Qin, S.G. Soil moisture modifies the response of soil respiration to temperature in a desert shrub ecosystem. Biogeosciences 2014, 11, 259–268. [Google Scholar] [CrossRef] [Green Version]
  22. Davidson, E.A.; Verchot, L.V.; Cattânio, J.H.; Ackerman, I.L.; Carvalho, J.E.M. Effects of soil water content on soil respiration in forests and cattle pastures of eastern Amazonia. Biogeochemistry 2000, 48, 53–69. [Google Scholar] [CrossRef]
  23. Zhou, L.; Zhou, X.; Zhang, B.; Lu, M.; Luo, Y.; Liu, L.; Li, B. Different responses of soil respiration and its components to nitrogen addition among biomes: A meta-analysis. Glob. Chang. Biol. 2014, 20, 2332–2343. [Google Scholar] [CrossRef]
  24. Yan, L.; Chen, S.; Huang, J.; Lin, G. Differential responses of auto- and heterotrophic soil respiration to water and nitrogen addition in a semiarid temperate steppe. Glob. Chang. Biol. 2010, 16, 2345–2357. [Google Scholar] [CrossRef]
  25. Huang, S.; Ye, G.; Lin, J.; Chen, K.; Xu, X.; Ruan, H.; Tan, F.; Chen, H.Y.H. Autotrophic and heterotrophic soil respiration responds asymmetrically to drought in a subtropical forest in the Southeast China. Soil Biol. Biochem. 2018, 123, 242–249. [Google Scholar] [CrossRef]
  26. Song, X.; Zhou, G.; Jiang, H.; Yu, S.; Fu, J.; Li, W.; Wang, W.; Ma, Z.; Peng, C. Carbon sequestration by Chinese bamboo forests and their ecological benefits: Assessment of potential, problems, and future challenges. Environ. Rev. 2011, 19, 418–428. [Google Scholar] [CrossRef] [Green Version]
  27. Mi, N.; Yu, G.; Wen, X.; Sun, X.; Wang, S.; Zhang, L.; Song, X. Use of ecosystem flux data and a simulation model to examine seasonal drought effects on a subtropical coniferous forest. Asia Pac. J. Atmos. Sci. 2009, 45, 207–220. [Google Scholar]
  28. Dai, A. Drought under global warming: A review. Wiley Interdisciplinary Rev. Clim. Chang. 2011, 2, 45–65. [Google Scholar] [CrossRef] [Green Version]
  29. Yu, G.; Jia, Y.; He, N.; Zhu, J.; Chen, Z.; Wang, Q.; Piao, S.; Liu, X.; He, H.; Guo, X.; et al. Stabilization of atmospheric nitrogen deposition in China over the past decade. Nat. Geosci. 2019, 12, 424–429. [Google Scholar] [CrossRef]
  30. Janssens, I.A.; Dieleman, W.; Luyssaert, S.; Subke, J.A.; Reichstein, M.; Ceulemans, R.; Ciais, P.; Dolman, A.J.; Grace, J.; Matteucci, G.; et al. Reduction of forest soil respiration in response to nitrogen deposition. Nat. Geosci. 2010, 3, 315–322. [Google Scholar] [CrossRef]
  31. Wu, X.; Liu, S.; Luan, J.; Wang, Y.; Cai, C. Responses of water use in Moso bamboo (Phyllostachys heterocycla) culms of different developmental stages to manipulative drought. For. Ecosyst. 2019, 6, 31. [Google Scholar] [CrossRef] [Green Version]
  32. Bossio, D.A.; Scow, K.M. Impacts of carbon and flooding on soil microbial communities: Phospholipid fatty acid profiles and substrate utilization patterns. Microb. Ecol. 1998, 35, 265–278. [Google Scholar] [CrossRef] [PubMed]
  33. Frostegård, Å.; Tunlid, A.; Bååth, E. Phospholipid fatty acid composition, biomass, and activity of microbial communities from two soil types experimentally exposed to different heavy metals. Appl. Environ. Microbiol. 1993, 59, 3605–3617. [Google Scholar] [CrossRef] [PubMed] [Green Version]
  34. Saiya-Cork, K.R.; Sinsabaugha, R.L.; Zak, D.R. The effects of long term nitrogen deposition on extracellular enzyme activity in an Acer saccharum forest soil. Soil Biol. Biochem. 2002, 34, 1309–1315. [Google Scholar] [CrossRef]
  35. Sinsabaugh, R.L.; Lauber, C.L.; Weintraub, M.N.; Ahmed, B.; Allison, S.D.; Crenshaw, C.; Contosta, A.R.; Cusack, D.; Frey, S.; Gallo, M.E.; et al. Stoichiometry of soil enzyme activity at global scale. Ecol. Lett. 2008, 11, 1252–1264. [Google Scholar] [CrossRef] [PubMed]
  36. Sistla, S.A.; Schimel, J.P. Seasonal patterns of microbial extracellular enzyme activities in an arctic tundra soil: Identifying direct and indirect effects of long-term summer warming. Soil Biol. Biochem. 2013, 66, 119–129. [Google Scholar] [CrossRef]
  37. Moorhead, D.L.; Rinkes, Z.L.; Sinsabaugh, R.L.; Weintraub, M.N. Dynamic relationships between microbial biomass, respiration, inorganic nutrients and enzyme activities: Informing enzyme-based decomposition models. Front. Microbiol. 2013, 4, 223. [Google Scholar] [CrossRef] [Green Version]
  38. Jing, X.; Chen, X.; Fang, J.; Ji, C.; Shen, H.; Zheng, C.; Zhu, B. Soil microbial carbon and nutrient constraints are driven more by climate and soil physicochemical properties than by nutrient addition in forest ecosystems. Soil Biol. Biochem. 2020, 141, 107657. [Google Scholar] [CrossRef]
  39. Hu, S.; Li, Y.; Chang, S.X.; Li, Y.; Yang, W.; Fu, W.; Liu, J.; Jiang, P.; Lin, Z. Soil autotrophic and heterotrophic respiration respond differently to land-use change and variations in environmental factors. Agric. For. Meteorol. 2018, 250–251, 290–298. [Google Scholar] [CrossRef]
  40. Zhou, L.; Zhou, X.; Shao, J.; Nie, Y.; He, Y.; Jiang, L.; Wu, Z.; Hosseini Bai, S. Interactive effects of global change factors on soil respiration and its components: A meta-analysis. Glob. Chang. Biol. 2016, 22, 3157–3169. [Google Scholar] [CrossRef]
  41. Liu, L.; Wang, X.; Lajeunesse, M.J.; Miao, G.; Piao, S.; Wan, S.; Wu, Y.; Wang, Z.; Yang, S.; Li, P.; et al. A cross-biome synthesis of soil respiration and its determinants under simulated precipitation changes. Glob. Chang. Biol. 2016, 22, 1394–1405. [Google Scholar] [CrossRef] [PubMed] [Green Version]
  42. Liu, Y.; Li, J.; Jin, Y.; Zhang, Y.; Sha, L.; Grace, J.; Song, Q.; Zhou, W.; Chen, A.; Li, P.; et al. The influence of drought strength on soil respiration in a woody savanna ecosystem, southwest China. Plant Soil. 2018, 428, 321–333. [Google Scholar] [CrossRef]
  43. Sun, S.; Lei, H.; Chang, S.X. Drought differentially affects autotrophic and heterotrophic soil respiration rates and their temperature sensitivity. Biol. Fertil. Soils 2019, 55, 275–283. [Google Scholar] [CrossRef]
  44. Harper, C.W.; Blair, J.M.; Fay, P.A.; Knapp, A.K.; Carlisle, J.D. Increased rainfall variability and reduced rainfall amount decreases soil CO2 flux in a grassland ecosystem. Glob. Chang. Biol. 2005, 11, 322–334. [Google Scholar] [CrossRef]
  45. Paradiso, E.; Jevon, F.; Matthes, J. Fine root respiration is more strongly correlated with root traits than tree species identity. Ecosphere. 2019, 10, e02944. [Google Scholar] [CrossRef]
  46. Wei, S.; Tie, L.; Liao, J.; Liu, X.; Du, M.; Lan, S.; Li, X.; Li, C.; Zhan, H.; Huang, C. Nitrogen and phosphorus co-addition stimulates soil respiration in a subtropical evergreen broad-leaved forest. Plant Soil 2020, 450, 171–182. [Google Scholar] [CrossRef]
  47. Högberg, M.N.; Högberg, P. Extramatrical ectomycorrhizal mycelium contributes one-third of microbial biomass and produces, together with associated roots, half the dissolved organic carbon in a forest soil. New Phytol. 2002, 154, 791–795. [Google Scholar] [CrossRef]
  48. Karst, J.; Gaster, J.; Wiley, E.; Landhausser, S.M. Stress differentially causes roots of tree seedlings to exude carbon. Tree Physiol. 2017, 37, 154–164. [Google Scholar] [CrossRef] [Green Version]
  49. Preece, C.; Farre-Armengol, G.; Llusia, J.; Penuelas, J. Thirsty tree roots exude more carbon. Tree Physiol. 2018, 38, 690–695. [Google Scholar] [CrossRef] [Green Version]
  50. Williams, A.; de Vries, F.T. Plant root exudation under drought: Implications for ecosystem functioning. New Phytol. 2020, 225, 1899–1905. [Google Scholar] [CrossRef] [Green Version]
  51. Chen, Z.; Xu, Y.; He, Y.; Zhou, X.; Fan, J.; Yu, H.; Ding, W. Nitrogen fertilization stimulated soil heterotrophic but not autotrophic respiration in cropland soils: A greater role of organic over inorganic fertilizer. Soil Biol. Biochem. 2018, 116, 253–264. [Google Scholar] [CrossRef]
  52. Zeng, W.; Wang, W. Combination of nitrogen and phosphorus fertilization enhance ecosystem carbon sequestration in a nitrogen-limited temperate plantation of Northern China. For. Ecol. Manag. 2015, 341, 59–66. [Google Scholar] [CrossRef]
  53. Gao, X.; Liu, S.; Wang, Y.; Luan, J.; Cai, C.; Ren, L. Effects of throughfall recduction and nitrogen addition on stoichiometry of leaf and fine root in Phyllostachys edulis forests. Acta Ecol. Sin. 2020. [Google Scholar] [CrossRef]
  54. Chapin, F.S., III. The mineral nutrition of wild plants. Annu. Rev. Ecol. Syst. 1980, 11, 230–236. [Google Scholar] [CrossRef]
  55. Chen, Z.; Xu, Y.; Fan, J.; Yu, H.; Ding, W. Soil autotrophic and heterotrophic respiration in response to different N fertilization and environmental conditions from a cropland in Northeast China. Soil Biol. Biochem. 2017, 110, 103–115. [Google Scholar] [CrossRef]
  56. Bowden, R.D.; Davidson, E.; Savage, K.; Arabia, C.; Steudler, P. Chronic nitrogen additions reduce total soil respiration and microbial respiration in temperate forest soils at the Harvard Forest. For. Ecol. Manag. 2004, 196, 43–56. [Google Scholar] [CrossRef]
  57. Cusack, D.F.; Silver, W.L.; Torn, M.S.; McDowell, W.H. Effects of nitrogen additions on above- and belowground carbon dynamics in two tropical forests. Biogeochemistry 2011, 104, 203–225. [Google Scholar] [CrossRef] [Green Version]
  58. Hyvönen, R.; Ågren, G.I.; Linder, S.; Persson, T.; Cotrufo, M.F.; Ekblad, A.; Freeman, M.; Grelle, A.; Janssens, I.A.; Jarvis, P.G.; et al. The likely impact of elevated [CO2], nitrogen deposition, increased temperature and management on carbon sequestration in temperate and boreal forest ecosystems: A literature review. New Phytol. 2007, 173, 463–480. [Google Scholar] [CrossRef]
  59. Zhang, R.; Wu, J.; Li, Q.; Hänninen, H.; Peng, C.; Yao, H.; Song, X.; Ying, Y. Nitrogen deposition enhances photosynthesis in Moso bamboo but increases susceptibility to other stress factors. Front. Plant Sci. 2017, 8, 1975. [Google Scholar] [CrossRef] [PubMed] [Green Version]
  60. Zhang, M.; Chen, S.; Jiang, H.; Lin, Y.; Zhang, J.; Song, X.; Zhou, G. Water-Use Characteristics and Physiological Response of Moso Bamboo to Flash Droughts. Int. J. Environ. Res. Public Health 2019, 16, 2174. [Google Scholar] [CrossRef] [Green Version]
  61. Raich, J.W.; Schlesinger, W.H. The global carbon dioxide flux in soil respiration and its relationship to vegetation and climate. Tellus B Chem. Phys. Meteorol. 2017, 44, 81–99. [Google Scholar] [CrossRef] [Green Version]
  62. Song, X.; Yuan, H.; Kimberley, M.O.; Jiang, H.; Zhou, G.; Wang, H. Soil CO2 flux dynamics in the two main plantation forest types in subtropical China. Sci. Total Environ. 2013, 444, 363–368. [Google Scholar] [CrossRef]
  63. Mo, J.; Zhang, W.E.I.; Zhu, W.; Gundersen, P.E.R.; Fang, Y.; Li, D.; Wang, H.U.I. Nitrogen addition reduces soil respiration in a mature tropical forest in southern China. Glob. Chang. Biol. 2008, 14, 403–412. [Google Scholar] [CrossRef]
  64. Jia, X.; Shao, M.a.; Wei, X. Soil CO2 efflux in response to the addition of water and fertilizer in temperate semiarid grassland in northern China. Plant Soil. 2013, 373, 125–141. [Google Scholar] [CrossRef]
  65. Zhang, C.; Niu, D.; Hall, S.J.; Wen, H.; Li, X.; Fu, H.; Wan, C.; Elser, J.J. Effects of simulated nitrogen deposition on soil respiration components and their temperature sensitivities in a semiarid grassland. Soil Biol. Biochem. 2014, 75, 113–123. [Google Scholar] [CrossRef]
  66. Davidson, E.A.; Janssens, I.A.; Luo, Y. On the variability of respiration in terrestrial ecosystems: Moving beyond Q10. Glob. Chang. Biol. 2006, 12, 154–164. [Google Scholar] [CrossRef]
  67. Li, Q.; Song, X.; Chang, S.X.; Peng, C.; Xiao, W.; Zhang, J.; Xiang, W.; Li, Y.; Wang, W. Nitrogen depositions increase soil respiration and decrease temperature sensitivity in a Moso bamboo forest. Agric. For. Meteorol. 2019, 268, 48–54. [Google Scholar] [CrossRef]
Figure 1. Temporal variation of soil temperature (Graph (a,b)) and soil moisture (Graph (c,d)) under ambient (A), throughfall reduction (TR), N addition (N) and throughfall reduction, and N addition (TR + N) treatments from September 2017 to August 2018. The error bar represented arithmetic means ± stand errors for four replicates.
Forests 12 00724 g001
Figure 2. Soil properties, fine roots biomass, and vector analysis of soil enzymatic stoichiometry in soils under ambient (A), throughfall reduction (TR), N addition (N), and throughfall reduction and N addition (TR + N) treatments. TOC: soil total carbon (Graph (a)); TN: soil total nitrogen (Graph (b)); TP: soil total phosphorus (Graph (c)); pH: soil pH values (Graph (d)); NO3-N: nitrate nitrogen (Graph (e)); NH4-N: ammonium nitrogen (Graph (f)); FRB: fine root biomass (Graph (g)); Vector Degree (Graph (h)); Vector Length (Graph (i)); Total PLFAs: soil phospholipid fatty acid (Graph (j)). The error bar represented arithmetic means ± stand errors for four replicates.
Forests 12 00724 g002aForests 12 00724 g002b
Figure 3. Temporal variation of soil respiration (Rs) (Graph (a)), soil autotrophic respiration (Ra) (Graph (c)), soil heterotrophic respiration (Rh) (Graph (e)), annual cumulative Rs (Graph (b)), annual cumulative Ra (Graph (d)) and annual cumulative Rh (Graph (f)) under ambient (A), throughfall reduction (TR), N addition (N) and throughfall reduction and N addition (TR + N) treatments from September 2017 to August 2018. The error bar represented arithmetic means ± stand errors for four replicates.
Forests 12 00724 g003
Figure 4. Principle components analysis (PCA) of soil respiration (Graph (a)), soil autotrophic respiration (Graph (b)) and soil heterotrophic respiration (Graph (c)) under ambient (A), throughfall reduction (TR), N addition (N) and throughfall reduction and N addition (TR + N) treatments.
Forests 12 00724 g004
Figure 5. Comparison of temperature sensitivity of soil respiration (Rs) (Graph (a)), soil autotrophic respiration (Ra) (Graph (b)) and soil heterotrophic respiration (Rh) (Graph (c)) under ambient (A), throughfall reduction (TR), N addition (N) and N addition and throughfall reduction (TR + N) treatments. The error bar represented arithmetic means ± stand errors for four replicates.
Forests 12 00724 g005
Table 1. F-values and p-values of three-way ANOVA on the effects of measured time, throughfall reduction, N addition, and their interactions on soil respiration (Rs), soil autotrophic respiration (Ra), and soil heterotrophic respiration (Rh).
RsRaRh
TimeF(13,168) = 73.1
p < 0.001
F(13,168) = 29.7
p < 0.001
F(13,168) = 78.4
p < 0.001
Throughfall reductionF(1,168) = 14.2
p < 0.001
F(1,168) = 9.9
p = 0.002
F(1,168) = 3.5
p = 0.063
N additionF(1,168) = 5.4
p = 0.021
F(1,168) = 1.9
p = 0.174
F(1,168) = 97.2
p < 0.001
Throughfall reduction × N additionF(1,168) = 4.5
p = 0.034
F(1,168) = 5.5
p = 0.020
F(1,168) = 0.2
p = 0.633
Throughfall reduction × TimeF(13,168) = 1.6
p = 0.090
F(13,168) = 2.1
p = 0.019
F(13,168) = 0.9
p = 0.522
N addition × TimeF(13,168) = 0.6
p = 0.858
F(13,168) = 0.2
p = 0.999
F(13,168) = 4.1
p < 0.001
Throughfall reduction × N addition × TimeF(13,168) = 0.6
p = 0.867
F(13,168) = 0.6
p = 0.845
F(13,168) = 0.6
p = 0.881
Table 2. Parameter estimates of bivariate exponential models for Rs, Ra, and Rh as a function of soil temperature (T) and moisture (SWC) in the 0–10 cm soil from September 2017 to August 2018 in different treatments (mean ± SE).
abcR2p
Rs = a.ebT.SWCc
A0.55 ± 0.080.09 ± 0.000.47 ± 0.230.890.000
TR0.76 ± 0.180.09 ± 0.000.52 ± 0.230.870.000
N0.58 ± 0.090.09 ± 0.000.43 ± 0.230.810.000
TR + N0.73 ± 0.120.08 ± 0.000.39 ± 0.050.760.000
Ra = a.ebT.SWCc
A0.16 ± 0.030.10 ± 0.010.03 ± 0.320.780.000
TR0.31 ± 0.140.12 ± 0.020.54 ± 0.380.690.000
N0.23 ± 0.090.11 ± 0.01−0.08 ±0.760.670.000
TR + N0.35 ± 0.170.08 ± 0.010.07 ± 0.330.510.000
Rh = a.ebT.SWCc
A0.45 ± 0.030.09 ± 0.011.13 ± 0.130.860.000
TR0.55 ± 0.080.07 ± 0.000.78 ± 0.190.800.000
N0.51 ± 0.150.07 ± 0.001.14 ± 0.440.780.000
TR + N0.51 ± 0.140.07 ± 0.000.85 ± 0.350.750.000
Table 3. The correlation coefficients between soil respiration and its components and soil biotic and abiotic factors.
TOCTNTPpHNO3-NNH4-NTotal PLFAsFRBVector Degree Vector Length
Rs−0.1410.009−0.4020.391−0.1860.2100.3120.680 **0.377−0.477
Ra−0.0800.175−0.3230.371−0.1250.1970.1650.534 *0.262−0.236
Rh−0.188−0.392−0.3140.166−0.2030.0980.4430.554 *0.386−0.716 **
Notes: Rs represents soil respiration; Ra represents soil autotrophic respiration; Rh represents soil heterotrophic respiration; TOC represents soil total organic carbon content; TN represents total nitrogen content; TP represents total phosphorus content; NO3-N represents nitrate nitrogen; NH4-N represents ammonium nitrogen; Total PLFAs represents soil microbial biomass; FRB represents fine root biomass; vector degree represents relative P vs. N limitation; vector length represents relative C vs. nutrient limitation. Data of Rs, Ra, and Rh used in Pearson analysis were calculated from the mean values from June to August; * denotes p < 0.05; ** denotes p < 0.01.
Publisher’s Note: MDPI stays neutral with regard to jurisdictional claims in published maps and institutional affiliations.

