Article

Effects of Windthrows on Forest Cover, Tree Growth and Soil Characteristics in Drought-Prone Pine Plantations

1
Instituto Pirenaico de Ecología (IPE-CSIC), 50019 Zaragoza, Spain
2
School of Agricultural, Forest, Food and Environmental Sciences (SAFE), University of Basilicata, 85100 Potenza, Italy
3
Instituto de Recursos Naturales y Agrobiología de Salamanca (IRNASA-CSIC), C. Cordel de Merinas 40-52, 37008 Salamanca, Spain
4
Unidad Asociada Grupo de Interacción Planta-Microorganismo, Universidad de Salamanca-IRNASA-CSIC, 37008 Salamanca, Spain
*
Author to whom correspondence should be addressed.
Forests 2021, 12(7), 817; https://doi.org/10.3390/f12070817
Submission received: 2 June 2021 / Revised: 11 June 2021 / Accepted: 18 June 2021 / Published: 22 June 2021

Abstract

:
Windstorms are forest disturbances which generate canopy gaps. However, their effects on Mediterranean forests are understudied. To fill that research gap, changes in tree, cover, growth and soil features in Pinus halepensis and Pinus sylvestris plantations affected by windthrows were quantified. In each plantation, trees and soils in closed-canopy stands and gaps created by the windthrow were sampled. Changes in tree cover and radial growth were assessed by using the Normalized Difference Vegetation Index (NDVI) and dendrochronology, respectively. Soil features including texture, nutrients concentration and soil microbial community structure were also analyzed. Windthrows reduced tree cover and enhanced growth, particularly in the P. halepensis site, which was probably more severely impacted. Soil characteristics were also more altered by the windthrow in this site: the clay percentage increased in gaps, whereas K and Mg concentrations decreased. The biomass of Gram positive bacteria and actinomycetes increased in gaps, but the biomass of Gram negative bacteria and fungi decreased. Soil gaps became less fertile and dominated by bacteria after the windthrow in the P. halepensis site. We emphasize the relevance of considering post-disturbance time recovery and disturbance intensity to assess forest resilience within a multi-scale approach.

1. Introduction

European forests are being increasingly impacted by disturbances such as windstorms [1,2,3]. Wind disturbances are intensifying at global and continental scales and such a tendency is forecasted to continue with ongoing climate change [4,5]. An increase in the frequency and severity of wind disturbances could compromise the capacity of European forests to uptake and store carbon [6], and negatively impact economic activities depending on timber and non-woody products and related ecosystem services (climate warming mitigation, regulation of the water cycle, soil formation, etc.) [3].
During the 20th century, European forests densified and encroached into grasslands and scrublands, which led to a composition shift from stands dominated by more wind-tolerant broadleaved species towards more unstable conifer stands, often with structures (too dense, tall and even-aged stands) prone to wind damage [1]. Pine plantations illustrate this vulnerability to wind disturbances, since their low variation in tree size and elevated density may lead to greater height/diameter ratios of dominant trees, making them more vulnerable against windthrow [7]. Topography and soil conditions may also influence windthrow damage in pine plantations. For instance, in the case of Pinus radiata, windthrow damage increases in sites with shallow soils, whereas mid-stem breakage is associated with deep rooting [8]. However, the impacts of windthrows on seasonally dry areas such as Mediterranean pine forests and plantations have been scarcely studied.
By altering the canopy layer, forest disturbances such as windthrows determine biodiversity patterns and dynamics in understory and the soil microbial community [9,10]. In temperate regions, tree regeneration depends on the creation of large- and small-scale gaps that are often associated with the occurrence of windstorms [11]. Furthermore, plant diversity in the understory as well as herbaceous and shrub coverage is strongly linked to the presence of canopy gaps [12]. All these changes across forest layers increase forest vertical heterogeneity, modify soil characteristics (texture, pH, nutrient content) and affect soil microbial composition [9]. After the occurrence of severe disturbances, tree disappearance may increase the presence of saprophytic soil biota including bacteria while reducing the abundance of fungi, which may be more abundant under closed-canopy sites [13].
There are detailed reviews on the wind effects on trees and stands, and on the impacts of windthrow and the post-disturbance recovery [14,15]. However, these reviews mainly dealt with boreal, temperate and tropical forests, whilst they did not mention the impacts of windthrow on Mediterranean, drought-prone forests and plantations. There is a research gap on how wind storms may affect these areas where forest productivity is mainly driven by water shortages [16]. This gap of knowledge should be filled because these forest ecosystems may be vulnerable to the compound impacts of wind storms and drought. However, we do not know how wind-damaged stands will respond to drought or their post-disturbance resilience. We also lack information on how the coverage of the understory and soil microbial composition will respond to wind through induced gap creation. Furthermore, this information is required to disentangle the different impacts of disturbances (wind damage, drought-induced canopy dieback) on canopy structure and tree growth, which are important drivers of soil microbial activity in Mediterranean forests [17].
Strong-convective surface winds of a small spatial scale (0.1 to 1 km2) and short duration (several minutes) have a high damaging potential in Mediterranean countries such as Spain [18]. They constitute relatively frequent disturbances, occurring on average every 1–7 years, and are associated with active fronts, convective storms or small tornadoes [19]. For example, in January 2017 and 2020 the David and Gloria storms severely impacted eastern Spain with high winds, heavy rainfall and snowfall records (Figure S1). Therefore, the impacts of these relatively frequent windthrows on Mediterranean forests should be accounted for considering adequate spatial and temporal scales.
Here changes of tree cover and greenness, tree growth and soil features were explored in two seasonally dry pine plantations subjected to recent windthrows. Our objectives were to test for differences in forest cover using the Normalized Difference Vegetation Index (NDVI), a surrogate of changes in greenness [20], radial growth and soil features (texture, nutrients and microbial community composition) between unaltered stands and nearby gaps created by windthrows. The study focused on plantations of two pine species (Pinus sylvestris, Pinus halepensis) severely impacted by windthrows during the David and Gloria storms which occurred in 2017 and 2020, respectively (Figure S1). The plantations are located in southern Aragón, a drought-prone area of north-eastern Spain. It was expected that the impacts of windthrow on NDVI and growth will be stronger in the P. halepensis plantation, which presented more affected areas and, consequently, we inferred a higher windthrow severity. The postulated positive impact of windthrow on growth of surviving trees should diminish as we move from the resulting gaps or open areas towards nearby, undisturbed, dense patches. Regarding soils, we expected differences in soil microbial community composition as a consequence of changes in cover and associated soil microhabitat. Specifically, it was hypothesized that fungi will dominate in closed-canopy stands, under shady conditions and under wetter conditions, whereas bacteria will dominate in the gaps under sunnier and drier conditions [21,22]. It was also hypothesized that the longer the time since the disturbance occurrence, the larger the differences in soil physical and chemical characteristics between open (gap) and closed (undisturbed) patches will be. Thus, we expected larger differences of soils between sites in the P. halepensis plantation, which was affected by a storm in 2017, than in the P. sylvestris plantation, which was affected by a storm in 2020.

2. Materials and Methods

2.1. Study Sites

Two sites located in Aragón, north-eastern Spain, were studied. Both are pine plantations that were severely impacted by windthrows during recent winter wind storms, which caused tree uprooting, stem breakage and elevated tree mortality (Figure 1 and Figure S1).
The P. sylvestris site (41°05′07″ N, 01°30′37″ W, 1247 m above mean sea level; situated near the Orcajo village) is located in a gentle (10°) slope with NE exposure and rocky soils. It was affected by the Gloria storm, which impacted eastern Spain and southernmost France with high winds and heavy rainfall on late January 2020 (Figure S1a). Mean temperature is 9 °C (mean minimum and maximum temperatures are −3.0 °C and 18.0 °C, respectively) and total annual precipitation is 492 mm, with a period of water shortage from July to September (data from Daroca station, 1.41° W, 41.11° N, 749 m above mean sea level). Snow precipitation may fall from November to February. The soils are acid, shallow (30–50 cm deep) developed over sandstones. The natural vegetation is dominated by Mediterranean oaks (Quercus ilex, Quercus faginea) and dwarf shrubs (Genista scorpius, Lavandula stoechas, Arctostaphylos uva-ursi, Thymus vulgaris, Cistus spp.). We sampled an affected area of ca. 18,000 m2. The mean height of dominant trees is 12 m and the mean tree-to-tree distance is 4 m. Tree density ranges from 80 ind ha−1 in the gap of the affected patch to 1100 ind ha−1 in the little affected buffer zone, respectively. In this site, thinning was done in the 2000s and 2010s to reduce stand density, which proved the existence of abundant stumps in the sampled stands.
The P. halepensis site (40°08′21″ N, 0°41′57″ W, 879 m above mean sea level; situated near the Olba village) is located in a steep (30°) slope with S-SE exposure and rocky, thin (30–40 cm depth) soils. It was affected by a severe windstorm related to a cold front affecting north-eastern Spain from 17 to 20 January 2017 (Figure S1b). Climate in this area is warmer than in the P. sylvestris site. Mean temperature is 13.4 °C (mean minimum and maximum temperatures are 1.3 °C and 30.4 °C, respectively) and total annual precipitation is 470 mm, with a period of water shortage lasting from June to September (data from Sarrión station, 0.82° W, 40.14° N, 988 m above mean sea level). Winter snow precipitation is rare and lasts few days. Here, we sampled an affected area encompassing 9500 m2, but the affected area included circa 5 ha. Tree density ranges from 70 ind ha−1 in the gap to 750 ind ha−1 in the undisturbed, dense stands. The mean height of dominant trees is 9 m and the mean tree-to-tree distance is 2 m. The natural vegetation is a typical Mediterranean scrubland with Quercus coccifera, G. scorpius, Rosmarinus officinalis, Juniperus phoenicea and Juniperus oxycedrus. In this site, no thinning or pruning operations have been carried out since 1965.

2.2. Field Sampling Design and Laboratory Processing

In each site, 10–11 living trees situated within the stand gap were selected. The the area of the disturbed patch with lowest cover and where the windthrow impact was assumed to be the most intense was considered as the gap (Figure S2a). Then, from 12 (P. sylvestris site) to 24 (P. halepensis site) additional dominant trees were sampled; they were located at 0, 5 and 10 m from the gap edge in the four cardinal directions (N, E, S and W). A total of 23 and 34 trees were sampled in the P. sylvestris and P. halepensis sites, respectively (Table 1). The diameter at 1.3 m of all sampled trees was measured using tapes. The different numbers of sampled trees were proportional to the size of affected forest area.

2.3. Climate Data

Since no long-term, homogeneous climate records were available near the study sites, monthly mean air temperature and total precipitation data for the two study sites were obtained from the 1-km2 gridded E-OBS v. 22.0e database [23]. Data were downloaded for the period 1950–2020, though we focused on the pre-windthrow, best-replicated period of 1965–2016. According to these precipitation data, in the P. sylvestris site the driest years were (annual precipitation z-scores): 2001 (−2.30), 1983 (−1.82), 2017 (−1.55) and 1994 (−1.51); the wettest years were: 1969 (2.58), 1971 (2.27), 2018 (2.03) and 1979 (1.59). In the P. halepensis site, the driest years were: 1995 (−1.66), 1983 (−1.58), 1993 (−1.46) and 2017 (−1.40); the wettest years were: 2018 (2.75), 1989 (1.88), 2020 (1.86) and 1971 (1.83).

2.4. NDVI Data

Using the Google Earth Engine (GEE), the NDVI was calculated as NDVI = (NIR − RED) / (NIR + RED), where RED and NIR stand for the spectral reflectance measurements acquired in the red and near-infrared regions, respectively, for the period 1984–2020. Annual NDVI data and also growing-season NDVI, considering the period from April to October, were obtained. GEE is a geospatial, cloud-based platform for large-scale, multi-temporal environmental monitoring and analysis which provides access satellite imagery and machine learning algorithms using Google computational infrastructure [24] through the arrangement of Landsat and MODIS (Moderate-Resolution Imaging Spectroradiometer) satellite images [25]. We performed topographic corrections and eliminated cloudy images to obtain the final NDVI values.
To check that NDVI values reflected the windthrow damage, two severely disturbed patches were selected and compared with two nearby, undisturbed patches in the P. halepensis site where they could be easily delineated in recent aerial photographs (Figure S2b). Mean NDVI values for the disturbed and undisturbed patches were obtained and compared while considering 50-m circular buffers centered in the selected patches.
Lastly, the trends of annual NDVI data were removed by fitting linear trends and keeping the residuals after subtraction from the observed NDVI values. These detrended NDVI data were related to detrended and normalized ring width data (ring width indices) using Pearson correlations.

2.5. Growth Data

To assess changes in radial growth, dendrochronological methods were used [26]. Two to three cores per tree were taken at 1.3 m and perpendicular to the maximum slope using Pressler increment borers (Haglöf, Borlänge, Sweden). Two cores per tree were selected and one of the cores reached the pith in all trees. Wood samples were air-dried, glued onto wooden supports and polished using a series of sand-paper grids until tree rings were clearly visible. Cores were visually cross-dated and measured to the nearest 0.001 mm using scanned images (resolution 2400 dpi) taken with a Epson Expression 10000XL scanner (Epson, Suwa, Japan) and using the CDendro software (CDendro & CooRecorder, Saltsjöbaden, Sweden) [27]. The visual cross-dating was checked by using the software COFECHA [28]. Tree-ring width data were transformed into basal area increment (BAI) assuming a circular shape of stems using the formula BAIt = π (Rt2Rt−12), where R is the stem radii in years t and t−1. We also estimated age at 1.3 m by counting the number of rings from the bark to the pith.
To evaluate climate-growth relationships, first tree-ring-width data were detrended and standardized by using the software ARSTAN v.44 [29]. This procedure allows for removing growth trends due to changes in tree size and stand dynamics. Detrending was done by fitting a 67% cubic smoothing spline with a 50% cutoff frequency. Second, the resulting series were pre-whitened with low-order autoregressive models to remove growth persistence. Individual ring-width indices were combined into site mean series of residual indices or tree-ring width chronologies (Figure S3) by using a bi-weight robust mean [26].
Several statistics were calculated to characterize the site with raw (mean ring width, first-order autocorrelation) and detrended (mean sensitivity, correlation with site series) chronologies [30]. The first-order autocorrelation measures the year-to-year persistence in growth, whereas mean sensitivity measures the relative changes in ring-width indices between consecutive rings. These statistics were calculated over the common, best-replicated, pre-windthrow period (1965–2016). This time span was considered to be well replicated since chronologies showed Expressed Population Signal values over 0.85 [31].
The two chronologies (Figure S3) were correlated with their corresponding gridded, monthly climate data (mean temperature, total precipitation) from the prior October to the current September over the best-replicated period (1965–2016).

2.6. Soil Analyses

Three soil subsamples were collected under the canopy of each tree (up to 1–2 m from the tree main stem) using a 25-cm deep soil borer. Samples were taken at 120° with respect to each other and mixed into a single sample, which was taken to the laboratory inside an opaque plastic bag. Once in the laboratory, each sample was divided in two parts: one was frozen for analyzing microbiota components, and the other was air dried and sieved with a 2-mm mesh size for performing physico-chemical analyses including concentrations of C, N, P and micro-nutrients (Ca, K and Mg), percent organic matter, pH and the C/N ratio. Soil C and N were determined with an elemental analyzer (Element Analyzer VarioMAX N CM, Hanau, Germany), whereas P and micro-nutrients (Ca, K and Mg) concentrations were analyzed by ICP-OES (Inductively Coupled Plasma Optical Emission Spectrometry, iCAP 6300 DUO, Thermo Electron Corporation, Hemel Hempstead, UK) after acid-digestion with hot HNO3. Soil texture was analyzed using a Malvern particle size analyzer (Mastersizer 3000, Hydro LV, Malvern, Worcestershire, UK). Soils were classified following the USDA criteria and prior to sieving.
The frozen soil samples were used for phospholipid fatty acid (PLFAs) analyses to characterize soil microbial community structure while considering the biomass of major groups. The samples were lyophilized and sieved (2 mm) aliquots of 2 g used for lipid extraction. Lipids were extracted with a one-phase chloroform-methanol-phosphate buffer solvent. Phospholipids were separated and methylated before analysis following the methodology of [32]. The resulting fatty acids methyl esters (FAMEs) were separated by gas chromatography using an Agilent 7890A GC System (Agilent Technologies, Wilmington, NC, USA) equipped with a 25-m Ultra 2 (5%-phenyl)-methylpolysiloxane column (J & W Scientific, Folsom, CA, USA) and with a flame ionization detector (FID). FAMEs identification and quantification were carried out using the PLFAD1 method of Sherlock® software version 6.3 from MIDI, Inc (Newark, NJ, USA). The internal standard 19:0 phosphatidylcholine (Avanti Polar Lipids, Alabaster, AL, USA) was used for quantification of FAMEs. Specific PLFAs were used as biomarkers to quantify biomasses of eukaryotes, Gram positive and Gram negative bacteria, actinobacteria, fungi and arbuscular mycorrhizal (AM) fungi [33,34,35].
The ratio between the sums of cyclopropyl fatty acids and that of their monoenoic precursors was calculated as a proxy of physiological or nutritional limitations in bacterial communities [36]. This variable was termed “stress” in the corresponding soil analyses. Note that the higher the values of this ratio, the lower the “stress”.

2.7. Statistical Analyses

Paired comparisons of the growth rate (BAI) between trees situated at difference distances from the windthrow gap were carried out using Mann–Whitney U tests. A Principal Component Analysis (PCA) [37] was performed to represent and analyze the differences in soil microbial community composition (PLFA) between dense, closed-canopy patches and gaps in the two studied forests. A preliminary analysis using the two sites together showed the existence of large differences between the two sites (Figure S1). Thus, we decided to run separate analyses in each forest to compare soil microbial community composition between gaps and forested areas. To test for the differences between forest and gap in each site, Permutational Multivariate Analysis of Variance (PERMANOVA) [38] was used. The PCA and PERMANOVAs were performed applying the “rda” and “adonis” functions from the vegan package [39] in the R software v. 3.5.2 [40].
Pairwise Spearman rank correlations [41] were used to evaluate the covariation between soil texture, nutrient concentration and microbial community composition. Separate analyses were performed for the P. sylvestris and P. halepensis sites. The correlations between the first and second axes or principal components of the PCA (PC1 and PC2, respectively) in each site were assessed, and the main groups of soil microbes (see soil analyses section), soil texture (percentage of lime, sand and silt) and soil nutrient content were obtained.
The Kruskal–Wallis test [41] was used to test for the differences in soil texture (percentage of clay, silt and sand), soil nutrient content and soil microbial composition (PLFA) between unaltered forests and nearby gaps. As explained above, separate analyses were performed to in the P. sylvestris and the P. halepensis forests due to strong site differences. When significant differences were found, the Dunn [42] test of multiple comparisons was calculated following a significant Kruskal–Wallis test. The function “dunnTest” from the package “FSA” [43] was used to perform the Dunn’s test.

3. Results

3.1. NDVI Patterns

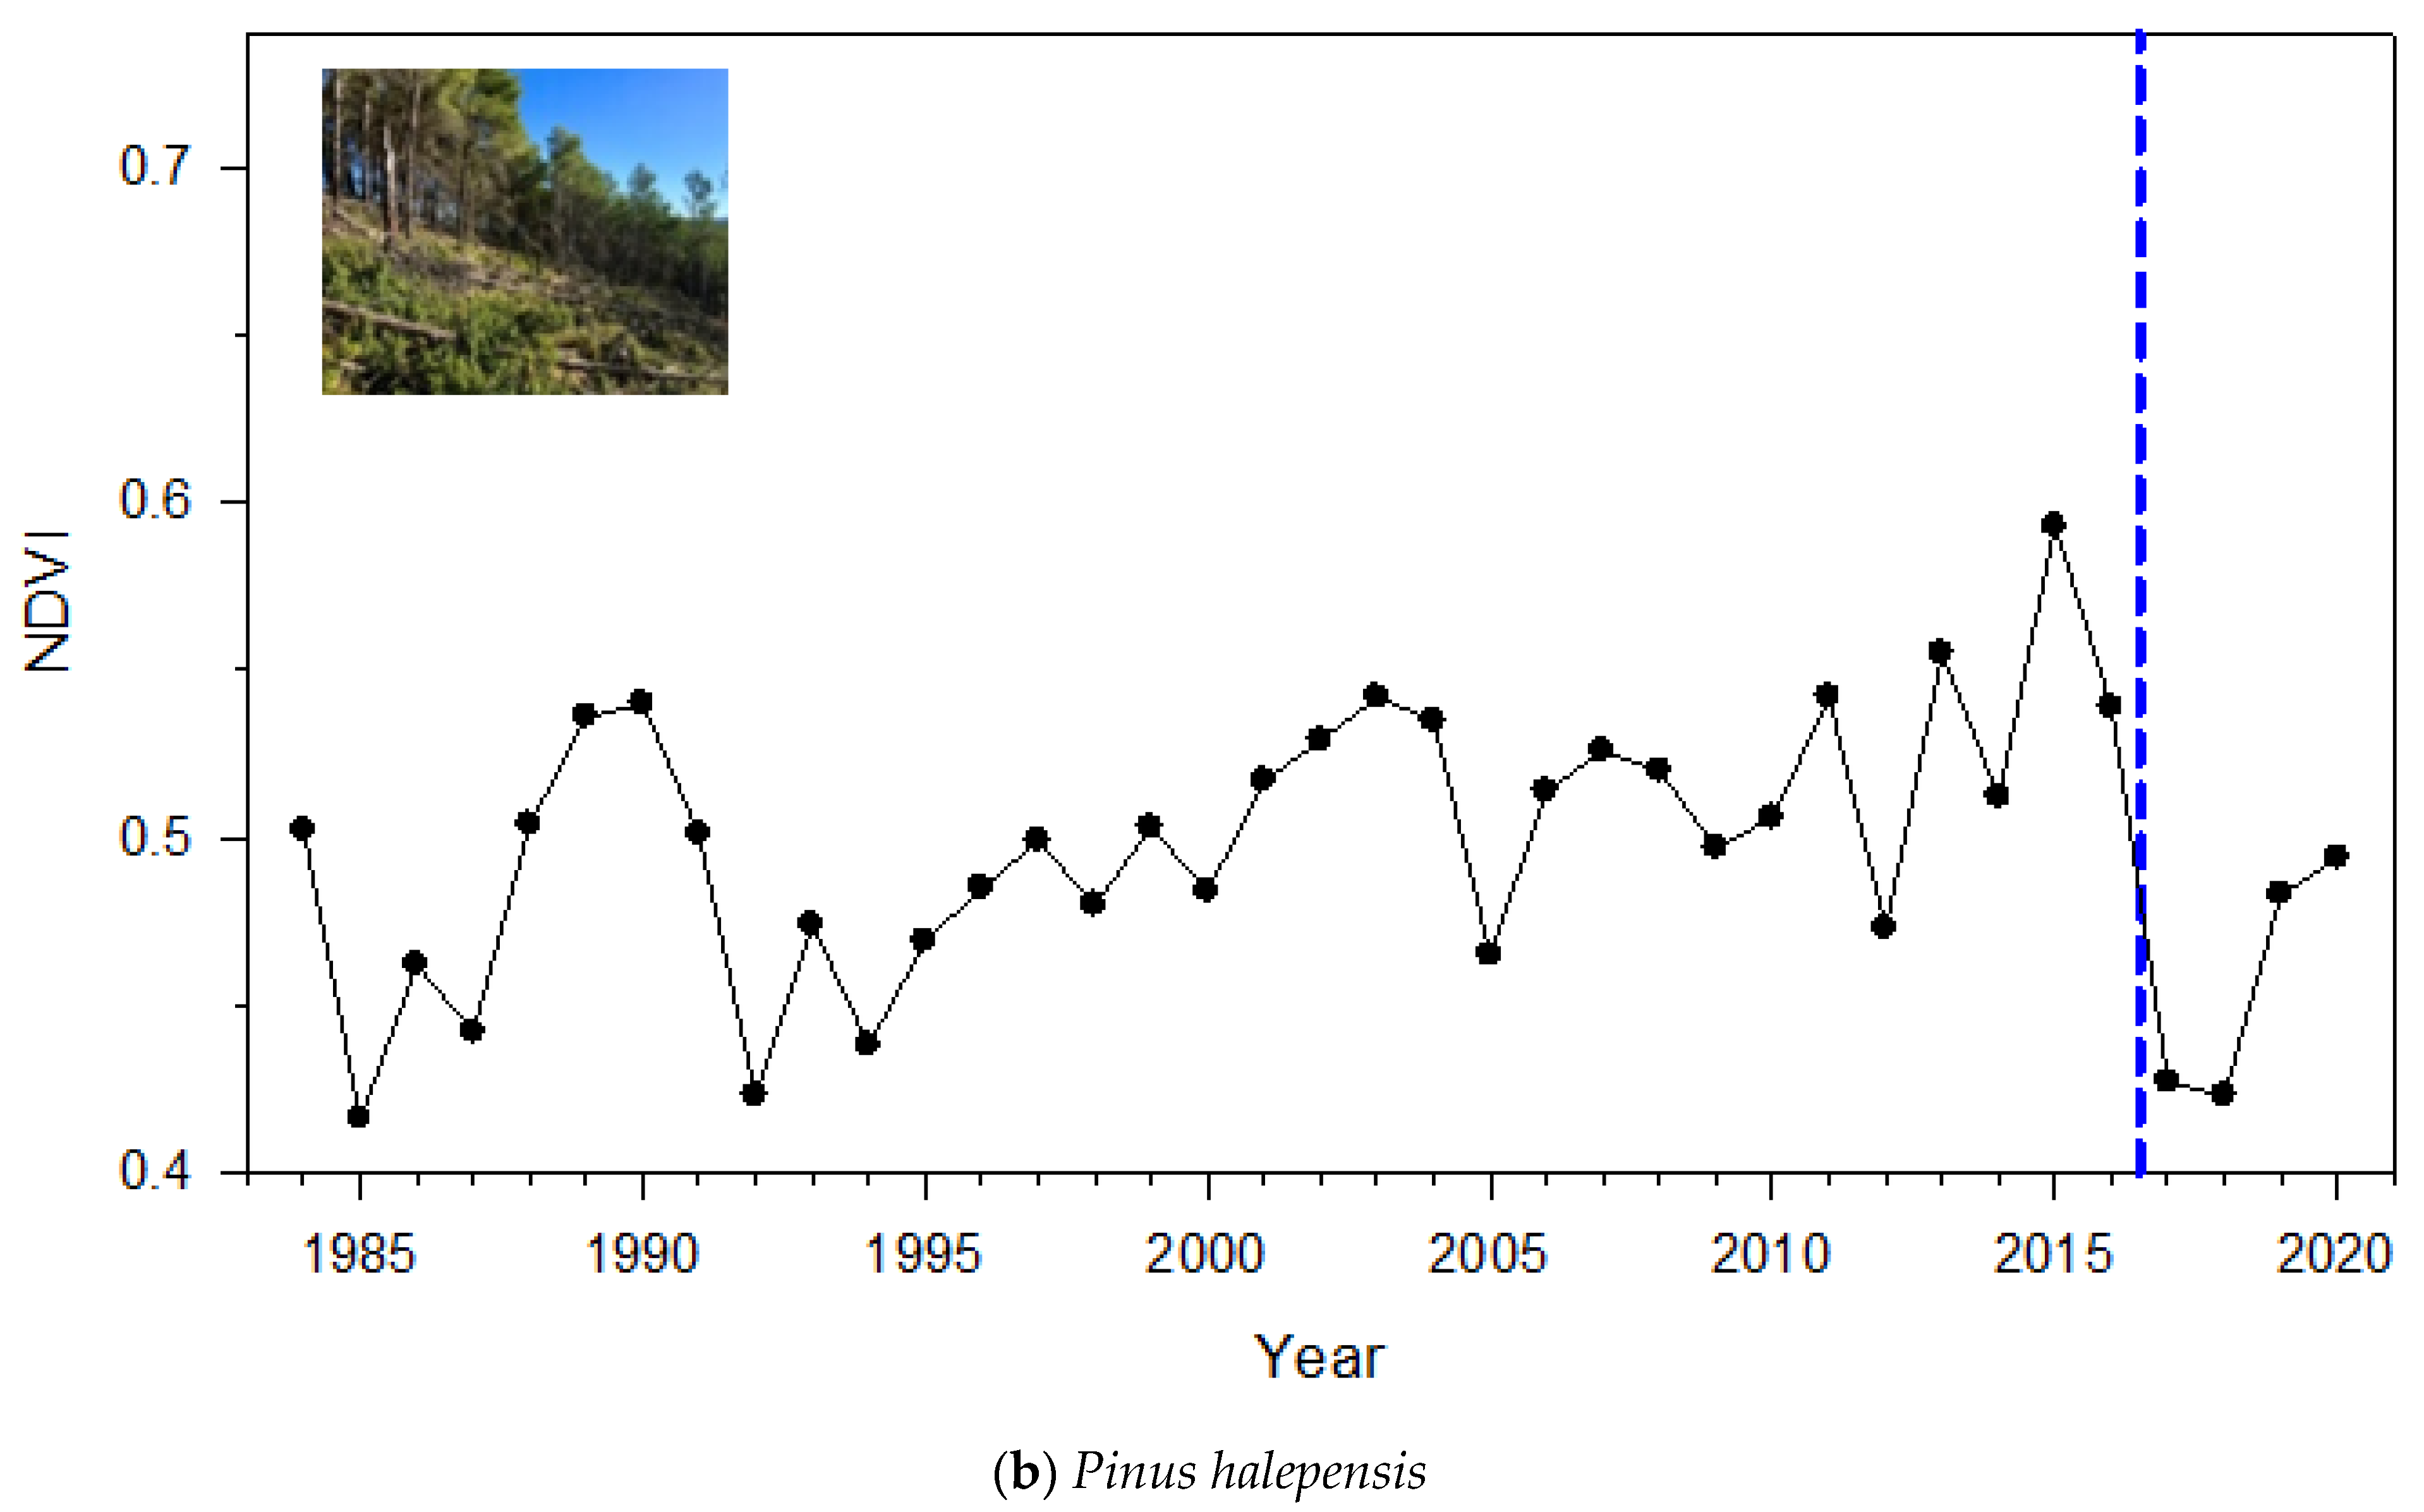
In the P. sylvestris stand, the annual NDVI slightly decreased passing from 0.68 in 2019 to 0.66 in 2020 after the windthrow (Figure 1a). However, in the P. halepensis stand NDVI sharply decreased from 0.56 in 2016 to 0.43 in 2017 (Figure 1b). In this site, the mean NDVI value during the period 2017–2020 (mean ± SE = 0.46 ± 0.02) was significantly (Mann–Whitney U = 1, p = 0.03) lower than the three-year NDVI value (2013–2016) prior to the windthrow (0.57 ± 0.01). Similar results were obtained for the growing-season NDVI from April to October, since it was positively related to the annual NDVI (P. sylvestris, r = 0.97; P. halepensis, r = 0.94; p < 0.001 in both cases).
The comparisons between disturbed and undisturbed patches in the P. halepensis site (Figure S2b) confirmed the post-windthrow NDVI drop in 2017 in the affected stands (0.42 ± 0.01) as compared with least affected stands (0.55 ± 0.01), i.e., a 24% reduction.

3.2. Tree Growth: Responses to the Windthrow and Climate-Growth Relationships

The P. sylvestris chronology was not a reliable proxy of changes in forest cover, since it was not associated was detrended annual NDVI data for the period previous to the windthrow (r = 0.19, p = 0.277, period 1984–2019). Conversely, the P. halepensis chronology was tightly associated to detrended annual NDVI (r = 0.55, p = 0.001, period 1984–2016), proving that it was a reliable proxy of forest cover.
In the P. sylvestris site, trees sampled within the gap showed a growth increase of +114% passing from a mean BAI (mean ± SE) of 4.13 ± 0.98 cm2 in 2019 to 8.85 ± 1.28 cm2 in 2020 (Figure 2a). A lower but still high relative increase in growth (+53%) was observed in trees sampled in the gap edge, whilst those located 5 to 10 m apart, i.e., inside the undisturbed areas of the stand, showed lower increments of +35% and +9%, respectively. In this site, trees sampled in the gap grew significantly (Mann–Whitney U = 12, p < 0.02) more (8.03 ± 0.92 cm2) than trees sampled in the other locations (4.73 ± 0.61 cm2) during the period 2006–2015.
In the P. halepensis stand, growth of gap trees passed from 6.78 ± 0.87 cm2 in 2017 to 10.48 ± 1.82 cm2 in 2018 and 25.17 ± 3.23 cm2 in 2019 corresponding to +55% and +140% increments, respectively (Figure 2b). In trees located near the gap edge, the growth rise from 2018 to 2019 was even higher (+191%), passing from 5.26 ± 1.39 cm2 to 15.31 ± 2.84 cm2. Unexpectedly, trees sampled at 5 and 10 m apart from the gap, inside the areas not cleared by the windthrow, showed the highest growth increments from 2018 to 2019 in relative terms, +279% (from 2.02 to 7.66 cm2) and +310% (from 0.77 to 3.15 cm2), respectively. There was a decrease in growth in 2018 after the severe 2017 drought, which was not observed in trees situated within the gap, whose growth rates increased.
Regarding spatial patterns, all trees (gap, trees located at 0 and 5 m from the gap edge) showed relative growth decreases (on average −12%) from 2019 to 2020, excepting trees located 10 m away from the gap, which presented a minor growth increase (+2%). From 2015 to 2020, these 10-m trees showed a significantly (p < 0.05) lower growth rate (2.06 cm2) than those located within the gap (11.83 cm2) or near it. From 2017 to 2020, trees located at the gap or in its edge grew more (13.04 cm2) than those located at 5 m (4.93 cm2). From 2018 to 2020, tree growth was higher in the gap (19.16 cm2) than elsewhere, including the gap edge (11.40 cm2). The ratio between the mean BAI values of gap and non-gap (10-m) trees for the period 2018−2020 was 8.1, corresponding to a relative growth increase of +706%.
High precipitation from March to June was significantly correlated with growth rates (ring-width indices) in both species, confirming that they were both sensitive to water shortages during the growing season (Figure 3). This spring to early summer precipitation explained from 24% (P. halepensis) to 38% (P. sylvestris) of variation in growth rates. In addition, high January and August precipitation improved growth of P. sylvestris and P. halepensis, respectively. Ring-width indices were also negatively related to spring and summer temperatures in both species, but correlations were not significant.

3.3. Soils: Texture, Nutrients and Microbiota

According to their texture soils were of the loam and sandy-loam to clay-loam in the P. sylvestris and P. halepensis sites, respectively (Figure S4). In the P. halepensis site, the percent of clay was higher in the gap soils (30%) than in the soils of nearby, closed-canopy stands (21%), which could be defined as clay-loam and loam, respectively (Table 2, Figure S5).
The Kruskal–Wallis test confirmed the existence of larger differences between closed-canopy stands and gaps in the P. halepensis than in the P. sylvestris site (Table 2). In the P. halepensis site, the analyses revealed higher K and Mg concentrations in gaps than in closed-canopy patches (Figure S5). The relative abundance of different groups of bacteria also differed, with Gram negative bacteria being more abundant in closed patches (Table 2). Only Mg soil concentrations presented significant differences between closed-canopy sites and gaps in the P. sylvestris site, with higher values in open sites. These results confirm the expectations that gaps are a more stressful environment and that certain time after windthrow occurrence is required to observe differences.
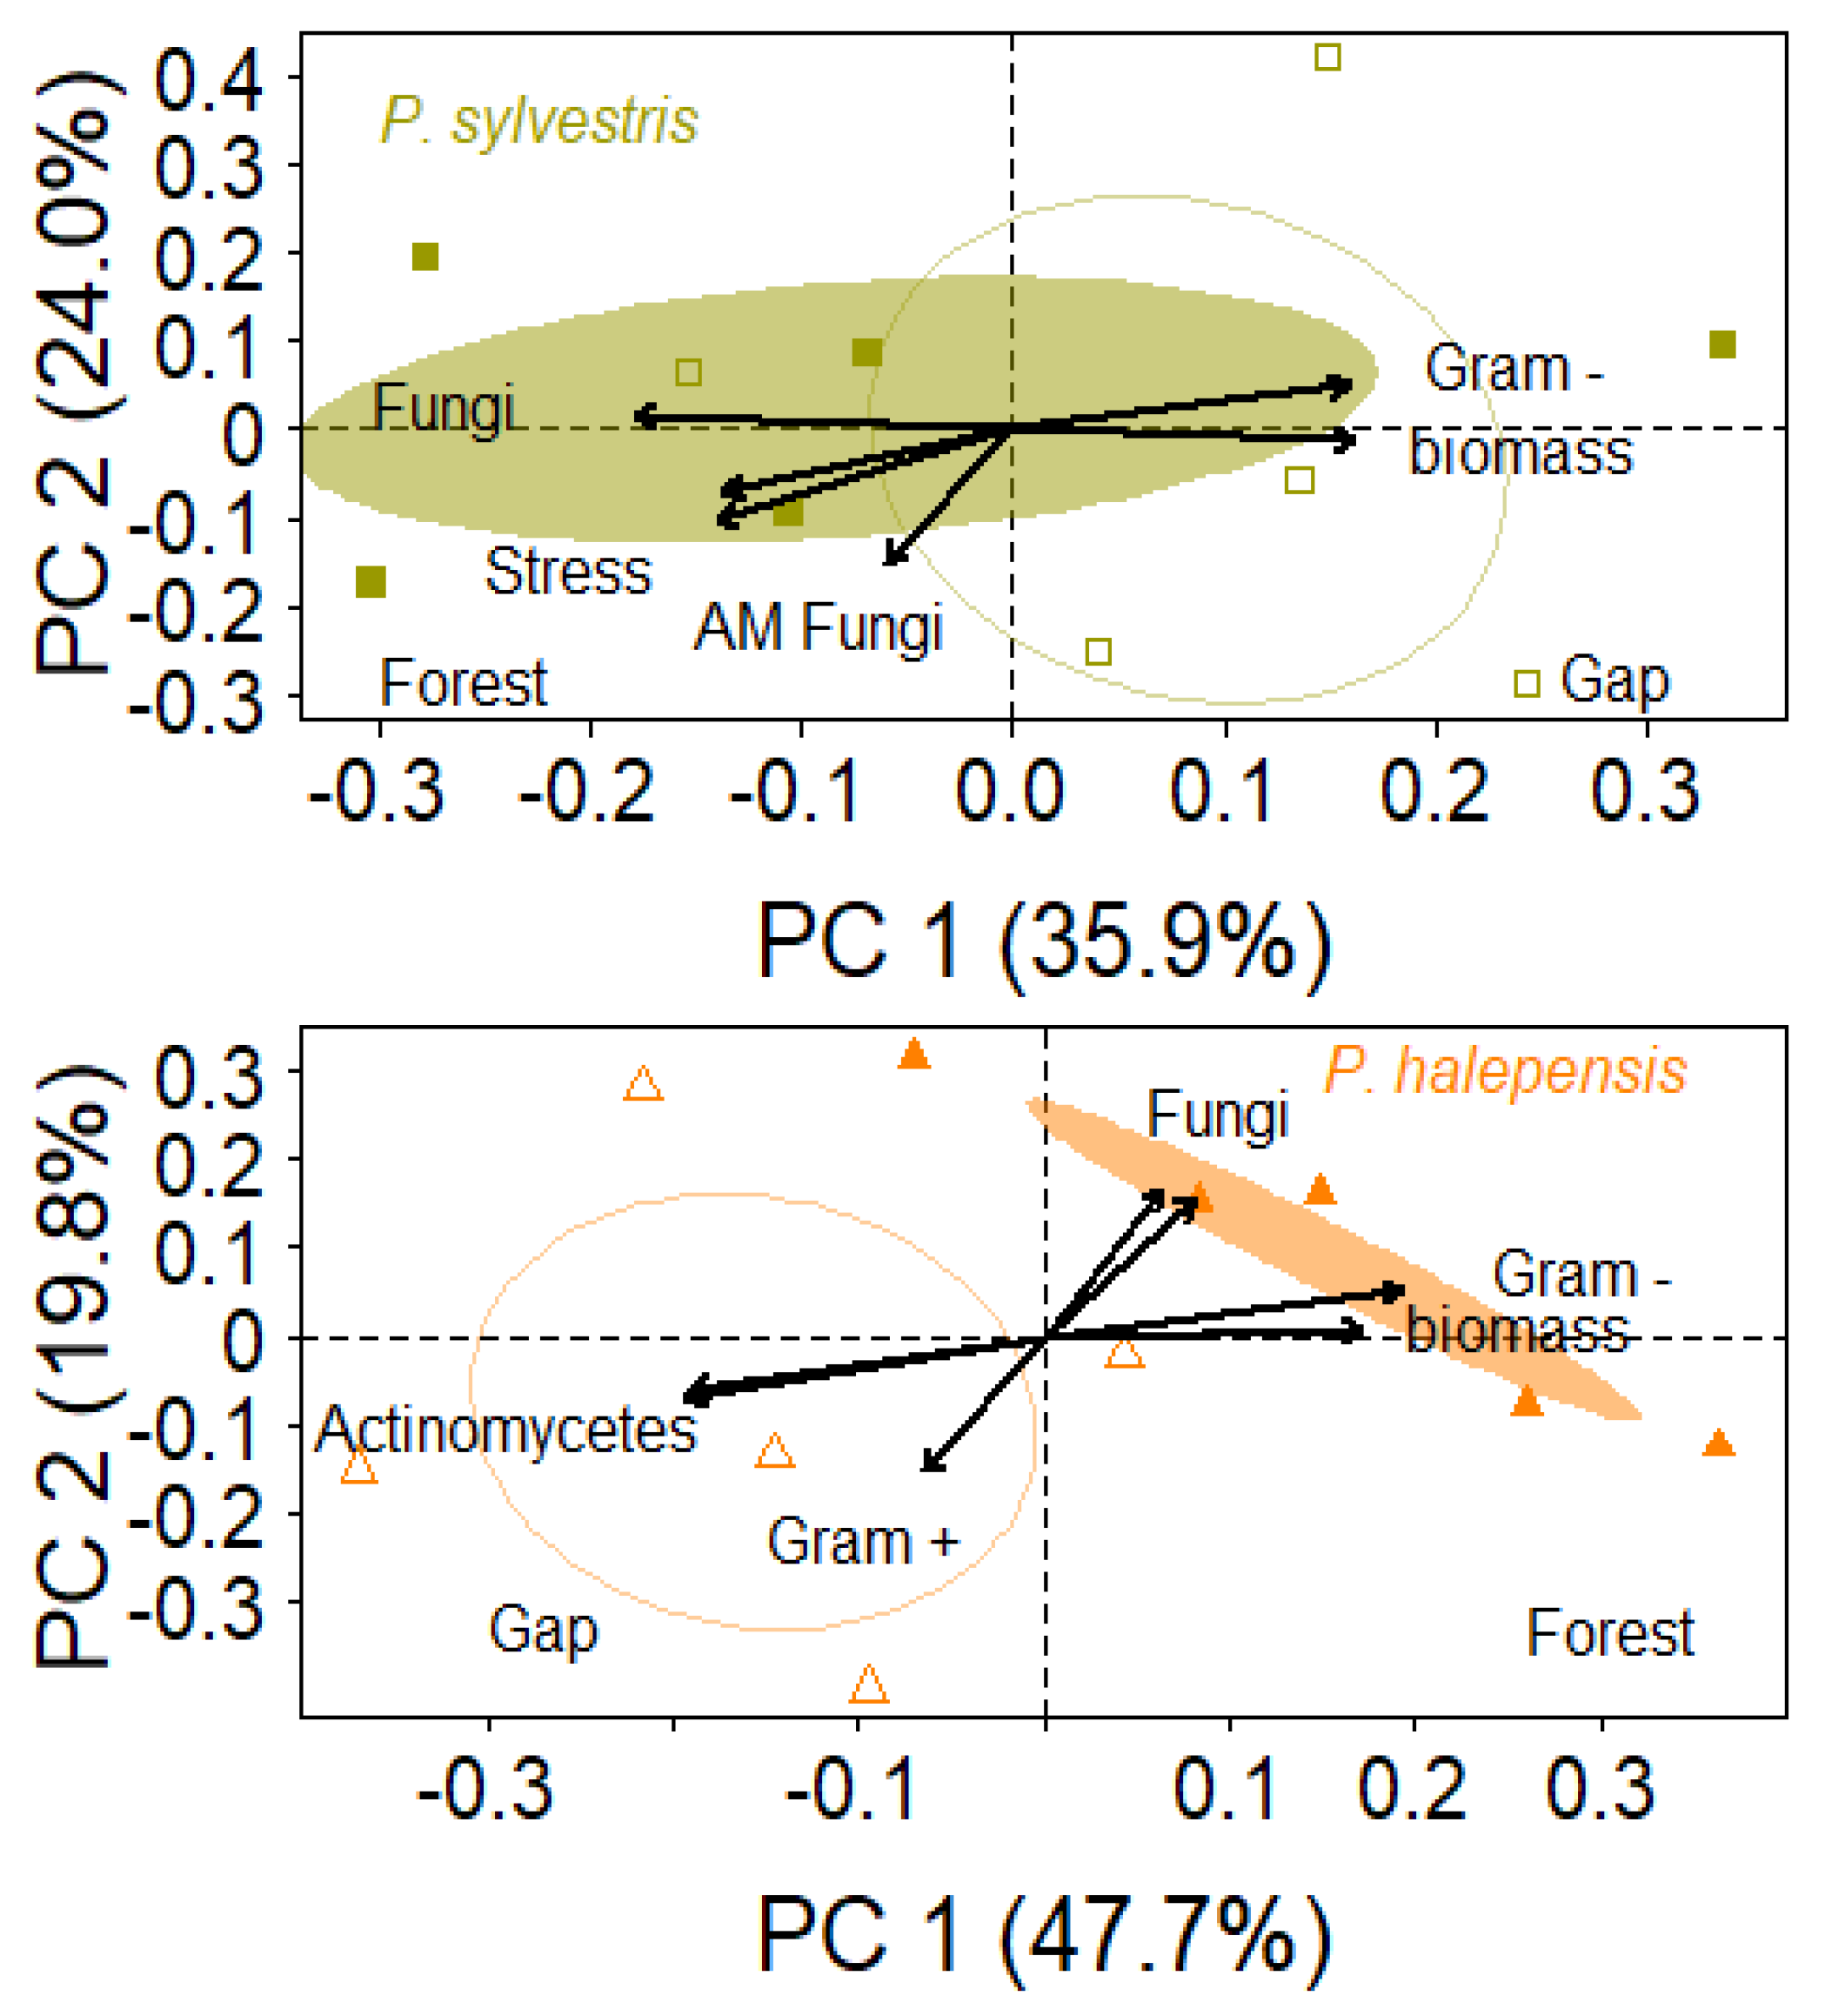
The PCA separated gaps from closed-canopy stands in the P. halepensis site more clearly than in the P. sylvestris site (Figure 4 and Figure S6). The PC1 explained a larger proportion of the variation in the data in the P. halepensis site (47.7%) than in the P. sylvestris (35.9%) site, whereas the PC2 accounted for 19.8% and 24.0% of total variation in the P. halepensis and P. sylvestris sites, respectively (Figure 4). The PERMANOVAs confirmed this pattern, since they revealed significant differences in soil microbial community composition between gaps and closed-canopy P. halepensis stands (R2 = 0.31; F = 3.67; p = 0.023). Conversely, no significant differences were found in the P. sylvestris site (R2 = 0.13; F = 1.18; p = 0.354).
Soil features presented more significant correlations in the P. halepensis site than in the P. sylvestris site (Table 3). In the P. halepensis site, closed-canopy areas had sandier and more fertile (higher K and Mg concentrations) soils than gaps (Table 2 and Table 3). In the P. sylvestris site, N concentration was positively related to PC1 scores and covaried with soil biomass (Table 3).
In the P. sylvestris site, the PCA diagram showed that fungi and total biomass had opposite signs, as well as bacteria (Figure 4). The fungi biomass, the ratios fungi: bacteria and Gram positive: Gram negative bacteria and the soil “stress” were negatively related to PC1 scores in this site, whereas microbial biomass and Gram negative bacteria showed positive correlations (Table 3). According to the PCA, gap sites would show higher “stress” than closed-canopy sites.
In the P. halepensis site, total microbial biomass along with the relative abundance of fungi and Gram negative bacteria were higher in closed-canopy stands while the relative abundances of Gram positive bacteria and actinomycetes were higher in gaps (Figure 4; Table 2 and Table 3). That is, the results confirmed the main hypothesis that fungi dominate in closed-canopy patches, whereas bacteria are more abundant in the gaps, as was also indicated by the correlation between the fungi: bacteria ratio and the PC2 scores in the P. halepensis sites (Table 3).

4. Discussion

As hypothesized, post-windthrow responses were characterized by a decrease in NDVI, an increase in tree growth and changes in soil conditions towards a more nutrient poor with less fungi-dominated communities. These effects were more evident in the P. halepensis site, which was probably more severely impacted by the windthrow occurring four years ago, than in the P. sylvestris site, which was less and more recently (one year ago) impacted. These impacts were found in gaps where a few trees survived after the disturbance, whilst closed-canopy stands located at 0–10 m from the gap edge were less disturbed.
In the P. halepensis site, soil gaps were less fertile (lower K and Mg concentrations) than soils from closed-canopy stands which had less clay (Figure 4, Figures S4 and S5). There are studies showing a tight association between soil clay content and the total amount of microbial biomass, which could explain the patterns observed in gaps [44,45]. These gap soils contained more bacteria biomass, probably in response to higher radiation and soil evaporation, whereas fungi were more abundant in soils from closed-canopy patches under wetter and darker conditions and with more litter on the soil. These findings are in line with other studies on forest soils [21,22]. The reduction of the canopy coverage and tree presence disrupts tree-soil feedbacks, thus impacting the relative abundance of symbiotic fungi [13]. At the same time, we found a large presence of dead wood in the soil that can be available for decomposers. In drought-prone environments, bare soils can be more stressful environments than soils under the canopy, thus reducing biomass [17]. We did not observe significant differences in soil C/N between gaps and closed-canopy stands. A lower C:N ratio (<15) would enhance nitrogen release into the soil through mineralization and use by plants, whereas a high C/N ratio would lead to microbial immobilization, which could explain the bacteria abundance in gaps [44].

4.1. Magnitude and Duration of Post-Windthrow NDVI Reduction and Growth Enhancement

The disturbance severity and extent and the time since the disturbance probably explain the different results observed in the two pine plantations. In the P. sylvestris site, the NDVI drop was minor and we observed a growth improvement in gap trees (Figure 1), probably associated with a decrease in competition for light and soil water [46]. In a xeric P. sylvestris forest, the growth release in heavily thinned trees was caused by enhanced water availability, due to a reduction in stomatal conductance rates, rather than by an increase in light availability [47,48]. Therefore, we could assume that the post-thinning growth increases in the “drought-avoiding” isohydric P. sylvestris was caused by a reduction in competition for soil water.
In the P. halepensis site, the decrease in NDVI of disturbed stands lasted two years (Figure 1), but the increase in growth lasted at least four years (Figure 2b). These responses are related to a reduction in tree cover, stand density and competition [49], but it is unclear how they relate to the change in forest structure caused by the windthrow. For instance, in the gaps of the P. halepensis site few and scattered trees survived, forming isolated groups where competition intensity must be negligible (Figure S1b). In this site, the decrease in growth observed in 2018 after the severe 2017 drought (see also the severe growth reduction that year in P. sylvestris; Figure 2a) was not observed in trees situated within the gap (Figure 2b), confirming that the post-disturbance reduction in basal area alleviated competition for soil moisture.
In the P. sylvestris site, the higher growth rates of gap trees observed during the period 2006–2015 (Figure 2a), corresponded to a release related to previous management thinning (pers. observ.). This thinning probably opened the stand and could have contributed to making trees more vulnerable to wind damage during the 2020 storm. Management influences the forest’s resilience to wind disturbances. For instance, after heavy thinning, stands may turn more vulnerable to wind damage [50], but this effect disappeared a few years later.
Interestingly, both growth and NDVI were linked in the P. halepensis site, indicating a coupling between wood production and NDVI, as has been observed in other seasonally dry Spanish forests [51]. Moreover, the growth of both study species depended on sufficient precipitation during the growing season (Figure 3), particularly in the case of P. sylvestris which was planted near the xeric species distribution limit [52]. Therefore, the post-disturbance growth release was the result of alleviating competition for soil water, and it was more coupled to a decrease in tree cover and NDVI in the P. halepensis site, where the disturbance was most intense.
Assuming that the windthrow led to a thinning intensity of 92%, in terms of reduction of the basal area, this corresponded to post-disturbance relative growth enhancements of 74% and 641% in the P. sylvestris (in 2020) and P. halepensis sites (period 2017–2020), respectively. In several Mediterranean pine plantations, a thinning of similar intensity triggered relative growth enhancements from 251% to 310%, and it was predicted a mean improvement of circa 240% for a 90% thinning intensity [53]. Therefore, the growth increase after the windthrow was extremely high in the P. halepensis site, albeit very low in the P. sylvestris site as compared with that prediction, despite disturbances and planned thinning generating very different forest structures. These differences could be due to a greater impact of the windthrow on the P. halepensis site, or to a short post-disturbance study period in the P. sylvestris site. The second explanation seems to be less plausible, since the intensity of tree removal (thinning) was similar in both sites.

4.2. Impacts of Windthrow on Soil Characteristics of Mediterranean Pine Plantations

In the most impacted P. halepensis site, the windthrow created gaps whose soils had more clay and were less fertile (less K and Mg) than in nearby closed-canopy stands (Table 2 and Table 3, Figure 4). These physic-chemical differences probably caused a shift in soil microbial community structure characterized by more biomass of actinomycetes and Gram positive bacteria in gaps and more biomass of Gram negative bacteria and fungi in closed-canopy stands. It is uncertain whether the change in soil texture could be attributed to a windthrow which occurred in 2017. More buffered and less variable microclimate conditions in the closed-canopy stands could favor fungi, while drought and heat stress in open gaps could constrain fungal development [21,22,54]. A reduction in tree density leads to less competition for water but may also increase radiation, soil temperature and soil evaporation [55,56]. Those changes may explain the dominance of bacteria over fungi in these open areas. Such a shift in soil microbiota can have profound and lasting impacts through a less efficient decomposition of organic matter decomposition by bacteria and lower soil fertility and biodiversity [57].

4.3. Implications for Management of Disturbed Pine Plantations

As stated before, pine plantations may be more vulnerable to damage by wind disturbances than natural forests which present higher structural diversity and more stable trees with lower height/diameter ratios of dominant trees [7]. Such vulnerability was demonstrated and the post-windthrow changes in two pine plantations was evidenced, but our findings should be compared with forests of the same species under similar climate, drought-prone conditions. In general, wind damage reduced tree cover and greenness (NDVI), and improved growth of the surviving trees but this could make them more vulnerable to further damage if wind storm frequency or intensity increase. Therefore, managers should augment the structural diversity of plantations to make them less vulnerable to windthrow. Thinning should be not spatially clustered, since this can excessively open stands and make them more vulnerable, as we inferred for the P. sylvestris site. Gap soils were less fertile and dominated by bacteria in the P. halepensis site, where further planting of trees in open patches or even fertilization of soils are advised if the aim is to restore the plantation. The opening of the plantations due to windthrow damage may promote a shift in physical and chemical soil characteristics and changes of the soil microbiota community structure with feedbacks on pine recruitment due to a decline in fungi. Indeed, no pine regeneration was observed in the gaps. However, at the landscape scale, a mixed mosaic of cleared and dense patches may also increase biodiversity [58]. Finally, windthrows affect stand structure and tree growth, which drive the carbon stock potential of pine plantations [59]. Therefore, the compound effects of several disturbances (wind storms, droughts) on the carbon stock potential of seasonally dry forests should be properly quantified.

5. Conclusions

In this study the impacts of windthrows on two pine plantations in a seasonally dry Mediterranean region were analyzed. A decrease in NDVI and an increase in tree radial growth were found and they were related to the release of competition for light and soil water. Windthrow impacts on gap trees as compared with trees located in closed stands were more noticeable in the P. halepensis than in the P. sylvestris site with relative growth increments of +140% and +114%, respectively. Higher wind damage was inferred in the P. halepensis site, where gap soils showed lower K and Mg concentrations, contained more clay and presented higher biomass of Gram positive bacteria and actinomycetes, but less biomass of Gram negative bacteria and fungi. However, it must be noted that the time since gap creation differed between the two plantations and the fact that more marked soil differences were found in the P. halepensis site suggest that at least two years after a windthrow are required to detect changes in soil conditions. Plantations offer suitable settings to assess the impacts of disturbances, but these assessments could be compared with natural, more structurally diverse forests dominated by the same tree species.

Supplementary Materials

The following are available online at https://www.mdpi.com/article/10.3390/f12070817/s1, Figure S1: Satellite and aerial images showing the climatic conditions over then Iberian Peninsula and the resulting damaged area of the study (a) Pinus sylvestris and (b) Pinus halepensis plantations, Figure S2: Sampling strategy illustrated for the affected P. halepensis stands, Figure S3: Residual, pre-whitened mean series of ring-width indices (chronologies) of P. halepensis and P. sylvestris used to calculate climate-growth relationships for the common period 1965–2016, Figure S4: Ternary diagram showing the difference in soil texture between sampled soils, Figure S5: Differences in soil texture (clay percentage), soil nutrient concentration (K), and soil microbial community composition between gaps and closed-canopy patches in the P. halepensis site, Figure S6: Ordination diagram based on soil samples and including the two studied sites indicating gap and forest patches of the P. sylvestris (dark green symbols and areas) and P. halepensis (orange symbols and areas) stands.

Author Contributions

Conceptualization, J.J.C., A.G. and M.C.; methodology, J.J.C., M.C., A.G., M.P., C.V., and J.M.I.; software, A.G., J.J.C. and J.M.I.; validation, M.C., C.V., A.G., M.P., J.J.C. and J.M.I.; formal analysis, A.G. and J.J.C.; data curation, A.G., C.V., M.P., M.C. and J.J.C.; writing—original draft preparation, J.J.C., A.G. and all co-authors; writing—review and editing, all authors; funding acquisition, J.J.C. and J.M.I. All authors have read and agreed to the published version of the manuscript.

Funding

This research was funded by Ministerio de Ciencia y Tecnología, grant number RTI2018-096884-B-C31, and Junta de Castilla y León, grant number CLU-2019-05 (co-financed by the European Union ERDF “Europe drives our growth”).

Institutional Review Board Statement

Not applicable.

Informed Consent Statement

Not applicable.

Data Availability Statement

The data presented in this study are available on request from the corresponding author.

Acknowledgments

The authors thank Virginia Gascón (IRNASA-CSIC) for her valuable assistance with laboratory analyses. We acknowledge the E-OBS dataset, and the data providers in the ECA&D project.

Conflicts of Interest

The authors declare no conflict of interest. The funders had no role in the design of the study; in the collection, analyses, or interpretation of data; in the writing of the manuscript, or in the decision to publish the results.

References

  1. Schelhaas, M.-J.; Nabuurs, G.-J.; Schuck, A. Natural disturbances in the European forests in the 19th and 20th centuries. Glob. Chang. Biol. 2013, 9, 1620–1633. [Google Scholar] [CrossRef]
  2. Doll, D.; Riou-Nivert, P. Les chablis en Europe: Courons-nous au désastre? Forêt-Entrep. 1991, 77, 1–16. [Google Scholar]
  3. Senf, C.; Seidl, R. Mapping the forest disturbance regimes of Europe. Nat. Sustain. 2021, 4, 63–70. [Google Scholar] [CrossRef]
  4. Seidl, R.; Schelhaas, M.-J.; Lexer, M.J. Unraveling the drivers of intensifying forest disturbance regimes in Europe. Glob. Chang. Biol. 2011, 17, 2842–2852. [Google Scholar] [CrossRef]
  5. Seidl, R.; Thom, D.; Kautz, M.; Martin-Benito, D.; Peltoniemi, M.; Vacchiano, G.; Wild, J.; Ascoli, D.; Petr, M.; Honkaniemi, J.; et al. Forest disturbances under climate change. Nat. Clim. Chang. 2017, 7, 395–402. [Google Scholar] [CrossRef] [PubMed] [Green Version]
  6. Seidl, R.; Schelhaas, M.J.; Rammer, W.; Verkerk, P.J. Increasing forest disturbances in Europe and their impact on carbon storage. Nat. Clim. Chang. 2014, 4, 806–810. [Google Scholar] [CrossRef] [PubMed] [Green Version]
  7. Wilson, J.S.; Oliver, C.D. Stability and density management in Douglas-fir plantations. Can. J. For. Res. 2000, 30, 910–920. [Google Scholar] [CrossRef]
  8. Mead, D.J. Sustainable Management of Pinus Radiata Plantations; FAO: Roma, Italy, 2013. [Google Scholar]
  9. Baldrian, P. Forest microbiome: Diversity; complexity and dynamics. FEMS Microbiol. Rev. 2017, 41, 109–130. [Google Scholar] [CrossRef] [Green Version]
  10. Splechtna, B.; Gratzer, G.; Black, B.A. Disturbance history of a European old-growth mixed-species forest—A spatial dendro-ecological analysis. J. Veg. Sci. 2005, 16, 511–522. [Google Scholar]
  11. Jaloviar, P.; Sedmáková, D.; Pittner, J.; Danková, L.J.; Kucbel, S.; Sedmák, R.; Saniga, M. Gap structure and regeneration in the mixed old-growth forests of National Nature Reserve Sitno, Slovakia. Forests 2020, 11, 81. [Google Scholar] [CrossRef] [Green Version]
  12. Gazol, A.; Ibáñez, R. Different response to environmental factors and spatial variables of two attributes (cover and diversity) of the understorey layers. For. Ecol. Manag. 2009, 258, 1267–1274. [Google Scholar] [CrossRef]
  13. Štursová, M.; Šnajdr, J.; Cajthaml, T.; Bárta, J.; Šantrůčková, H.; Baldrian, P. When the forest dies: The response of forest soil fungi to a bark beetle-induced tree dieback. ISME J. 2014, 8, 1920–1931. [Google Scholar] [CrossRef] [PubMed] [Green Version]
  14. Ulanova, N.G. The effects of windthrow on forests at different spatial scales: A review. For. Ecol. Manag. 2000, 135, 155–167. [Google Scholar] [CrossRef]
  15. Mitchell, S.J. Wind as a natural disturbance agent in forests: A synthesis. Forestry 2013, 86, 147–157. [Google Scholar] [CrossRef] [Green Version]
  16. Gazol, A.; Camarero, J.J.; Vicente-Serrano, S.M.; Sánchez-Salguero, R.; Gutiérrez, E.; de Luis, M.; Sangüesa-Barreda, G.; Novak, K.; Rozas, V.; Tíscar, P.A.; et al. Forest resilience to drought varies across biomes. Glob. Chang. Biol. 2018, 24, 2143–2158. [Google Scholar] [CrossRef] [PubMed]
  17. Aponte, C.; Matías, L.; González-Rodríguez, V.; Castro, J.; García, L.V.; Villar, R.; Marañón, T. Soil nutrients and microbial biomass in three contrasting Mediterranean forests. Plant Soil 2014, 380, 57–72. [Google Scholar] [CrossRef]
  18. Rodríguez, O.; Bech, J. Reanalysing strong-convective wind damage paths using high-resolution aerial images. Nat. Hazards 2020, 104, 1021–1038. [Google Scholar] [CrossRef]
  19. Piserra, M.T.; del Río, J. Study of the strong winds phenomenon hazard in Spain. Inf. Construcción 1994, 45, 5–12. [Google Scholar] [CrossRef] [Green Version]
  20. Vicente-Serrano, S.M.; Gouveia, C.; Camarero, J.J.; Beguería, S.; Trigo, R.; López-Moreno, J.I.; Azorín-Molina, C.; Pasho, E.; Lorenzo-Lacruz, J.; Revuelto, J.; et al. Response of vegetation to drought time-scales across global land biomes. Proc. Natl. Acad. Sci. USA 2013, 110, 52–57. [Google Scholar] [CrossRef] [Green Version]
  21. De Vries, F.T.; Manning, P.; Tallowin, J.R.; Mortimer, S.R.; Pilgrim, E.S.; Harrison, K.A.; Hobbs, P.J.; Quirk, H.; Shipley, B.; Cornelissen, J.H.; et al. Abiotic drivers and plant traits explainlandscape-scale patterns in soil microbial communities. Ecol. Lett. 2012, 15, 1230–1239. [Google Scholar] [CrossRef]
  22. Guillot, E.; Hinsinger, P.; Dufour, L.; Roy, J.; Bertrand, I. With or without trees: Resistance and resilience of soil microbial communities to drought and heat stress in a Mediterranean agroforestry system. Soil Biol. Biochem. 2019, 129, 122–135. [Google Scholar] [CrossRef]
  23. Cornes, R.; van der Schrier, G.; van den Besselaar, E.J.M.; Jones, P.D. An ensemble version of the E-OBS temperature and precipitation datasets. J. Geophys. Res. Atmos. 2018, 123, 9391–9409. [Google Scholar] [CrossRef] [Green Version]
  24. Gorelick, N.; Hancher, M.; Dixon, M.; Ilyushchenko, S.; Thau, D.; Moore, R. Google Earth Engine: Planetary-scale geospatial analysis for everyone. Rem. Sens. Environ. 2017, 202, 18–27. [Google Scholar] [CrossRef]
  25. Didan, K. MOD13A1 MODIS/Terra Vegetation Indices 16-Day L3 Global 500m SIN Grid V006 [Data set]. NASA EOSDIS Land Processes DAAC. 2015. Available online: https://doi.org/10.5067/MODIS/MOD13A1.006 (accessed on 12 January 2021).
  26. Fritts, H.C. Tree-Rings and Climate; Academic Press: London, UK, 1976. [Google Scholar]
  27. Larsson, L.-A.; Larsson, P.O. CDendro and CooRecorder (v. 9.3.1) [Software]; Cybis Elektronik: Saltsjöbaden, Sweden, 2018. [Google Scholar]
  28. Holmes, R.L. Computer assisted quality control in tree ring dating and measurement. Tree-Ring Bull. 1983, 43, 69–78. [Google Scholar]
  29. Cook, E.R.; Krusic, P. A tree-ring standardization program based on detrending and autoregressive time series modeling; with interactive graphics. In Lamont Doherty Earth Observatory; Columbia University: New York, NY, USA, 2005. [Google Scholar]
  30. Briffa, K.R.; Jones, P.D. Basic chronology statistics and assessment. In Methods of Dendrochronology: Applications in the Environmental Sciences; Cook, E.R., Kairiukstis, L., Eds.; Kluwer Academic Publishers: Dordrecht, The Netherlands, 1990; pp. 137–152. [Google Scholar]
  31. Wigley, T.M.; Briffa, K.R.; Jones, P.D. On the average value of correlated time series; with applications in dendroclimatology and hydrometeorology. J. Clim. Appl. Meteorol. 1984, 23, 201–213. [Google Scholar] [CrossRef]
  32. Buyer, J.S.; Sasser, M. High throughput phospholipid fatty acid analysis of soils. Appl. Soil Ecol. 2012, 61, 127–130. [Google Scholar] [CrossRef]
  33. Frostegård, A.; Bååth, E. The use of phospholipid fatty acid analysis to estimate bacterial and fungal biomass in soil. Biol. Fertil. Soils 1996, 22, 59–65. [Google Scholar] [CrossRef]
  34. Zelles, L. Fatty acid patterns of phospholipids and lipopolysaccharides in the characterisation of microbial communities in soil: A review. Biol. Fertil. Soils 1999, 29, 111–129. [Google Scholar] [CrossRef]
  35. Zelles, L. Phospholipid fatty acid profiles in selected members of soil microbial communities. Chemosphere 1997, 35, 275–294. [Google Scholar] [CrossRef]
  36. Willers, C.; Jansen van Rensburg, P.J.; Claassens, S. Phospholipid fatty acid profiling of microbial communities–a review of interpretations and recent applications. J. Appl. Microbiol. 2015, 119, 1207–1218. [Google Scholar] [CrossRef] [PubMed]
  37. Legendre, P.; Legendre, L. Numerical Ecology; Elsevier: Amsterdam, The Netherlands, 2012. [Google Scholar]
  38. McArdle, B.H.; Anderson, M.J. Fitting multivariate models to community data: A comment on distance-based redundancy analysis. Ecology 2001, 82, 290–297. [Google Scholar] [CrossRef]
  39. Oksanen, J.; Blanchet, F.G.; Friendly, M.; Kindt, R.; Legendre, P.; McGlinn, D.; Minchin, P.R.; O’Hara, R.B.; Simpson, G.L.; Solymos, P.; et al. Vegan: Community Ecology Package. R Package Version 2.5-7. Available online: https://CRAN.R-project.org/package=vegan (accessed on 3 May 2021).
  40. R Core Team. R: A Language and Environment for Statistical Computing; R Foundation for Statistical Computing: Vienna, Austria; Available online: https://www.R-project.org/ (accessed on 3 May 2021).
  41. Hollander, M.; Wolfe, D.A. Nonparametric Statistical Methods; J. Wiley: New York, NY, USA, 1973. [Google Scholar]
  42. Dunn, O.J. Multiple comparisons using rank sums. Technometrics 1964, 6, 241–252. [Google Scholar] [CrossRef]
  43. Ogle, D.H.; Wheeler, P.; Dinno, A. FSA: Fisheries Stock Analysis. R Package Version 0.8.32. Available online: https://github.com/droglenc/FSA (accessed on 3 May 2021).
  44. Rakhsh, F.; Golchin, A.; Al Agha, A.B.; Nelson, P.N. Mineralization of organic carbon and formation of microbial biomass in soil: Effects of clay content and composition and the mechanisms involved. Soil Biol. Biochem. 2020, 151, 108036. [Google Scholar] [CrossRef]
  45. Riaz, M.; Marschner, P. Sandy soil amended with clay soil: Effect of clay soil properties on soil respiration; microbial biomass; and water extractable organic C. J. Soil Sci. Plant Nut 2020, 20, 2465–2470. [Google Scholar] [CrossRef]
  46. Sohn, J.A.; Saha, S.; Bauhus, J. Potential of forest thinning to mitigate drought stress: A meta-analysis. For. Ecol. Manag. 2016, 380, 261–273. [Google Scholar] [CrossRef]
  47. Giuggiola, A.; Bugmann, H.; Zingg, A.; Dobbertin, M.; Rigling, A. Reduction of stand density increases drought resistance in xeric Scots pine forests. For. Ecol. Manae. 2013, 310, 827–835. [Google Scholar] [CrossRef]
  48. Giuggiola, A.; Ogée, J.; Rigling, A.; Gessler, A.; Bugmann, H.; Treydte, K. Improvement of water and light availability after thinning at a xeric site: Which matters more? A dual isotope approach. New Phytol. 2016, 210, 108–121. [Google Scholar] [CrossRef] [PubMed]
  49. Tague, C.L.; Moritz, M.; Hanan, E. The changing water cycle: The eco-hydrologic impacts of forest density reduction in Mediterranean (seasonally dry) regions. WIREs Water 2019, 6, e1350. [Google Scholar] [CrossRef]
  50. Lohmander, P.; Helles, F. Windthrow probability as a function of stand characteristics and shelter. Scand. J. For. Res. 1987, 2, 227–238. [Google Scholar] [CrossRef]
  51. Vicente-Serrano, S.M.; Camarero, J.J.; Olano, J.M.; Martín-Hernández, N.; Peña-Gallardo, M.; Tomás-Burguera, M.; Gazol, A.; Azorin-Molina, C.; Bhuyan, U.; El Kenawy, A. Diverse relationships between forest growth and the Normalized Difference Vegetation Index at a global scale. Remote Sens. Environ. 2016, 187, 14–29. [Google Scholar] [CrossRef] [Green Version]
  52. Camarero, J.J.; Gazol, A.; Sangüesa-Barreda, G.; Vergarechea, M.; Alfaro-Sánchez, R.; Cattaneo, N.; Vicente-Serrano, S.M. Tree growth is more limited by drought in rear-edge forests most of the times. For. Ecosyst. 2021, 8, 25. [Google Scholar] [CrossRef]
  53. Tsamir, M.; Gottlieb, S.; Preisler, Y.; Rotenberg, E.; Tatarinov, F.; Yakir, D.; Tague, C.; Klein, T. Stand density effects on carbon and water fluxes in a semi-arid forest; from leaf to stand-scale. For. Ecol. Manag. 2019, 453, 117573. [Google Scholar] [CrossRef]
  54. Moreno, G.; Hernández-Esteban, A.; Rolo, V.; Igual, J.M. The enduring effects of sowing legume-rich mixtures on the soil microbial community and soil carbon in semi-arid wood pastures. Plant Soil 2021, in press. [Google Scholar] [CrossRef]
  55. Aussenac, G. Interactions between forest stands and microclimate: Ecophysiological aspects and consequences for silviculture. Ann. For. Sci. 2000, 57, 287–301. [Google Scholar] [CrossRef]
  56. Matsushima, M.; Chang, S.X. Effects of understory removal; N fertilization; and litter layer removal on soil N cycling in a 13-year-old white spruce plantation infested with Canada bluejoint grass. Plant Soil 2007, 292, 243–258. [Google Scholar] [CrossRef]
  57. De Boer, W.; Folman, L.B.; Summerbell, R.C.; Boddy, L. Living in a fungal world: Impact of fungi on soil bacterial niche development. FEMS Microbiol. Rev. 2005, 29, 795–811. [Google Scholar] [CrossRef] [PubMed] [Green Version]
  58. Lässig, R. Windwürfe—Chancen für artenreiche Wälder nutzen. Wald Holz 2000, 81, 56–60. [Google Scholar]
  59. Kumar, M.; Kumar, A.; Kumar, R.; Konsam, B.; Pala, N.A.; Bhat, J.A. Carbon stock potential in Pinus roxburghii forests of Indian Himalayan regions. Environ. Dev. Sustain. 2021. [Google Scholar] [CrossRef]
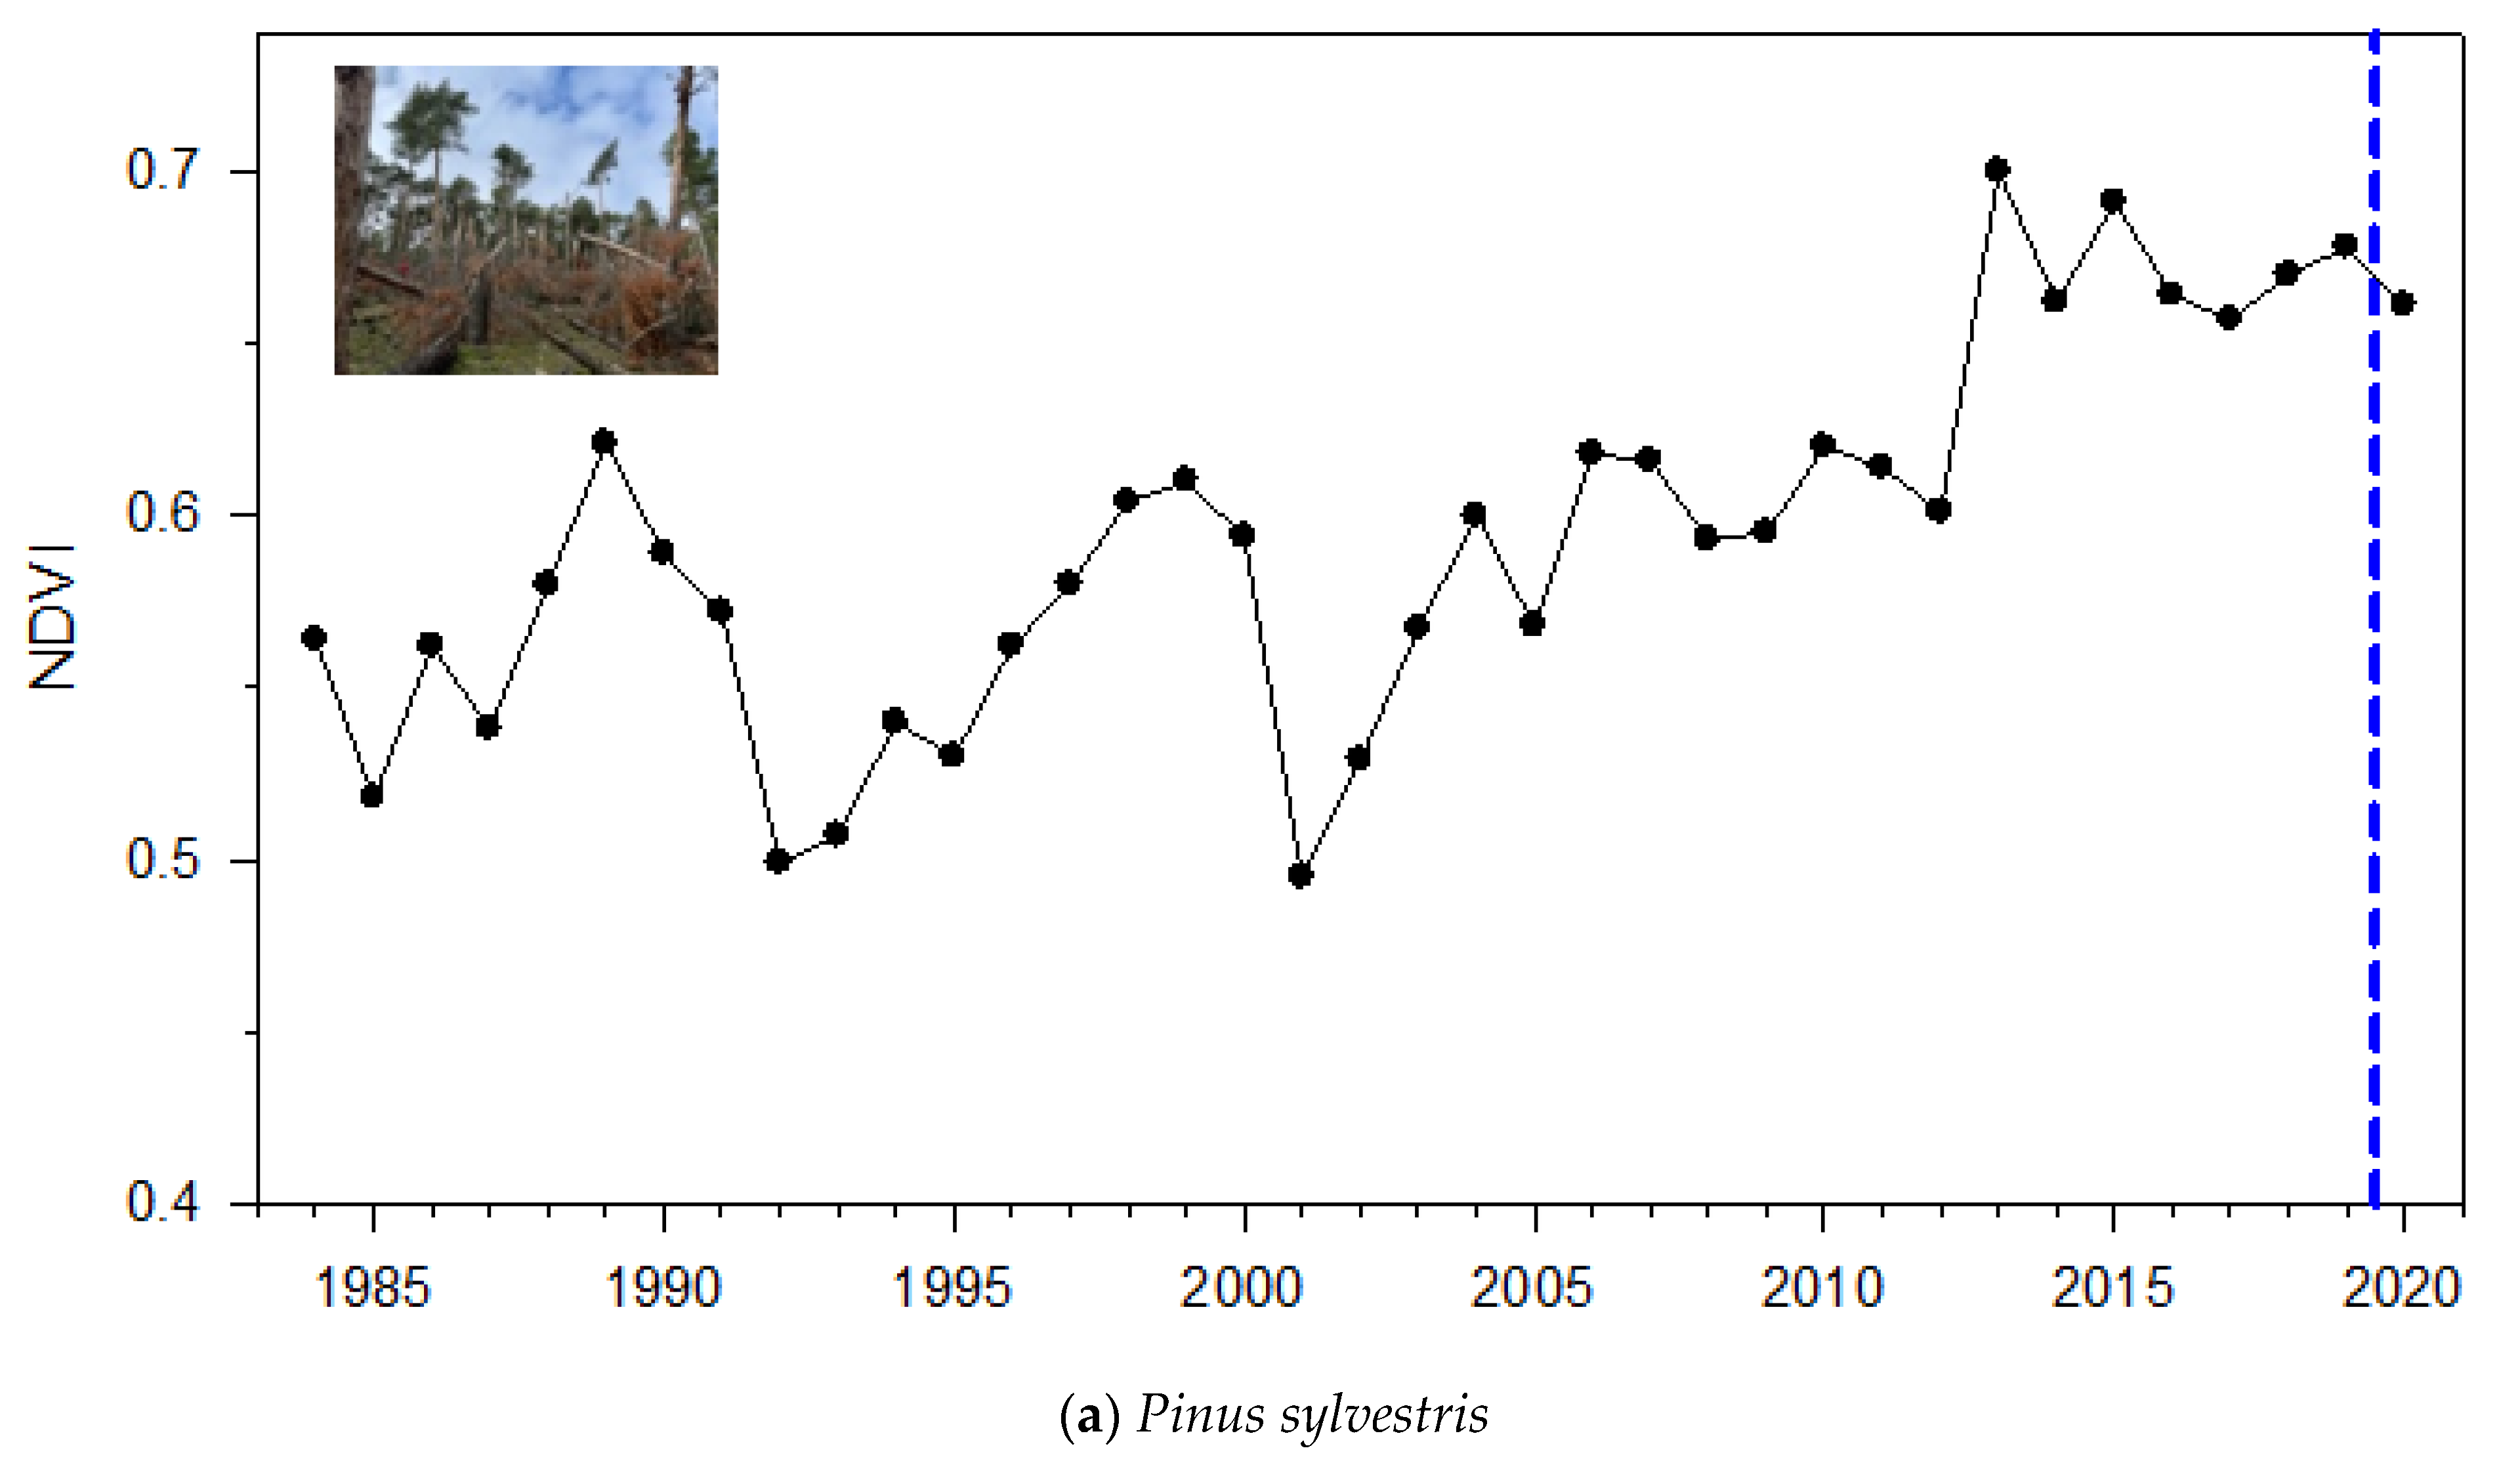
Figure 1. Annual NDVI data of the affected (a) Pinus sylvestris and (b) Pinus halepensis stands. The dashed vertical lines indicate the change in NDVI after the storm impacts. The photographs show views of the stands affected by windstorms.
Forests 12 00817 g001aForests 12 00817 g001b
Figure 2. Growth data (basal area increment) of the affected (a) Pinus sylvestris and (b) Pinus halepensis stands. The symbols indicate trees sampled within the gap or located at 0, 5 and 10 m from the gap edge. The dashed vertical lines indicate the change in growth after the storm impacts. Values are means ± SE. Nothe the logarithmic scales.
Forests 12 00817 g002
Figure 3. Climate-growth relationships based on Pearson correlations calculated by relating the residual chronologies of Pinus halepensis (black bars) and Pinus sylvestris (grey bars) and mean monthly temperature and precipitation. Dashed and dotes lines show the 0.05 and 0.01 significance levels, respectively. The last column corresponds to the accumulated precipitation form March to June (MAMJ), i.e., during the growing season. The correlations were calculated for the common, pre-windthrow period 1965–2016 (see Figure S3).
Forests 12 00817 g003
Figure 4. Ordination biplots showing the scores in the first (PC1) and second (PC2) principal components (their variances are indicated between parenthesis) resulting from the analyses of soil samples in the P. sylvestris and P. halepensis stands. Empty and filled symbols correspond to gap and closed-canopy samples, respectively. Arrows represent the main groups of soil microbial community composition.
Forests 12 00817 g004
Table 1. Size and growth data of the trees sampled in the two pine plantations. Values are means ± SE. Different letters indicate significant (p < 0.05) differences between species according to Mann–Whitney tests.
Pinus sylvestrisPinus halepensis
Diameter at 1.3 m (cm)24.2 ± 0.8b19.8 ± 0.6a
Age at 1.3 m (years)91 ± 1b55 ± 1a
No. trees2334
No. cores3567
Tree-ring width (mm)0.98 ± 0.03a1.19 ± 0.03b
First-order autocorrelation0.69 ± 0.020.66 ± 0.01
Mean sensitivity0.48 ± 0.01a0.63 ± 0.01b
Correlation with site series0.71 ± 0.02a0.90 ± 0.01b
Time span1922−20201962−2020
Best-replicated time span 11936−20201965−2020
1 Period with Expressed Population Signal > 0.85.
Table 2. Differences in physical (soil texture) and chemical (pH, nutrients concentration) characteristics and microbial community composition between gaps and closed-canopy patches in the P. sylvestris and the P. halepensis sites. For each variable, the results of the Kruskal–Wallis test (KW test) and associated probability (p) are shown. When significant differences (p < 0.05) were found the Dunn’s test (Dt) was used to assess differences. Negative Dt values indicate higher values in gaps than in closed-canopy stands, whereas positive Dt values indicate higher values in closed-canopy stands.
VariablesPinus sylvestrisPinus halepensis
KW TestpDtpKW TestpDtp
clay0.2730.602 5.7710.016−2.4020.016
silt0.0110.917 1.3200.251
sand0.2730.602 2.4550.117
pH1.3200.251 1.0980.295
Organic C1.8440.175 0.2730.602
N0.2730.602 3.1530.076
C/N1.1040.293 0.0110.917
P1.8440.175 3.1530.076
Ca2.4550.117 0.8840.347
K0.5350.465 6.8180.0092.6110.009
Mg4.8110.0282.1930.0286.8180.0092.6110.009
PC11.3200.251 5.7710.0162.4020.016
PC20.5350.465 1.8440.175
Biomass0.0110.917 3.1530.076
Eukaryote1.3200.251 0.5350.465
Gram negative0.2730.602 6.8180.0092.6110.009
Gram positive0.0980.754 4.8110.028−2.1930.028
Actinomycetes0.5350.465 5.7710.016−2.4020.016
Fungi2.4550.117 2.4550.117
AM Fungi2.4550.117 0.0110.917
Fungi: Bacteria2.4550.117 2.4550.117
Gram positive: Gram negative0.2730.602 6.8180.009−2.6110.009
Stress0.0110.917 0.0110.917
Table 3. Correlation coefficients (Spearman rho) calculated between the first (PC1) and second (PC2) principal components of a Principal Component Analysis while considering data on soil texture, nutrients concentrations and microbial community composition. For each variable, the correlation coefficient (Spearman rho) and associated probability (p) are shown. Significant values (p < 0.05) are shown in bold.
VariablesPinus sylvestrisPinus halepensis
PC1PC2PC1PC2
rhoprhoprhoprhop
Clay0.4420.2040.2970.407−0.9270.001−0.1640.657
Silt0.3330.3490.1880.608−0.3450.3310.0061.000
Sand−0.3580.313−0.2610.470.7820.012−0.1150.759
pH−0.2610.470.0670.865−0.6810.030.2010.578
Organic C0.4550.1910.6000.0730.6000.073−0.1030.785
N0.6610.0440.3450.3310.8790.002−0.0061.000
C/N−0.4570.1840.3170.3720.3330.3490.0420.919
P0.4790.1660.1760.6320.8180.007−0.0910.811
Ca0.2850.4270.4420.204−0.1520.682−0.8060.008
K0.3210.3680.0790.8380.9390.0010.20.584
Mg−0.0670.8650.3940.2630.8790.0020.5270.123
Biomass0.8060.008−0.0550.8920.8550.0040.0420.919
Eukaryotes0.4060.2470.5390.1130.3330.3490.5640.096
Gram negative0.7940.0100.2480.4920.9640.0010.2610.47
Gram positive0.0670.865−0.3580.313−0.3210.368−0.7580.016
Actinomycetes0.1760.6320.2240.537−0.9640.001−0.3450.331
Fungi−0.8910.0010.0790.8380.3210.3680.8300.006
AM Fungi−0.2970.407−0.7450.0180.4550.191−0.4790.166
Fungi: Bacteria−0.8910.0010.0790.8380.4060.2470.7700.014
Gram positive: Gram negative−0.6850.035−0.3580.313−0.9520.001−0.2970.407
Stress−0.6970.031−0.5150.1330.4180.232−0.2850.427
Publisher’s Note: MDPI stays neutral with regard to jurisdictional claims in published maps and institutional affiliations.