
Geographic Setting and Groundwater Table Control Carbon Emission from Indonesian Peatland: A Meta-Analysis

 , ,
, ,  and
and
Abstract
:1. Introduction
- To provide a Tier 2 emission factor estimate for peat decomposition using recent publications in Indonesia;
- To model the relationship between total and heterotrophic respirations with significant environmental predictors (i.e., land use, land cover class, geographical coordinate, water table depth, bulk density, and air temperature) in order to quantify CO2 emission reductions from rewetting.
2. Methodology
2.1. Scope of the Study
2.2. Total CO2 and Heterotrophic Emissions Data Set
2.3. Emission Factor (EF) in Different Land Use and Land Covers Categories

| No. | Author (Year) | Number of Observations | |
|---|---|---|---|
| Total CO2 | Heterotrophic | ||
| 1 | Ali et al., (2006) [33] | 3 | |
| 2 | Astiani et al., (2018) [34] | 4 | |
| 3 | Batubara et al., (2019) [35] | 2 | |
| 4 | Comeau et al., (2016) [36] | 1 | |
| 5 | Dariah et al., (2014) [37] | 2 | 2 |
| 6 | Furukawa et al., (2005) [38] | 12 | |
| 7 | Hadi et al., (2005) [39] | 3 | |
| 8 | Handayani et al., (2009) [40] | 7 | 7 |
| 9 | Hergoualc’h et al., (2017) [41] | 3 | 3 |
| 10 | Hirano et al., (2007) [42] | 1 | |
| 11 | Hirano et al., (2009) [15] | 6 | |
| 12 | Hirano et al., (2014) [43] | 2 | |
| 13 | Hooijer et al., (2012) [22] | 2 | |
| 14 | Hooijer et al., (2014) [44] | 1 | |
| 15 | Husnain et al., (2014) [45] | 1 | 6 *) |
| 16 | Inubushi et al., (2003) [46] | 3 | |
| 17 | Ishikura et al., (2017) [47] | 11 | |
| 18 | Ishizuka et al., (2002) [48] | 8 | |
| 19 | Itoh et al., (2017) [49] | 3 | |
| 20 | Jamaludin et al., (2020) [50] | 3 | 3 |
| 21 | Jauhiainen et al., (2005) [51] | 1 | |
| 22 | Jauhiainen et al., (2008) [13] | 4 | |
| 23 | Jauhiainen et al., (2012) [52] | 8 | 8 |
| 24 | Khasanah and van Noordwijk (2019) [53] | 4 | |
| 25 | Marwanto and Agus (2014) [54] | 1 | |
| 26 | Marwanto et al., (2019) [55] | 1 | |
| 27 | Saragi-Sasmito et al., (2019) [56] | 1 | 1 |
| 28 | Sundari et al., (2012) [57] | 2 | |
| 29 | Swails et al., (2019) [58] | 6 | |
| 30 | Toma et al., (2011) [59] | 1 | |
| 31 | Wakhid et al., (2017) [23] | 1 | 1 |
| 32 | Watanabe et al., (2009) [60] | 4 | |
| Total | 112 | 31 | |
2.4. Model for Estimating Total CO2 and Heterotrophic Emissions
3. Results
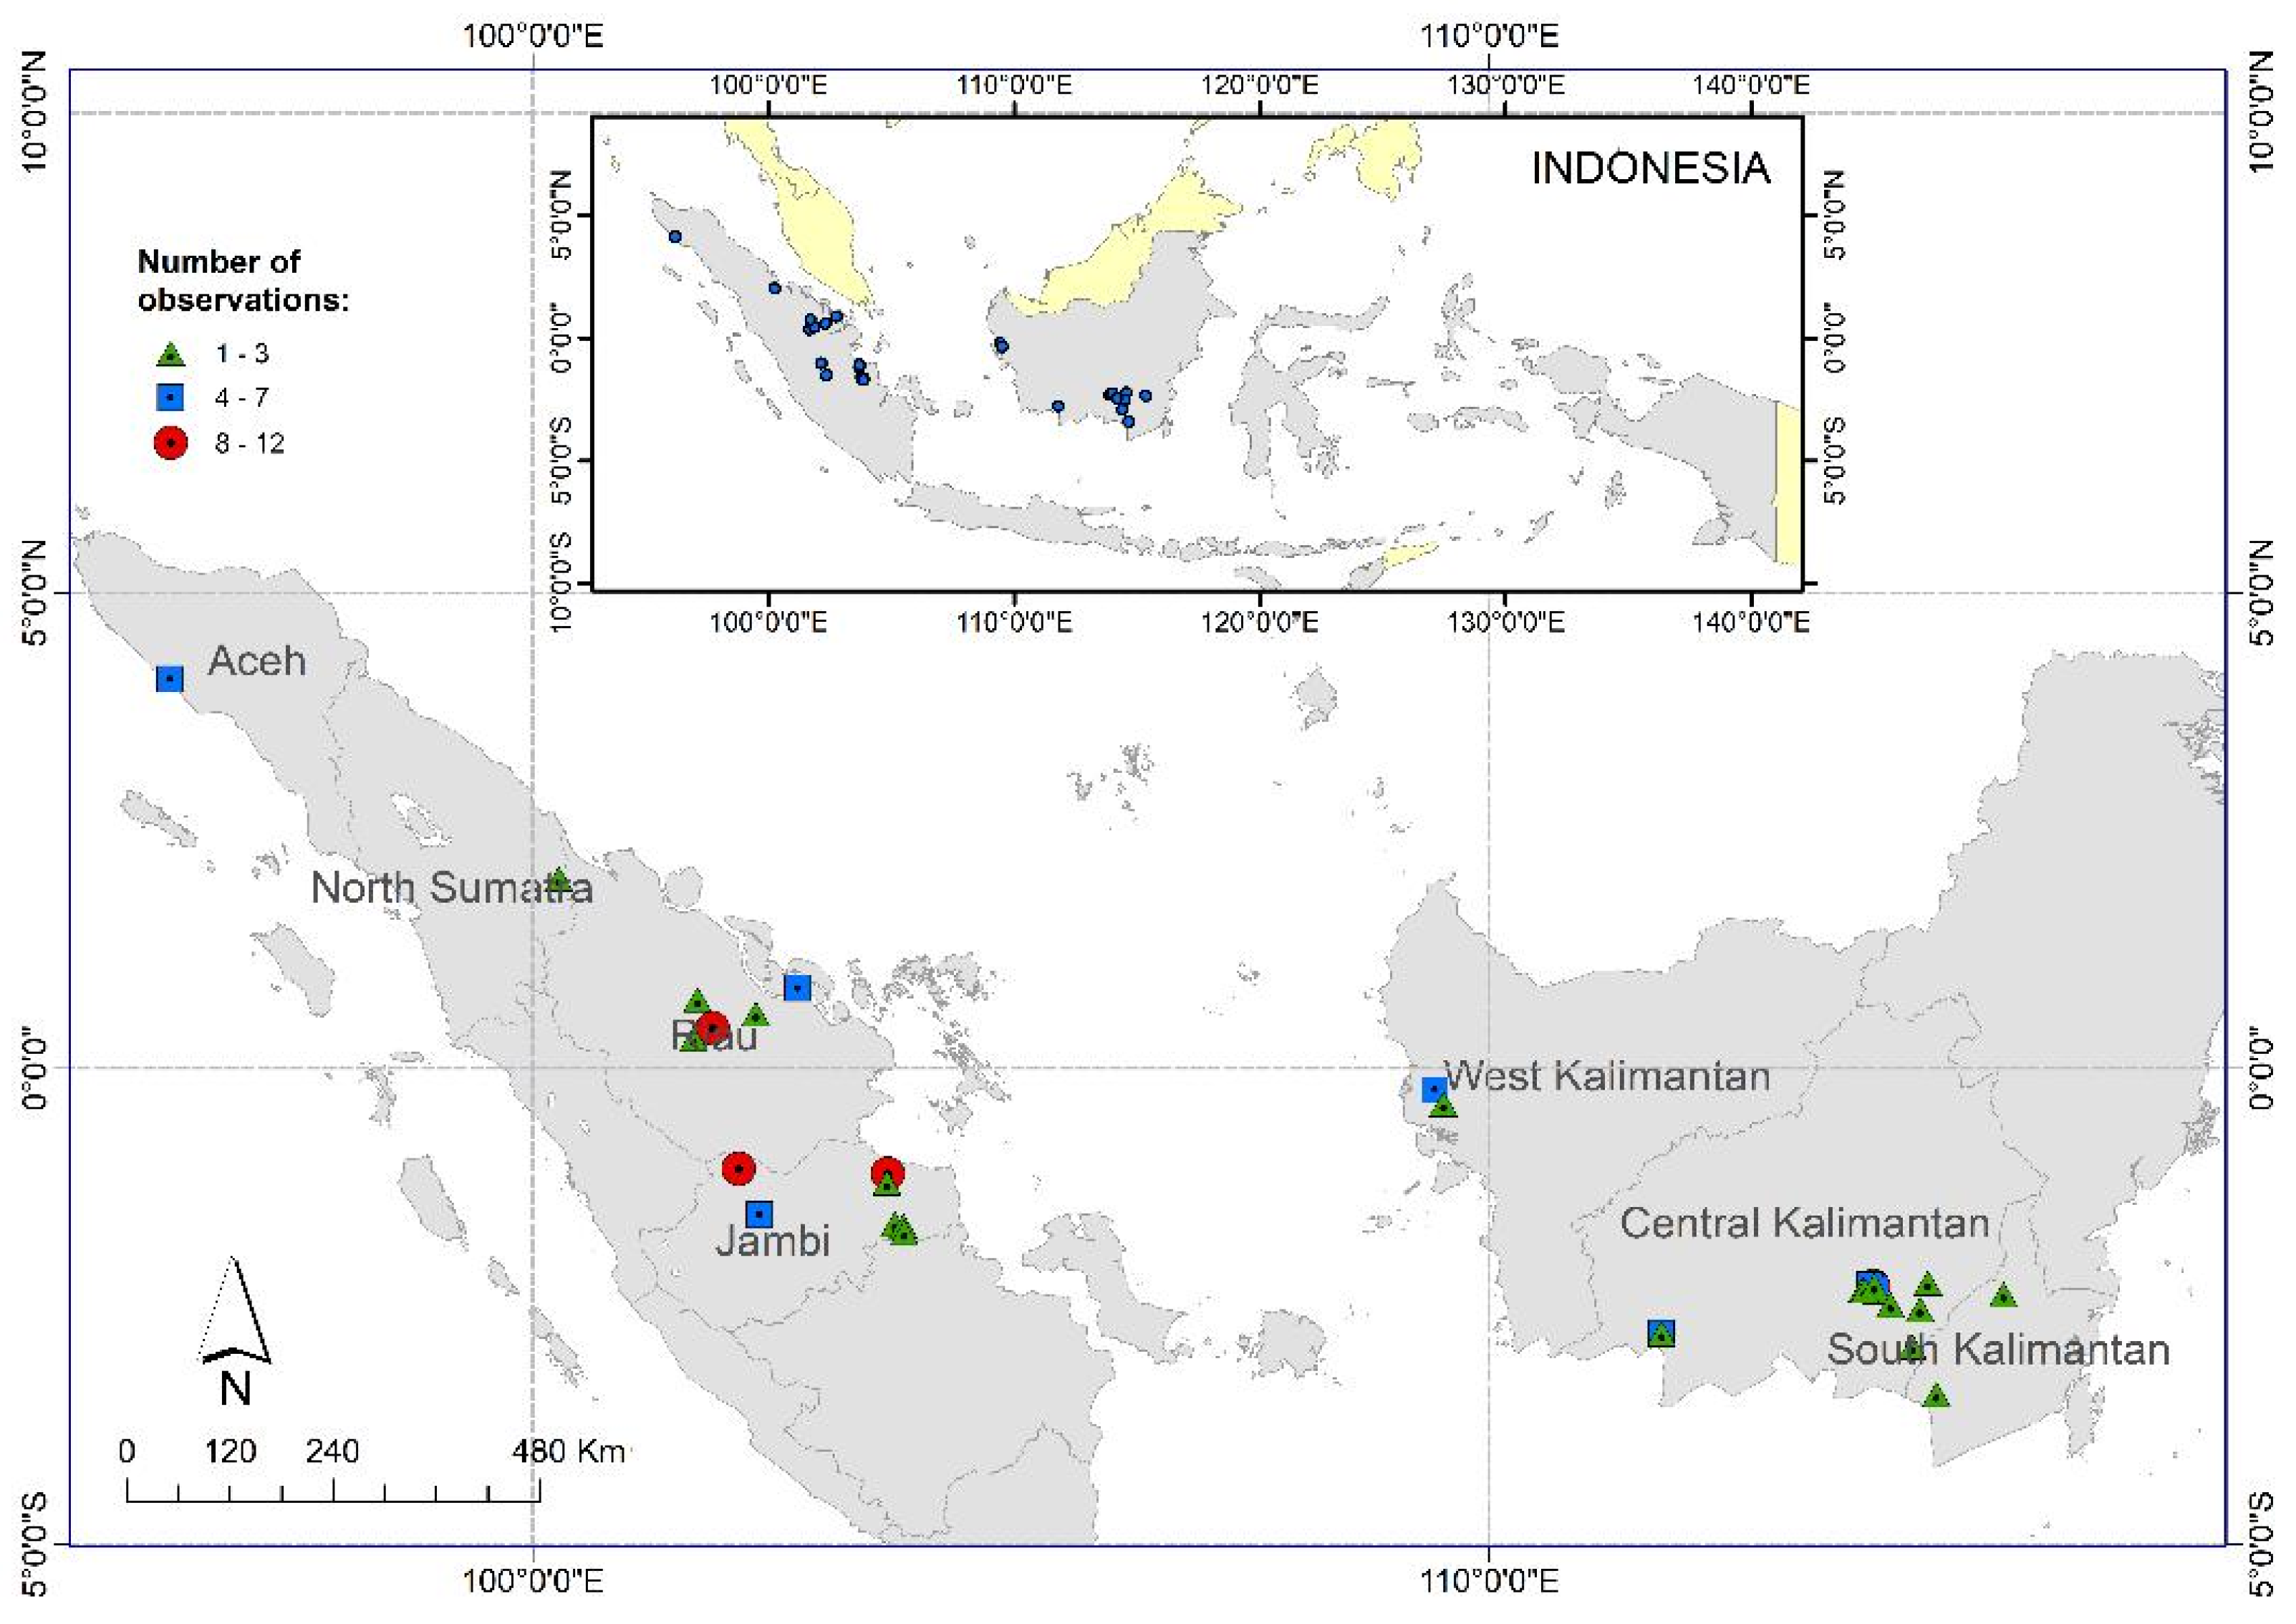
3.1. Data Site
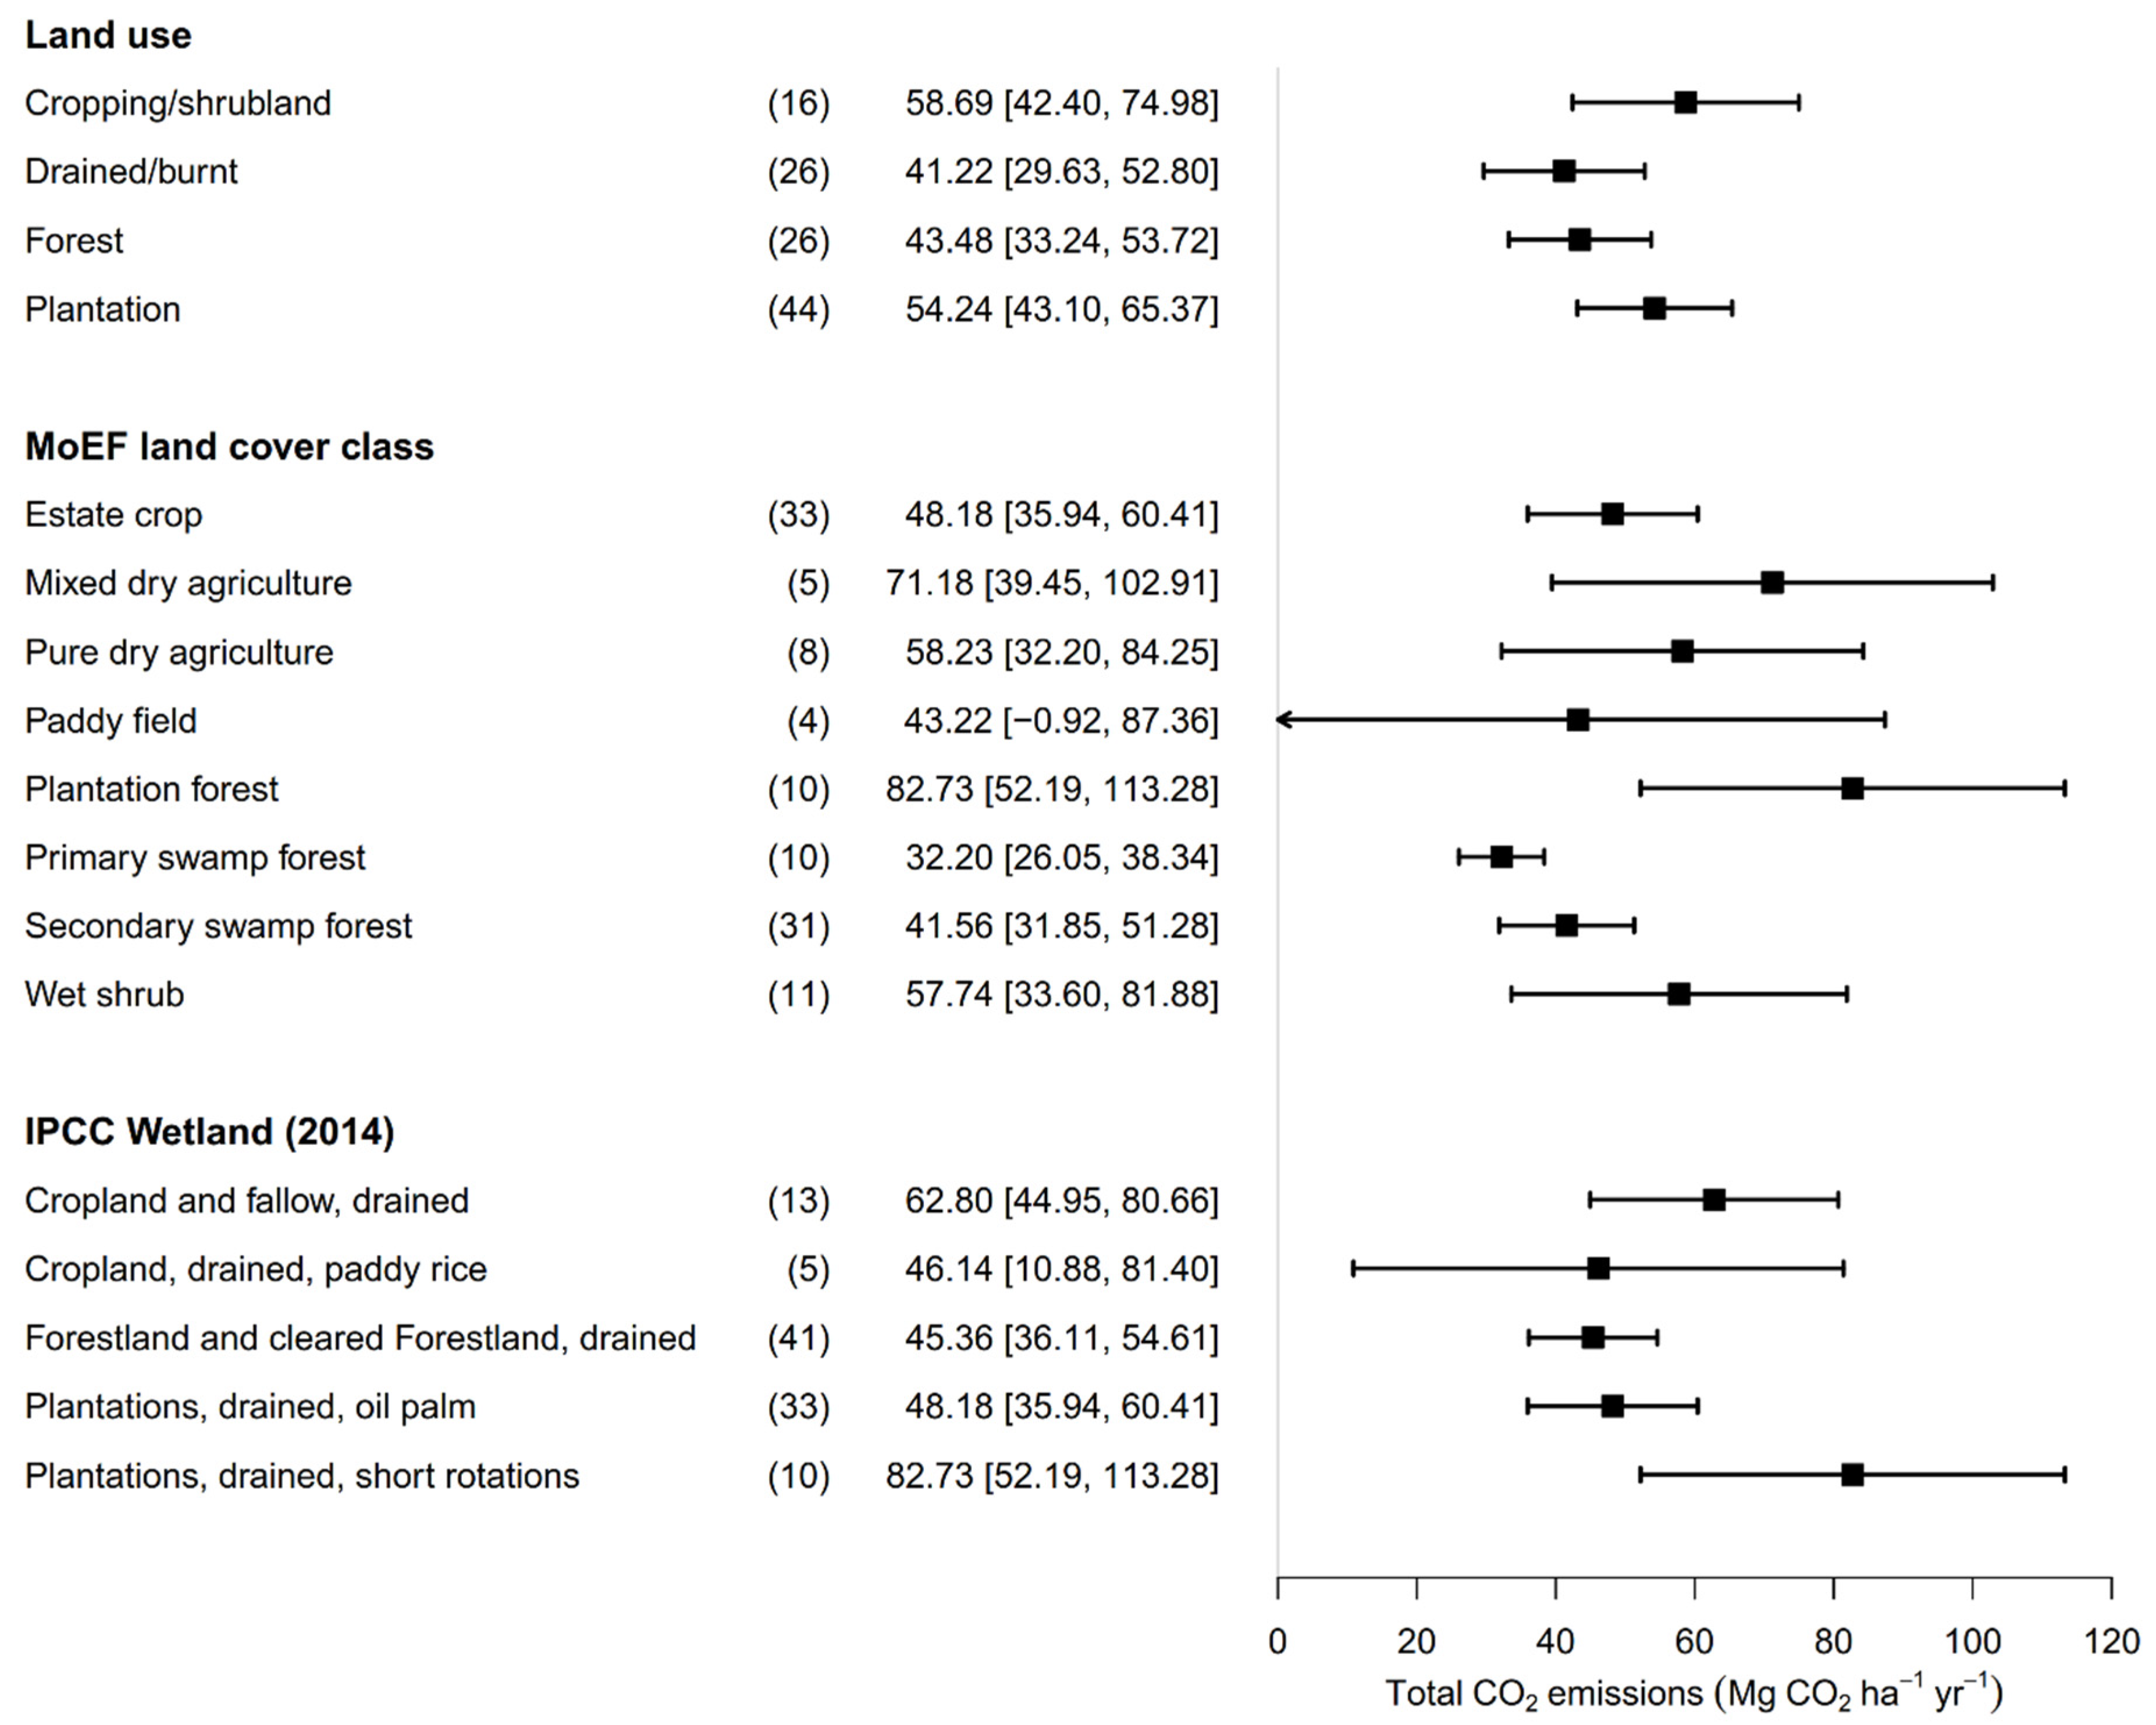
3.2. Emissions Factor of CO2 Emissions from Tropical Peatland in Indonesia
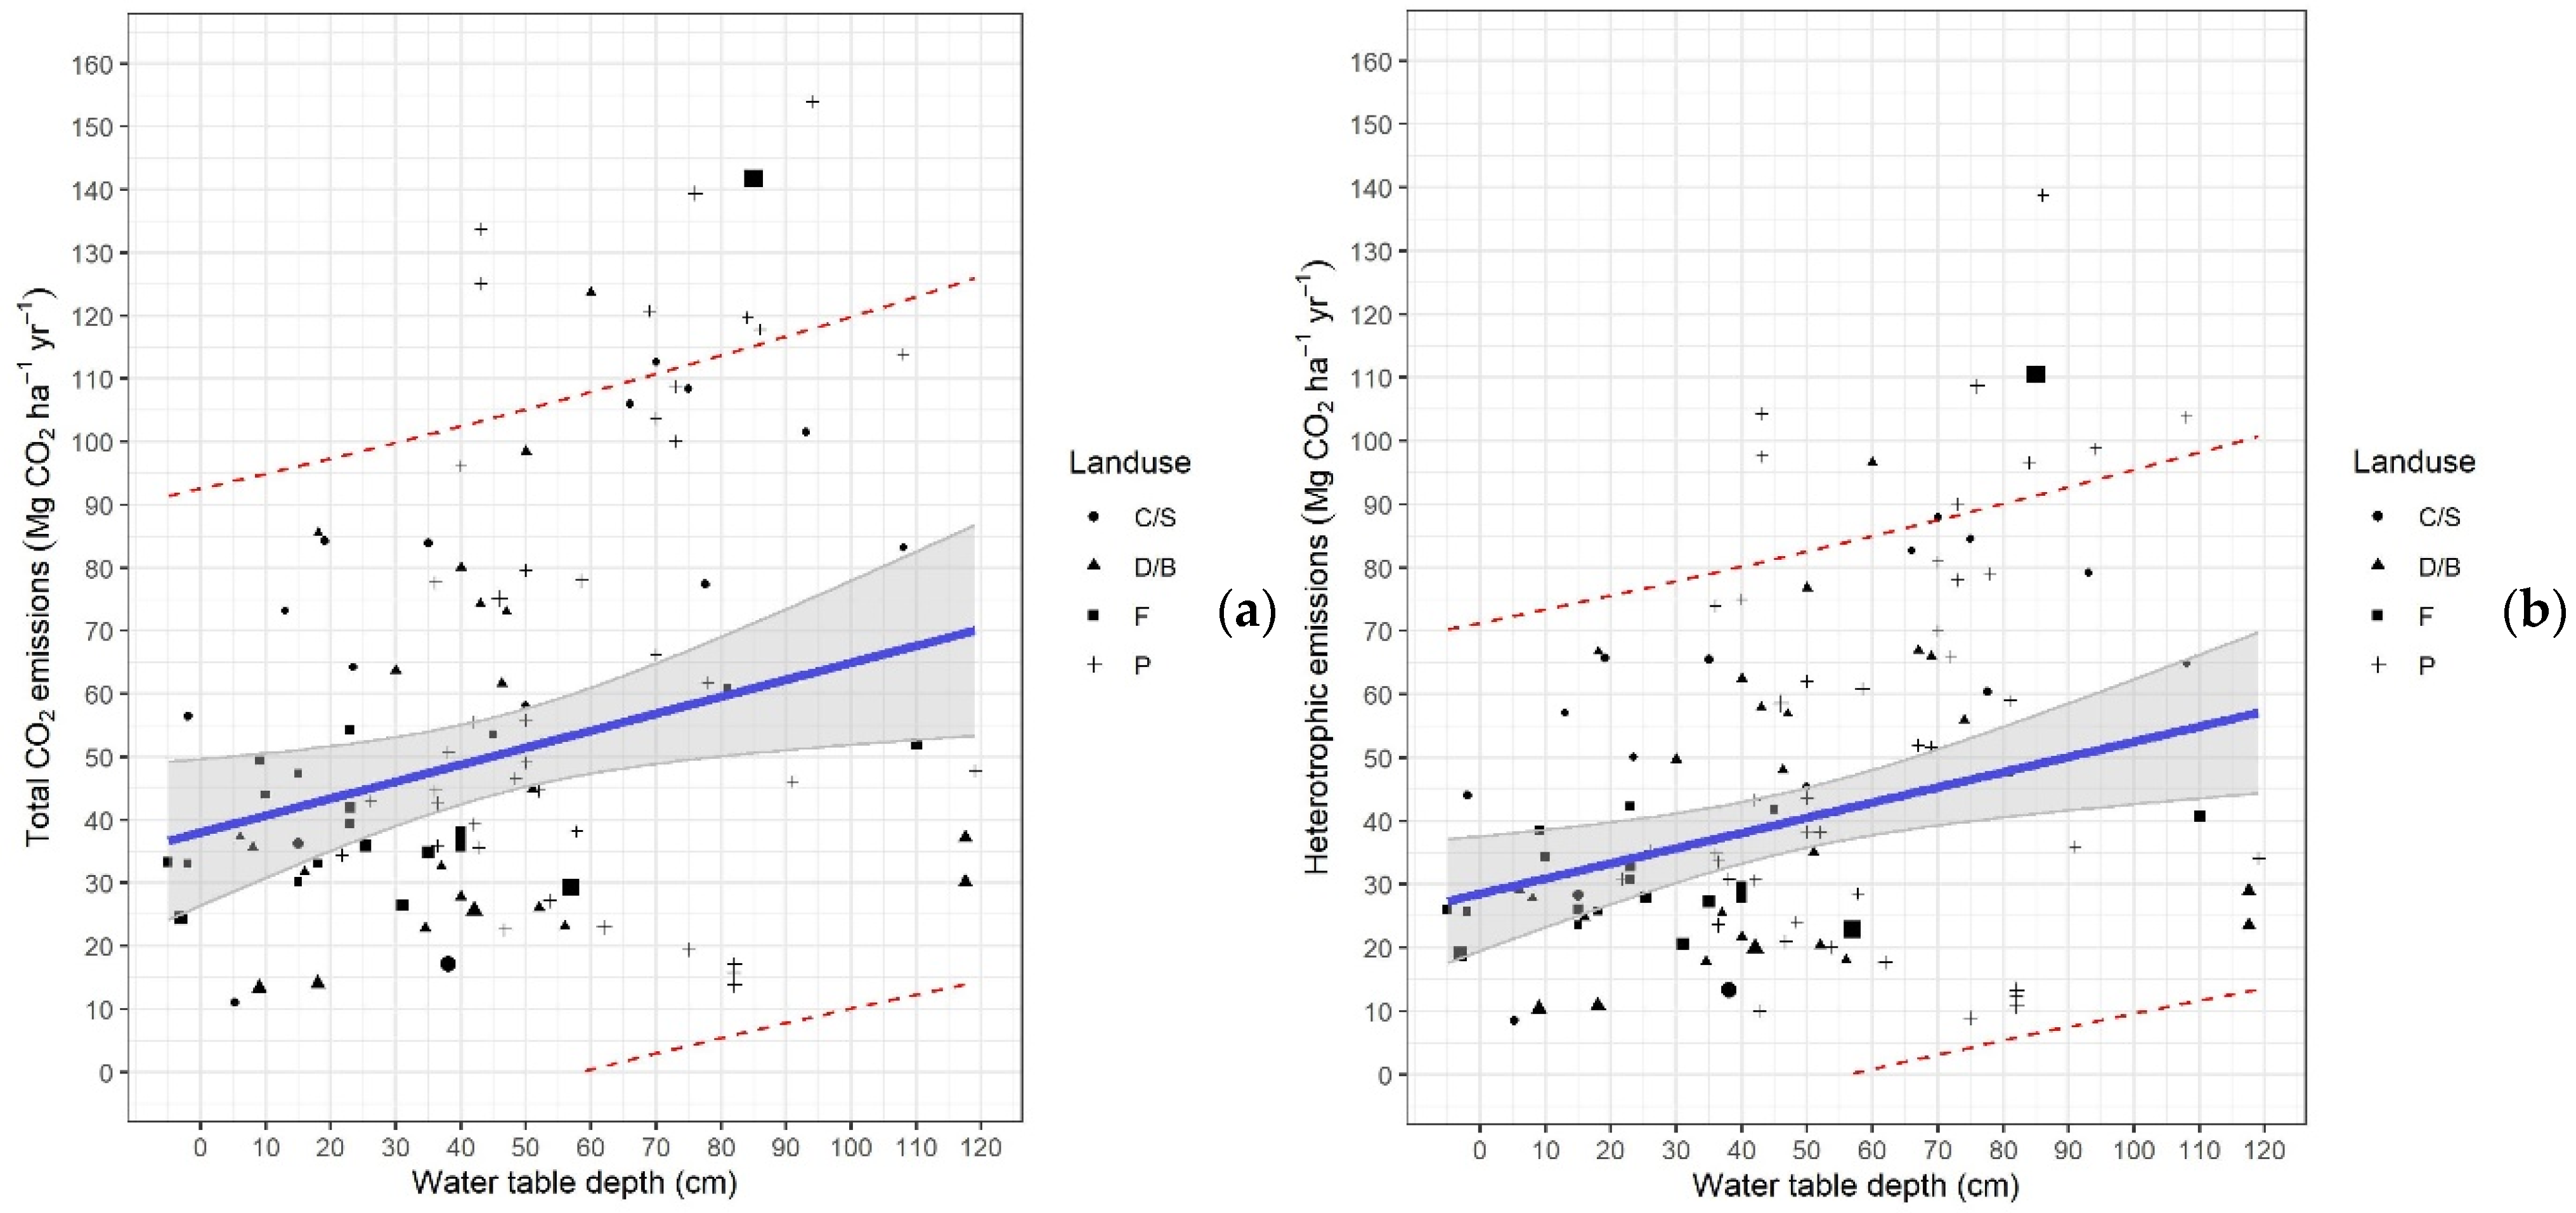
3.3. Meta-Analysis of CO2 Emissions with Environmental Variables
3.4. Do We Need a Specific Model for Each Land Use Category?
4. Discussions
4.1. Recommendation for Tier 2 Emission Factor
4.2. Estimating CO2 Emissions from Water Table Depth and Latitude
5. Conclusions
Author Contributions
Funding
Data Availability Statement
Acknowledgments
Conflicts of Interest
Appendix A
| No | Citation | Literature | Title of Publication |
|---|---|---|---|
| 1 | Ali et al., 2006 | Journal | Effect of environmental variations on CO2 Efflux from a tropical peatlands in eastern Sumatera |
| 2 | Astiani et al., 2018 | Journal | Soil CO2 respiration along annual crops or land-cover type gradients on West Kalimantan degraded peatland forest |
| 3 | Batubara et al., 2019 | Journal | Impact of soil collar insertion depth on microbial respiration measurements from tropical peat under an oil palm plantation |
| 4 | Comeau et al., 2016 | Journal | How do the heterotrophic and the total soil respiration of an oil palm plantation on peat respond to nitrogen fertilizer application? |
| 5 | Dariah et al., 2013 | Journal | Root and peat based CO2 emissions from oil palm plantations |
| 6 | Furukawa et al., 2005 | Journal | Effect of changing groundwater levels caused by land-use changes on greenhouse gas fluxes from tropical peat lands |
| 7 | Hadi et al., 2005 | Journal | Greenhouse gas emissions from tropical peatlands of Kalimantan, Indonesia |
| 8 | Handayani et al., 2009 | Journal | Carbon Dioxide (CO2) Emission of Oil Palm Plantation on Peatland: The evaluation CO2 flux on inside and outside Rhyzosphere |
| 9 | Hergoualc’h et al., 2017 | Journal | Total and heterotrophic soil respiration in a swamp forest and oil palm plantations on peat in Central Kalimantan |
| 10 | Hirano et al., 2007 | Journal | Carbon dioxide balance of a tropical peat swamp forest in Kalimantan, Indonesia |
| 11 | Hirano et al., 2009 | Journal | Controls on the Carbon Balance of Tropical Peatlands |
| 12 | Hirano et al., 2014 | Journal | Carbon dioxide emissions through oxidative peat decomposition on a burnt tropical peatland |
| 13 | Hooijer et al., 2012 | Journal | Subsidence and carbon loss in drained tropical peatlands |
| 14 | Hooijer et al., 2014 | Report | Carbon emissions from drained and degraded peatland in Indonesia and emission factors for measurement, reporting and verification (MRV) of peatland greenhouse gas emissions |
| 15 | Husnain et al., 2014 | Journal | CO2 emissions from tropical drained peat in Sumatera, Indonesia |
| 16 | Inubushi et al., 2003 | Journal | Seasonal changes of CO2, CH4 and N2O fluxes in relation to land-use change in tropical peatlands located in coastal area of South Kalimantan |
| 17 | Ishikura et al., 2017 | Journal | Effect of groundwater level fluctuation on soil respiration rate of tropical peatland in Central Kalimantan, Indonesia |
| 18 | Ishizuka et al., 2002 | Journal | An intensive field study on CO2, CH4, and N2O emissions from soils at four land-use types in Sumatra, Indonesia |
| 19 | Itoh et al., 2017 | Journal | Factors affecting oxidative peat decomposition due to land use in tropical peat swamp forests in Indonesia |
| 20 | Jamaludin et al., 2020 | Journal | Emisi karbon dioksida (CO2) dari pertanian skala kecil di lahan gambut |
| 21 | Jauhiainen et al., 2005 | Journal | Carbon fluxes from a tropical peat swamp forest floor |
| 22 | Jauhiainen et al., 2008 | Journal | Carbon dioxide and methane fluxes in drained tropical peat before and after hydrological restoration |
| 23 | Jauhiainen et al., 2012 | Journal | Carbon dioxide emissions from an Acacia plantation on peatland in Sumatera, Indonesia |
| 24 | Khasanah & Noordwijk, 2017 | Journal | Subsidence and carbon dioxide emissions in a smallholder peatland mosaic in Sumatra, Indonesia |
| 25 | Marwanto & Agus, 2013 | Journal | Is CO2 flux from oil palm plantations on peatland controlled by soil moisture and/or soil and air temperatures |
| 26 | Marwanto et al., 2019 | Journal | Importance of CO2 production in subsoil layers of drained tropical peatland under mature oil palm plantation |
| 27 | Saragi-Sasmito et al., 2018 | Journal | Carbon stocks, emissions, and aboveground productivity in restored secondary tropical peat swamp forest |
| 28 | Sundari et al., 2012 | Journal | Effect of groundwater level on soil respiration in tropical peat swamp forests |
| 29 | Swails et al., 2018 | Journal | The response of soil respiration to climatic drivers in undrained forest and drained oil palm plantations in a Indonesia peatland |
| 30 | Toma et al., 2011 | Journal | Nitrous oxide emission derived from soil organic matter decomposition from tropical agricultural peat soil in central Kalimantan, Indonesia |
| 31 | Wakhid et al., 2017 | Journal | Soil carbon dioxide emissions from a rubber plantation on tropical peat |
| 32 | Watanabe et al., 2009 | Journal | Methane and CO2 fluxes from an Indonesian peatland used for sago palm (Metroxylon sagu Rottb.) cultivation: Effects of fertilizer and groundwater level management |
| No. | Authors | Site Name | Land Use | Land Cover | Province | Latitude | Longitude | Total CO2 | Heterotrophic | WTD | Temp. | Rainfall | BD | ||||
|---|---|---|---|---|---|---|---|---|---|---|---|---|---|---|---|---|---|
| Mean | SD | Mean | SD | ||||||||||||||
| 1 | Ali et al., (2006) | Site 01 | Agriculture land | C/S | Mixed dry agriculture | Jambi | −1.2 | 103.7 | 77.45 | 18.64 | 60.41 | 14.54 | 77.5 | 28 | 2490 | 0.4 | |
| 2 | Ali et al., (2006) | Site 02 | Logged forest | F | Secondary swamp forest | Jambi | −1.2 | 103.7 | 35.95 | 3.05 | 28.04 | 2.38 | 25.3 | 26.8 | 2490 | 0.28 | |
| 3 | Ali et al., (2006) | Site 03 | Recently burned | D/B | Secondary swamp forest | Jambi | −1.2 | 103.7 | 61.63 | 16.11 | 48.07 | 12.57 | 46.3 | 27.8 | 2490 | 0.32 | |
| 4 | Astiani et al., (2018) | Site 01 | Drained and cleared swamp forest | D/B | Wet shrub | West Kalimantan | −0.22 | 109.43 | 63.7 | 10.2 | 49.69 | 7.96 | 30 | 26.5 | 3171 | 0.15 | |
| 5 | Astiani et al., (2018) | Site 02 | Drained and cleared swamp forest | D/B | Wet shrub | West Kalimantan | −0.22 | 109.43 | 80.1 | 11.8 | 62.48 | 9.2 | 40 | 26.5 | 3171 | 0.15 | |
| 6 | Astiani et al., (2018) | Site 03 | Drained and cleared swamp forest | D/B | Wet shrub | West Kalimantan | −0.22 | 109.43 | 98.5 | 11.9 | 76.83 | 9.28 | 50 | 26.5 | 3171 | 0.15 | |
| 7 | Astiani et al., (2018) | Site 04 | Drained and cleared swamp forest | D/B | Wet shrub | West Kalimantan | −0.22 | 109.43 | 123.7 | 12.5 | 96.49 | 9.75 | 60 | 26.5 | 3171 | 0.15 | |
| 8 | Batubara et al., (2019) | Site 01 | Oil palm plantation | P | Estate crop | North Sumatra | 2 | 100.27 | 39.3 | 18.67 | 30.65 | 14.56 | 42 | 26 | 3467 | 0.15 | |
| 9 | Batubara et al., (2019) | Site 02 | Oil palm plantation | P | Estate crop | North Sumatra | 2 | 100.27 | 55.5 | 22.06 | 43.29 | 17.21 | 42 | 26 | 3467 | 0.15 | |
| 10 | Comeau et al., (2016) | Site 01 | Oil palm plantation | P | Estate crop | Jambi | −1.65 | 103.87 | 139.4 | 5.66 | 108.73 | 4.41 | 76 | 27.5 | 2466 | 0.23 | |
| 11 | Dariah et al., (2014) | Site 01 | Oil palm plantation | P | Estate crop | Jambi | −1.63 | 103.78 | 44.7 | 11.12 | 38.2 | 9.47 | a | 52 | 26.2 | 2500 | 0.16 |
| 12 | Dariah et al., (2014) | Site 02 | Oil palm plantation | P | Estate crop | Jambi | −1.63 | 103.78 | 47.8 | 21.36 | 34.1 | 15.84 | a | 119 | 26.2 | 2500 | 0.19 |
| 13 | Furukawa et al., (2005) | Site 01 | Cassava field | C/S | Pure dry agriculture | Jambi | −1.1 | 103.71 | 64.3 | 32.04 | 50.15 | 24.99 | 23.5 | 26.7 | 2582 | na | |
| 14 | Furukawa et al., (2005) | Site 02 | Coconut field | P | Estate crop | Jambi | −1.1 | 103.71 | 133.7 | 36.55 | 104.29 | 28.51 | 43 | 26.7 | 2582 | na | |
| 15 | Furukawa et al., (2005) | Site 03 | Coconut field | P | Estate crop | Jambi | −1.1 | 103.71 | 125.1 | 31.99 | 97.58 | 24.95 | 43 | 26.7 | 2582 | na | |
| 16 | Furukawa et al., (2005) | Site 04 | Drained forest | D/B | Secondary swamp forest | Jambi | −1.1 | 103.71 | 85.54 | 37.38 | 66.72 | 29.16 | 18.1 | 26.7 | 2582 | na | |
| 17 | Furukawa et al., (2005) | Site 05 | Lowland paddy field | C/S | Paddy field | Jambi | −1.1 | 103.71 | 11.05 | 11.47 | 8.62 | 8.95 | 5.2 | 26.7 | 2582 | na | |
| 18 | Furukawa et al., (2005) | Site 06 | Pineapple field | C/S | Pure dry agriculture | Jambi | −1.1 | 103.71 | 84.38 | 10.51 | 65.82 | 8.2 | 19 | 26.7 | 2582 | na | |
| 19 | Furukawa et al., (2005) | Site 07 | Pineapple field | C/S | Pure dry agriculture | Jambi | −1.1 | 103.71 | 84.03 | 18.03 | 65.54 | 14.06 | 35 | 26.7 | 2582 | na | |
| 20 | Furukawa et al., (2005) | Site 08 | Pineapple field | C/S | Pure dry agriculture | Jambi | −1.1 | 103.71 | 58.2 | 22.36 | 45.4 | 17.44 | 50 | 26.7 | 2582 | na | |
| 21 | Furukawa et al., (2005) | Site 09 | Swampy forest | F | Secondary swamp forest | Jambi | −1.1 | 103.71 | 33.31 | 8.63 | 25.98 | 6.73 | −5 | 26.7 | 2582 | na | |
| 22 | Furukawa et al., (2005) | Site 10 | Swampy forest | F | Secondary swamp forest | Jambi | −1.1 | 103.71 | 24.41 | 2.37 | 19.04 | 1.85 | −3 | 26.7 | 2582 | na | |
| 23 | Furukawa et al., (2005) | Site 11 | Swampy forest | F | Secondary swamp forest | Jambi | −1.1 | 103.71 | 33.02 | 16.3 | 25.76 | 12.71 | −2 | 26.7 | 2582 | na | |
| 24 | Furukawa et al., (2005) | Site 12 | Upland paddy field | C/S | Paddy field | Jambi | −1.1 | 103.71 | 73.2 | 34.71 | 57.1 | 27.07 | 13 | 26.7 | 2582 | na | |
| 25 | Hadi et al., (2005) | Site 01 | Abandoned paddy-crop field | F | Secondary swamp forest | South Kalimantan | −2.37 | 115.37 | 87.63 | 29.12 | 68.35 | 22.71 | na | 26.5 | 2756 | na | |
| 26 | Hadi et al., (2005) | Site 02 | Paddy field | C/S | Paddy field | South Kalimantan | −2.37 | 115.37 | 57.76 | 30.16 | 45.05 | 23.52 | na | 26.5 | 2756 | na | |
| 27 | Hadi et al., (2005) | Site 03 | Secondary forest | F | Secondary swamp forest | South Kalimantan | −2.37 | 115.37 | 46.05 | 25.1 | 35.92 | 19.58 | na | 26.5 | 2756 | na | |
| 28 | Handayani et al., (2009) | Site 01 | Oil palm plantation | P | Estate crop | Aceh | 4.1 | 96.21 | 22.99 | 4.94 | 17.75 | 6.4 | a | 62 | 36.2 | 2789 | na |
| 29 | Handayani et al., (2009) | Site 02 | Oil palm plantation | P | Estate crop | Aceh | 4.1 | 96.21 | 19.39 | 9.91 | 8.89 | 5.25 | a | 75 | 36.2 | 2789 | na |
| 30 | Handayani et al., (2009) | Site 03 | Oil palm plantation | P | Estate crop | Aceh | 4.1 | 96.21 | 46.57 | 23.3 | 24.1 | 26.79 | a | 48.4 | 36.2 | 2789 | na |
| 31 | Handayani et al., (2009) | Site 04 | Oil palm plantation | P | Estate crop | Aceh | 4.1 | 96.21 | 27.22 | 8.07 | 20.05 | 6.24 | a | 53.6 | 36.2 | 2789 | na |
| 32 | Handayani et al., (2009) | Site 05 | Oil palm plantation | P | Estate crop | Aceh | 4.1 | 96.21 | 38.19 | 25.16 | 28.55 | 16.97 | a | 57.8 | 36.2 | 2789 | na |
| 33 | Handayani et al., (2009) | Site 06 | Oil palm plantation | P | Estate crop | Aceh | 4.1 | 96.21 | 22.58 | 7.33 | 20.97 | 7.72 | a | 46.7 | 36.2 | 2789 | na |
| 34 | Handayani et al., (2009) | Site 07 | Oil palm plantation | P | Estate crop | Aceh | 4.1 | 96.21 | 35.59 | 25.41 | 10.04 | 7.98 | a | 42.7 | 36.2 | 2789 | na |
| 35 | Hergoualc’h et al., (2017) | Site 01 | Oil palm plantation | P | Estate crop | Central Kalimantan | −2.78 | 111.8 | 50.65 | 12.92 | 30.8 | 18.64 | a | 38 | 29.7 | 2058 | 0.31 |
| 36 | Hergoualc’h et al., (2017) | Site 02 | Oil palm plantation | P | Estate crop | Central Kalimantan | −2.78 | 111.8 | 42.94 | 30.2 | 35.23 | 10.18 | a | 26 | 36.8 | 2058 | 0.33 |
| 37 | Hergoualc’h et al., (2017) | Site 03 | Primary peat forest | F | Primary swamp forest | Central Kalimantan | −2.78 | 111.8 | 47.34 | 21.02 | 26.06 | 5.09 | a | 15 | 29.6 | 2058 | 0.17 |
| 38 | Hirano et al., (2007) | Site 01 | Secondary forest | F | Secondary swamp forest | Central Kalimantan | −2.33 | 114.04 | 141.77 | 1.33 | 110.58 | 1.04 | 85 | 26.3 | 2235 | na | |
| 39 | Hirano et al., (2009) | Site 01 | Crop-free agric land | C/S | Pure dry agriculture | Central Kalimantan | −2.27 | 113.98 | 17.2 | 1.6 | 13.42 | 1.25 | 38 | 26.3 | 2331 | na | |
| 40 | Hirano et al., (2009) | Site 02 | Drained regenerating forest | D/B | Secondary swamp forest | Central Kalimantan | −2.27 | 113.98 | 37.2 | 3.8 | 29.02 | 2.96 | 117.5 | 26.3 | 2560 | na | |
| 41 | Hirano et al., (2009) | Site 03 | Drained regenerating forest | D/B | Secondary swamp forest | Central Kalimantan | −2.27 | 113.98 | 30.2 | 3.6 | 23.56 | 2.81 | 117.5 | 26.3 | 2331 | na | |
| 42 | Hirano et al., (2009) | Site 04 | Secondary forest | F | Secondary swamp forest | Central Kalimantan | −2.27 | 113.98 | 35.7 | 5.8 | 27.85 | 4.52 | 40 | 26.3 | 1852 | na | |
| 43 | Hirano et al., (2009) | Site 05 | Secondary forest | F | Secondary swamp forest | Central Kalimantan | −2.27 | 113.98 | 37.1 | 5.2 | 28.94 | 4.06 | 40 | 26.3 | 2292 | na | |
| 44 | Hirano et al., (2009) | Site 06 | Secondary forest | F | Secondary swamp forest | Central Kalimantan | −2.27 | 113.98 | 38 | 4.9 | 29.64 | 3.82 | 40 | 26.3 | 2560 | na | |
| 45 | Hirano et al., (2014) | Site 01 | Burned forest | D/B | Secondary swamp forest | Central Kalimantan | −2.33 | 114.03 | 14 | 2.99 | 10.92 | 2.33 | 18 | 26.2 | 2540 | na | |
| 46 | Hirano et al., (2014) | Site 02 | Burned forest | D/B | Secondary swamp forest | Central Kalimantan | −2.33 | 114.03 | 13.3 | 2.69 | 10.37 | 2.1 | 9 | 26.2 | 2540 | na | |
| 47 | Hooijer et al., (2012) | Site 01 | Acacia plantation | P | Plantation forest | Riau | 0.58 | 102.33 | 103.75 | 50.3 | 80.93 | 39.23 | 70 | 30 | 2500 | 0.09 | |
| 48 | Hooijer et al., (2012) | Site 02 | Oil palm plantation | P | Estate crop | Jambi | 0.58 | 102.33 | 100 | 17.9 | 78 | 13.96 | 73 | 30 | 2500 | 0.09 | |
| 49 | Hooijer et al., (2014) | Site 01 | Burnt and drained peatland | D/B | Secondary swamp forest | Central Kalimantan | −2.25 | 114.58 | 22.75 | 8.82 | 17.75 | 6.88 | 34.5 | 25.9 | 2842 | 0.09 | |
| 50 | Husnain et al., (2014) | Site 01 | Acacia plantation | P | Plantation forest | Riau | 0.32 | 101.68 | na | na | 59 | 19.02 | a | 81 | 31.9 | 2492 | 0.12 |
| 51 | Husnain et al., (2014) | Site 02 | Bare ground | D/B | Bare ground | Riau | 0.32 | 101.68 | na | na | 67 | 23.97 | a | 67 | 31.9 | 2492 | 0.12 |
| 52 | Husnain et al., (2014) | Site 03 | Bare ground | D/B | Bare ground | Riau | 0.32 | 101.68 | na | na | 56 | 30.06 | a | 74 | 31.9 | 2492 | 0.12 |
| 53 | Husnain et al., (2014) | Site 04 | Bare ground | D/B | Bare ground | Riau | 0.32 | 101.68 | na | na | 66 | 26.95 | a | 69 | 31.9 | 2492 | 0.12 |
| 54 | Husnain et al., (2014) | Site 05 | Oil palm plantation | P | Estate crop | Riau | 0.32 | 101.68 | na | na | 66 | 25.03 | a | 72 | 31.9 | 2492 | 0.15 |
| 55 | Husnain et al., (2014) | Site 07 | Rubber plantation | P | Estate crop | Riau | 0.32 | 101.68 | na | na | 52 | 16.97 | a | 67 | 31.9 | 2492 | 0.12 |
| 56 | Husnain et al., (2014) | Site 08 | Secondary forest | F | Secondary swamp forest | Riau | 0.32 | 101.68 | 61 | 25.03 | 47.58 | 19.52 | 81 | 31.9 | 2492 | 0.12 | |
| 57 | Inubushi et al., (2003) | Site 01 | Abandoned cropland | C/S | Pure dry agriculture | South Kalimantan | −3.42 | 114.67 | 36.3 | 4.04 | 28.31 | 3.15 | 15 | 26.5 | 3133 | na | |
| 58 | Inubushi et al., (2003) | Site 02 | Abandoned paddy | C/S | Paddy field | South Kalimantan | −3.42 | 114.67 | 56.5 | 10.63 | 44.07 | 8.29 | −2 | 26.5 | 3133 | na | |
| 59 | Inubushi et al., (2003) | Site 03 | Secondary forest | F | Secondary swamp forest | South Kalimantan | −3.42 | 114.67 | 44 | 15.76 | 34.32 | 12.29 | 10 | 26.5 | 3133 | na | |
| 60 | Ishikura et al., (2017) | Site 01 | Burned land | D/B | Wet shrub | Central Kalimantan | −2.28 | 114.01 | 31.8 | 22.24 | 24.8 | 17.35 | 16 | 26.3 | 2235 | 0.22 | |
| 61 | Ishikura et al., (2017) | Site 02 | Burned land | D/B | Wet shrub | Central Kalimantan | −2.28 | 114.01 | 23.1 | 10.61 | 18.02 | 8.28 | 56 | 26.3 | 2235 | 0.22 | |
| 62 | Ishikura et al., (2017) | Site 03 | Burned land | D/B | Wet shrub | Central Kalimantan | −2.28 | 114.01 | 37.3 | 45.88 | 29.09 | 35.79 | 6 | 26.3 | 2235 | 0.13 | |
| 63 | Ishikura et al., (2017) | Site 04 | Burned land | D/B | Wet shrub | Central Kalimantan | −2.28 | 114.01 | 35.7 | 28.61 | 27.85 | 22.32 | 8 | 26.3 | 2235 | 0.13 | |
| 64 | Ishikura et al., (2017) | Site 05 | Crop land | C/S | Pure dry agriculture | Central Kalimantan | −2.28 | 114.01 | 112.7 | 59.37 | 87.91 | 46.31 | 70 | 26.3 | 2235 | 0.38 | |
| 65 | Ishikura et al., (2017) | Site 06 | Crop land | C/S | Mixed dry agriculture | Central Kalimantan | −2.28 | 114.01 | 101.5 | 55.61 | 79.17 | 43.38 | 93 | 26.3 | 2235 | 0.38 | |
| 66 | Ishikura et al., (2017) | Site 07 | Crop land | C/S | Pure dry agriculture | Central Kalimantan | −2.28 | 114.01 | 106 | 56.17 | 82.68 | 43.81 | 66 | 26.3 | 2235 | 0.42 | |
| 67 | Ishikura et al., (2017) | Site 08 | Forest land | F | Secondary swamp forest | Central Kalimantan | −2.28 | 114.01 | 53.6 | 20.86 | 41.81 | 16.27 | 45 | 26.3 | 2235 | 0.13 | |
| 68 | Ishikura et al., (2017) | Site 09 | Forest land | F | Primary swamp forest | Central Kalimantan | −2.28 | 114.01 | 30.2 | 18.58 | 23.56 | 14.49 | 15 | 26.3 | 2235 | 0.12 | |
| 69 | Ishikura et al., (2017) | Site 10 | Forest land | F | Primary swamp forest | Central Kalimantan | −2.28 | 114.01 | 33.1 | 16.07 | 25.82 | 12.53 | 18 | 26.3 | 2235 | 0.12 | |
| 70 | Ishikura et al., (2017) | Site 11 | Grass land | C/S | Wet shrub | Central Kalimantan | −2.28 | 114.01 | 83.2 | 48.48 | 64.9 | 37.81 | 108 | 26.3 | 2235 | 0.33 | |
| 71 | Ishizuka et al., (2002) | Site 01 | Deforested area | D/B | Plantation forest | Jambi | −1.05 | 102.15 | 16.48 | 8.79 | 12.85 | 6.86 | na | 25.7 | 2060 | 1.19 | |
| 72 | Ishizuka et al., (2002) | Site 02 | Logged-over forest | D/B | Secondary swamp forest | Jambi | −1.05 | 102.15 | 20.97 | 5.67 | 16.36 | 4.42 | na | 25.7 | 2060 | 1.14 | |
| 73 | Ishizuka et al., (2002) | Site 03 | Logged-over forest | D/B | Secondary swamp forest | Jambi | −1.05 | 102.15 | 26.05 | 7.53 | 20.32 | 5.87 | na | 25.7 | 2060 | 1.14 | |
| 74 | Ishizuka et al., (2002) | Site 04 | Logged-over forest | D/B | Secondary swamp forest | Jambi | −1.05 | 102.15 | 37.26 | 12.52 | 29.06 | 9.77 | na | 25.7 | 2060 | 1.08 | |
| 75 | Ishizuka et al., (2002) | Site 05 | Oil palm plantation | P | Estate crop | Jambi | −1.05 | 102.15 | 18.31 | 4.17 | 14.28 | 3.25 | na | 25.7 | 2060 | 1.18 | |
| 76 | Ishizuka et al., (2002) | Site 06 | Primary forest | F | Primary swamp forest | Jambi | −1.05 | 102.15 | 20.33 | 4.95 | 15.86 | 3.86 | na | 25.7 | 2060 | 1.17 | |
| 77 | Ishizuka et al., (2002) | Site 07 | Primary forest | F | Primary swamp forest | Jambi | −1.05 | 102.15 | 30.1 | 8.64 | 23.48 | 6.74 | na | 25.7 | 2060 | 1.17 | |
| 78 | Ishizuka et al., (2002) | Site 08 | Rubber plantation | P | Estate crop | Jambi | −1.05 | 102.15 | 23.96 | 8.52 | 18.69 | 6.65 | na | 25.7 | 2060 | 1.12 | |
| 79 | Itoh et al., (2017) | Site 01 | Drained and burnt forest | D/B | Secondary swamp forest | Central Kalimantan | −2.34 | 114.04 | 25.57 | 2.42 | 19.94 | 1.89 | 42 | 26.2 | 2546 | 0.24 | |
| 80 | Itoh et al., (2017) | Site 02 | Drained forest | F | Secondary swamp forest | Central Kalimantan | −2.35 | 114.04 | 29.32 | 1.35 | 22.87 | 1.05 | 57 | 26.2 | 2546 | 0.14 | |
| 81 | Itoh et al., (2017) | Site 03 | Undrained forest | F | Primary swamp forest | Central Kalimantan | −2.32 | 113.9 | 26.44 | 3.65 | 20.62 | 2.85 | 31 | 26.2 | 2546 | 0.11 | |
| 82 | Jamaludin et al. (2020) | Site 01 | Ginger | P | Mixed dry agriculture | West Kalimantan | −0.37 | 109.52 | 34.41 | 17.92 | 30.87 | 9.38 | a | 21.8 | 31.6 | na | 0.14 |
| 83 | Jamaludin et al. (2020) | Site 02 | Oil palm plantation | P | Estate crop | West Kalimantan | −0.37 | 109.52 | 35.93 | 14.17 | 23.56 | 8.15 | a | 36.4 | 30.6 | na | 0.21 |
| 84 | Jamaludin et al., (2020) | Site 03 | Rubber plantation | P | Estate crop | West Kalimantan | −0.37 | 109.52 | 42.63 | 12.57 | 33.67 | 11.85 | a | 36.4 | 30.3 | na | 0.17 |
| 85 | Jauhiainen et al., (2005) | Site 03 | Undrained peat swamp forest | F | Primary swamp forest | Central Kalimantan | −2.33 | 113.92 | 34.93 | 3.2 | 27.25 | 2.5 | 35 | 25.5 | 2528 | 0.15 | |
| 86 | Jauhiainen et al., (2008) | Site 01 | Deforested, drained, and burned peat forest | D/B | Wet shrub | Central Kalimantan | −2.33 | 114.03 | 27.81 | 8.16 | 21.69 | 6.36 | 40 | 33.5 | 2331 | na | |
| 87 | Jauhiainen et al., (2008) | Site 02 | Deforested, drained, and burned peat forest | D/B | Wet shrub | Central Kalimantan | −2.33 | 114.03 | 26.08 | 7.71 | 20.34 | 6.01 | 52 | 33.5 | 2560 | na | |
| 88 | Jauhiainen et al., (2008) | Site 03 | Drained and selectively logged peat swamp | D/B | Secondary swamp forest | Central Kalimantan | −2.33 | 114.03 | 73.05 | 39.94 | 56.98 | 31.15 | 47 | 29.3 | 2331 | na | |
| 89 | Jauhiainen et al., (2008) | Site 04 | Drained and selectively logged peat swamp | D/B | Secondary swamp forest | Central Kalimantan | −2.33 | 114.03 | 74.4 | 42.85 | 58.03 | 33.42 | 43 | 29.3 | 2560 | na | |
| 90 | Jauhiainen et al., (2012) | Site 01 | Acacia plantation | P | Plantation forest | Riau | 0.43 | 101.88 | 154 | 56.79 | 98.81 | 25.62 | a | 94 | 26.2 | 2500 | 0.11 |
| 91 | Jauhiainen et al., (2012) | Site 02 | Acacia plantation | P | Plantation forest | Riau | 0.43 | 101.88 | 108.8 | 37.3 | 90.05 | 31.88 | a | 73 | 26.2 | 2500 | 0.12 |
| 92 | Jauhiainen et al., (2012) | Site 03 | Acacia plantation | P | Plantation forest | Riau | 0.43 | 101.88 | 113.88 | 52.15 | 103.81 | 44.4 | a | 108 | 26.2 | 2500 | 0.08 |
| 93 | Jauhiainen et al., (2012) | Site 04 | Acacia plantation | P | Plantation forest | Riau | 0.43 | 101.88 | 61.76 | 27.97 | 79.1 | 22.16 | a | 78 | 26.2 | 2500 | 0.08 |
| 94 | Jauhiainen et al., (2012) | Site 05 | Acacia plantation | P | Plantation forest | Riau | 0.43 | 101.88 | 66.14 | 66.13 | 69.99 | 34.36 | a | 70 | 26.2 | 2500 | 0.07 |
| 95 | Jauhiainen et al., (2012) | Site 06 | Acacia plantation | P | Plantation forest | Riau | 0.43 | 101.88 | 119.66 | 42.07 | 96.62 | 36.48 | a | 84 | 26.2 | 2500 | 0.06 |
| 96 | Jauhiainen et al., (2012) | Site 07 | Acacia plantation | P | Plantation forest | Riau | 0.43 | 101.88 | 77.7 | 23.72 | 73.93 | 24.81 | a | 36 | 26.2 | 2500 | 0.06 |
| 97 | Jauhiainen et al., (2012) | Site 08 | Acacia plantation | P | Plantation forest | Riau | 0.43 | 101.88 | 117.82 | 34.84 | 138.76 | 43.46 | a | 86 | 26.2 | 2500 | 0.06 |
| 98 | Khasanah & Noordwijk (2018) | Site 01 | Logged-over forest | D/B | Secondary swamp forest | Jambi | −1.53 | 102.37 | 32.63 | 19.83 | 25.45 | 15.47 | 37 | 30 | 2349 | 0.12 | |
| 99 | Khasanah & Noordwijk (2018) | Site 02 | Mixed betel nut, coconut and coffee | P | Mixed dry agriculture | Jambi | −1.53 | 102.37 | 78 | 9.9 | 60.84 | 7.72 | 58.5 | 30 | 2349 | 0.17 | |
| 100 | Khasanah & Noordwijk (2018) | Site 03 | Oil palm plantation | P | Estate crop | Jambi | −1.53 | 102.37 | 96.13 | 29.65 | 74.98 | 23.13 | 40 | 30 | 2349 | 0.14 | |
| 101 | Khasanah & Noordwijk (2018) | Site 04 | Rubber plantation | P | Estate crop | Jambi | −1.53 | 102.37 | 75.17 | 3.55 | 58.63 | 2.77 | 46 | 30 | 2349 | 0.19 | |
| 102 | Marwanto & Agus (2014) | Site 01 | Oil palm plantation | P | Estate crop | Jambi | −1.72 | 103.88 | 46.1 | 30.02 | 35.96 | 23.42 | 91 | 26.7 | 2349 | 0.21 | |
| 103 | Marwanto et al., (2019) | Site 01 | Oil palm plantation | P | Estate crop | Riau | 0.73 | 101.72 | 44.66 | 25.63 | 34.83 | 19.99 | 36 | 26.3 | 1830 | 0.25 | |
| 104 | Saragi-Sasmito et al., (2019) | Site 01 | Secondary forest | F | Secondary swamp forest | Central Kalimantan | −2.92 | 114.42 | 52.11 | 4.04 | 40.74 | 3.3 | a | 110 | 27 | 1600 | 0.01 |
| 105 | Sundari et al., (2012) | Site 01 | Drained forest | D/B | Secondary swamp forest | Central Kalimantan | −2.53 | 114.5 | 44.92 | 14.08 | 35.04 | 10.98 | 51 | 26.2 | 2005 | na | |
| 106 | Sundari et al., (2012) | Site 03 | Undrained forest | F | Primary swamp forest | Central Kalimantan | −2.53 | 114.5 | 49.39 | 13.52 | 38.52 | 10.55 | 9 | 26.2 | 2005 | na | |
| 107 | Swails et al., (2019) | Site 01 | Oil palm plantation | P | Estate crop | Central Kalimantan | −2.78 | 111.8 | 55.9 | 13.58 | 43.6 | 10.59 | 50 | 27.4 | 2058 | 0.34 | |
| 108 | Swails et al., (2019) | Site 02 | Oil palm plantation | P | Estate crop | Central Kalimantan | −2.78 | 111.8 | 79.5 | 15.7 | 62.01 | 12.25 | 50 | 27.4 | 2058 | 0.34 | |
| 109 | Swails et al., (2019) | Site 03 | Oil palm plantation | P | Estate crop | Central Kalimantan | −2.78 | 111.8 | 49.1 | 19.94 | 38.3 | 15.55 | 50 | 27.4 | 2058 | 0.34 | |
| 110 | Swails et al., (2019) | Site 04 | Primary forest | F | Primary swamp forest | Central Kalimantan | −2.78 | 111.8 | 42 | 6.36 | 32.76 | 4.96 | 23 | 27.4 | 2058 | 0.2 | |
| 111 | Swails et al., (2019) | Site 05 | Primary forest | F | Primary swamp forest | Central Kalimantan | −2.78 | 111.8 | 39.4 | 11.88 | 30.73 | 9.27 | 23 | 27.4 | 2058 | 0.2 | |
| 112 | Swails et al., (2019) | Site 06 | Secondary forest | F | Secondary swamp forest | Central Kalimantan | −2.78 | 111.8 | 54.3 | 16.12 | 42.35 | 12.57 | 23 | 27.4 | 2058 | 0.2 | |
| 113 | Toma et al., (2011) | Site 01 | Crop- and grassland | C/S | Mixed dry agriculture | Central Kalimantan | −2.28 | 114.02 | 108.41 | 35.22 | 84.56 | 27.47 | 75 | 25.9 | 2734 | 0.4 | |
| 114 | Wakhid et al., (2017) | Site 01 | Rubber plantation | P | Estate crop | Central Kalimantan | −2.48 | 114.19 | 120.74 | 38.11 | 51.63 | 7.85 | a | 69 | 26.9 | 2506 | 0.23 |
| 115 | Watanabe et al., (2009) | Site 01 | Sago plantation | P | Estate crop | Riau | 0.85 | 102.77 | 13.81 | 6.76 | 10.77 | 5.27 | 82 | 27.6 | 1700 | na | |
| 116 | Watanabe et al., (2009) | Site 02 | Sago plantation | P | Estate crop | Riau | 0.85 | 102.77 | 13.81 | 8.03 | 10.77 | 6.26 | 82 | 27.6 | 1700 | na | |
| 117 | Watanabe et al., (2009) | Site 03 | Sago plantation | P | Estate crop | Riau | 0.85 | 102.77 | 15.74 | 8.03 | 12.28 | 6.26 | 82 | 27.6 | 1700 | na | |
| 118 | Watanabe et al., (2009) | Site 04 | Sago plantation | P | Estate crop | Riau | 0.85 | 102.77 | 17.02 | 5.46 | 13.28 | 4.26 | 82 | 27.6 | 1700 | na | |
| Predictor Variable | Land Use | n | Mean | SD | Min. | Max. |
|---|---|---|---|---|---|---|
| Water table depth (W) | CS | 15 | 45.75 | 34.14 | −2 | 108 |
| DB | 25 | 45.96 | 28.72 | 6 | 117.5 | |
| F | 22 | 32.51 | 29.37 | −5 | 110 | |
| P | 45 | 61.61 | 21.97 | 21.8 | 119 | |
| Bulk density (B) | CS | 6 | 0.39 | 0.03 | 0.33 | 0.42 |
| DB | 19 | 0.37 | 0.41 | 0.09 | 1.19 | |
| F | 15 | 0.29 | 0.36 | 0.01 | 1.17 | |
| P | 34 | 0.23 | 0.25 | 0.06 | 1.18 |
| Variable | Land Cover | n | Mean | SD | Min. | Max. |
|---|---|---|---|---|---|---|
| Water table depth (W. cm) | Bare ground (BG) | 3 | 70 | 3.61 | 67 | 74 |
| Estate crop (EC) | 33 | 57.94 | 20.42 | 26 | 119 | |
| Mixed dry agriculture (MDA) | 5 | 65.16 | 27.15 | 21.8 | 93 | |
| Paddy field (PDF) | 3 | 5.4 | 7.5 | −2 | 13 | |
| Plantation forest (PF) | 10 | 78 | 18.8 | 36 | 108 | |
| Primary swamp forest (PSF) | 8 | 21.13 | 8.69 | 9 | 35 | |
| Pure dry agriculture (PDA) | 8 | 39.56 | 20.85 | 15 | 70 | |
| Secondary swamp forest (SSF) | 26 | 43.35 | 34.57 | −5 | 117.5 | |
| Wet shrub (WS) | 11 | 42.36 | 28.84 | 6 | 108 | |
| Bulk density (B. g cm−3) | Bare ground (BG) | 3 | 0.12 | 0 | 0.12 | 0.12 |
| Estate crop (EC) | 22 | 0.3 | 0.29 | 0.09 | 1.18 | |
| Mixed dry agriculture (MDA) | 5 | 0.3 | 0.13 | 0.14 | 0.4 | |
| Plantation forest (PF) | 11 | 0.19 | 0.33 | 0.06 | 1.19 | |
| Primary swamp forest (PSF) | 9 | 0.38 | 0.45 | 0.11 | 1.17 | |
| Pure dry agriculture (PDA) | 2 | 0.4 | 0.03 | 0.38 | 0.42 | |
| Secondary swamp forest (SSF) | 13 | 0.39 | 0.43 | 0.01 | 1.14 | |
| Wet shrub (WS) | 9 | 0.18 | 0.07 | 0.13 | 0.33 |
References
- Murdiyarso, D.; Lilleskov, E.; Kolka, R. Tropical peatlands under siege: The need for evidence-based policies and strategies. Mitig. Adapt. Strateg. Glob. Chang. 2019, 24, 493–505. [Google Scholar] [CrossRef] [Green Version]
- Roucoux, K.H.; Lawson, I.; Baker, T.; Del Castillo Torres, F.C.; Drapper, O.; Lähteenoja, M.P.; Gilmore, E.N.; Honorio Coronado, T.J.; Kelly, E.T.A.; Mitchard, C.F.; et al. Threats to intact tropical peatlands and opportunities for their conservation. Conserv. Biol. 2017, 31, 1283–1292. [Google Scholar] [CrossRef] [PubMed] [Green Version]
- Bossio, D.A.; Cook-Patton, S.C.; Ellis, P.W.; Fargione, J.; Sanderman, J.; Smth, P.; Wood, P.; Zomer, R.J.; von Unger, M.; Emmer, I.M.; et al. The role of soil carbon in natural climate solutions. Nat. Sustain. 2020, 3, 391–398. [Google Scholar] [CrossRef]
- Griscom, B.W.; Busch, J.; Cook-Patton, S.C.; Ellis, P.W.; Funk, J.; Leavitt, S.M.; Lomax, G.; Turner, W.R.; Chapman, M.; Engelmsnn, J.; et al. National mitigation potential from natural climate solution in the tropics. Philos. Trans. R. Soc. 2020, 375, 1–11. [Google Scholar] [CrossRef] [Green Version]
- Tacconi, L.; Muttaqin, M.Z. Policy forum: Institutional architecture and activities to reduce emissions from forests in Indonesia. For. Policy Econ. 2019, 108, 101980. [Google Scholar] [CrossRef]
- Loisel, J.; Gallego-Sala, A.V.; Amesbury, M.J.; Magnan, G.; Anshari, G.; Beilman, D.W.; Benavides, J.C.; Blewett, J.; Camill, P.; Charman, D.J.; et al. Expert assessment of future vulnerability of the global peatland carbon sink. Nat. Clim. Chang. 2021, 11, 70–77. [Google Scholar] [CrossRef]
- Ojanen, P.; Mikkinen, K. Rewetting Offers Rapid Climate Benefits for Tropical and Agricultural Peatlands but Not for Forestry Drained Peatlands. Glob. Biochem. Cycles 2020, 34, 1–16. [Google Scholar]
- Joosten, H.; Tapio-Biström, M.; Tol, S. Peatlands—Guidance for Climate Change Mitigation through Conservation. Rehabilitation and Sustainable Use, 2nd ed.; Food and Agriculture Organization of the United Nations and Wetlands International: Rome, Italy, 2012; pp. 1–97. [Google Scholar]
- Yu, Z.; Loisel, J.; Brosseau, D.P.; Beilman, D.W.; Hunt, S.J. Global peatland dynamics since the Last Glacial Maximum. Geophys. Res. Lett. 2010, 37, 1–5. [Google Scholar] [CrossRef]
- Page, S.; Rieley, J.; Banks, C. Global and regional importance of the tropical peatland carbon pool. Glob. Chang. Biol. 2011, 17, 798–818. [Google Scholar] [CrossRef] [Green Version]
- Gumbricht, T.; Roman-Cuesta, R.M.; Verchot, L.; Herold, M.; Wittmann, F.; Householder, E.; Herold, N.; Murdiyarso, D. An expert system model for mapping tropical wetlands and peatlands reveals South America as the largest contributor. Glob. Chang. Biol. 2017, 23, 3581–3599. [Google Scholar] [CrossRef] [Green Version]
- Novita, N.; Kauffman, J.B.; Hergoaulc’h, K.; Murdiyarso, D.; Tryanto, D.H.; Jupesta, J. Carbon Stocks from Peat Swamp Forest and Oil Palm Plantation in Central Kalimantan, Indonesia. In Climate Change Research. Policy and Actions in Indonesia: Science. Adaptation and Mitigation, 1st ed.; Djalante., R., Jupesta., J., Aldrian., E., Eds.; Springer Nature: Dordrecht, The Netherlands, 2020; pp. 203–228. [Google Scholar]
- Jauhiainen, J.; Limin, S.; Silvennoinen, H.; Vasander, H. Carbon dioxide and methane fluxes in drained tropical peat before and after hydrological restoration. Ecology 2008, 89, 3503–3514. [Google Scholar] [CrossRef]
- Graham, L.L.B.; Giesen, W.; Page, S.E. A common-sense approach to tropical peat swamp forest restoration in Southeast Asia. Restor. Ecol. 2016, 25, 312–321. [Google Scholar] [CrossRef]
- Hirano, T.; Jauhiainen, J.; Inoue, T.; Takahashi, H. Controls on the Carbon Balance of Tropical Peatlands. Ecosystems 2009, 12, 873–887. [Google Scholar] [CrossRef]
- MOEF. First Nationally Determined Contribution (NDC) Republic of Indonesia, 1st ed.; Ministry of Environment and Forestry: Jakarta, Indonesia, 2016; pp. 1–19. [Google Scholar]
- Page, S.; Hosciło, A.; Wösten, H.; Jauhiainen, J.; Silvius, M.; Rieley, J.; Ritzema, H.; Tansey, K.; Graham, L.; Vasander, H.; et al. Restoration ecology of lowland tropical peatlands in Southeast Asia: Current knowledge and future research directions. Ecosystems 2009, 12, 888–905. [Google Scholar] [CrossRef]
- Ritung, S.; Nugroho, K.; Mulyani, A.; Suryani, E. Technical Guidance in Land Evaluation for Agricultural Commodity (in Bahasa), 2nd ed.; Agricultural Research and Development Agency: Jakarta, Indonesia, 2011; pp. 1–168. [Google Scholar]
- Setkab 2016. Presidential Regulation No.1/2016 on Peat Restoration Agency (in Bahasa). Available online: https://setkab.go.id/inilah-perpres-no-1-tahun-2016-tentang-badan-restorasi-gambut/ (accessed on 15 March 2021).
- Putra, E.I.; Cochrane, M.A.; Vetrita, Y.; Graham, L.; Saharjo, B.S. Degraded Peatlands, Ground Water Level and Severe Peat Fire Occurrences. In Proceedings of the 15th International Peat Congress, Kuching, Malaysia, 15–19 August 2016. [Google Scholar]
- Lampela, M.; Jauhiainen, J.; Sarkkola, S.; Vasander, H. Promising native tree species for reforestation of degraded tropical peatlands. For. Ecol. Manag. 2017, 394, 52–63. [Google Scholar] [CrossRef]
- Hooijer, A.; Page, S.; Jauhiainen, J.; Lee, W.A.; Lu, X.X.; Idris, A.; Anshari, G. Subsidence and carbon loss in drained tropical peatlands. Biogeosciences 2012, 9, 1053–1071. [Google Scholar] [CrossRef] [Green Version]
- Wakhid, N.; Hirano, T.; Okimoto, Y.; Nurzakiah, S.; Nursyamsi, D. Soil carbon dioxide emissions from a rubber plantation on tropical peat. Sci. Total Environ. 2017, 581–582, 857–865. [Google Scholar] [CrossRef] [Green Version]
- Ritzema, H.; Limin, S.; Kusin, K.; Jauhiainen, J.; Wösten, H. Canal blocking strategies for hydrological restoration of degraded tropical peatlands in Central Kalimantan, Indonesia. Catena 2014, 114, 11–20. [Google Scholar] [CrossRef] [Green Version]
- Carlson, K.M.; Goodman, L.K.; May-Tobin, C.C. Modeling relationships between water table depth and peat soil carbon loss in Southeast Asian plantations. Environ. Res. Lett. 2015, 10, 1–12. [Google Scholar] [CrossRef]
- Hoyt, A.M.; Gandois, L.; Eri, J.; Kai, F.M.; Harvey, C.F.; Cobb, A.R. CO2 emissions from an undrained tropical peatland: Interacting influences of temperature. shading and water table depth. Glob. Chang. Biol. 2019, 25, 2885–2899. [Google Scholar] [CrossRef]
- Cobb, A.R.; Hoyt, A.M.; Gandois, L.; Eri, J.; Dommain, R.; Salim, K.A.; Kai, F.M.; Su’ut, N.S.H.; Harvey. C.F. How temporal patterns in rainfall determine the geomorphology and carbon fluxes of tropical peatlands. Proc. Natl. Acad. Sci. USA 2017, 114, 5187–5196. [Google Scholar]
- IPCC. Supplement to the 2006 IPCC Guidelines for National Greenhouse Gas Inventories: Wetlands, 1st ed.; Hiraishi, T., Krug, T., Tanabe, K., Srivastava, N., Baasansuren, J., Fukuda., M., Troxler., T.G., Eds.; IPCC: Geneva, Switzerland, 2014. [Google Scholar]
- BP-REDD+. National Forest Reference Emission Level for Deforestation and Forest Degradation in the Context of the Activities Referred to in Decision 1/CP.16, 1st ed.; Paragraph 70 (REDD+) Under the UNFCCC: A Reference for Decision Makers; BP-REDD+: Jakarta, Indonesia, 2015. [Google Scholar]
- Borenstein, M.; Hedges, L.V.; Higgins, J.P.; Rothstein, H.R. Introduction to Meta-Analysis, 1st ed.; John Wiley & Sons: Hoboken, NJ, USA, 2011. [Google Scholar]
- Viechtbauer, W. Conducting meta-analyses in R with the metafor package. J. Stat. Softw. 2010, 36, 1–48. [Google Scholar] [CrossRef] [Green Version]
- R Core Team. R: A Language and Environment for Statistical Computing; R Foundation for Statistical Computing: Vienna, Austria, 2020. [Google Scholar]
- Ali, M.; Taylor, D.; Inubushi, K. Effects of environmental variations on CO2 Efflux from a Tropical Peatland in eastern Sumatra. Wetlands 2006, 26, 612–618. [Google Scholar] [CrossRef]
- Astiani, D.; Burhanuddin; Gusmayanti, E.; Widiastuti, T.; Taherdjadeh, M. Enhancing water levels of degraded, bare, tropical peatland in West Kalimantan, Indonesia: Impacts on CO2 emission from soil respiration. Biodiversitas 2018, 19, 472–477. [Google Scholar] [CrossRef]
- Batubara, S.F.; Agus, F.; Rauf, A.; Elfiati, D. Impact of soil collar insertion depth on microbial respiration measurements from tropical peat under an oil palm plantation. Mires Peat 2019, 24, 1–11. [Google Scholar]
- Comeau, L.P.; Hergoualc’h, K.; Hartill, J.; Smith, J.; Verchot, L.V.; Peak, D.; Salim, A.M. How do the heterotrophic and the total soil respiration of an oil palm plantation on peat respond to nitrogen fertilizer application? Geoderma 2016, 268, 41–51. [Google Scholar] [CrossRef]
- Dariah, A.; Marwanto, S.; Agus, F. Root- and peat-based CO2 emissions from oil palm plantations. Mitig. Adapt. Strateg. Glob. Chang. 2013, 19, 831–843. [Google Scholar] [CrossRef]
- Furukawa, Y.; Inubushi, K.; Ali, M.; Itang, A.M.; Tsuruta, H. Effect of Changing Groundwater Levels Caused by Land-Use Changes on Greenhouse Gas Fluxes from Tropical Peat Lands. Nutr. Cycl. Agroecosyst. 2005, 71, 81–91. [Google Scholar] [CrossRef]
- Hadi, A.; Inubushi, K.; Furukawa, Y.; Purnomo, E.; Rasmadi, M.; Tsuruta, H. Greenhouse Gas Emissions from Tropical Peatlands of Kalimantan, Indonesia. Nutr. Cycl. Agroecosyst. 2005, 71, 73–80. [Google Scholar] [CrossRef]
- Handayani, E.P.; Idris, K.; Sabiham, S.; Djuniwati, S.; van Noordwijk, M. Carbon Dioxide (CO2) Emission of Oil Palm Plantation on Peatland: The evaluation CO2 flux on inside and outside Rhizosphere. J. Tanah Lingkung. 2009, 11, 8–13. [Google Scholar] [CrossRef] [Green Version]
- Hergoualc’h, K.; Hendry, D.T.; Murdiyarso, D.; Verchot, L.V. Total and heterotrophic soil respiration in a swamp forest and oil palm plantations on peat in Central Kalimantan, Indonesia. Biogeochemistry 2017, 135, 203–220. [Google Scholar] [CrossRef] [Green Version]
- Hirano, T.; Segah, H.; Harada, T.; Limin, S.; June, T.; Hirata, R.; Osaki, M. Carbon dioxide balance of a tropical peat swamp forest in Kalimantan, Indonesia. Glob. Chang. Biol. 2007, 13, 412–425. [Google Scholar] [CrossRef]
- Hirano, T.; Kusin, K.; Limin, S.; Osaki, M. Carbon dioxide emissions through oxidative peat decomposition on a burnt tropical peatland. Glob. Chang. Biol. 2014, 20, 555–565. [Google Scholar] [CrossRef] [PubMed]
- Hooijer, A.; Page, S.; Navratil, P.; Vernimmen, R. Carbon Emissions from Drained and Degraded Peatland in Indonesia and Emission Factors for Measurement, Reporting and Verification (MRV) of Peatland Greenhouse Gas Emissions: A Summary of KFCP Research Results for Practitioners, 1st ed.; IAFCP: Jakarta, Indonesia, 2014; pp. 1–50. [Google Scholar]
- Husnain, H.; Wigena, I.G.P.; Dariah, A.; Marwanto, S.; Setyanto, P.; Agus, F. CO2 emissions from tropical drained peat in Sumatra, Indonesia. Mitig. Adapt. Strateg. Glob. Chang. 2014, 19, 845–862. [Google Scholar] [CrossRef]
- Inubushi, K.; Furukawa, Y.; Purnomo, H.E.; Tsuruta, H. Seasonal changes of CO2. CH4 and N2O fluxes in relation to land-use change in tropical peatlands located in coastal area of South Kalimantan. Chemosphere 2003, 52, 603–608. [Google Scholar] [CrossRef]
- Ishikura, K.; Yamada, H.; Toma, Y.; Takakai, F.; Morishita, T.; Darung, U.; Limin, A.; Limin, S.H.; Hatano, R. Effect of groundwater level fluctuation on soil respiration rate of tropical peatland in Central Kalimantan, Indonesia. Soil Sci. Plant Nutr. 2017, 63, 1–13. [Google Scholar] [CrossRef] [Green Version]
- Ishizuka, S.; Tsuruta, H.; Murdiyarso, D. An intensive field study on CO2, CH4, and N2O emissions from soils at four land-use types in Sumatra, Indonesia. Glob. Biogeochem. Cycles 2002, 16, 1–11. [Google Scholar] [CrossRef]
- Itoh, M.; Okimoto, Y.; Hirano, T.; Kusin, K. Factors affecting oxidative peat decomposition due to land use in tropical peat swamp forests in Indonesia. Sci. Total Environ. 2017, 609, 906–915. [Google Scholar] [CrossRef] [Green Version]
- Jamaluddin; Gusmayanti, E.; Anshari, G.Z. Carbon Dioxide emissions from small scale agriculture in peat land (in Bahasa). J. Environ. Sci. 2020, 18, 582–588. [Google Scholar]
- Jauhiainen, Y.; Takahashi, H.; Heikkinen, J.E.P.; Martikainen, P.J.; Vasanders, H. Carbon fluxes from a tropical peat swamp forest floor. Glob. Chang. Biol. 2005, 11, 1788–1797. [Google Scholar] [CrossRef]
- Jauhiainen, J.; Hooijer, A.; Page, S.E. Carbon dioxide emissions from an Acacia plantation on peatland in Sumatra, Indonesia. Biogeosciences 2012, 9, 617–630. [Google Scholar] [CrossRef] [Green Version]
- Khasanah, N.; van Noordwijk, M. Subsidence and carbon dioxide emissions in a smallholder peatland mosaic in Sumatra, Indonesia. Mitig. Adapt. Strateg. Glob. Chang. 2019, 24, 147–163. [Google Scholar] [CrossRef] [Green Version]
- Marwanto, S.; Fahmuddin Agus, F. Is CO2 flux from oil palm plantations on peatland controlled by soil moisture and/or soil and air temperatures? Mitig. Adapt. Strateg. Glob. Chang. 2014, 19, 809–819. [Google Scholar] [CrossRef]
- Marwanto, S.; Sabiham, S.; Funakawa, S. Importance of CO2 production in subsoil layers of drained tropical peatland under mature oil palm plantation. Soil Tillage Res. 2019, 186, 206–213. [Google Scholar] [CrossRef]
- Saragi-Sasmito, M.F.; Murdiyarso, D.; June, T.; Sasmito, S.D. Carbon stocks, emissions, and aboveground productivity in restored secondary tropical peat swamp forests. Mitig. Adapt. Strateg. Glob. Chang. 2019, 24, 521–533. [Google Scholar] [CrossRef] [Green Version]
- Sundari, S.; Hirano, T.; Yamada, H.; Kusin, K.; Limin, S. Effect of groundwater on soil respiration in tropical peat swamp forests. J. Agric. Meteorol. 2012, 68, 121–134. [Google Scholar] [CrossRef] [Green Version]
- Swails, E.; Hertanti, D.; Hergoualc’h, K.; Verchot, L.; Lawrence, D. The response of soil respiration to climatic drivers in undrained forest and drained oil palm plantations in an Indonesian peatland. Biogeochemistry 2019, 142, 37–51. [Google Scholar] [CrossRef]
- Toma, Y.; Takakai, F.; Darung, U.; Kuramochi, K.; Limin, S.H.; Dohong, S.; Hatano, R. Nitrous oxide emission derived from soil organic matter decomposition from tropical agricultural peat soil in central Kalimantan, Indonesia. Soil Sci. Plant Nutr. 2011, 57, 436–451. [Google Scholar] [CrossRef] [Green Version]
- Watanabe, A.; Purwanto, B.H.; Ando, H.; Kakuda, K.; Jong, F.S. Methane and CO2 fluxes from an Indonesian peatland used for sago palm (Metroxylon sagu Rottb.) cultivation: Effects of fertilizer and groundwater level management. Agric. Ecosyst. Environ. 2009, 134, 14–18. [Google Scholar] [CrossRef]
- Prananto, J.A.; Minasny, B.; Comeau, L.; Rudiyanto; Grace, P. Drainage increases CO2 and N2O emissions from tropical peat soils. Glob. Chang. Biol. 2020, 26, 4583–4600. [Google Scholar] [CrossRef] [PubMed]
- MOEF. National Forest Reference Emission Level for Deforestation and Forest Degradation. In The Context of Decision 1/CP.16 para 70 UNFCCC (Encourages Developing Country Parties to Contribute to Mitigation Actions in the Forest Sector); Directorate General of Climate Change; The Ministry of Environment and Forestry: Jakarta, Indonesia, 2016; pp. 1–113. [Google Scholar]
- National Standardization Agency. Method for Measurement of Forest Land Cover through Remote Sensing (in Bahasa), 1st ed.; National Standardization Agency: Jakarta, Indonesia, 2014; pp. 1–14. [Google Scholar]
- Melling, L.; Hatano, R.; Goh, K.J. Soil CO2 flux from three ecosystems in tropical peatland of Sarawak, Malaysia. Tellus B Chem. Phys. Meteorol. 2005, 57, 1–11. [Google Scholar] [CrossRef]
- Hatano, R. Impact of land use change on greenhouse gases emissions in peatland: A review. Int. Agrophys. 2019, 33, 167–173. [Google Scholar] [CrossRef]
- Kardol, P.; Wardle, D.A. How understanding aboveground–belowground linkages can assist restoration ecology. Trends Ecol. Evol. 2010, 25, 670–679. [Google Scholar] [CrossRef]
- Couwenberg, J.; Dommain, R.; Joosten, H. Greenhouse gas fluxes from tropical peatlands in south-east Asia. Glob. Chang. Biol. 2010, 16, 1715–1732. [Google Scholar] [CrossRef]
- Jaenicke, J.; Wösten, H.; Budiman, A.; Siegert, F. Planning hydrological restoration of peatlands in Indonesia to mitigate carbon dioxide emissions. Mitig. Adapt. Strateg. Glob. Chang. 2010, 15, 223–239. [Google Scholar] [CrossRef] [Green Version]
- Dohong, A.; Aziz, A.A.; Dargusch, P. A review of the drivers of tropical peatland degradation in South-East Asia. Land Use Policy 2017, 69, 349–360. [Google Scholar] [CrossRef]


| Land Use | Number of Observations | Ratio of Heterotrophic to Total CO2 Emissions |
|---|---|---|
| Cropland and fallow, drained | 1 | 0.90 |
| Forestland and cleared forestland, drained | 1 | 0.78 |
| Plantations, drained, oil palm | 14 | 0.67 |
| Plantations, drained, short rotations | 8 | 0.96 |
| Total | 24 | 0.78 |
| Model | Parameter | SE | n | F | R2 (%) | AICc | ||||
|---|---|---|---|---|---|---|---|---|---|---|
| TE1 | - | β0 | 41.105 | *** | 11.394 | 60 | 12.44 | *** | 45.07 | 574.21 |
| W | β1 | 0.565 | *** | 0.131 | ||||||
| L | β2 | −13.494 | *** | 3.530 | ||||||
| B | β3 | 69.187 | * | 37.552 | ||||||
| TE2 | - | β0 | 56.738 | *** | 8.057 | 101 | 8.57 | *** | 12.32 | 988.85 |
| W | β1 | 0.245 | ** | 0.103 | ||||||
| L | β2 | −9.147 | *** | 2.828 | ||||||
| TE3 | - | β0 | 38.021 | *** | 5.859 | 101 | 6.27 | ** | 4.06 | 995.91 |
| W | β1 | 0.269 | ** | 0.108 | ||||||
| Model | Parameter | SE | F | R2 (%) | AICc | ||||
|---|---|---|---|---|---|---|---|---|---|
| HE1 | - | β0 | 46.451 | *** | 6.047 | 13.31 | *** | 16.81 | 990.85 |
| W | β1 | 0.201 | ** | 0.077 | |||||
| L | β2 | −8.587 | *** | 2.065 | |||||
| HE2 | - | β0 | 28.547 | *** | 4.568 | 8.4 | *** | 5.29 | 1003.63 |
| W | β1 | 0.24 | *** | 0.083 | |||||
| Model | Parameter | SE | n | F | R2 (%) | AICc | ||||
|---|---|---|---|---|---|---|---|---|---|---|
| TE1-LU | - | β0 | 59.139 | ** | 30.076 | 60 | 6.41 | *** | 47.71 | 580.3 |
| W | β1 | 0.478 | *** | 0.153 | ||||||
| L | β2 | −11.599 | *** | 4.19 | ||||||
| B | β3 | 37.758 | 50.016 | |||||||
| DB | β4 | −14.608 | 22.303 | |||||||
| F | β5 | −17.556 | 23.719 | |||||||
| P | β6 | −5.955 | 20.555 | |||||||
| TE2-LU | - | β0 | 67.808 | *** | 10.852 | 101 | 4.05 | *** | 14.49 | 992.71 |
| W | β1 | 0.258 | ** | 0.111 | ||||||
| L | β2 | −9.287 | *** | 2.851 | ||||||
| DB | β3 | −18.55 | 10.588 | |||||||
| F | β4 | −11.864 | 10.27 | |||||||
| P | β5 | −10.431 | 10.203 | |||||||
| TE3-LU | - | β0 | 49.95 | *** | 9.759 | 101 | 2.27 * | 5.62 | 999.88 | |
| W | β1 | 0.271 | ** | 0.117 | ||||||
| DB | β2 | −17.585 | 11.079 | |||||||
| F | β3 | −14.706 | 10.74 | |||||||
| P | β4 | −10.609 | 10.661 | |||||||
| Model | Parameter | SE | n | F | R2 (%) | AICc | ||||
|---|---|---|---|---|---|---|---|---|---|---|
| HE1-LU | - | β0 | 55.176 | *** | 8.259 | 107 | 5.93 | *** | 18.81 | 994.74 |
| W | β1 | 0.218 | *** | 0.084 | ||||||
| L | β2 | −8.758 | *** | 2.088 | ||||||
| DB | β3 | −14.210 | * | 8.060 | ||||||
| F | β4 | −9.104 | 7.852 | |||||||
| P | β5 | −8.979 | 7.758 | |||||||
| HE2-LU | - | β0 | 37.908 | *** | 7.678 | 107 | 2.71 | ** | 6.65 | 1007.84 |
| W | β1 | 0.244 | *** | 0.091 | ||||||
| DB | β2 | −12.658 | 8.660 | |||||||
| F | β3 | −11.902 | 8.450 | |||||||
| P | β4 | −8.968 | 8.331 | |||||||
Publisher’s Note: MDPI stays neutral with regard to jurisdictional claims in published maps and institutional affiliations. |
© 2021 by the authors. Licensee MDPI, Basel, Switzerland. This article is an open access article distributed under the terms and conditions of the Creative Commons Attribution (CC BY) license (https://creativecommons.org/licenses/by/4.0/).
Share and Cite
Novita, N.; Lestari, N.S.; Lugina, M.; Tiryana, T.; Basuki, I.; Jupesta, J. Geographic Setting and Groundwater Table Control Carbon Emission from Indonesian Peatland: A Meta-Analysis. Forests 2021, 12, 832. https://doi.org/10.3390/f12070832
Novita N, Lestari NS, Lugina M, Tiryana T, Basuki I, Jupesta J. Geographic Setting and Groundwater Table Control Carbon Emission from Indonesian Peatland: A Meta-Analysis. Forests. 2021; 12(7):832. https://doi.org/10.3390/f12070832
Chicago/Turabian StyleNovita, Nisa, Nurul Silva Lestari, Mega Lugina, Tatang Tiryana, Imam Basuki, and Joni Jupesta. 2021. "Geographic Setting and Groundwater Table Control Carbon Emission from Indonesian Peatland: A Meta-Analysis" Forests 12, no. 7: 832. https://doi.org/10.3390/f12070832