Article

Responses of Sap Flux Densities of Different Plant Functional Types to Environmental Variables Are Similar in Both Dry and Wet Seasons in a Subtropical Mixed Forest

1
Graduate School of Science and Technology, Shizuoka University, Shizuoka 422-8529, Japan
2
Faculty of Agriculture, Shizuoka University, Shizuoka 422-8529, Japan
3
Research Institute of Green Science and Technology, Shizuoka University, Shizuoka 422-8529, Japan
4
Department of Biological Sciences, Jaramogi Oginga Odinga University of Science and Technology, Bondo 4061-210, Kenya
*
Author to whom correspondence should be addressed.
Forests 2021, 12(8), 1007; https://doi.org/10.3390/f12081007
Submission received: 18 June 2021 / Revised: 26 July 2021 / Accepted: 27 July 2021 / Published: 29 July 2021
(This article belongs to the Section Forest Ecophysiology and Biology)

Abstract

:
Subtropical mixed forest ecosystems are experiencing dramatic changes in precipitation and different plant functional types growing here are expected to respond differently. This study aims to unravel the water use patterns of different plant functional types and their responses to environmental changes in a typical subtropical mixed forest in southern China. Diurnal and seasonal sap flux densities of evergreen broad-leaved trees (EBL), deciduous broad-leaved trees (DBL), and conifers (CON), as well as environmental variables, were recorded simultaneously from May 2016 to March 2019. The results showed that the sap flux density of EBL was significantly higher than those of CON and DBL in all seasons, irrespective of dry or wet seasons. Path analysis revealed that seasonal differences in sap flux density were mainly due to variations in photosynthetic photon flux density (PPFD). At saturating PPFD, changes in sap flux density during the day were in response to vapor pressure deficit (VPD). Regression analyses showed that sap flux density increased logarithmically with PPFD, irrespective of functional type. The hysteresis loops of sap flux density and VPD were different among different plant functional types in wet and dry seasons. Our results demonstrated converging response patterns to environmental variables among the three plant functional types considered in this study. Our findings contribute to a better understanding of the water use strategies of different plant functional types in subtropical mixed forests.

1. Introduction

Plant functional traits are core attributes linked to species physiology, growth, and distribution, in response to environmental variables [1,2]. Similar plant functional types have related resource requirements, share similar distribution patterns, and are likely to compete for resources when they grow together [3,4]. In forest communities, functional traits play a key role and are, therefore, linked to species distribution patterns, as dictated by the adaptive traits along a rainfall/temperature gradient [3]. Accordingly, soil moisture limitation becomes a major factor that often determines how functional types are distributed [5]. Normally, coniferous (CON) forests occur in the arid and cold regions of the globe, deciduous broad-leaved (DBL) forests are found in regions with large seasonal fluctuations in temperature and rainfall while the evergreen broad-leaved (EBL) forests are mainly distributed in warm and humid regions [1]. In southern China, a unique forest community of mixed forests is found, with widely varied functional groups comprising DBL, EBL, and CON types growing together [6,7]. These forests hold unique ecological values for biodiversity and ecological balance [8]. Despite their varied origin, the functional groups in subtropical mixed forests must have evolved long-term functional adjustments with regard to water use, allowing them to coexist [9].
Generally, trees from different functional groups, when growing together in a forest, are expected to enhance differentiated resource use to minimize interspecific competition [10]. In this case, such groups are likely to evolve different strategies in response to environmental constraints. Thus, different plant functional types are expected to display different water use patterns under similar or different environmental conditions [11]. On the other hand, certain plant functional types may evolve converging functional traits to allow them to cope with the prevailing environmental conditions. Such groups are likely to display similar response patterns to environmental variables. Ouyang et al. [12] reported that differentiated water use strategies promote the coexistence of tree species in a subtropical mixed forest. Large variations in water use among plant functional types and climatic conditions have been reported [13,14,15,16], and some general differences can be distinguished. For example, DBL responds to the uneven seasonal distribution of soil water resources by reducing transpiration through leaf shedding during the dry season. Komatsu et al. [17] showed that CON forests have higher transpiration than DBL forests growing in Japan under drought conditions, due to the fact that they retained most of their leaves under drought. Soh et al. [18] reported that the water use efficiency in EBL was higher than in DBL as a result of variations in their leaf traits. Subtropical forests show seasonal differences in water use, a fact that is attributed to variations in functional traits that moderate their responses to environmental variables [19,20,21,22]. However, currently available studies have not characterized water use among varying functional types growing together in the subtropical forests of China and how they exploit soil moisture resources.
Tree water use responses to different environmental variables are modulated by functional traits and are likely to vary among functional groups on a temporal scale [23]. Environmental variables change rapidly during the day and the overall water use on a long-term scale is mainly based on these short-term fluctuations [24]. Thus, the short-term changes can reveal subtle plant responses to their environment [22]. Ecophysiologists usually study plant water use at narrow temporal scales (e.g., diurnal or hourly), as plant physiological processes generally respond to environmental conditions in real-time (e.g., water use efficiency, stomatal conductance, and photosynthesis) [25,26,27,28]. A better understanding of the patterns of hourly- or diurnal-scales water use among plant functional types can be highly valuable in revealing internal variations among species as well as proportionate contributions to the overall forest water use. Unfortunately, only a few studies have focused on these short-term responses of water use of different plant functional types growing together. No previous studies have considered the water use response patterns of different functional types to environmental variables in subtropical mixed forests under the context of climate change.
Sap flux density indicates the movement of water inside the xylem and provides a relatively accurate estimate of tree water use both at short- and long-term scales [29] and, thus, is suitable for understanding tree water use patterns. Among various available technologies for tracing sap flux density in trees is the thermal dissipation probe technique (TDP), which is generally an accepted methodology [30]. In combination with tree allometries, the method is helpful in the determination of tree water use [31]. The technique is popular among tree physiologists and forest hydrologists because of its reliability and low cost [32,33,34].
The objectives of this study were to: (1) Quantify sap flux densities of tree species belonging to different functional types in a typical subtropical mixed forest in the Guilin Botanical Garden; (2) Compare sap flux densities among the three dominant functional forest types in the Guilin Botanical garden; (3) Identify the effects of environmental variables on sap flux densities of the dominant plant functional types.
The results obtained from this study are crucial for understanding the relationship between tree species, environmental variables, and water cycles in the subtropical mixed forest in southern China.

2. Materials and Methods

2.1. Study Site

This study was carried out in a typical subtropical mixed forest [35,36] of the ecological observation station belonging to Guilin Botanical Garden in southern China (25°29′ N, 110°28′ E). The forest has a typical subtropical monsoon climate. The mean annual precipitation during the last 30 years is approximately 1900 mm, 70% of which falls in the wet season, (http://www.cma.gov.cn/2011qxfw/2011qsjgx/ (accessed on 6 July 2016)), leading to distinct wet (April to September) and dry (October to March) seasons [12,37]. The forest is mainly composed of DBL, with Fagaceae and Hamamelidaceae, EBL with Theaceae, CON with Pinaceae Spreng, among others [36].
There were 5 dominant tree species within our permanent stand, including two EBL (Castanopsis fissa, Schima superba), two DBL (Castanea henryi, Liquidambar formosana), and a CON (Pinus massoniana) tree species (For detailed description, see Table 1). These 5 species accounted for 83.84% of all tree species in our study plots. Based on the terrestrial flora surveys in the plot, forest density was estimated at ca. 2200 trees per hectare. The soil substrate (at depth of 0–60 cm) was clay loam with a pH of 4.30, an organic content of 4.23%, and total nitrogen content of 0.20%. The forest was growing on a steep north-facing slope, with an inclination of 25°. A 20 m tall ecological observation tower was set up within the stand to provide an anchor station for mounting various environmental monitoring sensors (described in the following section).

2.2. Measurement of Sap Flux Density

A total of 15 trees inside the forest stand, with DBH range from 10 to 40 cm (three sample trees from each of the five dominant species) were selected for measurement of sap flux density (Table 1). Our monitoring period covered May 2016 to March 2019. Each sample tree was installed with a couple of thermal dissipation probes (TDP) measuring 20 mm in length in order to monitor xylem sap flux density. The TDP was made of an apparatus consisting of two cylindrical probes with 2 mm diameter, and measuring 20 mm in length. Each TDP contained a copper-constantan thermocouple inside the probe. The probes were installed vertically, 10–15 cm apart, into the conducting xylem, at approximately 1.3 m above the ground. The upper probe was continuously heated by a constant 0.2 W power supply from a 12 V DC of 120 mA, whereas the lower probe remained unheated. Calibration of the TDP was further completed similar to Pasqualoto et al. [38]. Readings were taken for a period of 3 days on a set-up established at the study site. To prevent direct solar heating and to minimize environmentally induced temperature variations, all TDP sensors were installed on the north side and covered with silicone caulk. One layer of foil and reflective film were also added to protect the probes from direct precipitation/moisture and insolation. The temperature difference between the heated and the reference probes was recorded every 1 min and stored as 10 min averages using a CR1000X data logger (Campbell Scientific, Logan, UT, USA), which was synchronous with environmental factors.
Sap flux density Js (cm3. H2O·m−2·s−1) was calculated according to Granier [29]
J s = 119 × ( Δ T M Δ T Δ T ) 1.231
where, Δ T M is the temperature difference obtained under zero sap flow conditions and Δ T is the instantaneous temperature. The maximum value of Δ T M was established during the rainy period when soil moisture remained stable for at least 3 days in a row.
To take care of variations arising due to radial sap flow in the sapwood depth we adopted the Pataki et al. [39] model to correct for possible errors in the angiosperm (Equation (2)) and gymnosperm (Equation (3)) trees characteristics and the radial variation in sap flux with sapwood depth. In our study, P. massoniana (CON) is gymnosperm, and the other four species with EBL and DBL are angiosperm. The sapwood depth was directly determined by the color difference of the tree ring sample between heartwood and sapwood [40]. As we could not core the sampled trees installed with sap flux sensors because of the long-term operation of the experimental set-up, the sapwood depth was estimated by the allometric equation from each tree species [12]. The allometric equation was established through the regression relation between the sapwood depth and the tree diameter at 1.3 m height (DBH). The allometric equations for the sapwood depth of five sampled tree species using the DBH were respectively established. Measured DBH and calculated sapwood depth in starting monitoring date or interval of each year during the whole experimental period are listed in Table 1.
J i J o = 1.033 × exp [ 0.5 ( x 0.09963 0.4263 ) 2 ]   ( Angiosperm )
J i J o = 1.257 × exp [ 0.5 ( x + 0.3724 0.6620 ) 2 ]     ( Gymnosperm )
where Ji is the ith sap flux density at sapwood depth, Ji/Jo is the ratio of sap flux at the actual to the outermost (2 cm in our study) sapwood depth, and x is the relative sapwood depth. We standardized the sap flux density and sapwood depth on the basis of Ji stem radius, then integrated the obtained standardized function to get the actual sap flux density Ji at depth i, and then obtained the actual mean sap flux density of the whole tree J s   ¯ by J s ¯ = i = 1 n J i / n .

2.3. Measurement of Environmental Parameters

Relative humidity (RH) and air temperature (Tair) sensors (RHT2 and AT2, Delta-T Devices Ltd. reserves, Burwell, UK) were installed at 10 m height within the study site to continuously monitor Tair and RH, respectively. A quantum sensor (Li190SB, Campbell Scientific, Inc., Logan, UT, USA) was used to measure the photosynthetic photon flux density (PPFD) above the canopy. An automatic rain gauge (HOBO, Onset, MA, USA) was used to record precipitation (located in the gap of the canopy). Three soil moisture and temperature sensors (SM150 and ST1, Delta-T Devices, Ltd., Cambridge, UK) were used to measure volumetric soil water content at 30 cm depth. Data were sampled every 1 min and 10 min averages recorded by a data logger (CR1000, Campbell Scientific, Logan, UT, USA). Atmospheric vapor pressure deficit (VPD) was then calculated using 10 min averages of Tair and RH based on Campbell and Norman [41]
VPD = a × e b × T a i r T a i r + c × ( 1 R H )
where Tair is air temperature (°C), RH is atmosphere relative humidity (%), and a, b, and c are constants being 0.611, 17.502, and 240.97, respectively.

2.4. Data and Statistical Analysis

In this study, the data collected for analysis were from 17 May 2016 to 31 March 2019. Kruskal–Wallis test was used to determine differences in dry and wet seasons among differences among functional types of EBL, DBL, and CON [42]. The comparison of environmental variables between wet and dry seasons was performed using the Mann–Whitney test [43]. Pearson’s correlation analysis was calculated to determine the significance of correlations between sap flux densities and environmental variables. In order to find out the possible direct and indirect effects of environmental variables on the sap flux density of different tree functional types, path analysis was performed between sap flux density and environmental variables [44,45]. Logarithmic regression was used to fit the relationships between sap flux density and environmental variables. Furthermore, the time-lagged relationships between sap flow and VPD in a diurnal scale were determined using cross-correlation analysis based on the cross-correlation function (CCF) [46]. Data analysis was performed using R software (R version 4.1.1).

3. Results

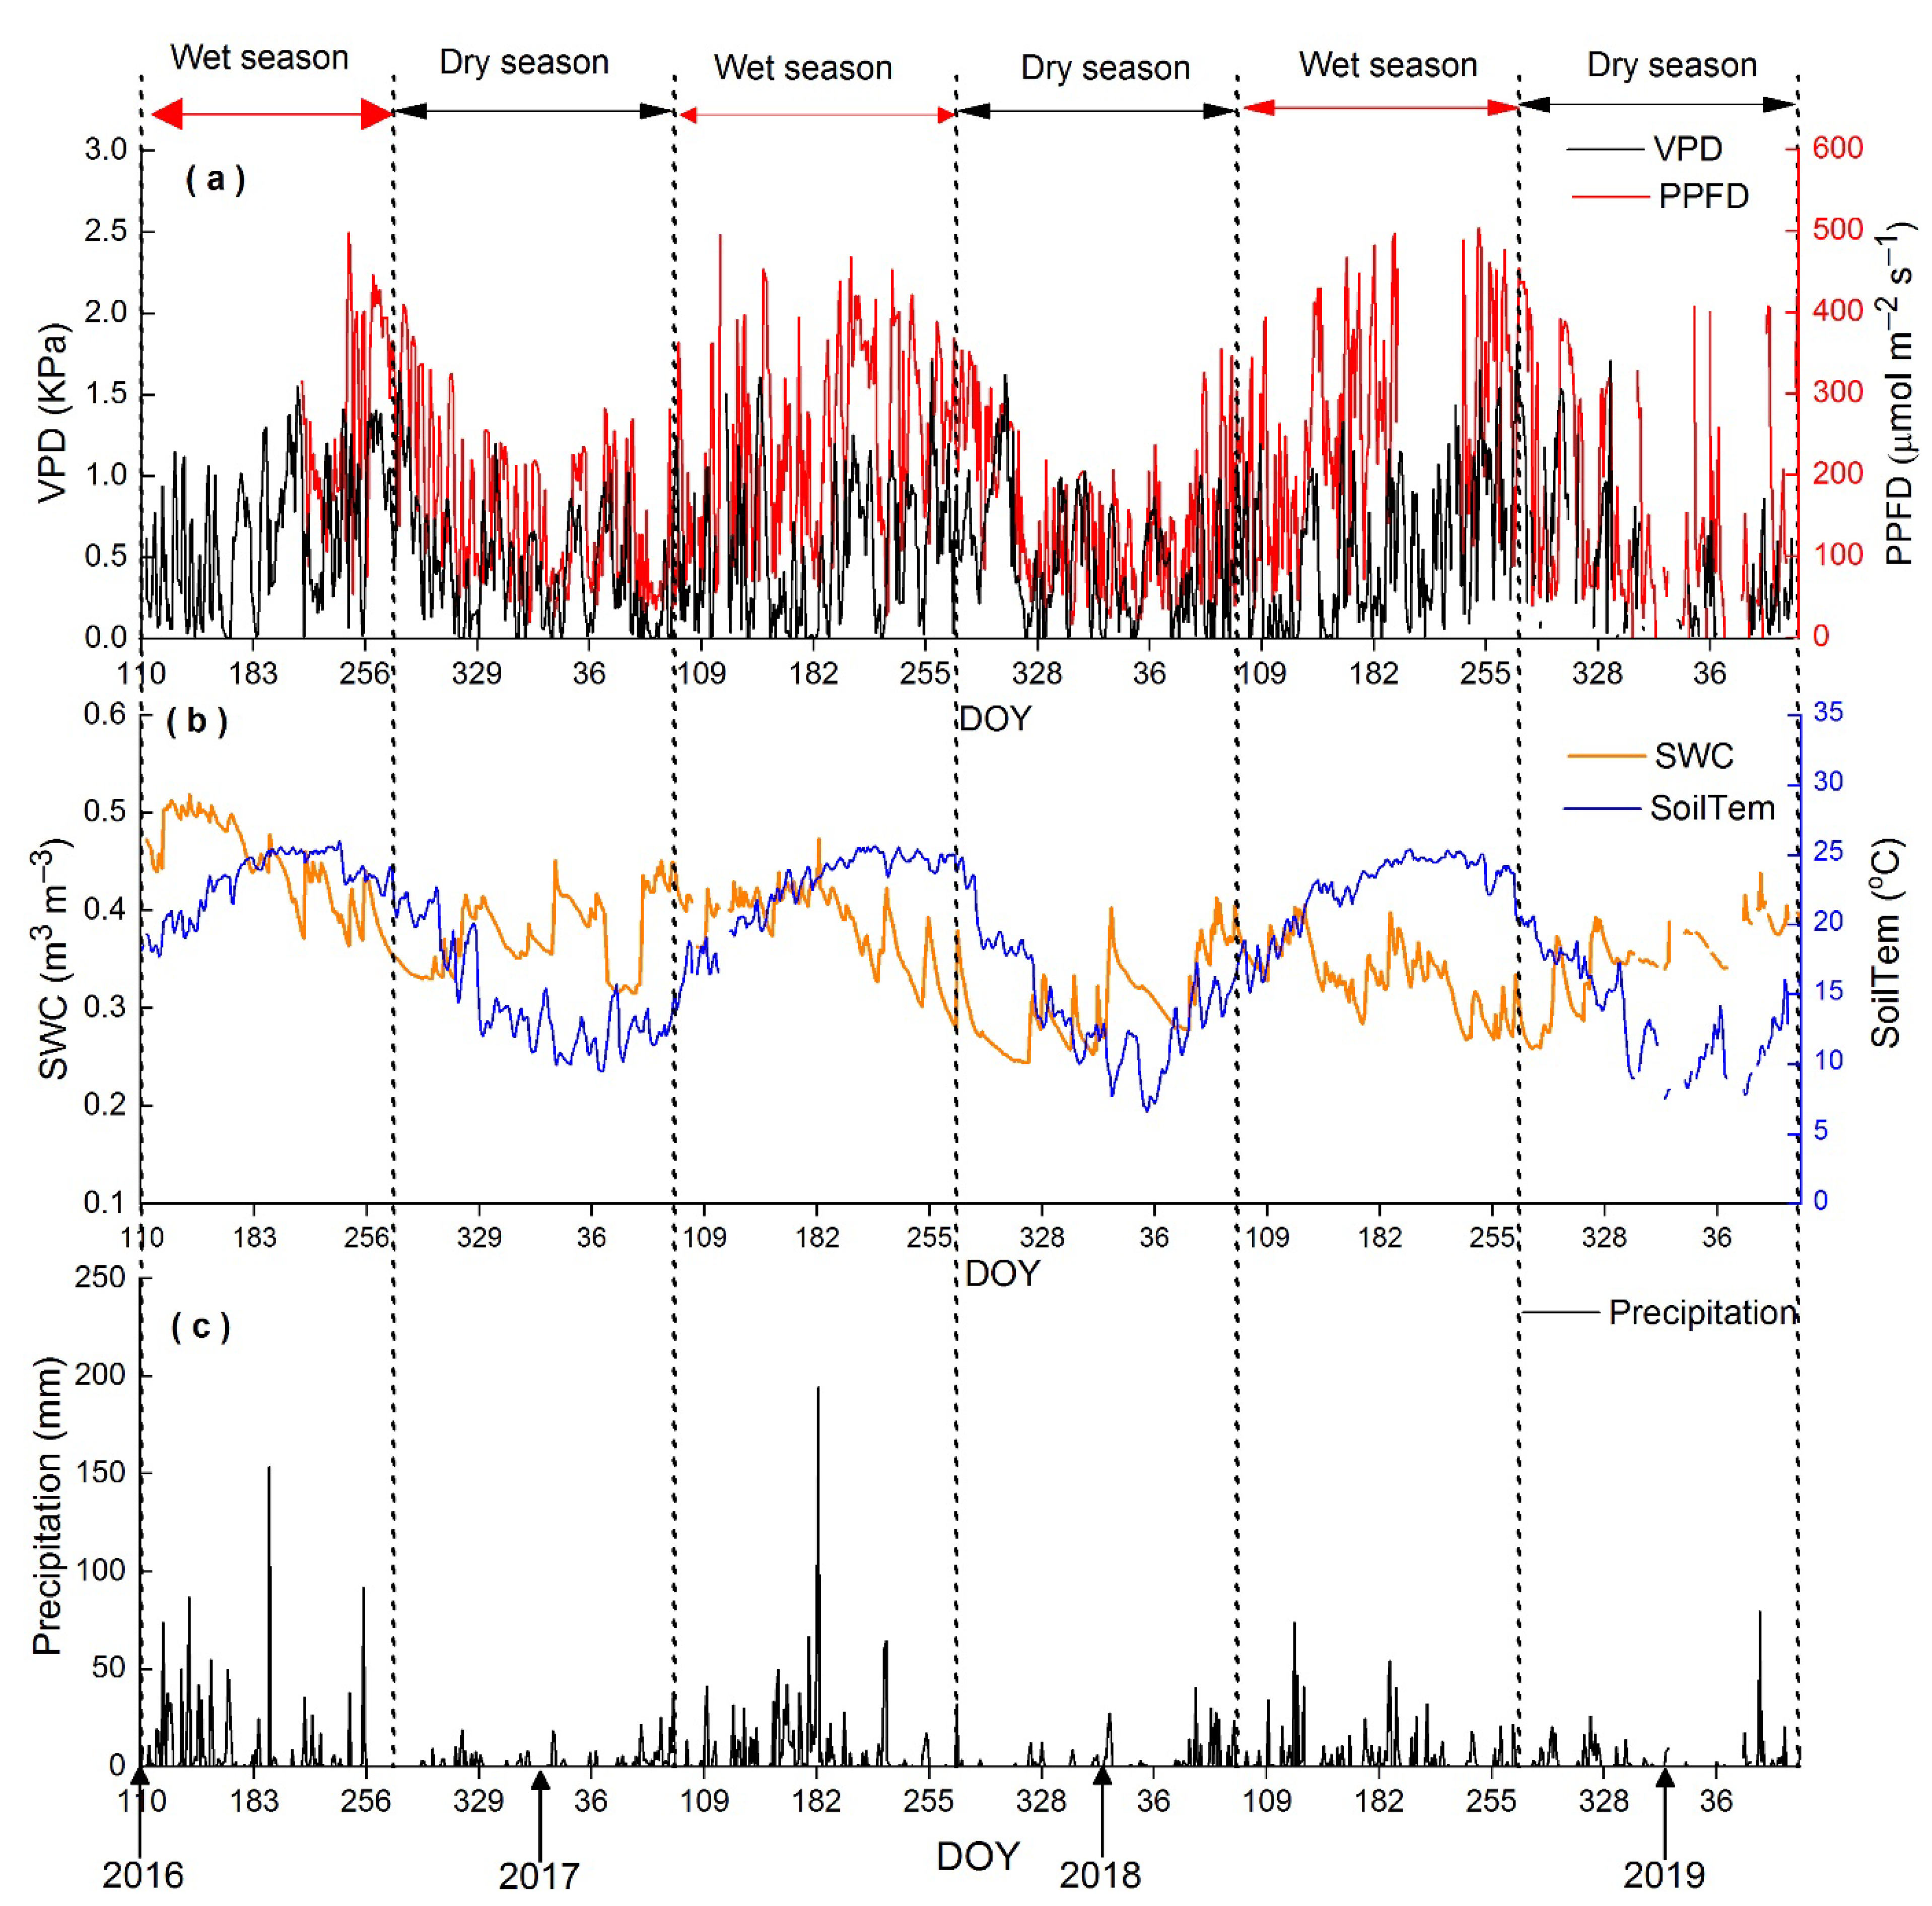
3.1. Seasonal Variations in Microclimate

Seasonal trends of daily environmental variables are shown in Figure 1. The mean and maximum daily VPD were 0.52 ± 0.01 and 1.81 ± 0.03 kPa, while the mean and maximum daily PPFD were 195.03 ± 4.10 and 503.45 ± 53.56 μmol m−2 s−1, respectively. Seasonal trends of daily average PPFD and VPD were similar, with the peak values occurring in the middle of the wet seasons (around DOY 180) and the minimum values occurring in the middle of the dry seasons. The maximum SWC occurred in the middle of the wet season (from DOY 180 to 200), associated with high amounts of rainfall (227 mm/day). Soil temperature (SoilTem) increased from DOY 36 and peaked in the middle of the wet season (from DOY 180 to 200), and then decreased continuously, ranging from 6.65 to 26.02 °C, with an average of 18.53 ± 0.17 °C.
Mann–Whitney tests on the environmental variables in both dry and wet seasons showed that all of the measured variables in the wet seasons were higher than in the dry season. Daily mean PPFD and VPD in the wet season reached 253.72 ± 6.07 μmol·m−2·s−1 and 0.57 ± 0.02 kPa, respectively, and were significantly (p < 0.01) higher than in the dry season with PPFD (151.01 ± 4.68 μmol·m−2·s−1) and VPD (0.47 ± 0.02 kPa), respectively. The mean total precipitation during wet seasons was 1125.90 ± 164.63 mm, which was 2.73 times more than the mean total precipitation in the dry seasons. The mean daily soil water content (SWC) in the wet seasons reached 0.39 ± 0.00 m3·m−3, and was significantly (p < 0.01) higher than 0.34 ± 0.00 m3·m3 in the dry seasons.

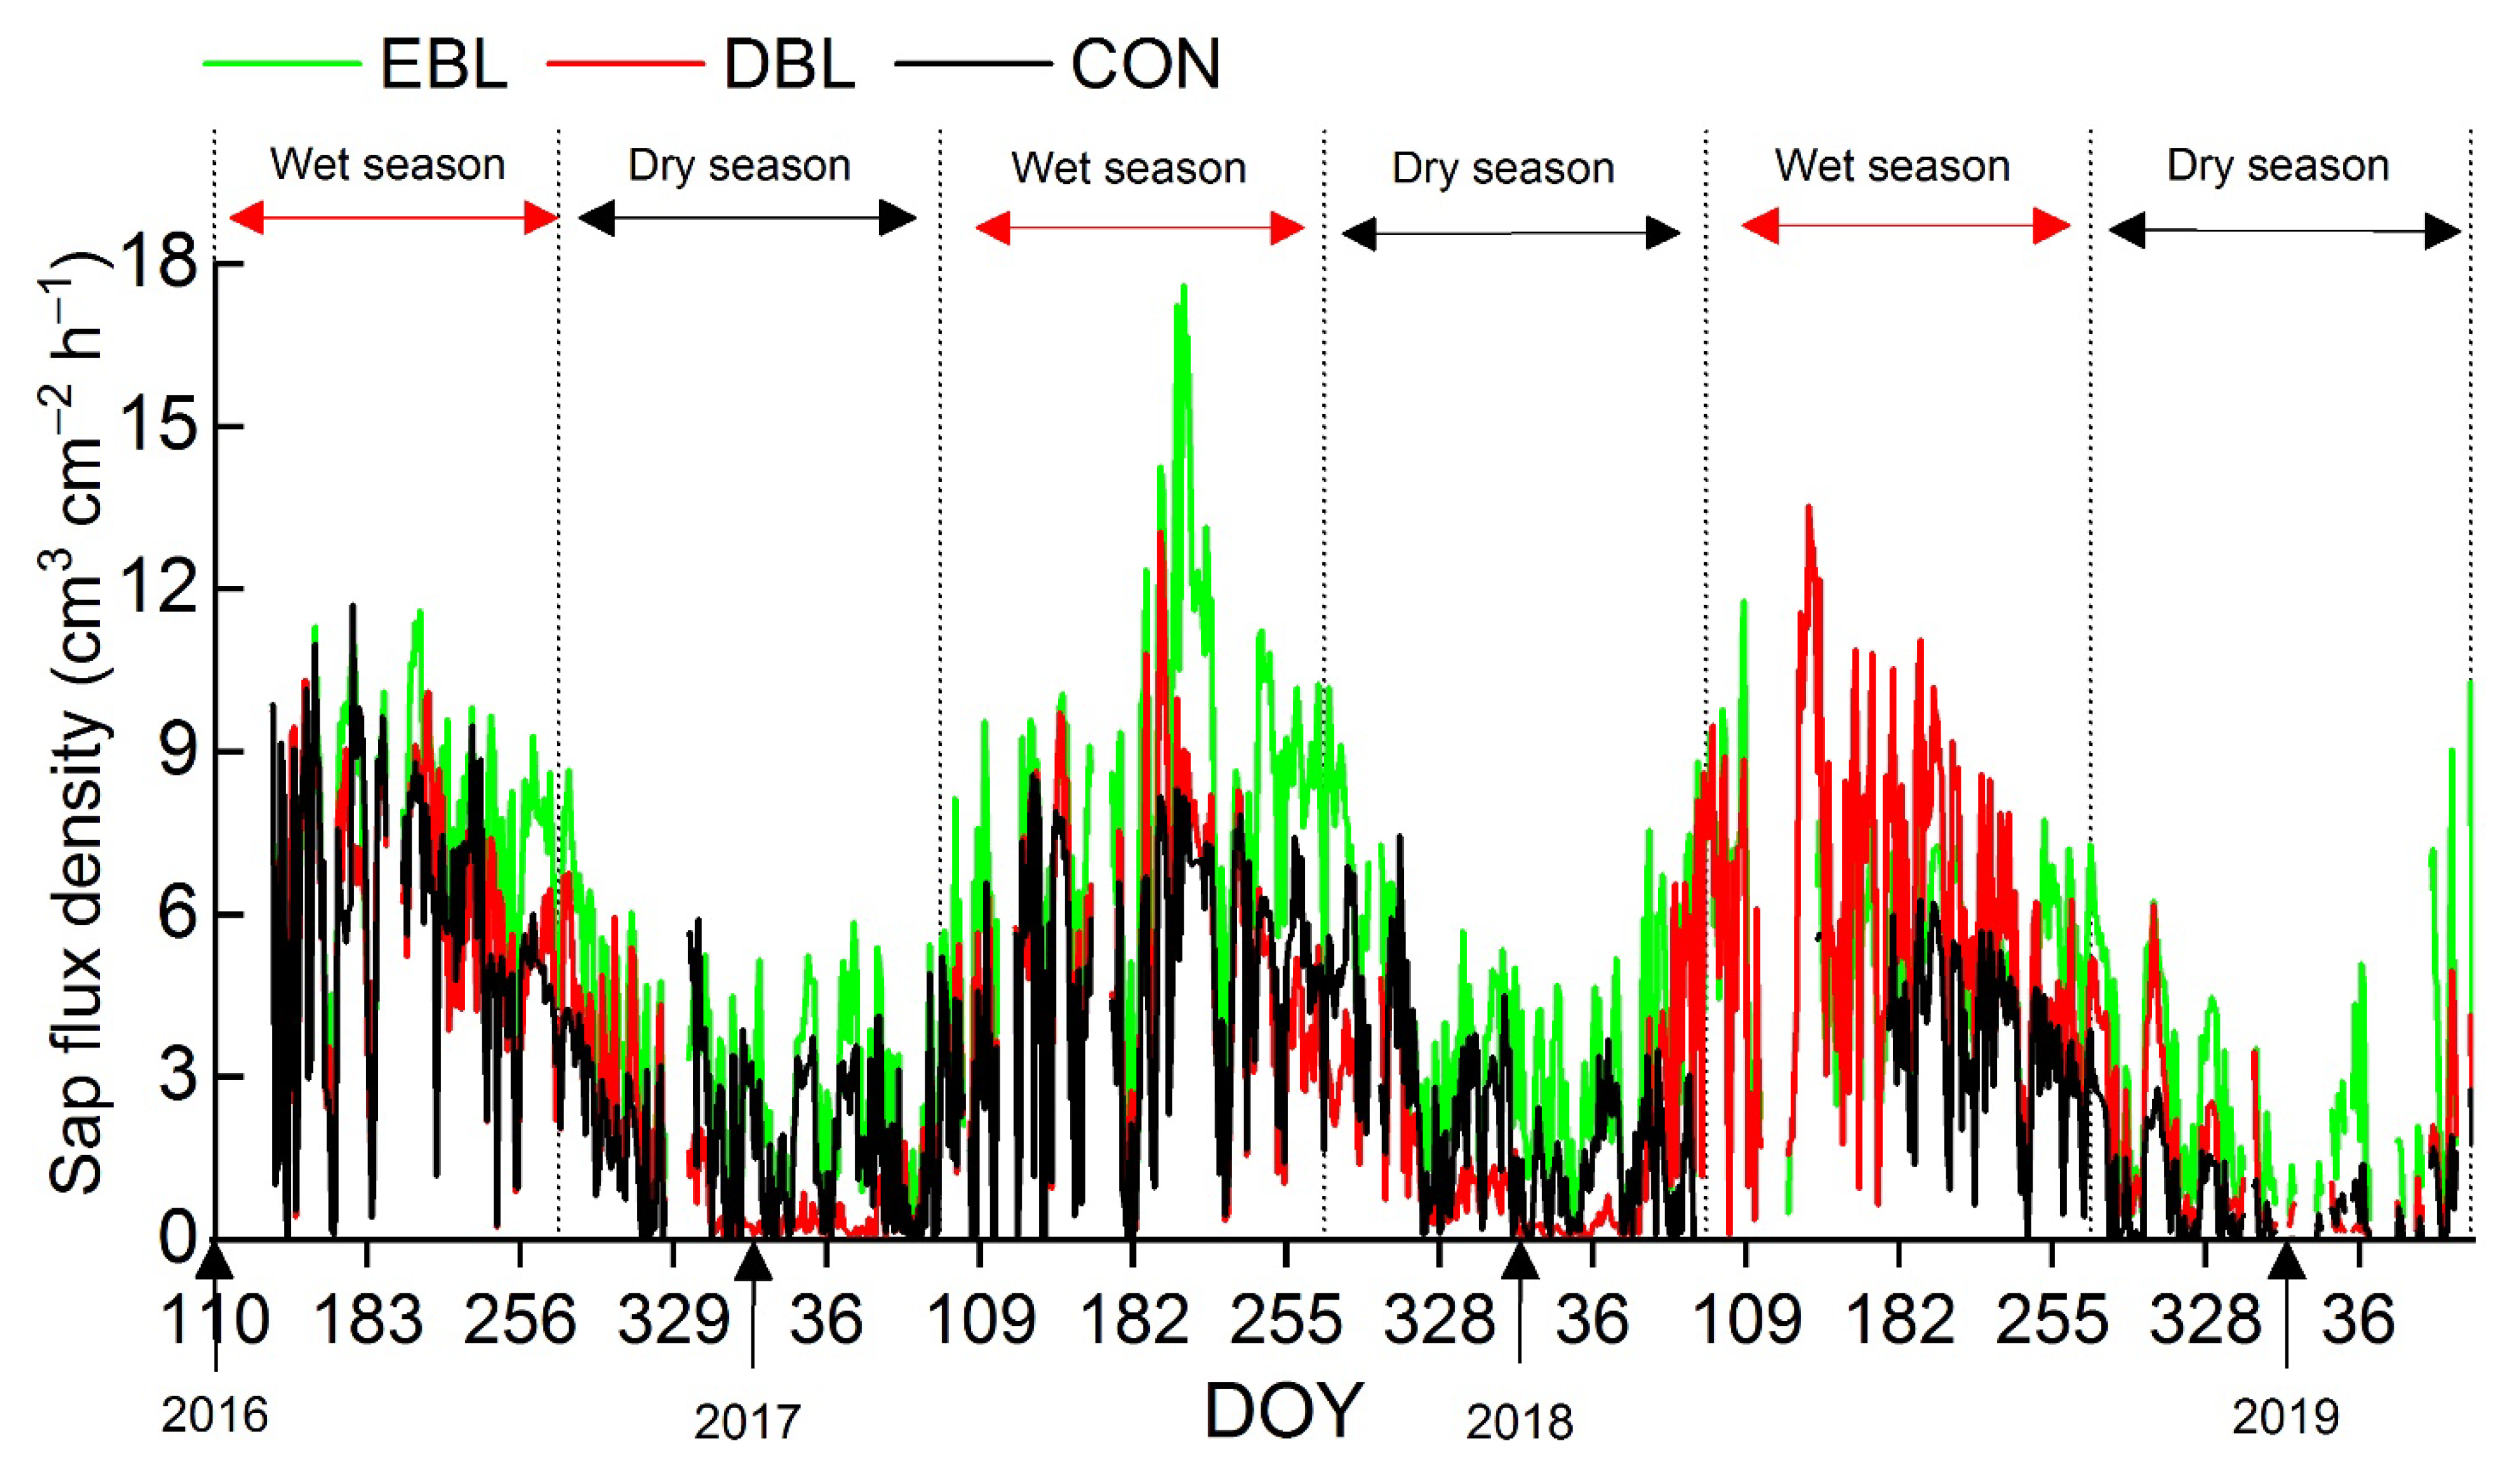
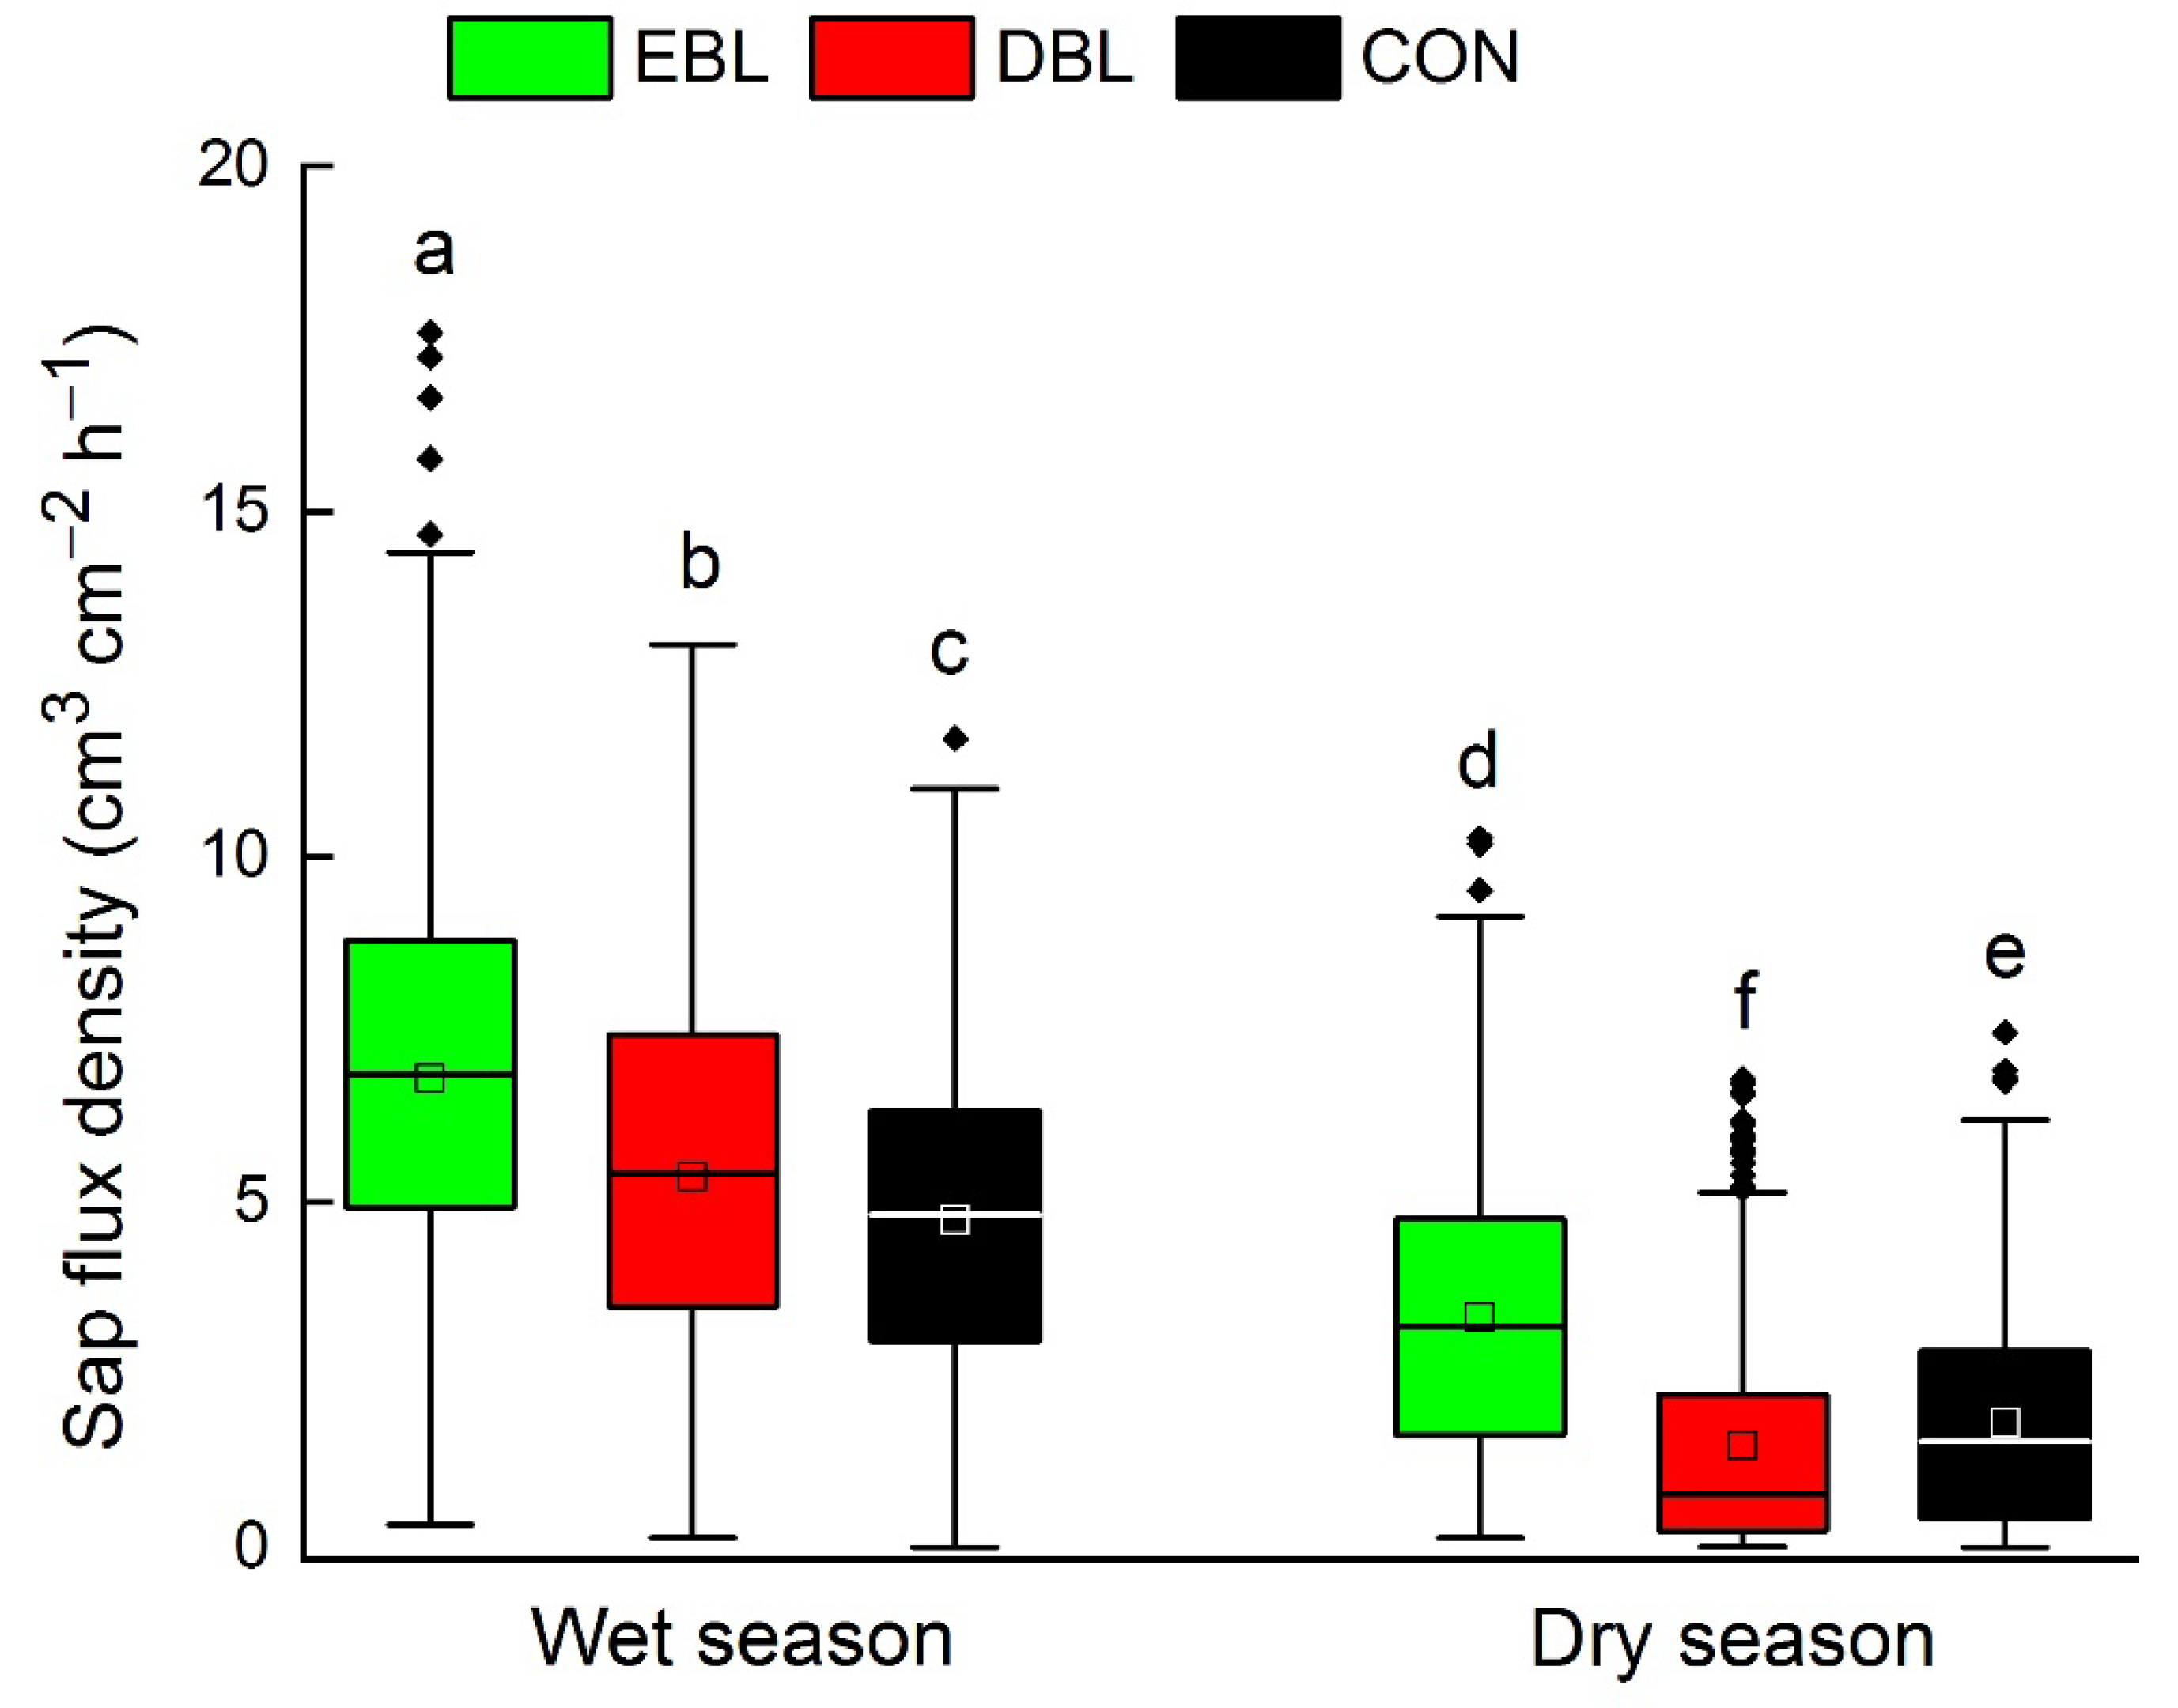
3.2. Seasonal Variations in Sap Flux Densities of Different Functional Types

Seasonal patterns of sap flux densities of selected tree species belonging to EBL, DBL, and CON are presented in Figure 2. The seasonal patterns of daily averaged sap flux densities were similar, irrespective of functional types, with peak values occurring in the middle of the wet season. Daily averaged sap flux densities of EBL ranged from 0.14 ± 0.01 to 17.59 ± 1.44 cm3·cm−2·h−1, with an average of 4.87 ± 0.01 cm3·cm−2·h−1 while that of DBL varied from 0.02 ± 0.00 to 13.54 ± 1.24 cm3·cm−2·h−1, with an average of 3.48 ± 0.10 cm3·cm−2·h−1. In comparison, the daily averaged sap flux densities of CON ranged from 0.0004 ± 0.00 to 11.72 ± 0.93 cm3·cm−2·h−1, with an average of 3.10 ± 0.09 cm3·cm−2·h−1. Moreover, ignoring the seasonal factors, daily averaged sap flux density showed that EBL > DBL > CON (p < 0.01).
The daily averaged sap flux densities of the three functional types in the wet seasons were significantly higher than those in the dry seasons (Figure 3). In the wet season, the daily averaged sap flow density of EBL (6.80 ± 0.15 cm3·cm−2·h−1) was significantly higher than that of DBL (5.37 ± 0.13 cm3·cm−2·h−1) and CON (4.75 ± 0.12 cm3·cm−2·h−1). While in the dry season, the sap flux density of EBL (3.33 ± 0.10 cm3·cm−2·h−1) was significantly higher than that of CON (1.81 ± 0.07 cm3·cm−2·h−1) and DBL (1.47 ± 0.78 cm3·cm−2·h−1).

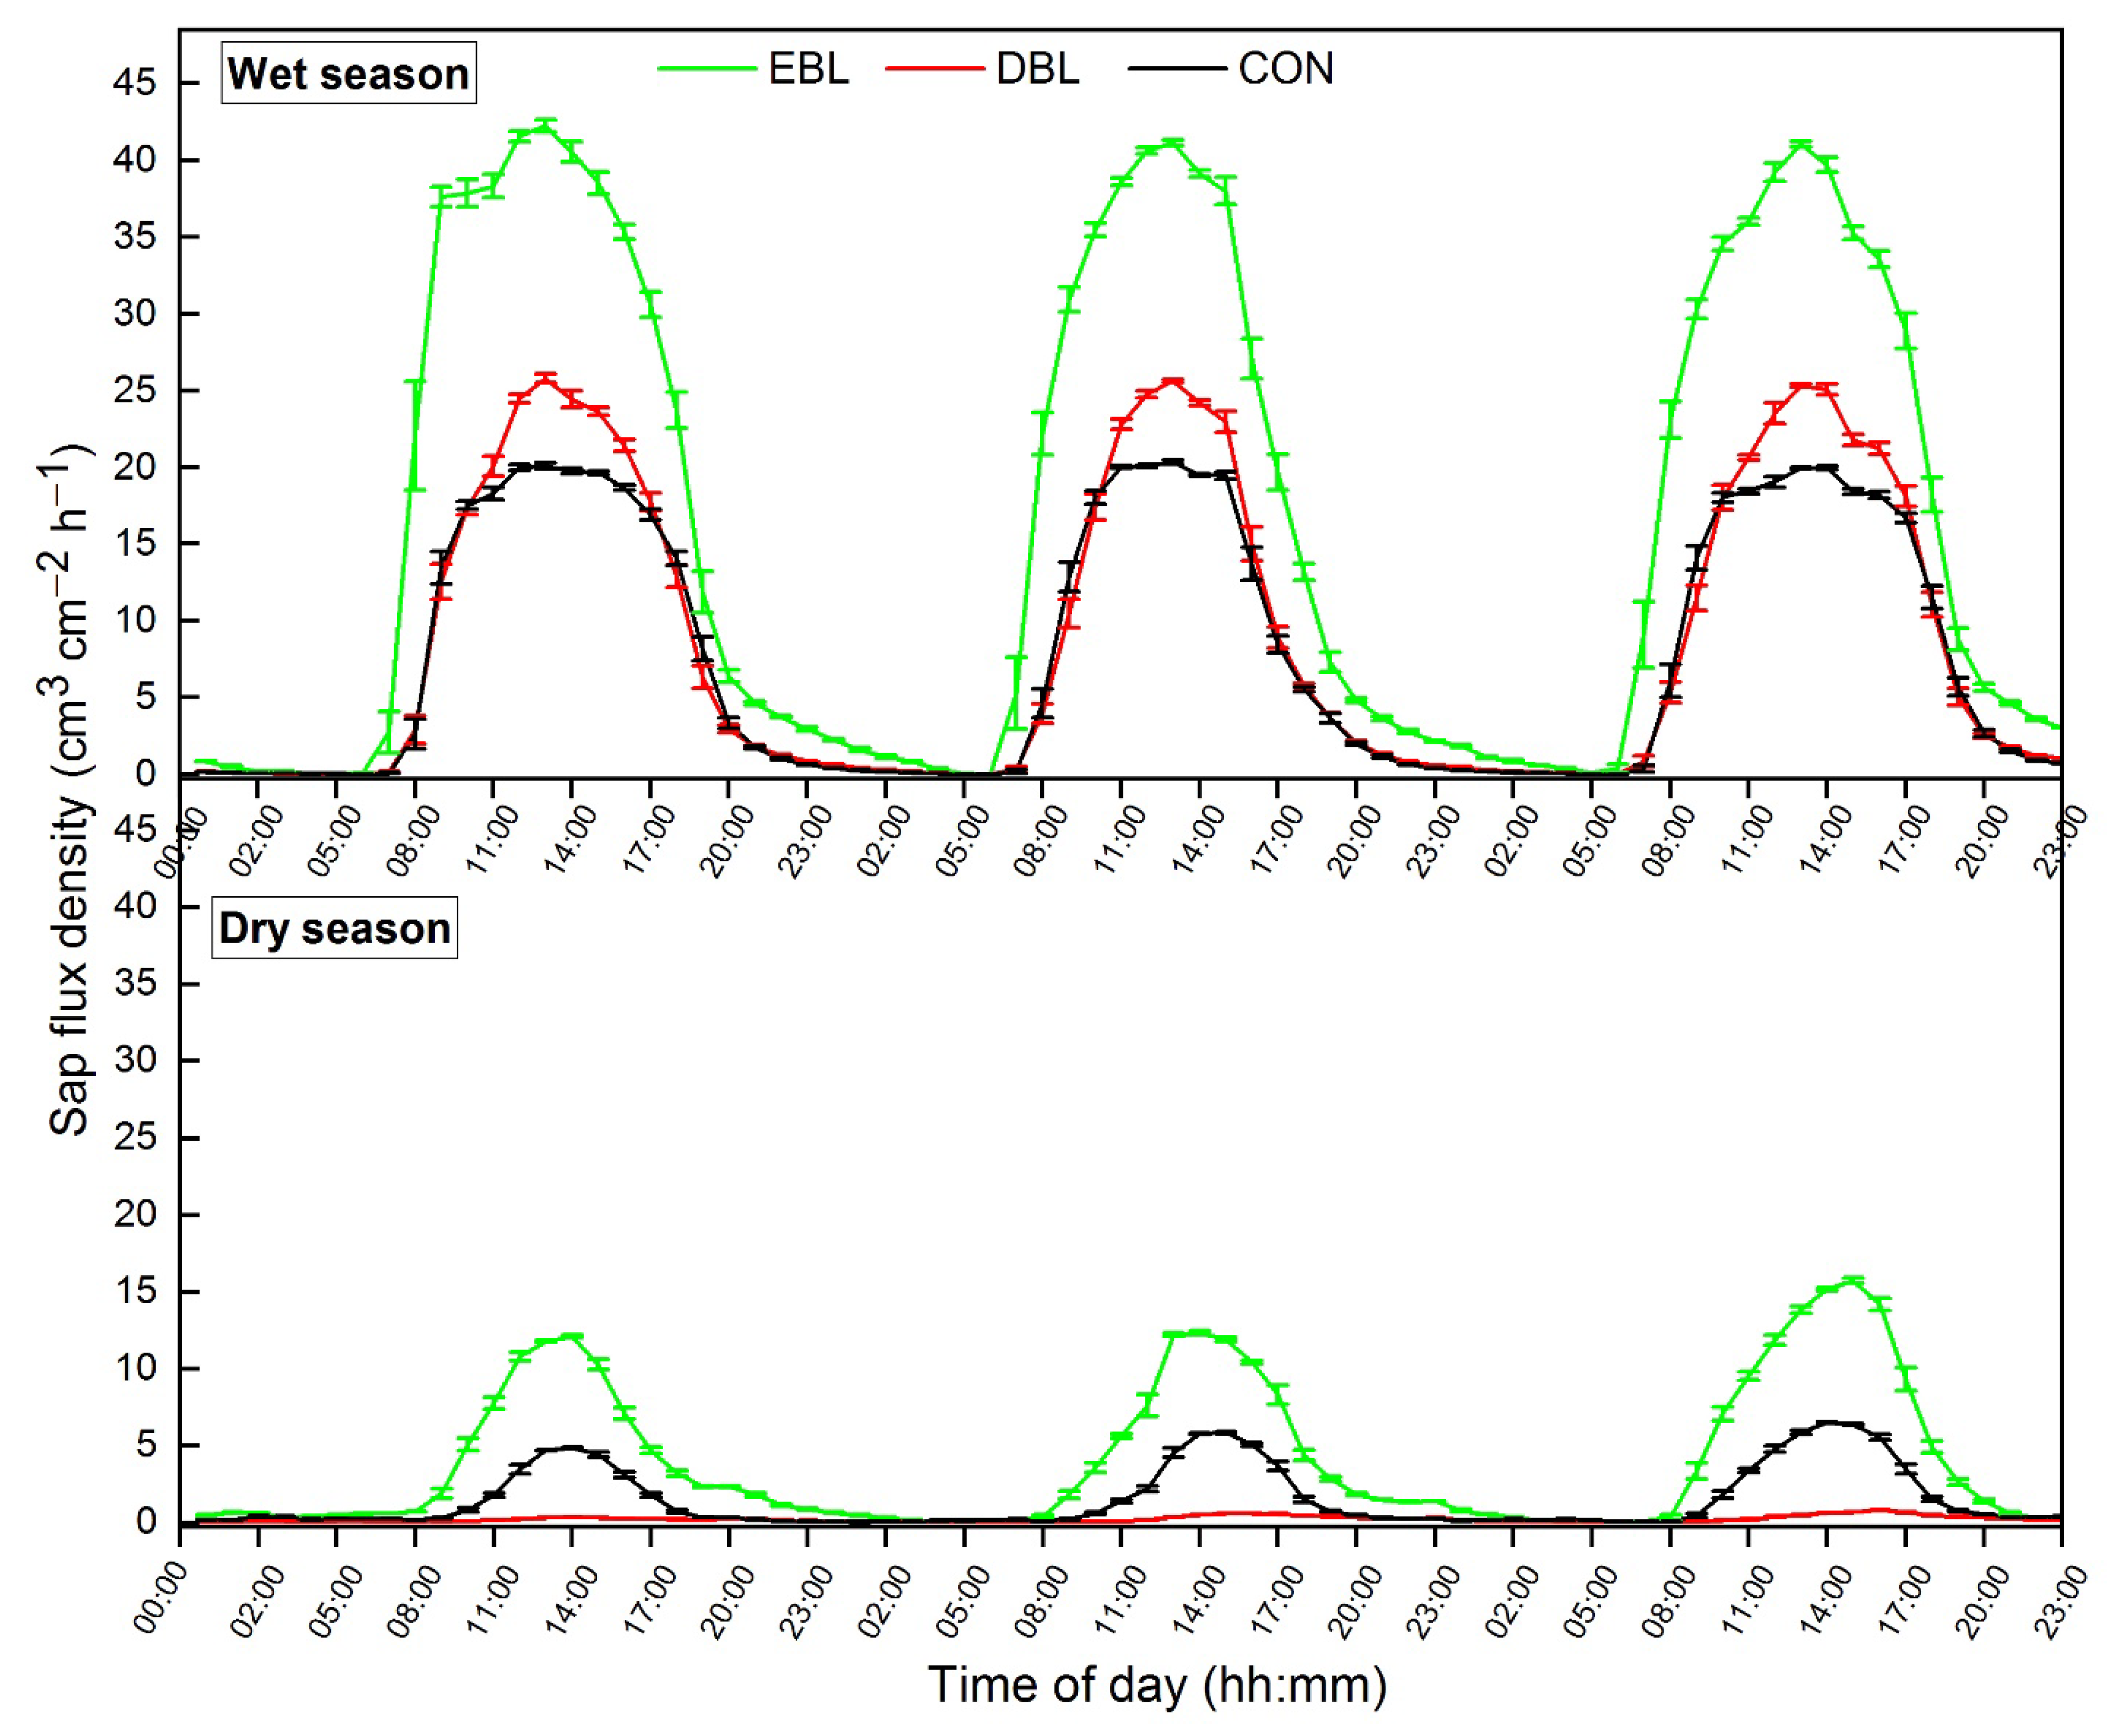
3.3. Diurnal Patterns of Sap Flux Densities of Different Plant Functional Types in Wet and Dry Seasons

The patterns of diurnal sap flux densities of EBL, DBL, and CON were similar, with the peak sap flux densities for selected trees in all of the groups occurring around 15:00 in the wet season (Figure 4). EBL had the highest peak sap flux densities during the day followed by DBL. The lowest peak daily rates were recorded in the CON. The daily peak sap flux densities of EBL, DBL, and CON were higher in the wet seasons compared to the dry seasons.
During the wet season, differences were observed among functional types both at 6:00 and 18:00 (Figure 4). Sap flux densities of all three functional types increased rapidly from 6:00 after sunrise; however, compared to DBL and CON, the increases in EBL were more rapid. After 18:00, sap flux densities of DBL and CON dropped faster and earlier than that of EBL.
During the dry season, sap flux densities of EBL and CON increased rapidly starting from 9:00 and peaking at 15:00 before rapidly declining to pre 9:00 values. Compared to CON, the decline in the sap flux density of EBL was slower, approaching zero at 20:00. For DBL, there was no tangible sap flux observed, with values close to zero recorded.

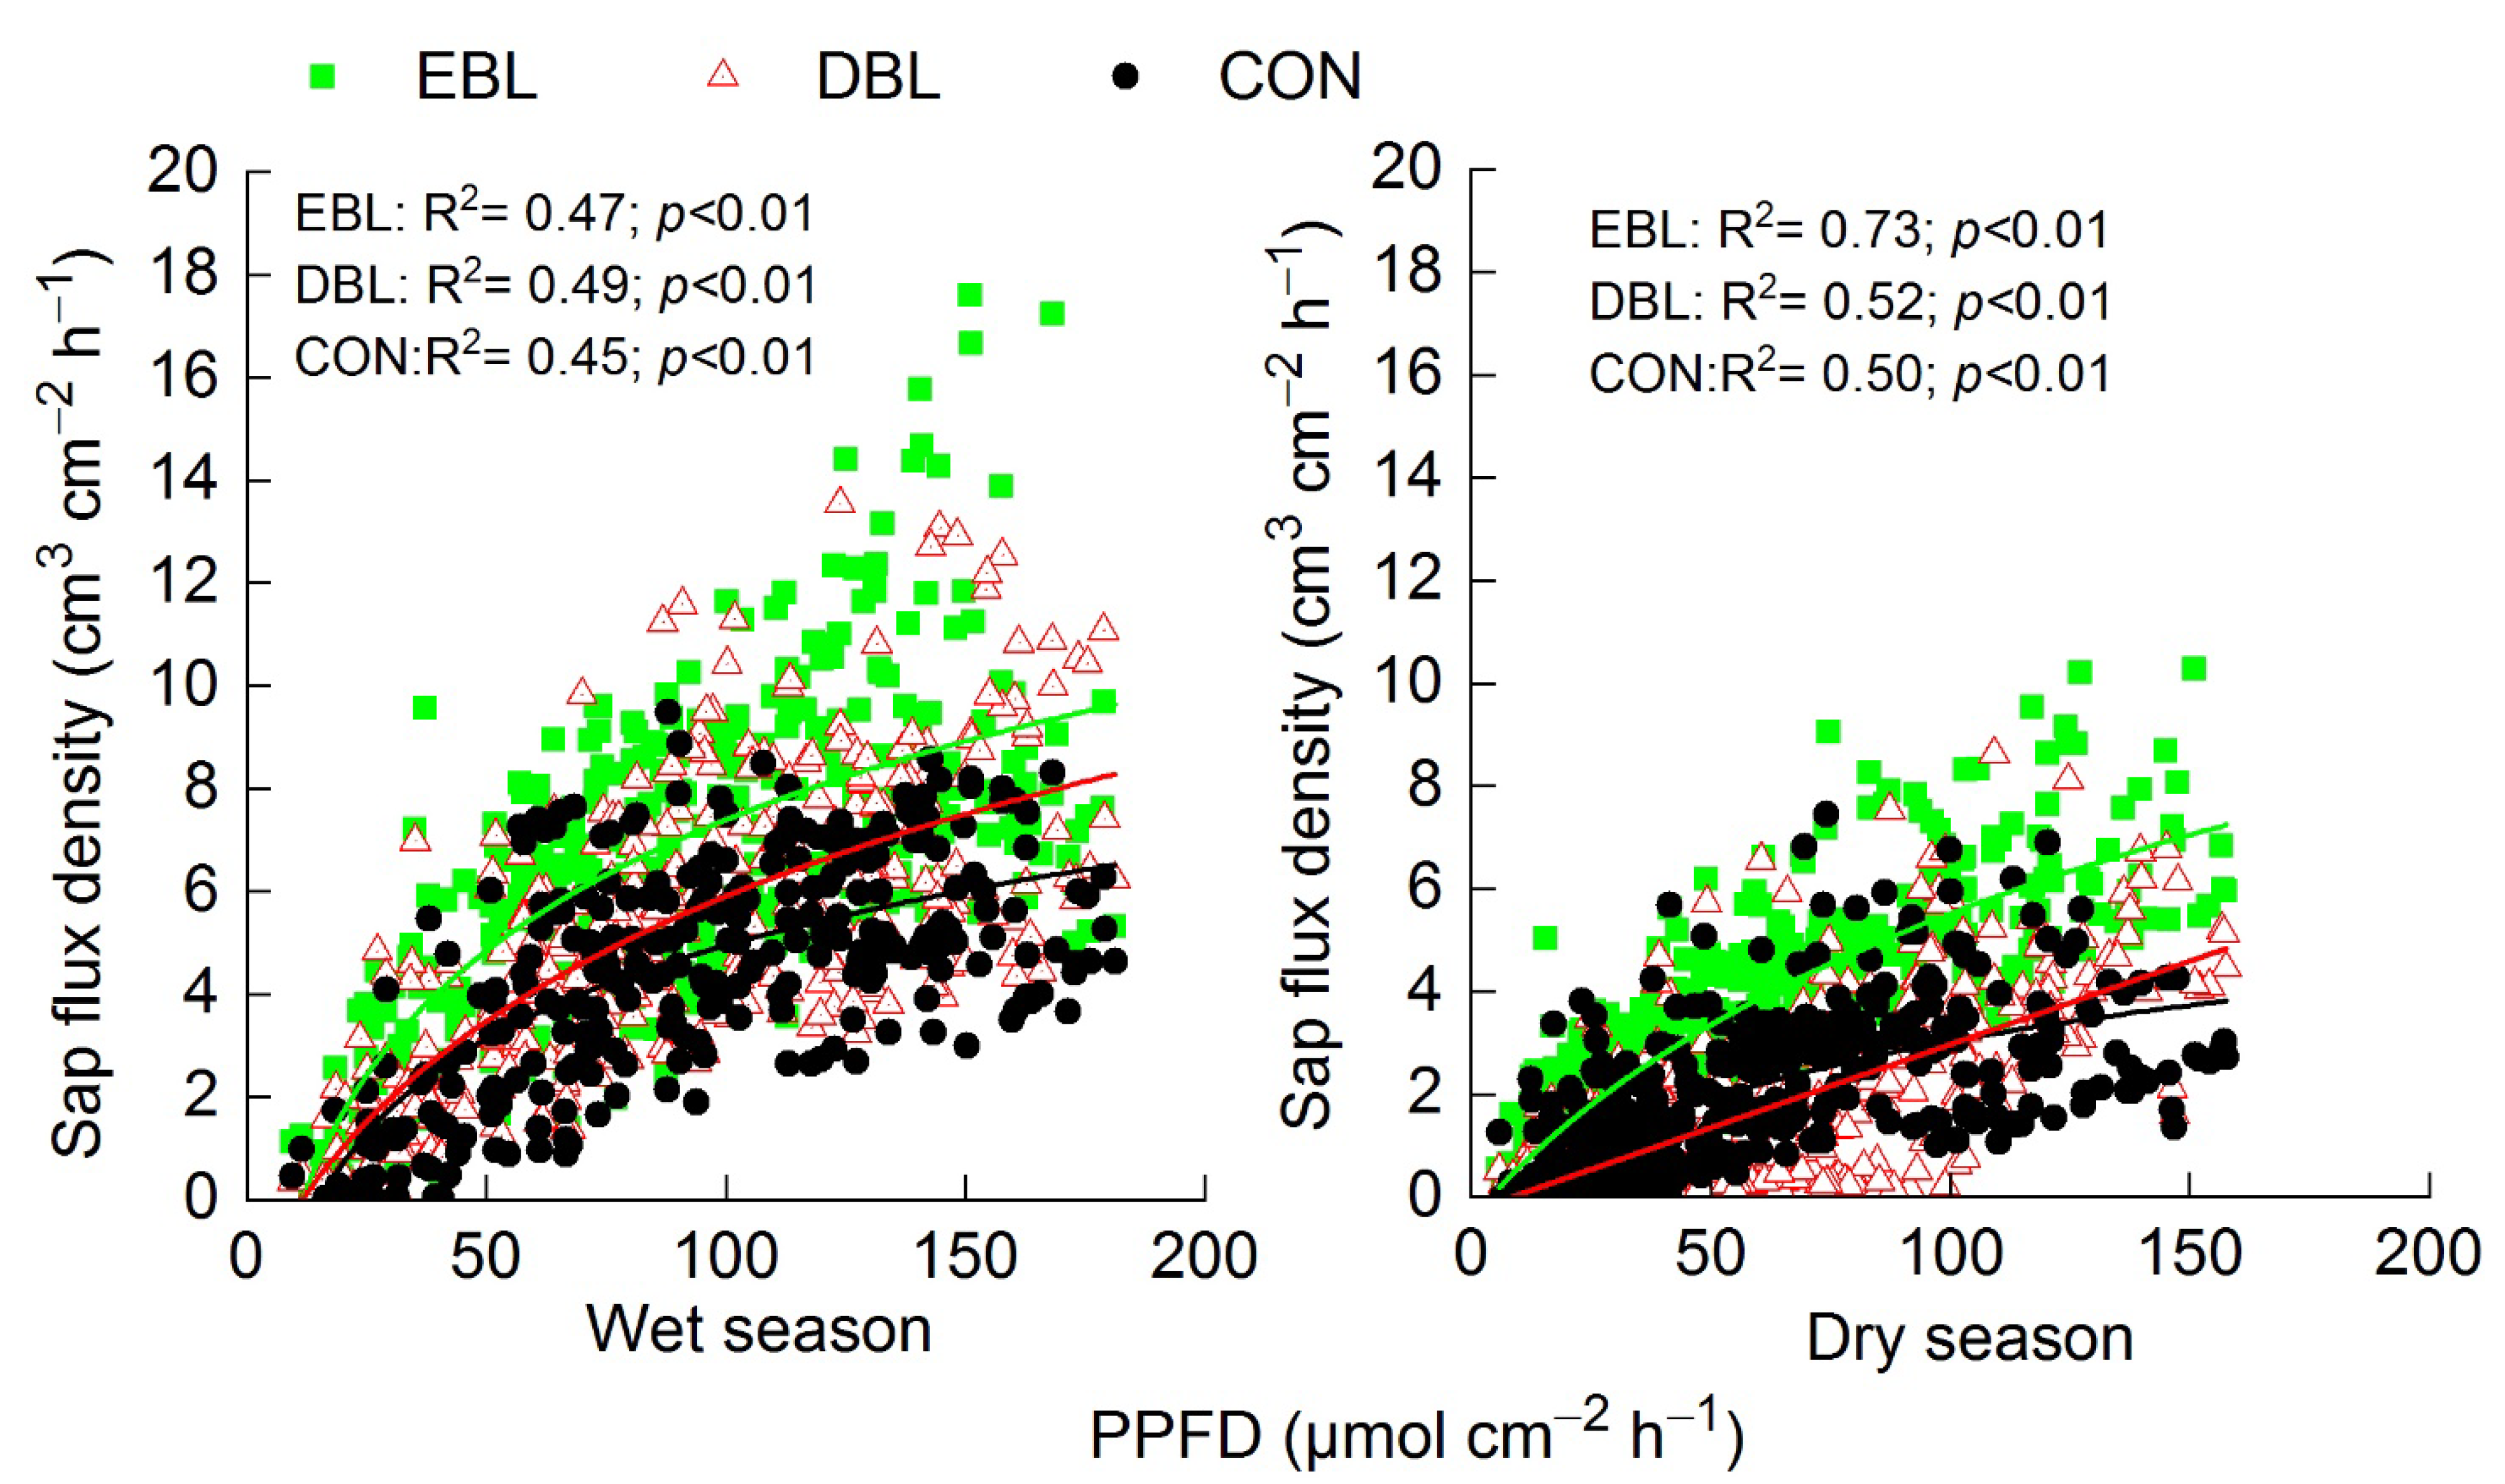
3.4. Seasonal Trends of Sap Flux Densities to Environmental Variables

Pearson correlation analysis revealed that the sap flux densities of DBL, EBL, and CON were significantly and positively correlated with VPD, PPFD, SWC, and SoilTem (p < 0.01) during both the wet and dry seasons. In order to find out the key environmental variables controlling sap flux densities, we used the path analysis (sap flux densities as the dependent variable and environment variables as the independent variables) to identify the direct and indirect effects of environmental variables on the sap flux densities of different functional types. The results, based on daily averaged values during the entire monitoring period are presented in Table 2. For wet seasons, the environmental variable with the highest positive direct effect was PPFD (EBL (0.46), DBL (0.61), and CON (0.43)), followed by VPD (EBL (0.31), DBL (0.17), and CON (0.34)). SWC had 29, 22, and 41% influence on sap flux density rates of EBL, DBL, and CON, respectively. Sap flux density was less directly affected by SoilTem.
Similar trends were observed during the dry season. Approximately 0.72, 0.53, and 0.44 variations in sap flux densities in EBL, CON, and DBL, respectively, were explained by PPFD. Moreover, high positive indirect effects on sap flux densities were detected for VPD and SoilTem through PPFD, in the order of VPD (EBL (0.52), DBL (0.38), and CON (0.31)), and SoilTem (EBL (0.32), DBL (0.23), and CON (0.19)). Contrary to correlation analysis, which suggested that VPD had high and significant relationships (p < 0.01) with sap flux density, no strong direct or indirect effect was found among different functional types in the dry season.
Overall, PPFD was the most important environmental factor, both directly and indirectly, affecting the sap flux density. The sap flux densities of EDL, DBL, and CON all had significant and positive logarithmic relationships with PPFD both in the wet and dry seasons (Figure 5). In DBL however, the relationship tended to show a linear increase during the dry season.

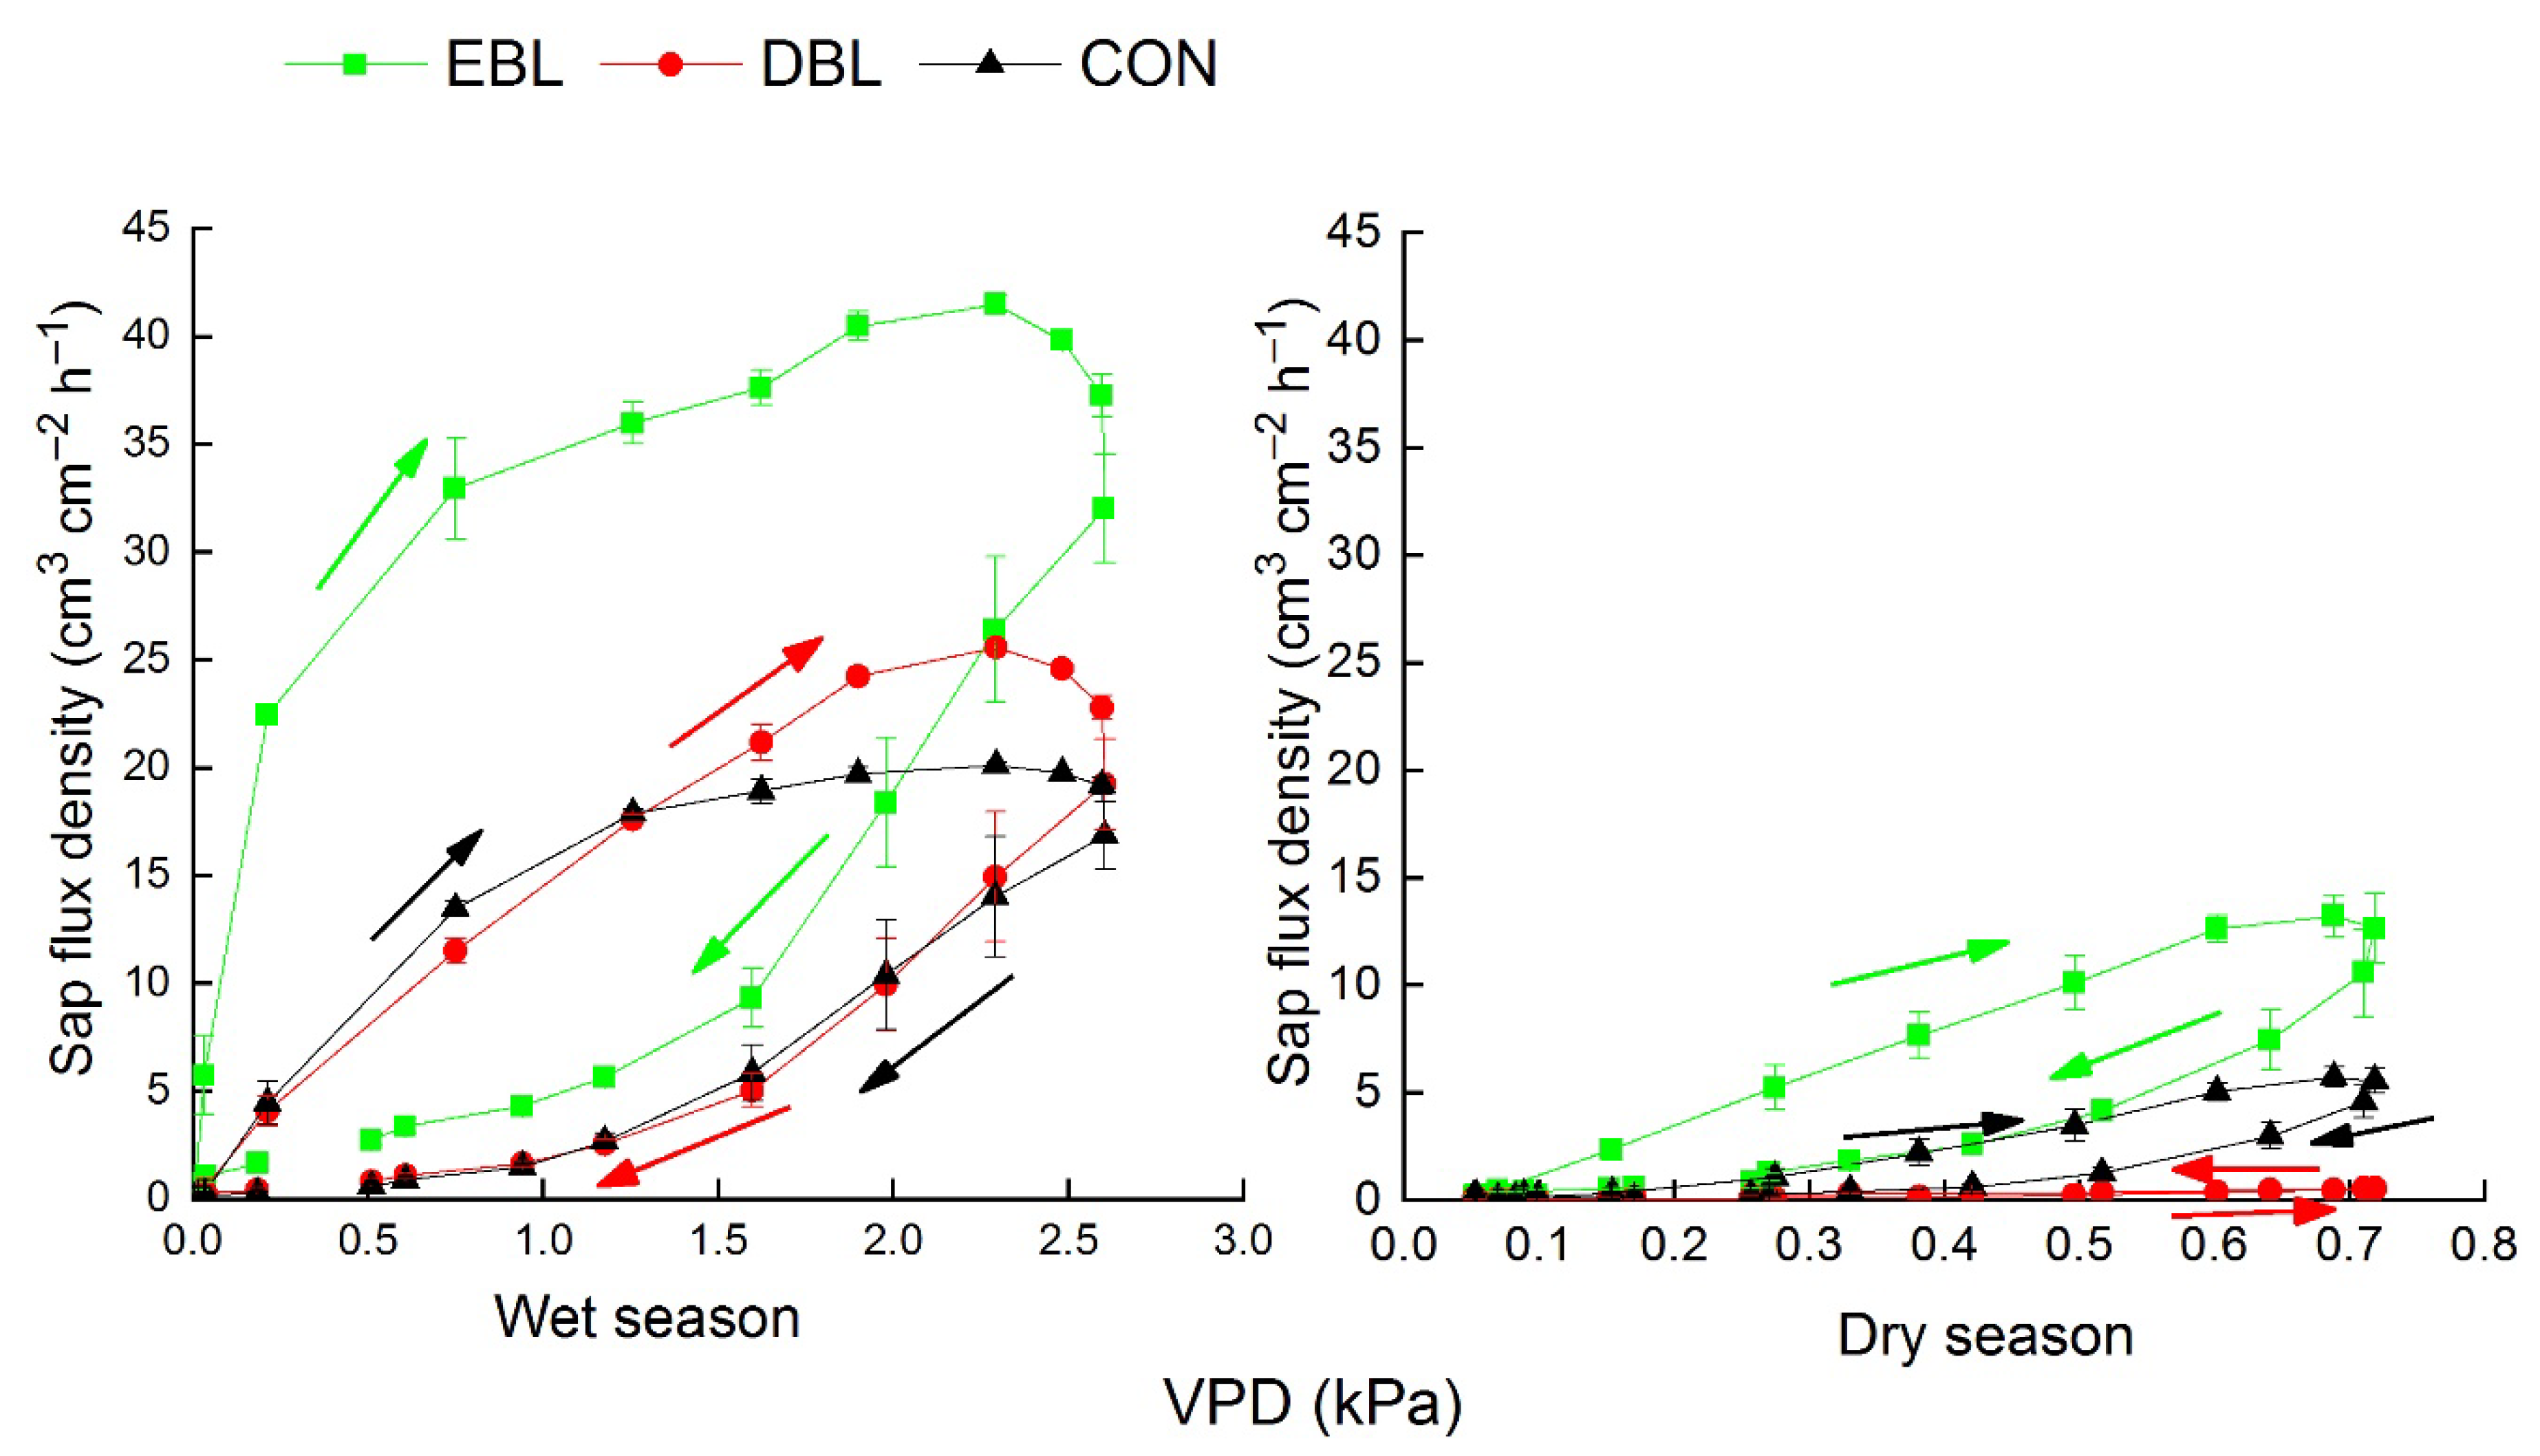
3.5. Diurnal Responses of Sap Flux Densities to Environmental Variables

Sap flux densities of DBL, EBL, and CON for the diurnal scale were significantly and positively correlated with VPD, PPFD, SWC, and SoilTem (p < 0.01) in both the wet and the dry season. Results of path analysis are presented in Table 3.
In the wet season, the highest direct effect was from VPD (for EBL (0.62), DBL (0.58), and CON (0.7)), followed by PPFD (for EBL (0.40), DBL (0.51), and CON (0.36)). In addition, high negative indirect effects on sap flux densities were detected for VPD, through SWC with EBL (−0.23), DBL (−0.22), and CON (−0.26).
In the dry season, similar indirect effects of environmental variables on sap flux densities were found. The highest direct effect was from VPD (for EBL (0.71), DBL (0.94), and CON (0.71)), followed by PPFD for EBL (0.38), DBL (−0.18), and CON (0.32). Through the comparison of direct and indirect effects, we found that SWC and SoilTem had lower direct influences on the sap flux densities. The interactive influence of VPD and PPFD on sap flux density was higher in CON (0.57) than in EBL (0.43) and DBL (0.43). Sap flux density was less directly affected by SWC.
Analysis of the responses of sap flux density on the diurnal scale to climate variables revealed that VPD was the variable with the most significant direct effects on sap flux densities, irrespective of functional type. A distinct hysteresis loop was evident, as shown in the detailed diagrams of sap flux densities of different plant functional types and VPD in both the wet and the dry season (Figure 6).
In the wet season, sap flux densities of all the plant functional types showed clockwise hysteresis loops with VPD. Based on the cross-correlation analysis, we found that the sap flux density was 80, 50, and 50 min ahead of VPD for EBL, DBL, and CON, respectively. At any given VPD, sap flux density was higher in the increasing loop than in the decreasing loop of the hysteresis. When VPD > 2 kPa, sap flux densities of DBL and CON showed similar declining trends. The area within the curve of EBL was larger than those within the curves of DBL and CON.
In the dry season, when VPD > 0.7 kPa, sap flux densities of EBL, DBL, and CON peaked at around 15:00. The hysteresis loop of the relationship between sap flux density and VPD was different among different plant functional types. For EBL, at any given VPD, its sap flux density was higher in the increasing phase than in the decreasing phase. There were 40 and 30 min time lags to VPD for EBL and CON, respectively, but 50 min ahead to VPD for DBL. Correspondingly, the sap flux densities of EBL and CON showed clockwise hysteresis loops with VPD. In DBL, the hysteresis was counter-clockwise during the dry period. Similar to the wet season, the area within the curve in EBL was larger compared to DBL and CON.

4. Discussion

4.1. Seasonal Changes in Sap Flux Density

Due to the seasonal nature of precipitation in the study area, temporal distribution of SWC in the forest was uneven (Figure 1). This, in addition to the fluctuating PPFD and VPD, was bound to influence tree sap flux density in the forest. The daily average sap flux densities in the wet season were significantly higher than in the dry season in all three functional forest types studied (Figure 2). Seasonal dynamics of sap flux densities differed among functional groups and were likely due to differences in leaf habits and sensitivity to changes in water availability [47,48]. The preservation of plant water can be achieved through the effective use of limited water resources or through strategies to avoid seasonal drought [9,49]. For instance, in order to adjust to the declining soil moisture during the dry season, plants have small and needle-shaped leaves (e.g., CON) [50], lower leaf area, and high wood density such as EBL in the tropical arid areas [51]. Species that are intolerant to drought lose leaves to reduce transpiration in the dry season, as observed in DBL [52]. Similar patterns in both the wet and dry seasons with respect to each plant functional type were observed, although the sap flux density of EBL was significantly higher than those of CON (Figure 3). This is consistent with previous reports showing the dominant role of EBL in subtropical mixed forests [12], as demonstrated in a study conducted in Dinghushan forest in southern China, which reported sap flux density of EBL > CON [53]. In the dry season, for EBL trees, the reduced sap flux density under low precipitation and SWC (Figure 1) cannot be attributed to leaf loss but is largely due to a reduction in soil moisture availability [54].
A monsoon climate is associated with extreme weather, mostly during the wet season, which can cause significant changes in sap flux density. For example, sap flux densities of all of the plant functional types surged after heavy rains in 2017 (Figure 1 and Figure 2). From the seasonal changes in precipitation and PPFD (Figure 1), it was observed that, on a sunny day after heavy rain, strong sunlight and sufficient water supply promoted tree transpiration. The increases in sap flux density observed in CON was, however, lower than that in EBL and DBL after heavy rains (Figure 2). This may be related to the lagging response of CON’s leaf stomata structure to the environment. When the stomatal characteristics of plants cannot be adjusted accordingly with the loss of xylem hydraulic conductivity, it will lead to leaf fall and even plant death [55]. The dorsal wall of CON leaves is heavily lignified and the ratio of stomatal length to stomatal width is high, so that the leaf epidermis lacks the advantage of stomatal active regulation [56]. Therefore, the stomatal control system of CON is different from that of DBL and EBL, which is passive hydraulic regulation under moderate drought stress.
During the dry season, EBL had significantly higher sap flux density compared to DBL and CON (Figure 2). This demonstrated that, despite an extended period without rainfall, these trees still had good access to soil moisture. Under such circumstances, as long as trees retained their leaves, transpiration was bound to remain relatively high despite low precipitation, in response to moderately high VPD and PPFD (Figure 1 and Figure 3). Lower sap flux density in DBL during this period was attributed to leaf shedding, which is regarded in this functional type as a first-line response to declining SWC. Leaf abscission lowers canopy transpiration and sap flux density because of a reduced surface area for transpirational water loss [57]. Conifers, on the other hand, due to the nature of their leaves, experience low transpiration rates, especially during low SWC [50].
Different plant functional types are expected to have varied transpiration rates due to differences in water-use-related traits and physiological functions, including sapwood area, stomatal densities, age-related morphological leaf changes, and the canopy volume [29,58]. Moreover, this difference is also closely related to the xylem structure of different functional types [55]. There are anatomical differences among the plant functional types. For example, Zhang et al. [59] found that the density of conduits of S. superba with diffuse-porous was significantly higher than that of C. chinensis with ring-porous. Differences in the structural characteristics can lead to variations in the hydraulic physiological regulation, as observed in our case. Additionally, environmental influences on transpiration are expected to show temporal dynamics (e.g., seasonal and diurnal changes), which are bound to impact sap flux densities [25,60]. Despite specific differences in the magnitudes of sap flux densities among functional types, temporal trends are likely to be similar since environmental variables impose similar constraints on tree water use. Our results indicated that the seasonal and diurnal sap flow patterns of different functional types were similar (Figure 2 and Figure 4). For instance, peak sap flux densities occurred in the middle of the wet season (Figure 2), and the diurnal trends in EBL, DBL, and CON were similar, with peak rates during the day occurring after 15:00 (Figure 4), suggesting that conduction of water by different plant functional types displayed a convergent temporal pattern. A classic ecological explanation would be that within the same ecosystem, common climate or environmental constraints will cause different species within the community to respond to environmental variables in a similar trend [10], which has also been noted in this study.

4.2. Regulation of Sap Flux Density in Subtropical Mixed Forest

On a seasonal scale, the environmental variable with the highest positive direct effect on sap flux density, irrespective of plant functional type, was PPFD (Table 3). Similar to other studies in subtropical and tropical regions, PPFD is identified as the dominant controlling factor for sap flux densities in most forest trees [46,61]. Subtropical forests experience heavy fog and cloud cover, which strongly limit available PPFD; hence, trees growing here are in most cases physiologically and functionally limited by low PPFD [62,63]. Forest trees, therefore, respond to the limiting light by adjusting their canopy structure (e.g., branch type, phyllodes, internode length, and branch angle), which determine the number, distribution, and geometric structure of leaves, with significant influence on plant transpiration [64]. For most functional types growing in the subtropical mixed forests, therefore, higher PPFD increases plant transpiration as demonstrated by the significant and positive linear increases in sap flux densities with PPFD in EDL, DBL, and CON during both the dry and wet seasons (Figure 5). This was similar to the behavior in other species in previous studies that reported logarithmic relationships between sap flux density and PPFD in both the wet and dry seasons [65].
On a daily basis, sap flux densities of different plant functional types were mainly controlled by VPD but less directly affected by SWC. Daily changes in SWC are relatively small, hence the lack of influence of SWC on sap flux density was not surprising. Previous studies have demonstrated the dependence of daily tree sap flux density on VPD. For example, Granier et al. [66] found that the correlation between sap flow of CON species with Picea abies and VPD was higher than that with other environmental variables (e.g., solar radiation, temperature, and RH), similar to our results in this study (Table 3). Pataki et al. [67] studied the sap flow sensitivity of four CON species to VPD and reported that Populus tremuloides was highly sensitive to VPD compared to Pinus flexilis, suggesting different responses to VPD even within a functional group. This may be related to specific functional types and individual tree structures [68]. As reported in previous studies, different plant functional types vary largely in their daily sap flux densities, mainly due to hydraulic traits and hydraulic constraints [69]. Uneven distribution of precipitation during the season leads to obvious changes in SWC between the dry and wet seasons. Due to the difference in soil water supply, changes in water transport resistance along the hydraulic path is anticipated, with consequences on tree sap flux densities [4,70].
Analysis of hysteresis revealed the dynamic balance between sap flux density and environmental variables [71]. From the relationship of hysteresis between sap flux density and VPD of all functional types, the commencement of sap flux density during the day in the dry season is generally earlier than that in the wet season. Granier et al. [72] attributed the time lag of sap flow to the internal absorption and release of water by tree tissues. Other studies have reported trunk capacitance, i.e., water storage in the trunk as the main cause of time lag [73]. In the dry season, water storage in the tissues above the probes is low and hence water transport from the soil resumes immediately after sunrise. In addition, diurnal hysteresis between sap flux density and environmental variables, at any VPD, deployed a clockwise rotation loop in all species during both wet and dry seasons, with much larger loops in the dry season (Figure 6). Our results demonstrate convergence among different tree species in response to similar environmental constraints. Similar observations were reported by [60,61,74,75]. A number of studies revealed that different plant functional types have their own unique response strategies to cope with water loss caused by high VPD. The general explanation has been the reduction of stomatal conductance in response to increasing VPD [76,77]. For instance, EBL (such as Cordia africana) can adjust stomatal conductance to slow down the increase in transpiration as a result of increasing VPD [78]. Kröber et al. [79] studied the leaf morphology and physiological characteristics of 21 DBL species and 19 EBL species in subtropical forests, and showed that, compared to DBL, EBL species usually have thicker sponge and palisade tissue. This leaf structure is beneficial for reducing transpiration in response to increasing VPD. DBL additionally lowered transpirational water loss through leaf abscission in the dry season [52], hence experiencing low sap flux densities. Stomatal regulation of water loss in CON was different from that of DBL and EBL, and was regarded as passive hydraulic regulation under moderate drought stress in this functional type [6,55]. Different plant functional types can use their unique physiological structures to cope with the common environmental stress and achieve coexistence. Therefore, different plant functional types with convergent functional traits may respond similarly to the same fluctuating environments.

5. Conclusions

In this study, we reported seasonal and diurnal dynamics of sap flux densities of different plant functional types, and their responses to environmental variables in a subtropical mixed forest in southern China. Our results demonstrated differences among plant functional types in their seasonal patterns of sap flux densities. The broad-leaved trees comprising EBL had the highest sap flow densities in this mixed forest, irrespective of wet and dry seasons. The rates of sap flux densities among individuals were constrained by PPFD at the seasonal scale and VPD at the diurnal scale. Our findings are useful for the reliable estimation of the water balance of subtropical mixed forests and for revealing the response mechanisms of the subtropical mixed forest to environmental variables.

Author Contributions

Q.W. conceived the study and reviewed the manuscript; K.H. analyzed data and wrote the draft; D.O. revised the draft. All authors have read and agreed to the published version of the manuscript.

Funding

This research received no external funding.

Data Availability Statement

Not applicable.

Acknowledgments

We thank Yuqing Huang, Guangman Song, Wen He, Daxing Gu, Jiashuang Qin, Longkang Ni, and Cuiming Zhou for their assistance collected the data. Thank you also to the Guangxi Key Laboratory of Plant Conservation and Restoration Ecology in Karst Terrain for their support of ecological monitoring equipment.

Conflicts of Interest

The authors declare no conflict of interest.

References

  1. Box, E.O. Plant functional types and climate at the global scale. J. Veg. Sci. 1996, 7, 309–320. [Google Scholar] [CrossRef]
  2. Takahashi, K.; Okuhara, I. Comparison of climatic effects on radial growth of evergreen broad-leaved trees at their northern distribution limit and co-dominating deciduous broad-leaved trees and evergreen conifers. Ecol. Res. 2012, 27, 125–132. [Google Scholar] [CrossRef]
  3. Díaz, S.; Cabido, M.; Zak, M.; Martínez Carretero, E.; Araníbar, J. Plant functional traits, ecosystem structure and land-use history along a climatic gradient in central-western Argentina. J. Veg. Sci. 1999, 10, 651–660. [Google Scholar] [CrossRef]
  4. Baldocchi, D.D.; Xu, L.; Kiang, N. How plant functional-type, weather, seasonal drought, and soil physical properties alter water and energy fluxes of an oak-grass savanna and an annual grassland. Agric. For. Meteorol. 2004, 123, 13–39. [Google Scholar] [CrossRef] [Green Version]
  5. Kang, S.; Doh, S.; Lee, D.; Lee, D.; Jin, V.L.; Kimball, J.S. Topographic and climatic controls on soil respiration in six temperate mixed-hardwood forest slopes, Korea. Glob. Chang. Biol. 2003, 9, 1427–1437. [Google Scholar] [CrossRef] [Green Version]
  6. Ge, J.; Xie, Z. Geographical and climatic gradients of evergreen versus deciduous broad-leaved tree species in subtropical China: Implications for the definition of the mixed forest. Ecol. Evol. 2017, 7, 3636–3644. [Google Scholar] [CrossRef] [Green Version]
  7. Peng, W.; Song, T.; Wang, K. Relationships between woody plants and environmental factors in karst mixed evergreen-deciduous broadleaf forest, southwest China. J. Food Agric. Environ. 2012, 10, 890–896. [Google Scholar]
  8. Yang, H.; Guo, Z.; Chu, X.; Man, R.; Chen, J.; Liu, C.; Tao, J.; Jiang, Y. Impacts of species richness on productivity in a large-scale subtropical forest experiment. Science 2018, 362, 80–83. [Google Scholar] [CrossRef]
  9. Werden, L.K.; Waring, B.G.; Smith-Martin, C.M.; Powers, J.S. Tropical dry forest trees and lianas differ in leaf economic spectrum traits but have overlapping water-use strategies. Tree Physiol. 2018, 38, 517–530. [Google Scholar] [CrossRef]
  10. Winemiller, K.O.; Fitzgerald, D.B.; Bower, L.M.; Pianka, E.R. Functional traits, convergent evolution, and periodic tables of niches. Ecol. Lett. 2015, 18, 737–751. [Google Scholar] [CrossRef]
  11. Cristiano, P.M.; Campanello, P.I.; Bucci, S.J.; Rodriguez, S.A.; Lezcano, O.A.; Scholz, F.G.; Madanes, N.; di Francescantonio, D.; Carrasco, L.O.; Zhang, Y.J.; et al. Evapotranspiration of subtropical forests and tree plantations: A comparative analysis at different temporal and spatial scales. Agric. For. Meteorol. 2015, 203, 96–106. [Google Scholar] [CrossRef]
  12. Ouyang, L.; He, W.; Huang, K.C.; Zhou, C.; Gu, D.X.; Huang, Y.Q.; Zhao, P. Seasonal water use strategy of canopy tree species and possible implication for their coexistence in a subtropical secondary forest. Ecohydrology 2019, 12, 1–11. [Google Scholar] [CrossRef]
  13. Song, Q.H.; Fei, X.H.; Zhang, Y.P.; Sha, L.Q.; Liu, Y.T.; Zhou, W.J.; Wu, C.S.; Lu, Z.Y.; Luo, K.; Gao, J.B.; et al. Water use efficiency in a primary subtropical evergreen forest in Southwest China. Sci. Rep. 2017, 7, 3–12. [Google Scholar] [CrossRef] [PubMed] [Green Version]
  14. Chen, X.; Zhao, P.; Hu, Y.; Zhao, X.; Ouyang, L.; Zhu, L.; Ni, G. The sap flow-based assessment of atmospheric trace gas uptake by three forest types in subtropical China on different timescales. Environ. Sci. Pollut. Res. 2018, 25, 28431–28444. [Google Scholar] [CrossRef]
  15. Cristiano, P.M.; Díaz Villa, M.V.E.; de Diego, M.S.; Lacoretz, M.V.; Madanes, N.; Goldstein, G. Carbon assimilation, water consumption and water use efficiency under different land use types in subtropical ecosystems: From native forests to pine plantations. Agric. For. Meteorol. 2020, 291, 108094. [Google Scholar] [CrossRef]
  16. Yi, K.; Maxwell, J.T.; Wenzel, M.K.; Roman, D.T.; Sauer, P.E.; Phillips, R.P.; Novick, K.A. Linking variation in intrinsic water-use efficiency to isohydricity: A comparison at multiple spatiotemporal scales. New Phytol. 2019, 221, 195–208. [Google Scholar] [CrossRef] [Green Version]
  17. Komatsu, H.; Tanaka, N.; Kume, T. Do coniferous forests evaporate more water than broad-leaved forests in Japan? J. Hydrol. 2007, 336, 361–375. [Google Scholar] [CrossRef]
  18. Soh, W.K.; Yiotis, C.; Murray, M.; Parnell, A.; Wright, I.J.; Spicer, R.A.; Lawson, T.; Caballero, R.; McElwain, J.C. Rising CO2 drives divergence in water use efficiency of evergreen and deciduous plants. Sci. Adv. 2019, 5, 1–11. [Google Scholar] [CrossRef] [PubMed] [Green Version]
  19. Nie, Y.; Chen, H.; Wang, K.; Tan, W.; Deng, P.; Yang, J. Seasonal water use patterns of woody species growing on the continuous dolostone outcrops and nearby thin soils in subtropical China. Plant Soil 2011, 341, 399–412. [Google Scholar] [CrossRef]
  20. Liu, W.; Su, J.; Li, S.; Lang, X.; Huang, X. Non-structural carbohydrates regulated by season and species in the subtropical monsoon broad-leaved evergreen forest of Yunnan Province, China. Sci. Rep. 2018, 8, 1–10. [Google Scholar] [CrossRef]
  21. Huang, J.-G.; Guo, X.; Rossi, S.; Zhai, L.; Yu, B.; Zhang, S.; Zhang, M. Intra-annual wood formation of subtropical Chinese red pine shows better growth in dry season than wet season. Tree Physiol. 2018, 38, 1225–1236. [Google Scholar] [CrossRef] [Green Version]
  22. Fan, J.; Ostergaard, K.T.; Guyot, A.; Fujiwara, S.; Lockington, D.A. Estimating groundwater evapotranspiration by a subtropical pine plantation using diurnal water table fluctuations: Implications from night-time water use. J. Hydrol. 2016, 542, 679–685. [Google Scholar] [CrossRef] [Green Version]
  23. Liu, H.; Økland, T.; Halvorsen, R.; Gao, J.; Liu, Q.; Eilertsen, O.; Bratli, H. Gradients analyses of forests ground vegetation and its relationships to environmental variables in five subtropical forest areas, S and SW China. Sommerfeltia 2008, 32, 3. [Google Scholar] [CrossRef]
  24. Vicente-Serrano, S.M.; López-Moreno, J.I. Hydrological response to different time scales of climatological drought: An evaluation of the Standardized Precipitation Index in a mountainous Mediterranean basin. Hydrol. Earth Syst. Sci. 2005, 9, 523–533. [Google Scholar] [CrossRef] [Green Version]
  25. Chen, D.; Wang, Y.; Liu, S.; Wei, X.; Wang, X. Response of relative sap flow to meteorological factors under different soil moisture conditions in rainfed jujube (Ziziphus jujuba Mill.) plantations in semiarid Northwest China. Agric. Water Manag. 2014, 136, 23–33. [Google Scholar] [CrossRef]
  26. Bovard, B.D.; Curtis, P.S.; Vogel, C.S.; Su, H.B.; Schmid, H.P. Environmental controls on sap flow in a northern hardwood forest. Tree Physiol. 2005, 25, 31–38. [Google Scholar] [CrossRef] [Green Version]
  27. Prior, L.D.; Bowman, D.M.J.S.; Eamus, D. Seasonal differences in leaf attributes in Australian tropical tree species: Family and habitat comparisons. Funct. Ecol. 2004, 18, 707–718. [Google Scholar] [CrossRef]
  28. Mathias, J.M.; Thomas, R.B. Global tree intrinsic water use efficiency is enhanced by increased atmospheric CO2 and modulated by climate and plant functional types. Proc. Natl. Acad. Sci. USA 2021, 118. [Google Scholar] [CrossRef] [PubMed]
  29. Granier, A. Evaluation of transpiration in a Douglas-fir stand by means of sap flow measurements. Tree Physiol. 1987, 3, 309–320. [Google Scholar] [CrossRef] [PubMed]
  30. Tie, Q.; Hu, H.; Tian, F.; Guan, H.; Lin, H. Environmental and physiological controls on sap flow in a subhumid mountainous catchment in North China. Agric. For. Meteorol. 2017, 240–241, 46–57. [Google Scholar] [CrossRef]
  31. O’Brien, J.J.; Oberbauer, S.F.; Clark, D.B. Whole tree xylem sap flow responses to multiple environmental variables in a wet tropical forest. Plant Cell Environ. 2004, 27, 551–567. [Google Scholar] [CrossRef]
  32. Zheng, C.L.; Wang, Q. Water-use response to climate factors at whole tree and branch scale for a dominant desert species in central Asia: Haloxylon ammodendron. Ecohydrology 2014, 7, 56–63. [Google Scholar] [CrossRef]
  33. Gao, J.; Zhou, J.; Sun, Z.; Niu, J.; Zhou, C.; Gu, D.; Huang, Y.; Zhao, P. Suppression of nighttime sap flux with lower stem photosynthesis in Eucalyptus trees. Int. J. Biometeorol. 2016, 60, 545–556. [Google Scholar] [CrossRef]
  34. Lu, P.; Urban, L.; Zhao, P. Granier’s thermal dissipation probe (TDP) method for measuring sap flow in trees: Theory and practice. ACTA Bot. Sin. Ed. 2004, 46, 631–646. [Google Scholar]
  35. Wang, X.P. The phytocoenological features of mixed needleleaf and broadleaf forest on subtropical mountain in Guangxi. J. Wuhan Bot. Res. 1990, 8, 243–253. [Google Scholar]
  36. Huang, K.C.; He, W.; Zhou, C.M.; Huang, Y.Q.; Zhou, L.W. Foliar physiological characteristics of Schima superba along a vertical canopy gradient. Chin. J. Ecol. 2017, 36, 2751–2758. [Google Scholar] [CrossRef]
  37. Gu, D.X.; He, W.; Huang, K.C.; Otieno, D.; Zhou, C.M.; He, C.X.; Huang, Y.Q. Transpiration of Moso bamboo in southern China is influenced by ramet age, phenology, and drought. For. Ecol. Manag. 2019, 450, 117526. [Google Scholar] [CrossRef]
  38. Pasqualotto, G.; Carraro, V.; Menardi, R.; Anfodillo, T. Calibration of granier-type (TDP) sap flow probes by a high precision electronic potometer. Sensors 2019, 19, 2419. [Google Scholar] [CrossRef] [Green Version]
  39. Pataki, D.E.; McCarthy, H.R.; Litvak, E.; Pincetl, S. Transpiration of urban forests in the Los Angeles metropolitan area. Ecol. Appl. 2011, 21, 661–677. [Google Scholar] [CrossRef] [Green Version]
  40. Kutscha, N.P.; Sachs, I.B. Color Tests for Differentiating Heartwood and Sapwood in Certain Softwood Tree Species; United States Department of Agriculture: Madison, WI, USA, 1962; Voulme 2246, p. 17.
  41. Campbell, G.S.; Norman, J.M. An Introduction to Environmental Biophysics; Springer: Berlin/Heidelberg, Germany, 1998; p. 286. [Google Scholar] [CrossRef]
  42. Breslow, N. A generalized Kruskal-Wallis test for comparing K samples subject to unequal patterns of censorship. Biometrika 1970, 57, 579–594. [Google Scholar] [CrossRef]
  43. Mann, H.B.; Whitney, D.R. On a test of whether one of two random variables is stochastically larger than the other. Ann. Math. Stat. 1947, 18, 50–60. [Google Scholar] [CrossRef]
  44. Song, G.M.; Wang, Q.; Jin, J. Leaf photosynthetic capacity of sunlit and shaded mature leaves in a deciduous forest. Forests 2020, 11, 318. [Google Scholar] [CrossRef] [Green Version]
  45. de Mendiburu, F. Agricolae: Statistical Procedures for Agricultural Research. R Package Version 1.2-3. 2015. Available online: https://mran.revolutionanalytics.com/snapshot/2016-01-01/web/packages/agricolae/agricolae.pdf#page=74 (accessed on 18 June 2021).
  46. Oguntunde, P.G. Whole-plant water use and canopy conductance of cassava under iimited available soil water and varying evaporative demand. Plant Soil 2005, 278, 371–383. [Google Scholar] [CrossRef]
  47. Wright, I.J.; Reich, P.B.; Westoby, M.; Ackerly, D.D.; Baruch, Z.; Bongers, F.; Cavender-Bares, J.; Chapin, T.; Cornelissen, J.H.C.; Diemer, M. The worldwide leaf economics spectrum. Nature 2004, 428, 821–827. [Google Scholar] [CrossRef]
  48. Markesteijn, L.; Poorter, L. Seedling root morphology and biomass allocation of 62 tropical tree species in relation to drought-and shade-tolerance. J. Ecol. 2009, 97, 311–325. [Google Scholar] [CrossRef]
  49. Sack, L.; Scoffoni, C.; John, G.P.; Poorter, H.; Mason, C.M.; Mendez-Alonzo, R.; Donovan, L.A. How do leaf veins influence the worldwide leaf economic spectrum? Review and synthesis. J. Exp. Bot. 2013, 64, 4053–4080. [Google Scholar] [CrossRef] [PubMed] [Green Version]
  50. Tian, M.; Yu, G.; He, N.; Hou, J. Leaf morphological and anatomical traits from tropical to temperate coniferous forests: Mechanisms and influencing factors. Sci. Rep. 2016, 6, 1–10. [Google Scholar] [CrossRef] [PubMed] [Green Version]
  51. Méndez-Alonzo, R.; Paz, H.; Zuluaga, R.C.; Rosell, J.A.; Olson, M.E. Coordinated evolution of leaf and stem economics in tropical dry forest trees. Ecology 2012, 93, 2397–2406. [Google Scholar] [CrossRef] [PubMed]
  52. Somavilla, N.S.; Kolb, R.M.; Rossatto, D.R. Leaf anatomical traits corroborate the leaf economic spectrum: A case study with deciduous forest tree species. Braz. J. Bot. 2014, 37, 69–82. [Google Scholar] [CrossRef]
  53. Huang, D.W.; Zhang, D.Q.; Zhou, G.Y.; Liu, S.Z.; Dennis, O.; Lin, L.Y. Characteristics of dominant tree species stem sap flow and their relationships with environmental factors in a mixed conifer-broadleaf forest in Dinghushan, Guangdong Province of South China. Chin. J. Appl. Ecol. 2012, 23, 1159–1166. [Google Scholar]
  54. Meinzer, F.C.; Goldstein, G.; Franco, A.C.; Bustamante, M.; Igler, E.; Jackson, P.; Caldas, L.; Rundel, P.W. Atmospheric and hydraulic limitations on transpiration in Brazilian cerrado woody species. Funct. Ecol. 1999, 13, 273–282. [Google Scholar] [CrossRef]
  55. Sperry, J.S.; Pockman, W.T. Limitation of transpiration by hydraulic conductance and xylem cavitation in Betula occidentalis. Plant Cell Environ. 1993, 16, 279–287. [Google Scholar] [CrossRef]
  56. McAdam, S.A.M.; Brodribb, T.J. Fern and lycophyte guard cells do not respond to endogenous abscisic acid. Plant Cell 2012, 24, 1510–1521. [Google Scholar] [CrossRef] [PubMed] [Green Version]
  57. Yoshifuji, N.; Komatsu, H.; Kumagai, T.; Tanaka, N.; Tantasirin, C.; Suzuki, M. Interannual variation in transpiration onset and its predictive indicator for a tropical deciduous forest in northern Thailand based on 8-year sap-flow records. Ecohydrology 2011, 4, 225–235. [Google Scholar] [CrossRef]
  58. Niinemets, Ü. Stomatal conductance alone does not explain the decline in foliar photosynthetic rates with increasing tree age and size in Picea abies and Pinus sylvestris. Tree Physiol. 2002, 22, 515–535. [Google Scholar] [CrossRef] [Green Version]
  59. Zhang, Z.Z.; Zhang, J.X.; Si, Y.; Zhao, P. Conduits anatomical structure and leaf traits of diffuse- and ring-porous stems in subtropical evergreen broad-leaved forests. Chin. J. Plant Ecol. 2019, 43, 131–138. [Google Scholar] [CrossRef]
  60. Brinkmann, N.; Eugster, W.; Zweifel, R.; Buchmann, N.; Kahmen, A. Temperate tree species show identical response in tree water deficit but different sensitivities in sap flow to summer soil drying. Tree Physiol. 2016, 36, 1508–1519. [Google Scholar] [CrossRef] [Green Version]
  61. Haberle, K.-H.; Reiter, I.; Patzner, K.; Heyne, C.; Matyssek, R. Switching the light off: A break in photosynthesis and sap flow of forest trees under total solar eclipse. Meteorol. Z. 2001, 10, 201–206. [Google Scholar] [CrossRef]
  62. Niinemets, Ü. The controversy over traits conferring shade-tolerance in trees: Ontogenetic changes revisited. J. Ecol. 2006, 94, 464–470. [Google Scholar] [CrossRef]
  63. Rozendaal, D.M.A.; Hurtado, V.H.; Poorter, L. Plasticity in leaf traits of 38 tropical tree species in response to light; relationships with light demand and adult stature. Funct. Ecol. 2006, 20, 207–216. [Google Scholar] [CrossRef]
  64. Roderick, M.L.; Berry, S.L.; Noble, I.R. A framework for understanding the relationship between environment and vegetation based on the surface area to volume ratio of leaves. Funct. Ecol. 2000, 14, 423–437. [Google Scholar] [CrossRef]
  65. Yamane, T.; Hamana, Y.; Nakano, M. Detection of water-deficit stress from daily sap flow profiles in peach. J. Jpn. Soc. Hortic. Sci. 2011, 80, 383–389. [Google Scholar] [CrossRef]
  66. Granier, A.; Claustres, J.P. Water relations of a Norway spruce (Picea abies) tree growing in natural condition: Variation within the tree. Acta Oecologica 1989, 10, 295–310. [Google Scholar]
  67. Pataki, D.E.; Oren, R.; Smith, W.K. Sap flux of co-occurring species in a western subalpine forest during seasonal soil drought. Ecology 2000, 81, 2557–2566. [Google Scholar] [CrossRef]
  68. Gonzalez-Benecke, C.A.; Martin, T.A.; Cropper, W.P. Whole-tree water relations of co-occurring mature Pinus palustris and Pinus elliottii var. elliottii. Can. J. For. Res. 2011, 41, 509–523. [Google Scholar] [CrossRef] [Green Version]
  69. Zinnert, J.C.; Shiflett, S.A.; Vick, J.K.; Young, D.R. Plant functional traits of a shrub invader relative to sympatric native shrubs. Ecosphere 2013, 4, 1–11. [Google Scholar] [CrossRef]
  70. Williams, M.; Bond, B.J.; Ryan, M.G. Evaluating different soil and plant hydraulic constraints on tree function using a model and sap flow data from ponderosa pine. Plant. Cell Environ. 2001, 24, 679–690. [Google Scholar] [CrossRef]
  71. Phillips, N.; Nagchaudhuri, A.; Oren, R.; Katul, G. Time constant for water transport in loblolly pine trees estimated from time series of evaporative demand and stem sapflow. Trees 1997, 11, 412–419. [Google Scholar] [CrossRef]
  72. Granier, A.; Biron, P.; Lemoine, D. Water balance, transpiration and canopy conductance in two beech stands. Agric. For. Meteorol. 2000, 100, 291–308. [Google Scholar] [CrossRef]
  73. Chuang, Y.L.; Oren, R.; Bertozzi, A.L.; Phillips, N.; Katul, G.G. The porous media model for the hydraulic system of a conifer tree: Linking sap flux data to transpiration rate. Ecol. Modell. 2006, 191, 447–468. [Google Scholar] [CrossRef]
  74. Ferreras, A.E.; Whitworth-Hulse, J.I.; Tecco, P.A.; Marcora, P.I.; Funes, G. Environmental constraints to native woody species recruitment in invaded mountain woodlands of central Argentina. For. Ecol. Manag. 2019, 440, 189–201. [Google Scholar] [CrossRef]
  75. Zeppel, M.J.B.; Murray, B.R.; Barton, C.; Eamus, D. Seasonal responses of xylem sap velocity to VPD and solar radiation during drought in a stand of native trees in temperate Australia. Funct. Plant Biol. 2004, 31, 461–470. [Google Scholar] [CrossRef] [PubMed]
  76. Tsuda, M.; Tyree, M.T. Plant hydraulic conductance measured by the high pressure flow meter in crop plants. J. Exp. Bot. 2000, 51, 823–828. [Google Scholar] [CrossRef] [PubMed]
  77. Kellomäki, S.; Wang, K. Sap flow in Scots pines growing under conditions of year-round carbon dioxide enrichment and temperature elevation. Plant Cell Environ. 1998, 21, 969–981. [Google Scholar] [CrossRef]
  78. Gindaba, J.; Rozanov, A.; Negash, L. Response of seedlings of two Eucalyptus and three deciduous tree species from Ethiopia to severe water stress. For. Ecol. Manag. 2004, 201, 119–129. [Google Scholar] [CrossRef]
  79. Kröber, W.; Heklau, H.; Bruelheide, H. Leaf morphology of 40 evergreen and deciduous broadleaved subtropical tree species and relationships to functional ecophysiological traits. Plant Biol. 2015, 17, 373–383. [Google Scholar] [CrossRef]
Figure 1. Daily averaged vapor pressure deficit (VPD, kPa), photosynthetic photon flux density (PPFD, μmol m−2 s−1) (a); soil water content (SWC, m3·m3), and soil temperature (SoilTem, °C) (b); total daily precipitation (mm) (c) from 17 May 2016 to 31 March 2019. Missing data were due to instrument or power failure.
Forests 12 01007 g001
Figure 2. Daily average of sap flux densities in evergreen broad-leaved trees (EBL), deciduous broad-leaved trees (DBL), and conifers (CON) between May 2016 and March 2019. Missing data were due to instrument or power failure.
Forests 12 01007 g002
Figure 3. Mean daily sap flux densities of evergreen broad-leaved trees (EBL), deciduous broad-leaved trees (DBL), and conifers (CON) in the wet and dry seasons during the study periods. The central square represents the average value and the central solid line represents the median; bars extend to the 95% confidence limits; the dots represent outliers. Different letters above the bars denote statistically significant differences between functional types and seasons at p < 0.05.
Forests 12 01007 g003
Figure 4. Diurnal patterns of mean sap flux densities (Mean ± SE) of selected evergreen broad-leaved trees (EBL), deciduous broad-leaved trees (DBL), and conifers (CON) during the dry (25 July 2017 to 27 July 2017) and wet (17 January 2018 to 19 January 2018) season on sunny days. Bars are ± SE.
Forests 12 01007 g004
Figure 5. Responses of daily averaged sap flux densities of evergreen broad-leaved trees (EBL), deciduous broad-leaved trees (DBL), and conifers (CON) to PPFD in the wet and dry seasons between May 2016 and March 2019.
Forests 12 01007 g005
Figure 6. Diurnal sap flux densities of evergreen broad-leaved trees (EBL), deciduous broad-leaved trees (DBL), and conifers (CON) response to VPD. Data were collected from sunny days in wet (from 25 July 2017 to 27 July 2017) and dry (from 17 January 2018 to 19 January 2018) seasons. The arrows show the chronological order.
Forests 12 01007 g006
Table 1. Sample tree diameters at breast height (1.3 m above soil surface) and their sapwood depths at different dates during the study period. Trees are grouped according to functional types, including evergreen broad-leaved trees, EBL; deciduous broad-leaved trees, DBL; coniferous, CON.
Plant Functional TypesSpeciesTree NOTree Diameters (DBH)Sapwood DepthSapwood Depth Formula
May 2016 (cm)December 2016 (cm)January 2018 (cm)May 2016 (cm)December 2016 (cm)January 2018
(cm)
Evergreen broad-leaved trees (EBL)C. fissa112.413.214.36.016.016.19y = 0.0029 X2 + 0.0975x + 4.2639
220.220.5217.447.517.62
321.824.225.27.88.348.56
S. superba112.713.1143.613.734y = 0.3017x − 0.2219
212.212.613.13.463.583.73
317.618.919.25.095.485.57
Deciduous broad-leaved trees (DBL)C. henryi120.120.5214.95.085.31y = 0.0095X2 + 0.0533x − 0.0111
29.510.3111.351.551.73
31111.612.21.731.892.06
L. formosana111.71818.84.637.137.46y = 0.0046X2 + 0.2447x + 1.174
211.111.712.44.414.634.88
314.313.5145.625.305.5
Coniferous (CON)P. massoniana133.533.7388.878.9510.67y = 0.0032X2 + 0.1691x − 0.4093
235.93737.79.8210.2610.55
326.428.128.86.36.897.13
Table 2. Direct (in bold) and indirect effects of environment variables on sap flux densities in evergreen broad-leaved trees (EBL), deciduous broad-leaved trees (DBL), and conifers (CON) at the daily scale in the dry and wet seasons using path analysis.
SeasonsEnvironment VariablesPlant Functional TypesSWCSoilTemPPFDVPD
Wet seasonSWCEBL0.29−0.03−0.12−0.06
DBL0.220.00−0.16−0.03
CON0.41−0.03−0.12−0.07
SoilTemEBL−0.060.130.120.05
DBL−0.040.030.160.03
CON−0.080.150.110.06
PPFDEBL−0.080.030.460.23
DBL−0.060.010.610.13
CON−0.110.040.430.25
VPDEBL−0.060.020.340.31
DBL−0.040.000.450.17
CON−0.080.030.320.34
Dry seasonSWCEBL−0.03−0.05−0.12−0.02
DBL0.11−0.12−0.08−0.02
CON−0.13−0.01−0.07−0.09
SoilTemEBL0.010.160.320.02
DBL−0.040.390.230.02
CON0.040.040.190.09
PPFDEBL0.010.070.720.04
DBL−0.020.170.530.04
CON0.020.020.440.18
VPDEBL0.010.060.520.06
DBL−0.040.150.380.05
CON0.040.020.310.26
Table 3. Direct (in bold) and indirect effects of environment variables on sap flux densities of evergreen broad-leaved trees (EBL), deciduous broad-leaved trees (DBL), and conifers (CON) as revealed by path analysis at the diurnal course scale in the dry (from 25 July 2017 to 27 July 2017) and wet (from 17 January 2018 to 19 January 2018) season on sunny days.
SeasonsEnvironment VariablesPlant Functional TypesSWCSoilTemPPFDVPD
Wet seasonSWCEBL−0.380.550.01−0.23
DBL0.070.040.02−0.22
CON−0.160.320.01−0.26
SoilTemEBL0.35−0.60−0.080.24
DBL−0.06−0.05−0.100.22
CON0.15−0.34−0.070.27
PPFDEBL−0.010.120.400.41
DBL0.000.010.510.39
CON0.000.070.360.46
VPDEBL0.14−0.230.260.62
DBL−0.02−0.020.340.58
CON0.06−0.130.240.70
Dry seasonSWCEBL−0.070.17−0.03−0.27
DBL−0.140.020.02−0.36
CON−0.140.21−0.03−0.27
SoilTemEBL0.06−0.19−0.020.27
DBL0.13−0.020.010.36
CON0.13−0.22−0.010.27
PPFDEBL0.010.010.380.43
DBL0.010.00−0.180.57
CON0.010.010.320.43
VPDEBL0.03−0.070.230.71
DBL0.06−0.01−0.110.94
CON0.05−0.090.190.71
Publisher’s Note: MDPI stays neutral with regard to jurisdictional claims in published maps and institutional affiliations.

