Article

Haptic and Aesthetic Properties of Heat-Treated Modified Birch Wood

1
Department of Wood Processing and Biomaterials, Faculty of Forestry and Wood Sciences, Czech University of Life Sciences Prague, 16500 Prague, Czech Republic
2
Faculty of Forestry and Wood Sciences, Czech University of Life Sciences Prague, 16500 Prague, Czech Republic
*
Author to whom correspondence should be addressed.
Forests 2021, 12(8), 1081; https://doi.org/10.3390/f12081081
Submission received: 16 June 2021 / Revised: 26 July 2021 / Accepted: 11 August 2021 / Published: 13 August 2021
(This article belongs to the Special Issue Thermal Modification of Wood: Process and Properties)

Abstract

:
This paper deals with the effect of heat treatment on the selected physical properties of birch wood. Five stages of heat treatment were used, ranging from 160 °C to 200 °C, in 10 °C increments, having a peak treatment duration of 3 h for each level. Primarily, changes in thermal characteristics, namely conductivity, diffusivity, effusivity, volume heat capacity, changes in colour and gloss parameters, mass loss due to modification and different moisture content in wood under given equilibrium climatic conditions, were monitored. The ISOMET 2114 analyser was used to measure the thermal characteristics. The measurement principle of this analyser is based on the analysis of the thermal response of the analysed material to pulses of heat flow. Measurements of colour, gloss, density and moisture content were carried out according to harmonised EN standards. The aim was to experimentally verify the more or less generally known more positive perception of heat-treated wood, both by touch and sight, i.e., the warmer perception of darker brown shades of wood. In terms of thermal characteristics, the most interesting result is that they gradually decrease with increasing treatment temperature. For example, at the highest treatment temperature of 200 °C, there is a decrease in thermal conductivity by 20.2%, a decrease in volume heat capacity by 15.0%, and a decrease in effusivity by 17.7%. The decrease in thermal conductivity is nearly constant at all treatment levels, specifically at this treatment temperature, by 6.0%. The fact mentioned above is positive in terms of the tactile perception of such treated wood, which can have a positive effect, for example, in furniture with surface application of heat-treated veneers, which are perceived positively by the majority of the human population visually or as a cladding material in saunas. In this context, it has been found that the thermal modification at the above-mentioned treatment temperature of 200 °C results in a decrease in brightness by 44.0%, a decrease in total colour difference by 38.4%, and a decrease in gloss (at an angle of 60°) by 18.2%. The decrease in gloss is only one essential negative aspect that can be addressed by subsequent surface treatment. During the heat treatment, there is also a loss of mass in volume, e.g., at a treatment temperature of 200 °C and subsequent conditioning to an equilibrium moisture content in a conditioning chamber with an air temperature of 20 ± 2 °C and relative humidity of 65 % ± 5%, there was a decrease by 7.9%. In conclusion, the experiments clearly confirmed the hypothesis of a positive perception of heat-treated wood in terms of haptics and aesthetics.

1. Introduction

In the area of Central Europe, birch is, on the one hand, considered an important ameliorative, hardening and pioneering tree species, and, on the other hand, it is often considered an undesirable admixture which, due to its rapid initial growth, can adversely inhibit the growth of target tree species. Nowadays, in view of spruce stands destruction, there is an opportunity to direct the development of the mainly self-sown birch up to the clearing age. A shift in the view of birch from a weedy tree species to an alternative economic tree species is possible in the Czech Republic, even in view of the above. In addition to the use of birch wood for energy purposes, where lower monetisation of timber for forest owners can be expected, the high-quality birch round-timber assortments are possible to be used for products with higher added value, for example, for furniture purposes [1]. This paper aims to provide forest assets managers with important information on the impact and meaningfulness of their activities in relation to the quality of birch timber and its better valuation. This paper is a sequel to the previous papers, namely Borůvka et al. 2018, Borůvka et al. 2019, and Dudík et al. 2020 [2,3,4], focused on the study of elasticity and strength properties, dimensional stability of wood from different sites before and after its heat treatment, as well as surface properties of wood in the form of veneers, and marketing appreciation of the birch wood thermal treatment process and its possible use in practice under the conditions in the Czech Republic.
As generally known, there are wood changes at the structure level from its chemical level and, of course, its properties due to heat treatment with respect to the applied temperature; see the literature for examples [5,6,7,8,9]. The issue related to the impact on haptic properties, mainly related to the objective assessment of the perceived temperature of surfaces by measuring thermal characteristics, i.e., the issue of relevant justification of tactile subjective perception is potentially less scientifically discussed and described [10,11].
Environmental comfort is created by many factors, including the appearance and temperature of the material surfaces. The surface properties of wood largely determine its quality in terms of using this natural material, not only in the interior (e.g., furniture) but also in the exterior (e.g., cladding material). Subjectively, untreated “natural” wood is judged positively both by sight and touch, and heat-modified wood is no different. A more positive perception of heat-treated wood, i.e., a warmer perception of darker brown shades of wood, is generally accepted by touch and sight. Untreated birch wood is perceived as “drab”—visually uninteresting and not very durable. The research in this paper focuses on objective measurements of the colour and gloss, particularly the thermal characteristics of heat-treated wood, and a comparison of the values obtained with measurements before the modification thereof.
There are several approaches to measuring thermal properties (guarded hot plate and heat flow meter methods, transient hot-strip methods, transient heat methods, laser flash methods, hot disk sensor methods, steady-state methods), depending primarily on the material under test and its intended application [12]. This can be seen, for example, in the standards ASTM D5334-08, ASTM C1113/C1113M-09(2019), ISO 8301:1991 and ISO 8302:1991, ISO 22007-2:2015, JIS R 1611:1997, ČSN EN 12664 and ČSN EN 12667 [13,14], with the information in the papers dealing with this issue found in the literature [15,16,17,18,19,20,21,22,23,24,25,26,27,28,29,30,31,32]. Research dating back about 100 years or more [33,34,35] and the fundamental classical literature of thermal physics [36,37,38] can be considered the basis for this. For wood, the standardised test is the “Determination of thermal resistance by means of guarded hot plate and heat flow meter methods” according to ČSN EN 12664 [13]; however, due to the demanding instrumentation, other methods are also used, e.g., measurements based on the analysis of the temperature response of the analysed material to heat flow pulses. Wood is an anisotropic, inhomogeneous, hygroscopic and porous material, with the occurrence of defects, anomalies, etc., making these characteristics highly variable due to many factors [39,40]. In terms of anisotropy alone, there is a significant difference among the directions, e.g., the thermal conductivity in the longitudinal direction is two to three times higher than in the direction perpendicular to the fibres. In addition, there is a relevant difference between the radial and tangential directions [41,42]. Of course, the moisture content of the wood also has a significant influence, as does the pore volume, which results from the very different thermal properties of the wood substance, water and air.
Generally, wood has a low temperature acceptance and consequently conducts less heat on touch, making the material feel warmer. On the other hand, this characteristic significantly affects accumulation. Wood accumulates heat up to 13 times less than, for example, concrete [36].
This paper is primarily intended to result in a targeted expansion of the database dealing with this issue and, thus, contribute to understanding the human perception of temperature, colour and gloss of surfaces. The paper does not aim to address specific values so much as the differences among the individual levels of modification and untreated wood. In any case, this paper’s primary intention and its focus on the objective measurement of the thermal properties of heat-treated wood should be kept in mind. The thermal characteristics of the heat-treated wood have not yet been the subject of extensive research. This article should thus contribute to closing the research gap.

2. Materials and Methods

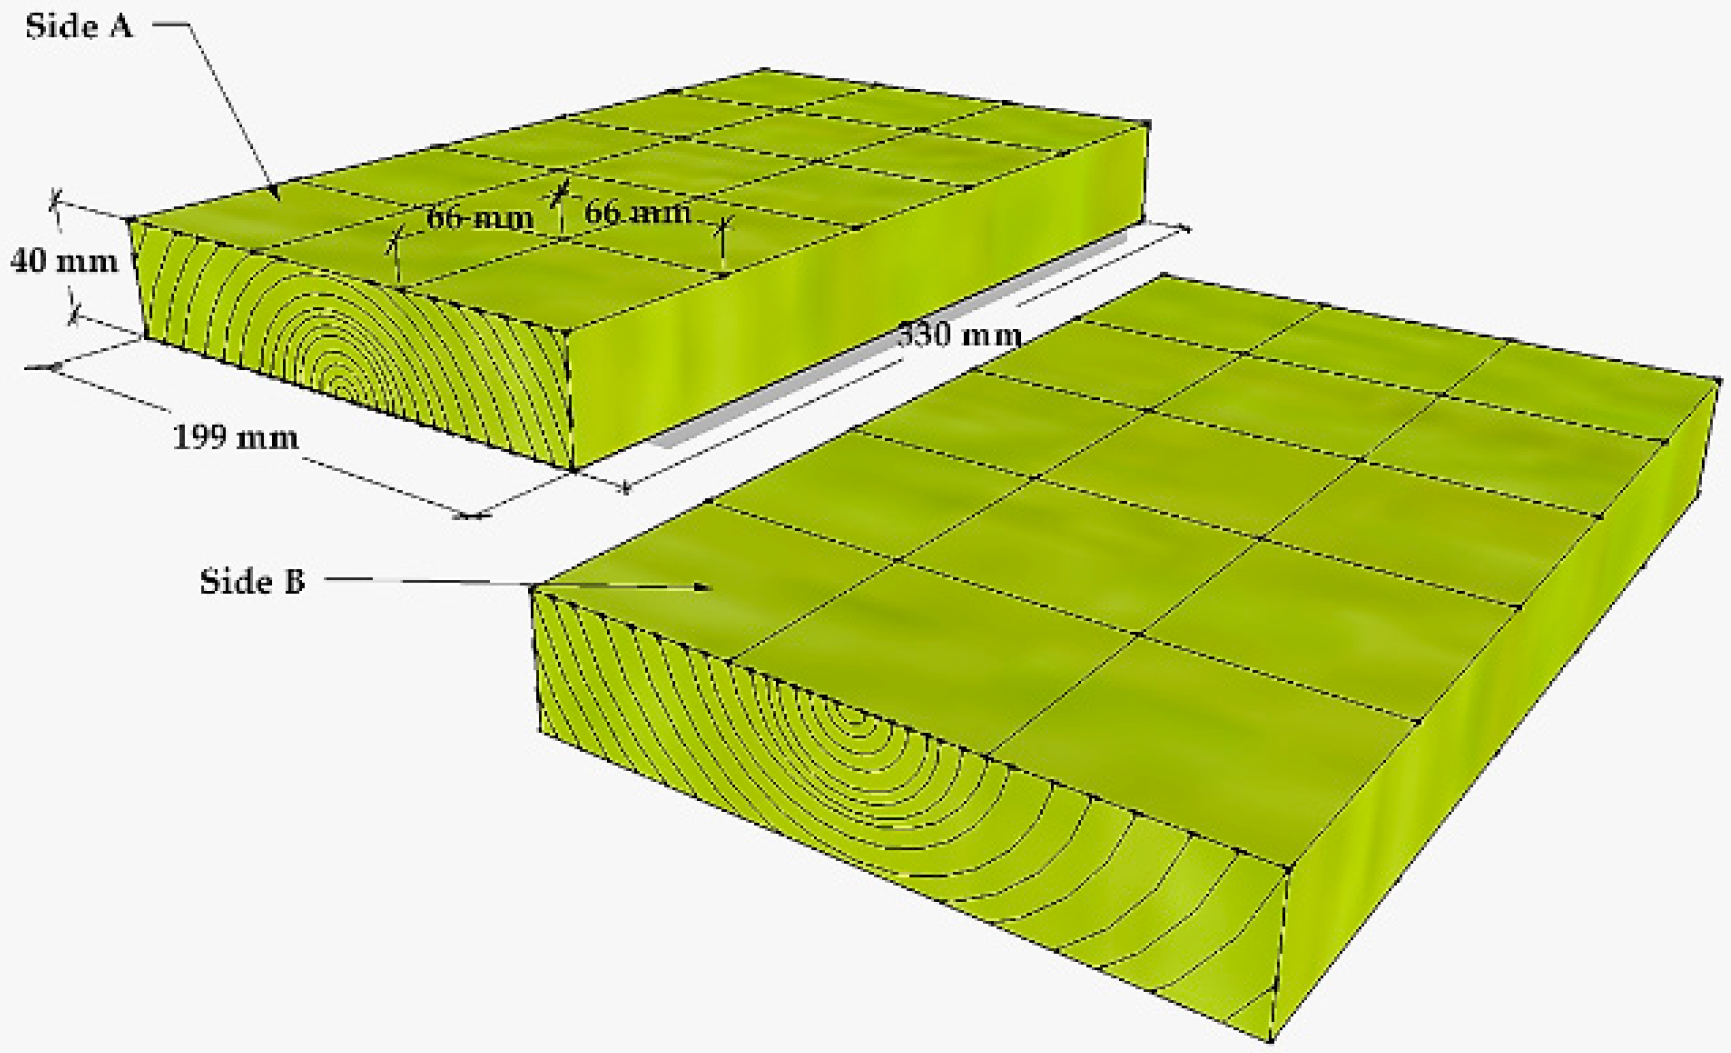
The preparation of the test specimens was based on the ČSN 49 0101 [43]. The samples were made of the wood of European white birch (Betula pendula Roth). The tree trunk cutout of about 2 m in length was taken from the basal part of the tree, which was located within the stand of the School Forest Enterprise of the Czech University of Life Sciences in Kostelec nad Černými Lesy (Czech Republic). A tangential grain pattern board was manipulated from this cutout, from which, after drying to an air-dry state (approximately 15% of moisture content), test samples measuring 40 × 199 × 330 mm were manipulated. The reason for choosing the tangential board consists in more frequent occurrence in actual practical usage. The principle of cutting the board down to the final test specimens is illustrated in Figure 1, with no emphasis on the samples’ defect-free (clean) nature in terms of ingrown knots. The prepared samples were conditioned using a ClimeEvent C/2000/40/3 climate chamber (Weiss Umwelttechnik GmbH, Reiskirchen, Germany). In the climate chamber, the air parameters were set so that the resulting absolute moisture of the wood was about 12%. Therefore, conditioning of the test specimens was carried out until the equilibrium moisture of the wood was stabilised in a controlled environment with an air temperature of 20 ± 2 °C and relative humidity of 65% ± 5%.
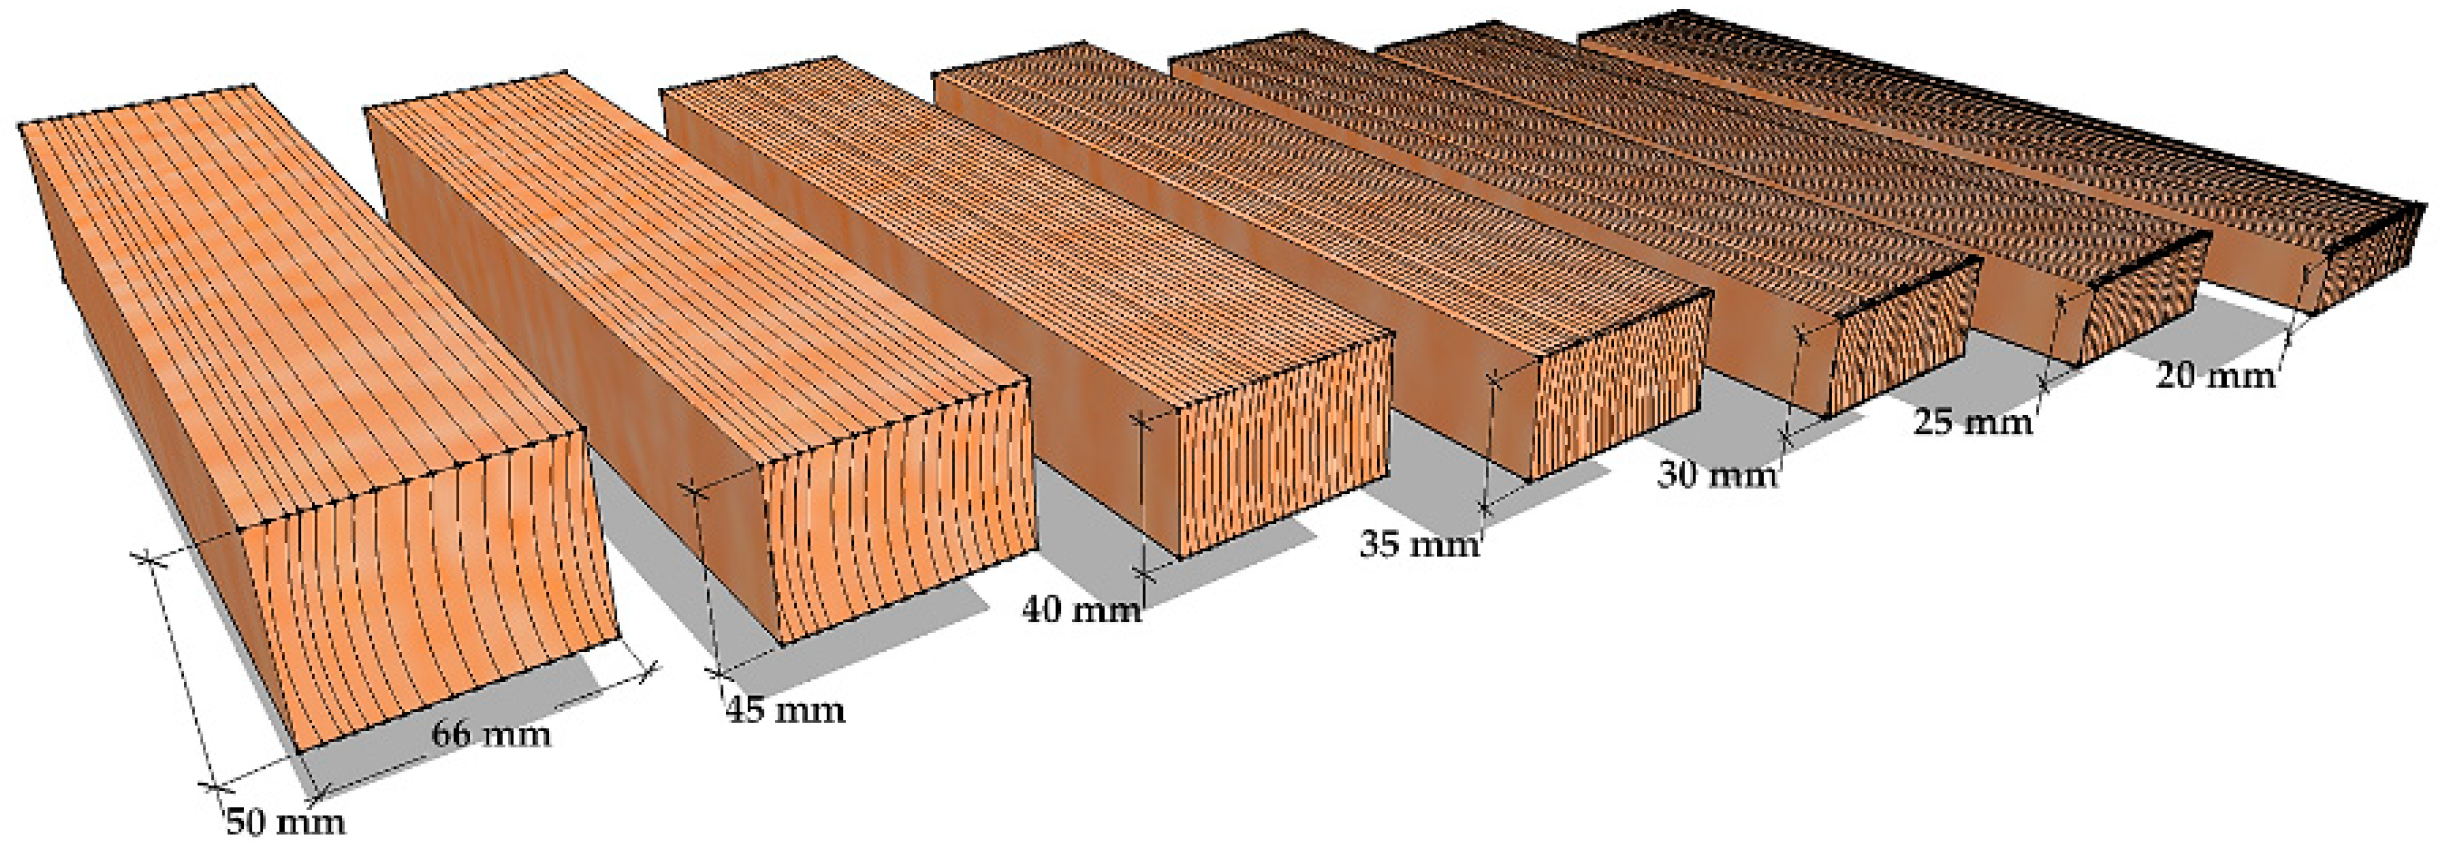
Subsequently, all the experiments described below were carried out on these samples, i.e., the properties of the wood in the unmodified reference state were determined. The samples were then subjected to a heat-treatment process in an air atmosphere at temperatures ranging from 160 °C to 200 °C, in 10 °C increments, with a peak treatment duration of 3 h for each level. The process was carried out in accordance with the well-known Finnish patent for thermal modification of wood; to see EP-0759137 [44]. The process of thermal modification took place in the laboratory high-temperature chamber A type KHT (Katres Ltd., Jihlava, Czech Republic), with a filling capacity of 0.38 m3, maximum load capacity of 150 kg, maximum working temperature of 250 °C, and energy consumption of 3 kWh. During the treatment, a water screen, i.e., spraying, was used instead of the overheated steam used in the Finnish technology. The detailed production process is described in the reference, see Borůvka et al. 2019, and Dudík et al. 2020 [3,4]. The thermally treated test specimens were then re-conditioned to stabilise equilibrium moisture content in an environment with a relative humidity of 65 ± 5% and a temperature of 20 ± 2 °C; see the description above. The heat-treated samples had to be surface-aligned for further experiments because of the deformations caused by uneven shrivelling in each anatomical direction, in the same manner of alignment as for untreated wood. Subsequently, all the experiments described below were again performed on these samples, i.e., the properties for each level of heat-treated wood were determined. In addition, because of the necessary alignment, the thermal characteristics were also determined on a special radial test sample manipulated from a central radial board originating from the same cutout as the tangential board. This sample was successively aligned in thickness, each time by 5 mm (Figure 2). The reason for this was to determine the effect of sample thickness on thermal characteristics, wherein the parameter values were monitored primarily at thicknesses of 30, 35 and 40 mm.
At the same air temperature and relative humidity, the following thermal properties were determined: specific thermal conductivity λ (W/m.K), i.e., conductivity, volume heat capacity ρ.c (J/m3.K), and thermal conductivity a (m2/s), i.e., diffusivity. An ISOMET 2114 instrument (Applied Precision Ltd., Bratislava, Slovakia) applying a dynamic measurement method that allows for shorter measurement times compared to steady-state measurement methods was used to determine these properties. The measurement principle is based on the analysis of the temperature response of the material under analysis to heat flow pulses, whereby the heat flow is excited by the electrical heating of a resistive heater inserted into a probe being in direct thermal contact with the sample under test. Thus, the instrument allows simultaneous measurement of all three quantities using the non-stationary source method. There is a relationship among these quantities [42]:
a = λ ρ   ×   c
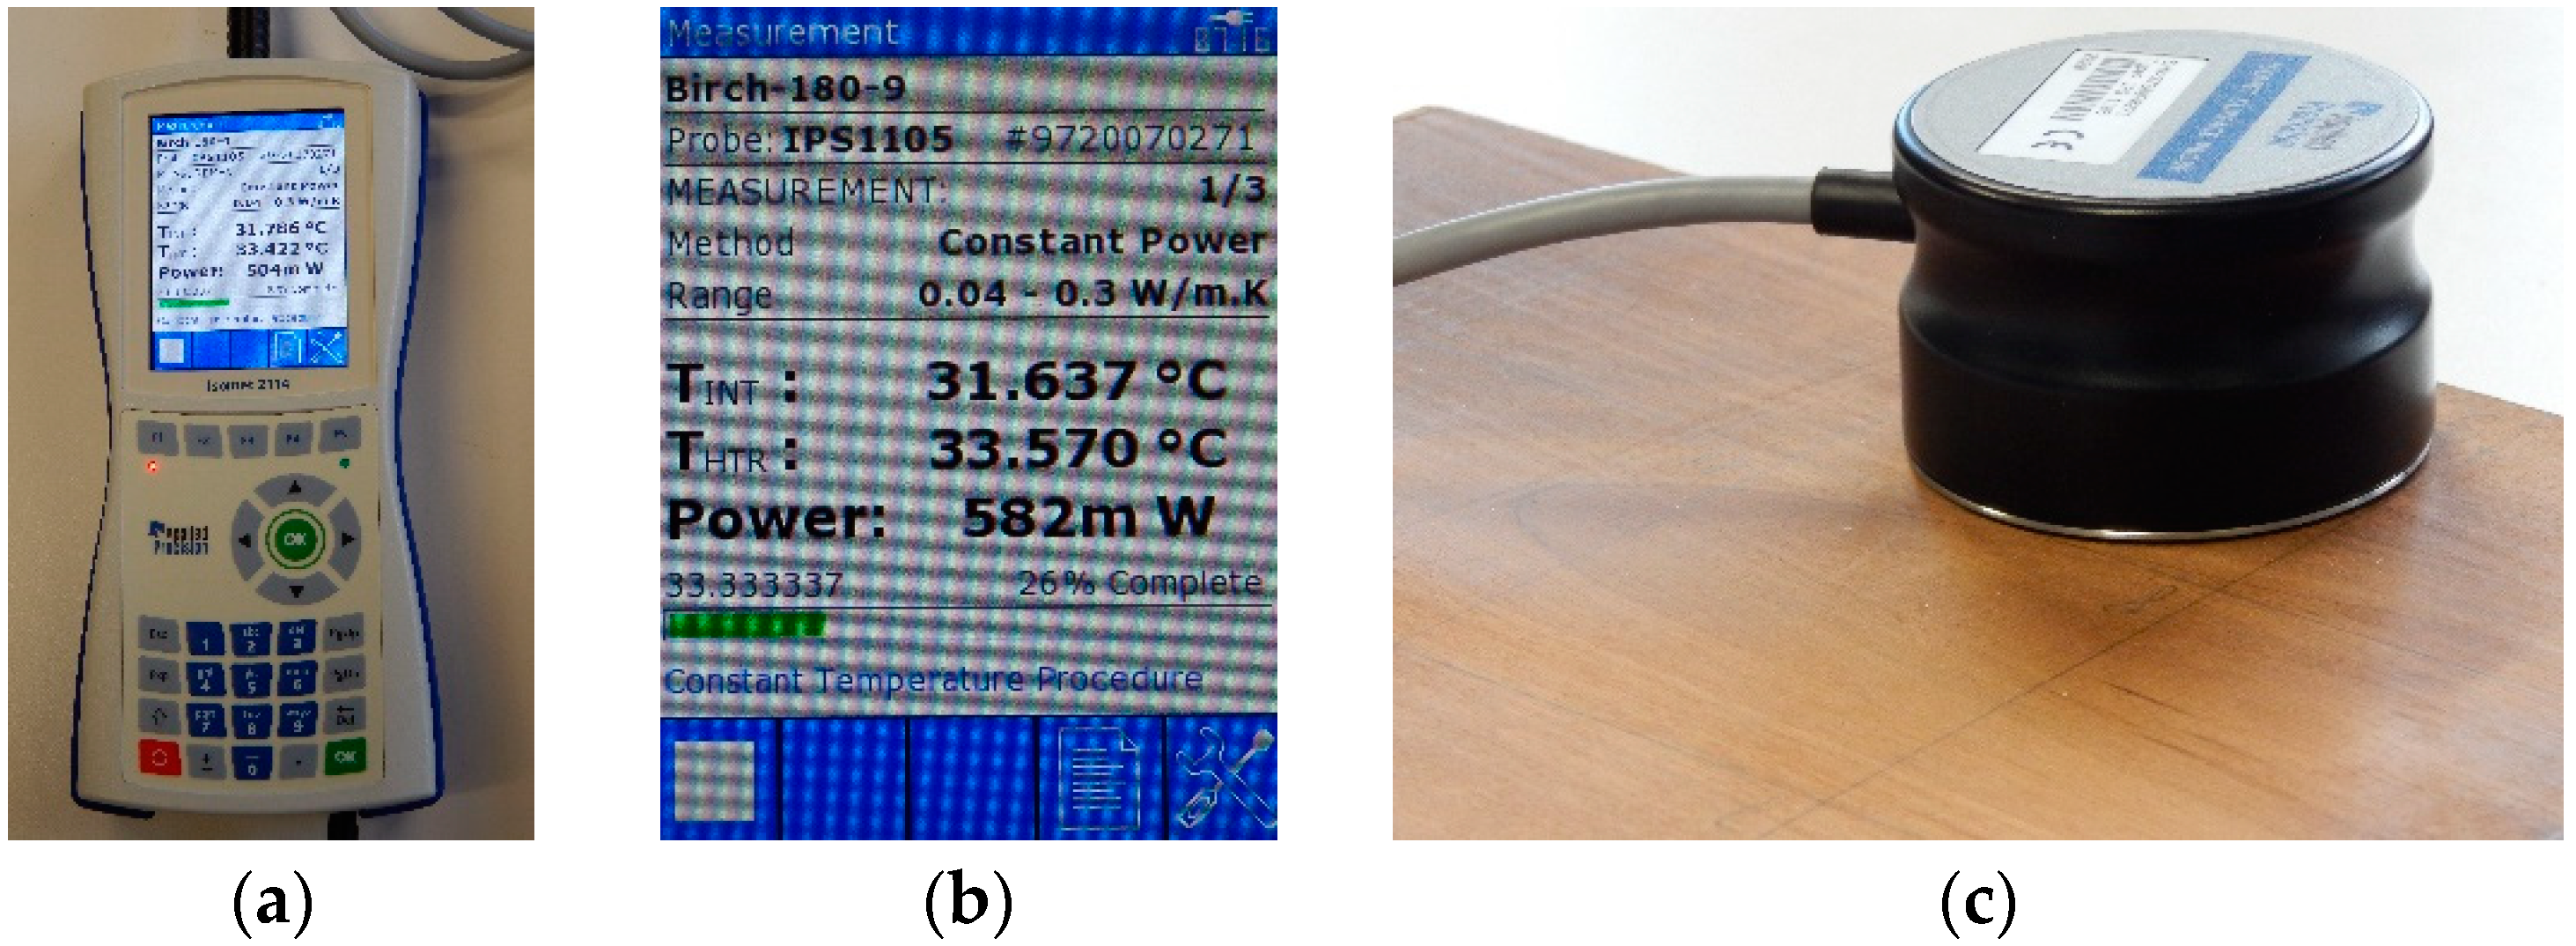
A surface area probe calibrated for a thermal conductivity range from 0.04 to 0.30 W/m.K was connected to the instrument; wherein three measurements were taken on each sample area being measured with a time delay of 100 sec and a temperature difference of 10.0 K (Figure 3). An example of the instrument along with the probe and its location on the sample is shown in Figure 4.
In addition, the heat acceptance b (W.s/m.K), i.e., the effusivity, which characterises the heat dissipation rate, was used for the evaluation. This parameter is mainly used in the construction industry to assess flooring materials. It is considered the most suitable parameter due to the highest sensitivity for comparison with human temperature perception. Therefore, this is an ideal parameter for an objective assessment of the perceived temperature of surfaces. It is calculated according to the relation [10]:
b =   λ   ×   ρ   ×   c  
Standard colour measurements (CIEL*a*b*) were, as all experiments, carried out on untreated and heat-treated samples using a Spectrophotometer CM-600d (Konica Minolta, Osaka, Japan) in accordance with ČSN EN ISO 11664-4 and ČSN EN ISO 11664-6 [45,46]. The total colour difference of the wood relative to the white colour before and after heat modification was determined by the colourimetric parameter ΔE*, which is calculated as the square root of the sum of the squares of the partial differences (ΔL* is the difference on the brightness axis, Δa* is the difference on the green–red axis and Δb* is the difference on the blue–yellow axis), see Formula (3). Therefore, it expresses the shortest distance between the coordinates of a standard, the white colour in this case, and the sample in the colour space.
Δ E * = ( Δ L * ) 2 + ( Δ a * ) 2 + ( Δ b * ) 2
The gloss was measured using an MG268-F2 gloss meter (KSJ, Quanzhou, China) in accordance with the ČSN EN ISO 2813 [47], the results at an angle of 60° being considered the most determinative.
In addition, the density of the conditioned test specimens was determined according to the procedure described in the ČSN 49 0108 [48]. The individual test specimens were weighed using a Kern PCB 2500-2 laboratory scales (KERN & SOHN GmbH, Balingen, Germany) with an accuracy of 0.01 g. The dimensions of the test specimens were measured using a Kinex 6040-27-150 calliper (KINEX Measuring s.r.o., Prague, Czech Republic) with an accuracy of 0.01 mm. The general formula was used to calculate the density ρw (kg/m3):
ρ w = m w V w   ,
where mw (kg) is the weight of wet wood at absolute moisture content w (%), and Vw (m3) is the volume of wet wood at absolute moisture content w (%), which is calculated by following formula based on the ČSN 49 0103 [49]:
w = m w     m 0 m 0 ·   100   ,
where mw (kg) is the mass of wet wood and m0 (kg) is the mass of absolutely dry wood. The samples were oven-dried in a Binder FD 115 dryer (Binder Inc., Tuttlingen, Germany) at a standard temperature of 103 ± 2 °C.
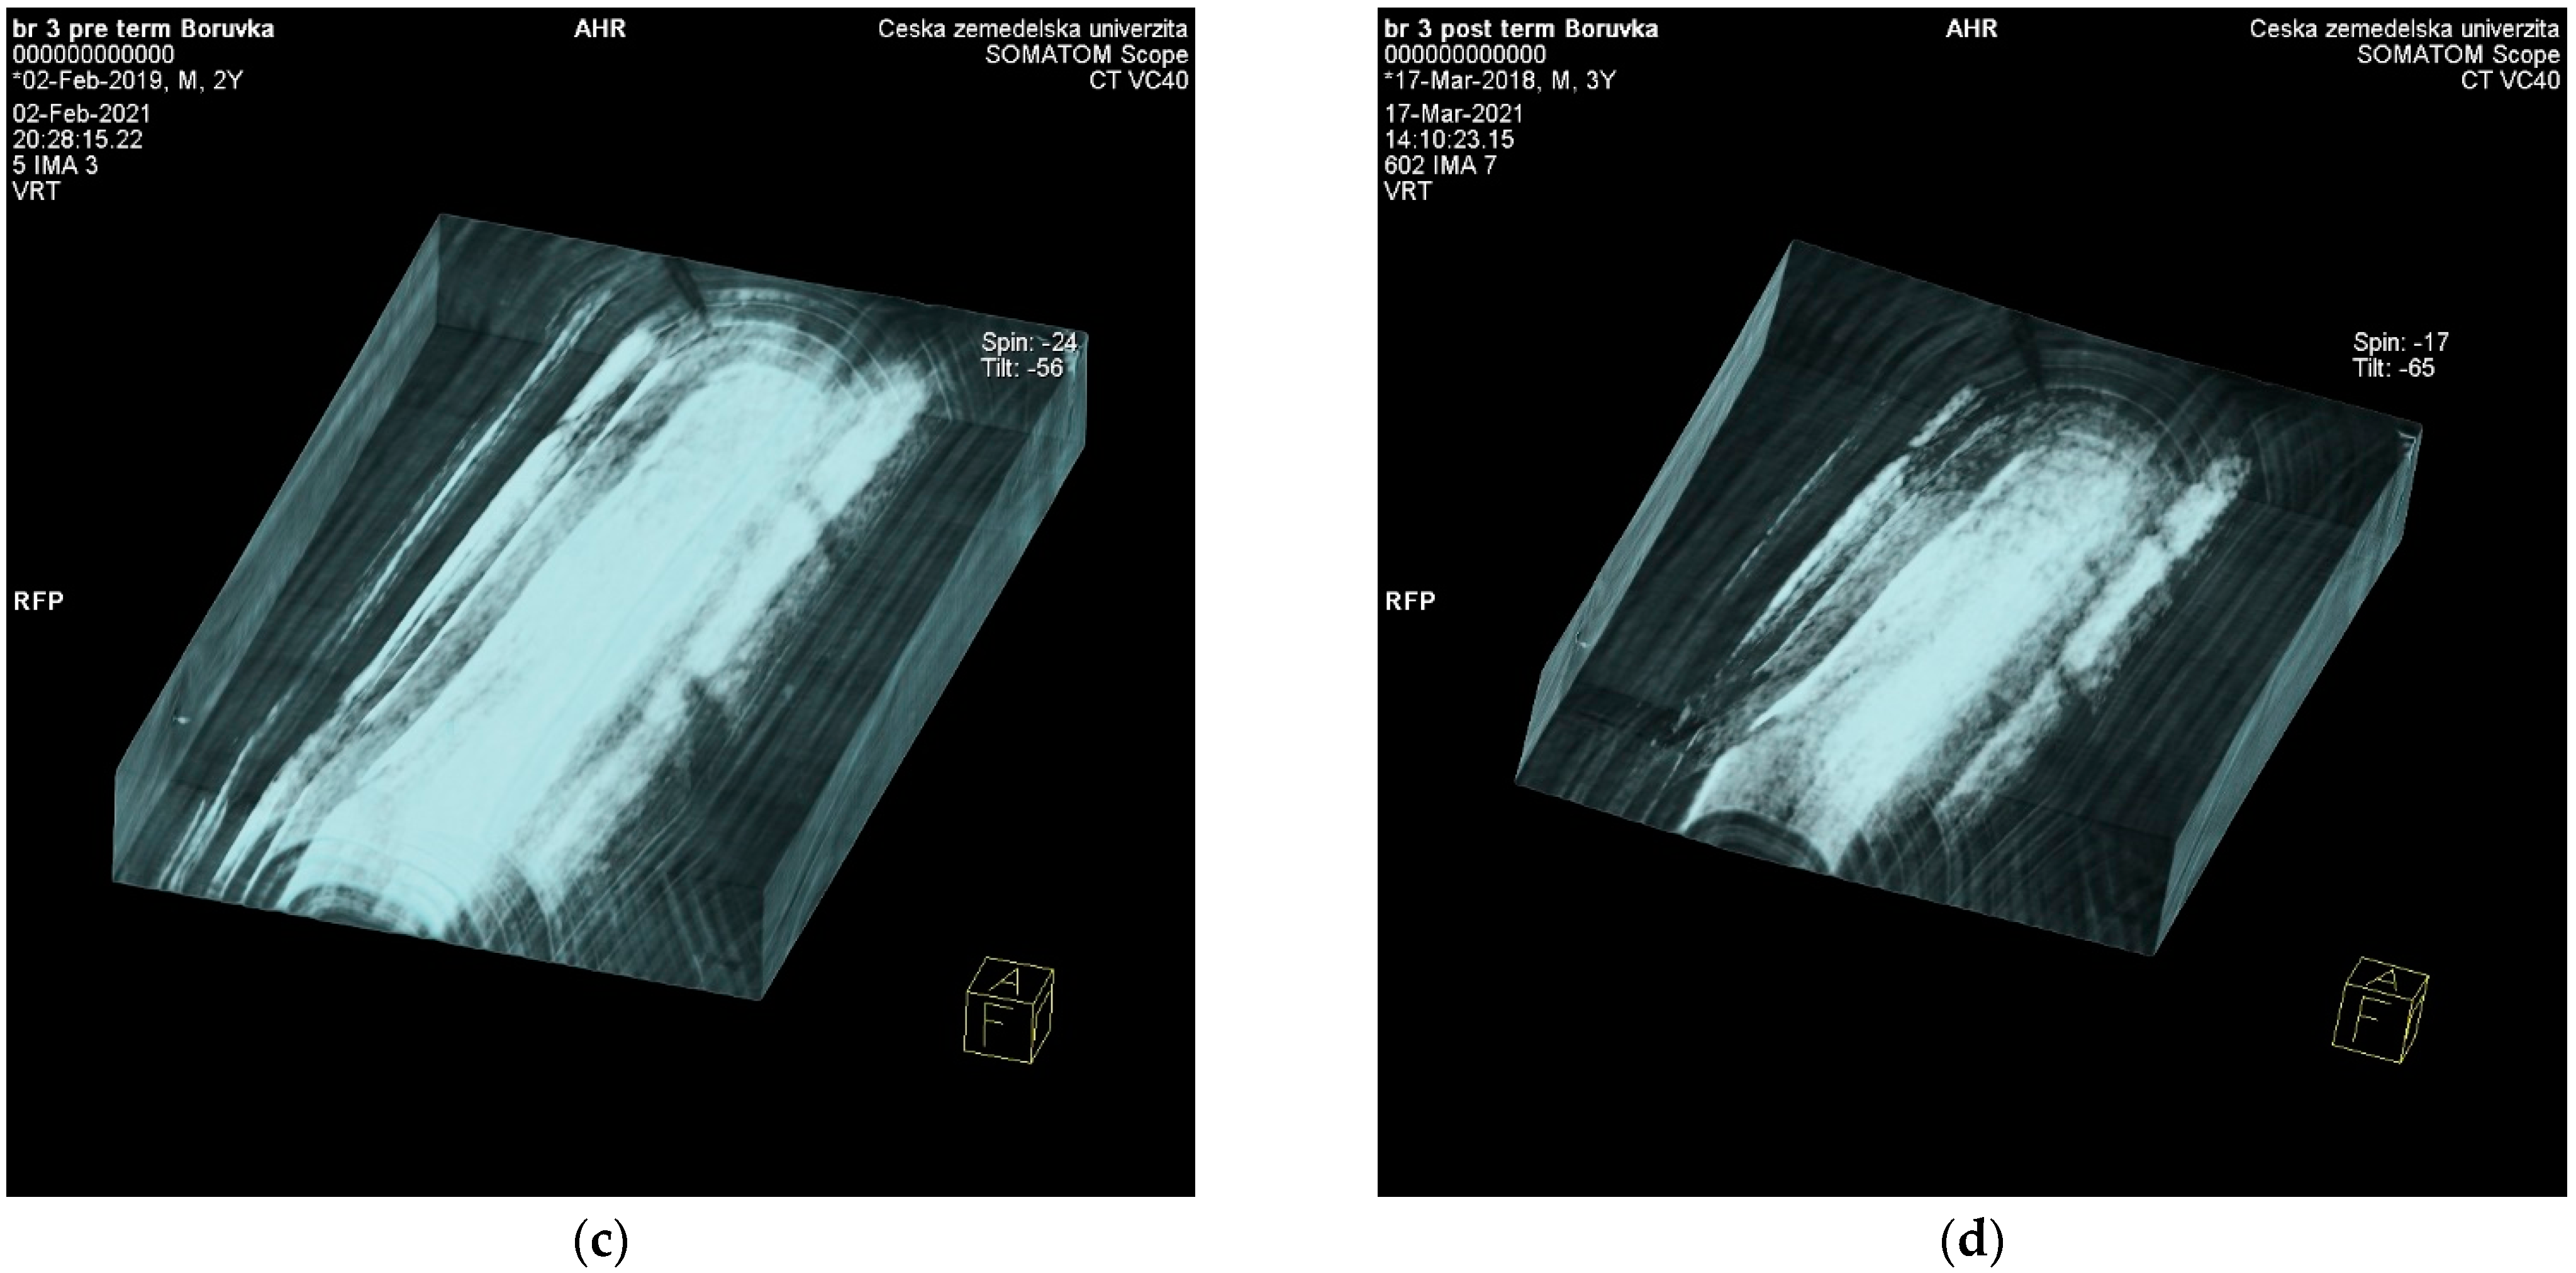
To accurately detect and localise defects within the test samples and their behaviour due to treatment, the samples were scanned before and after treatment on a Siemens Somatom Scope Power CT Scanner (Siemens Healthcare GmbH, Erlangen, Germany). This is a multidetector CT (16 rows of detectors) allowing the creation of output images in three planes, the so-called multiplanar reconstruction (MPR) and 3D reconstructed images through the volume rendering technique (VRT) (Figure 5).
The data and results of the studied properties were processed in graphical and tabular form using STATISTICA Version 13.4.0.14 (TIBCO Software Inc., Palo Alto, CA, USA), and some graphs were plotted in Excel 2016. Basic descriptive statistics and two-factor analysis of variance (ANOVA) were used in STATISTICA to demonstrate trends of the properties and characteristics under study. Furthermore, Duncan’s test was used for multiple comparisons of changes in the evaluated properties and characteristics depending on the heat treatment level. A linear regression analysis was used to express the correlation dependencies of the individual properties and characteristics being examined among themselves. A uniform significance level of α = 0.05 was used for all statistical analyses.

3. Results and Discussion

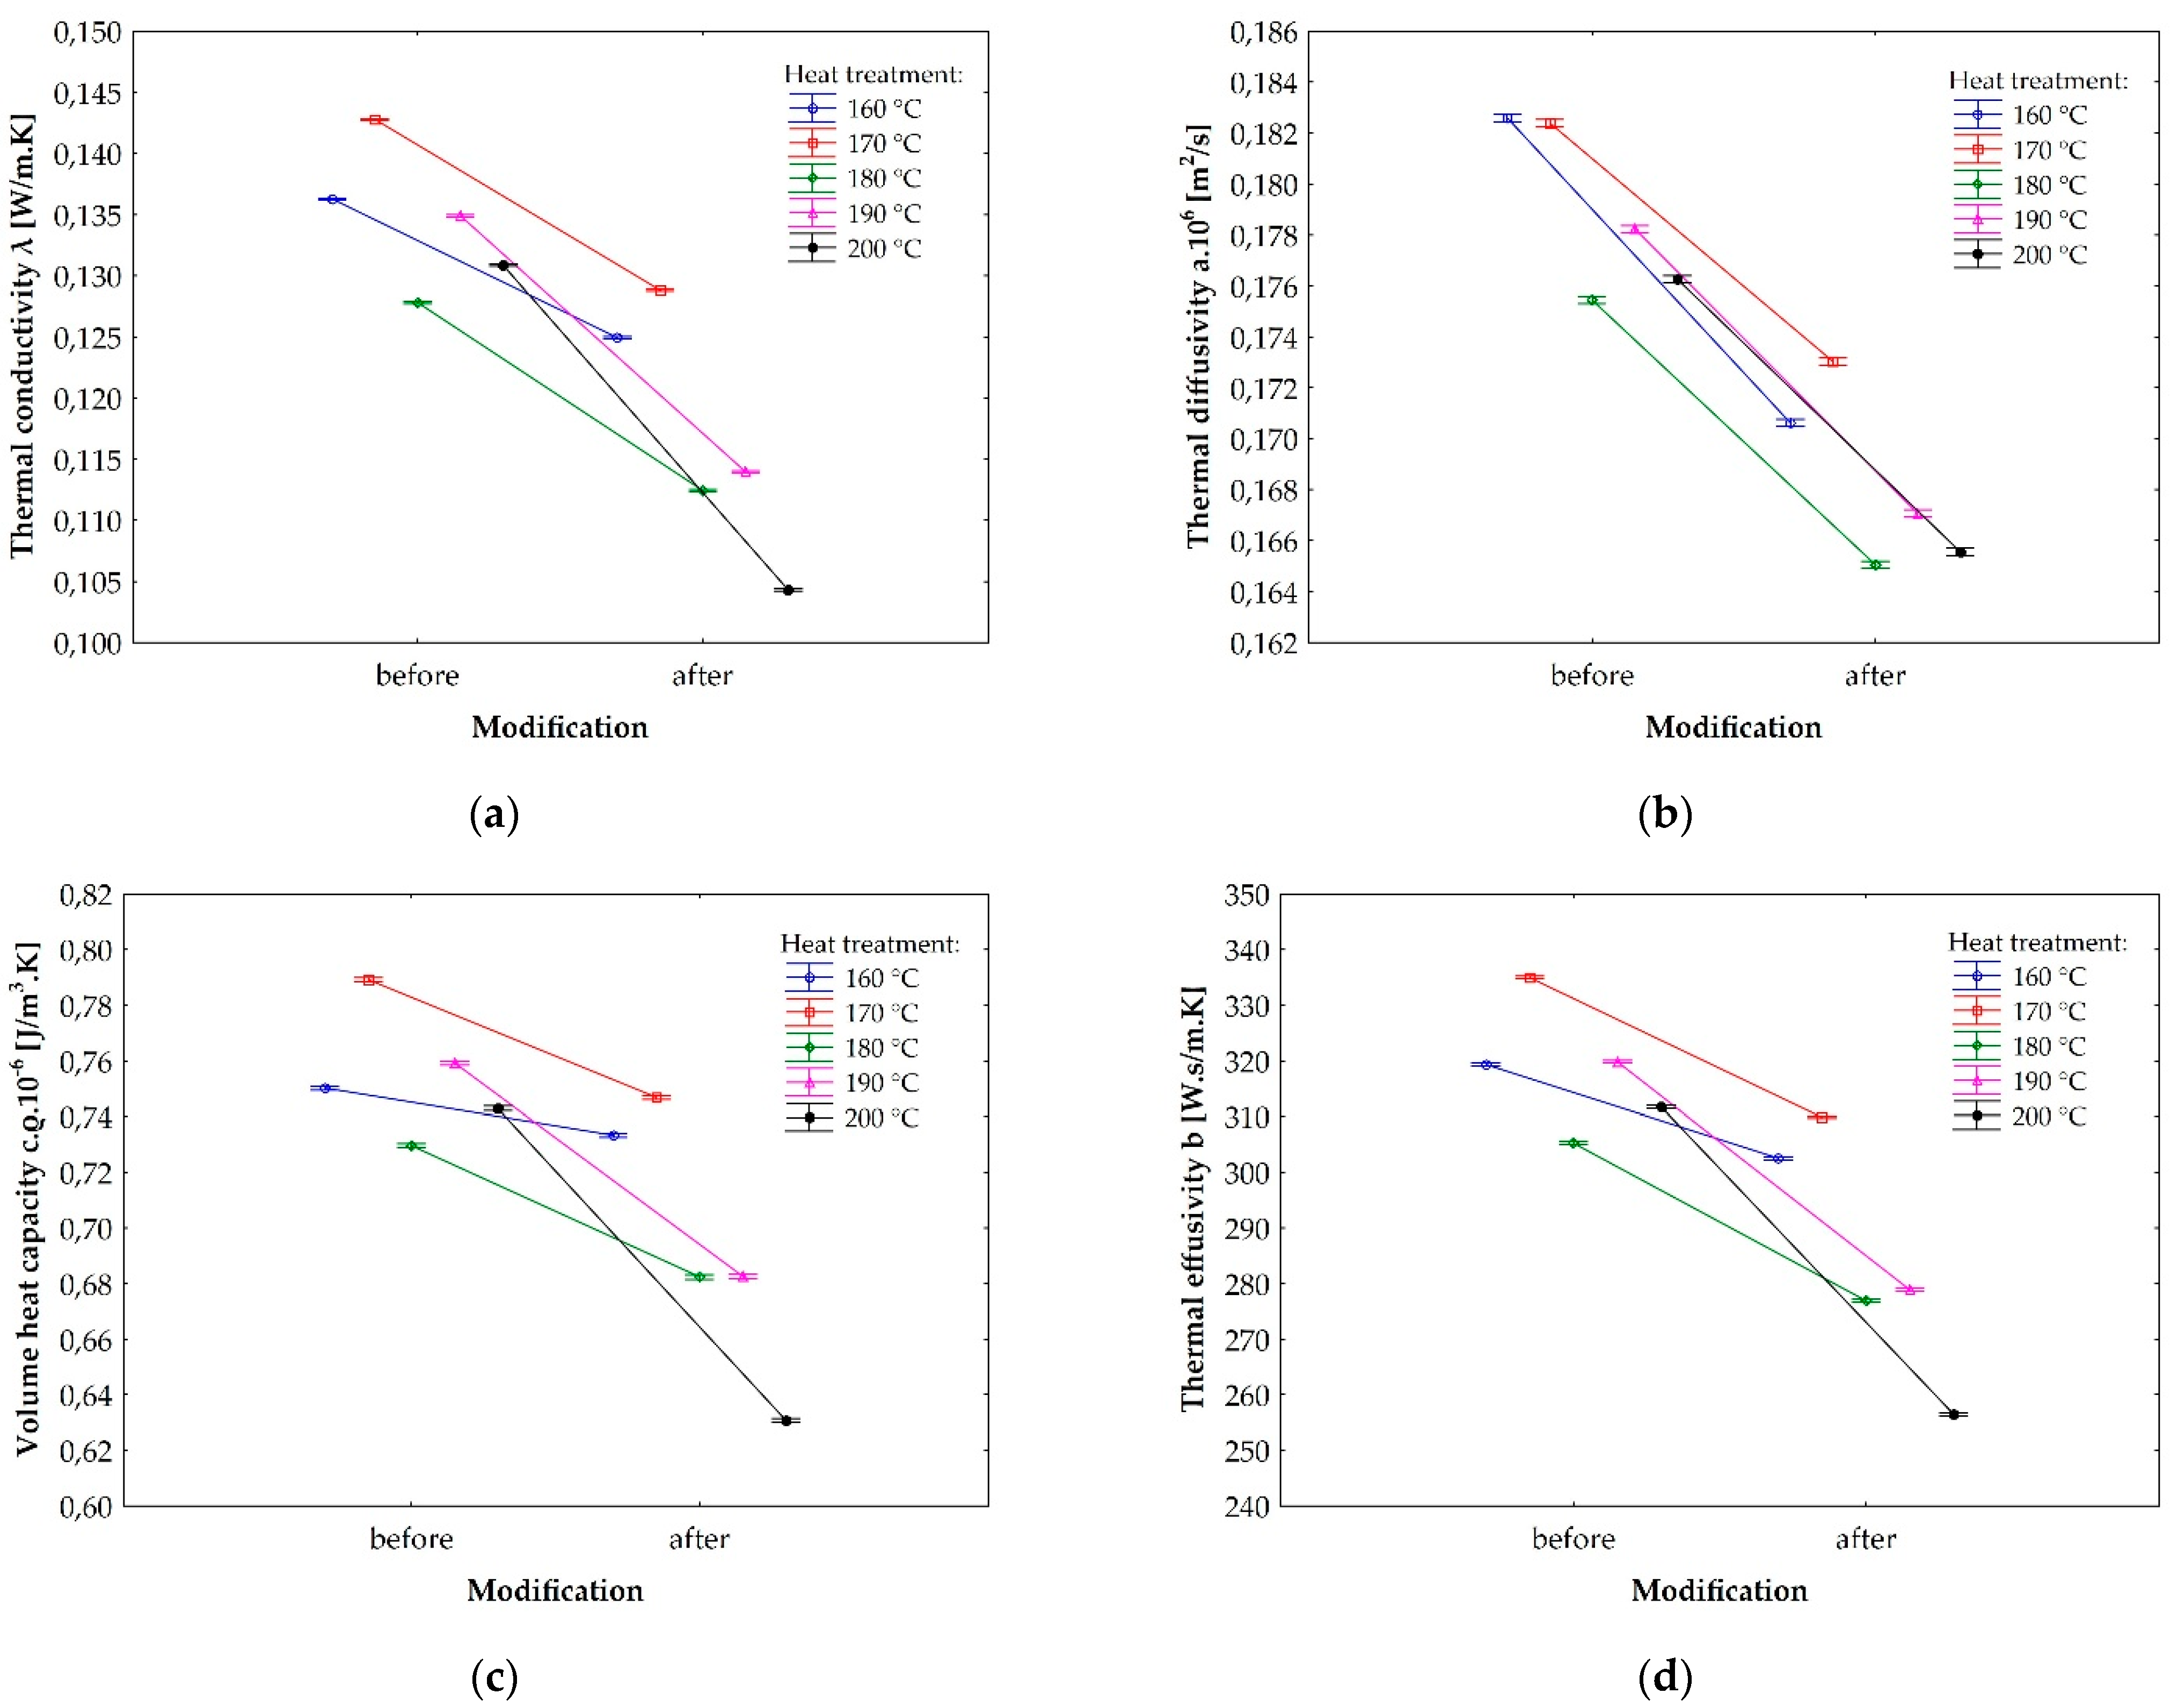
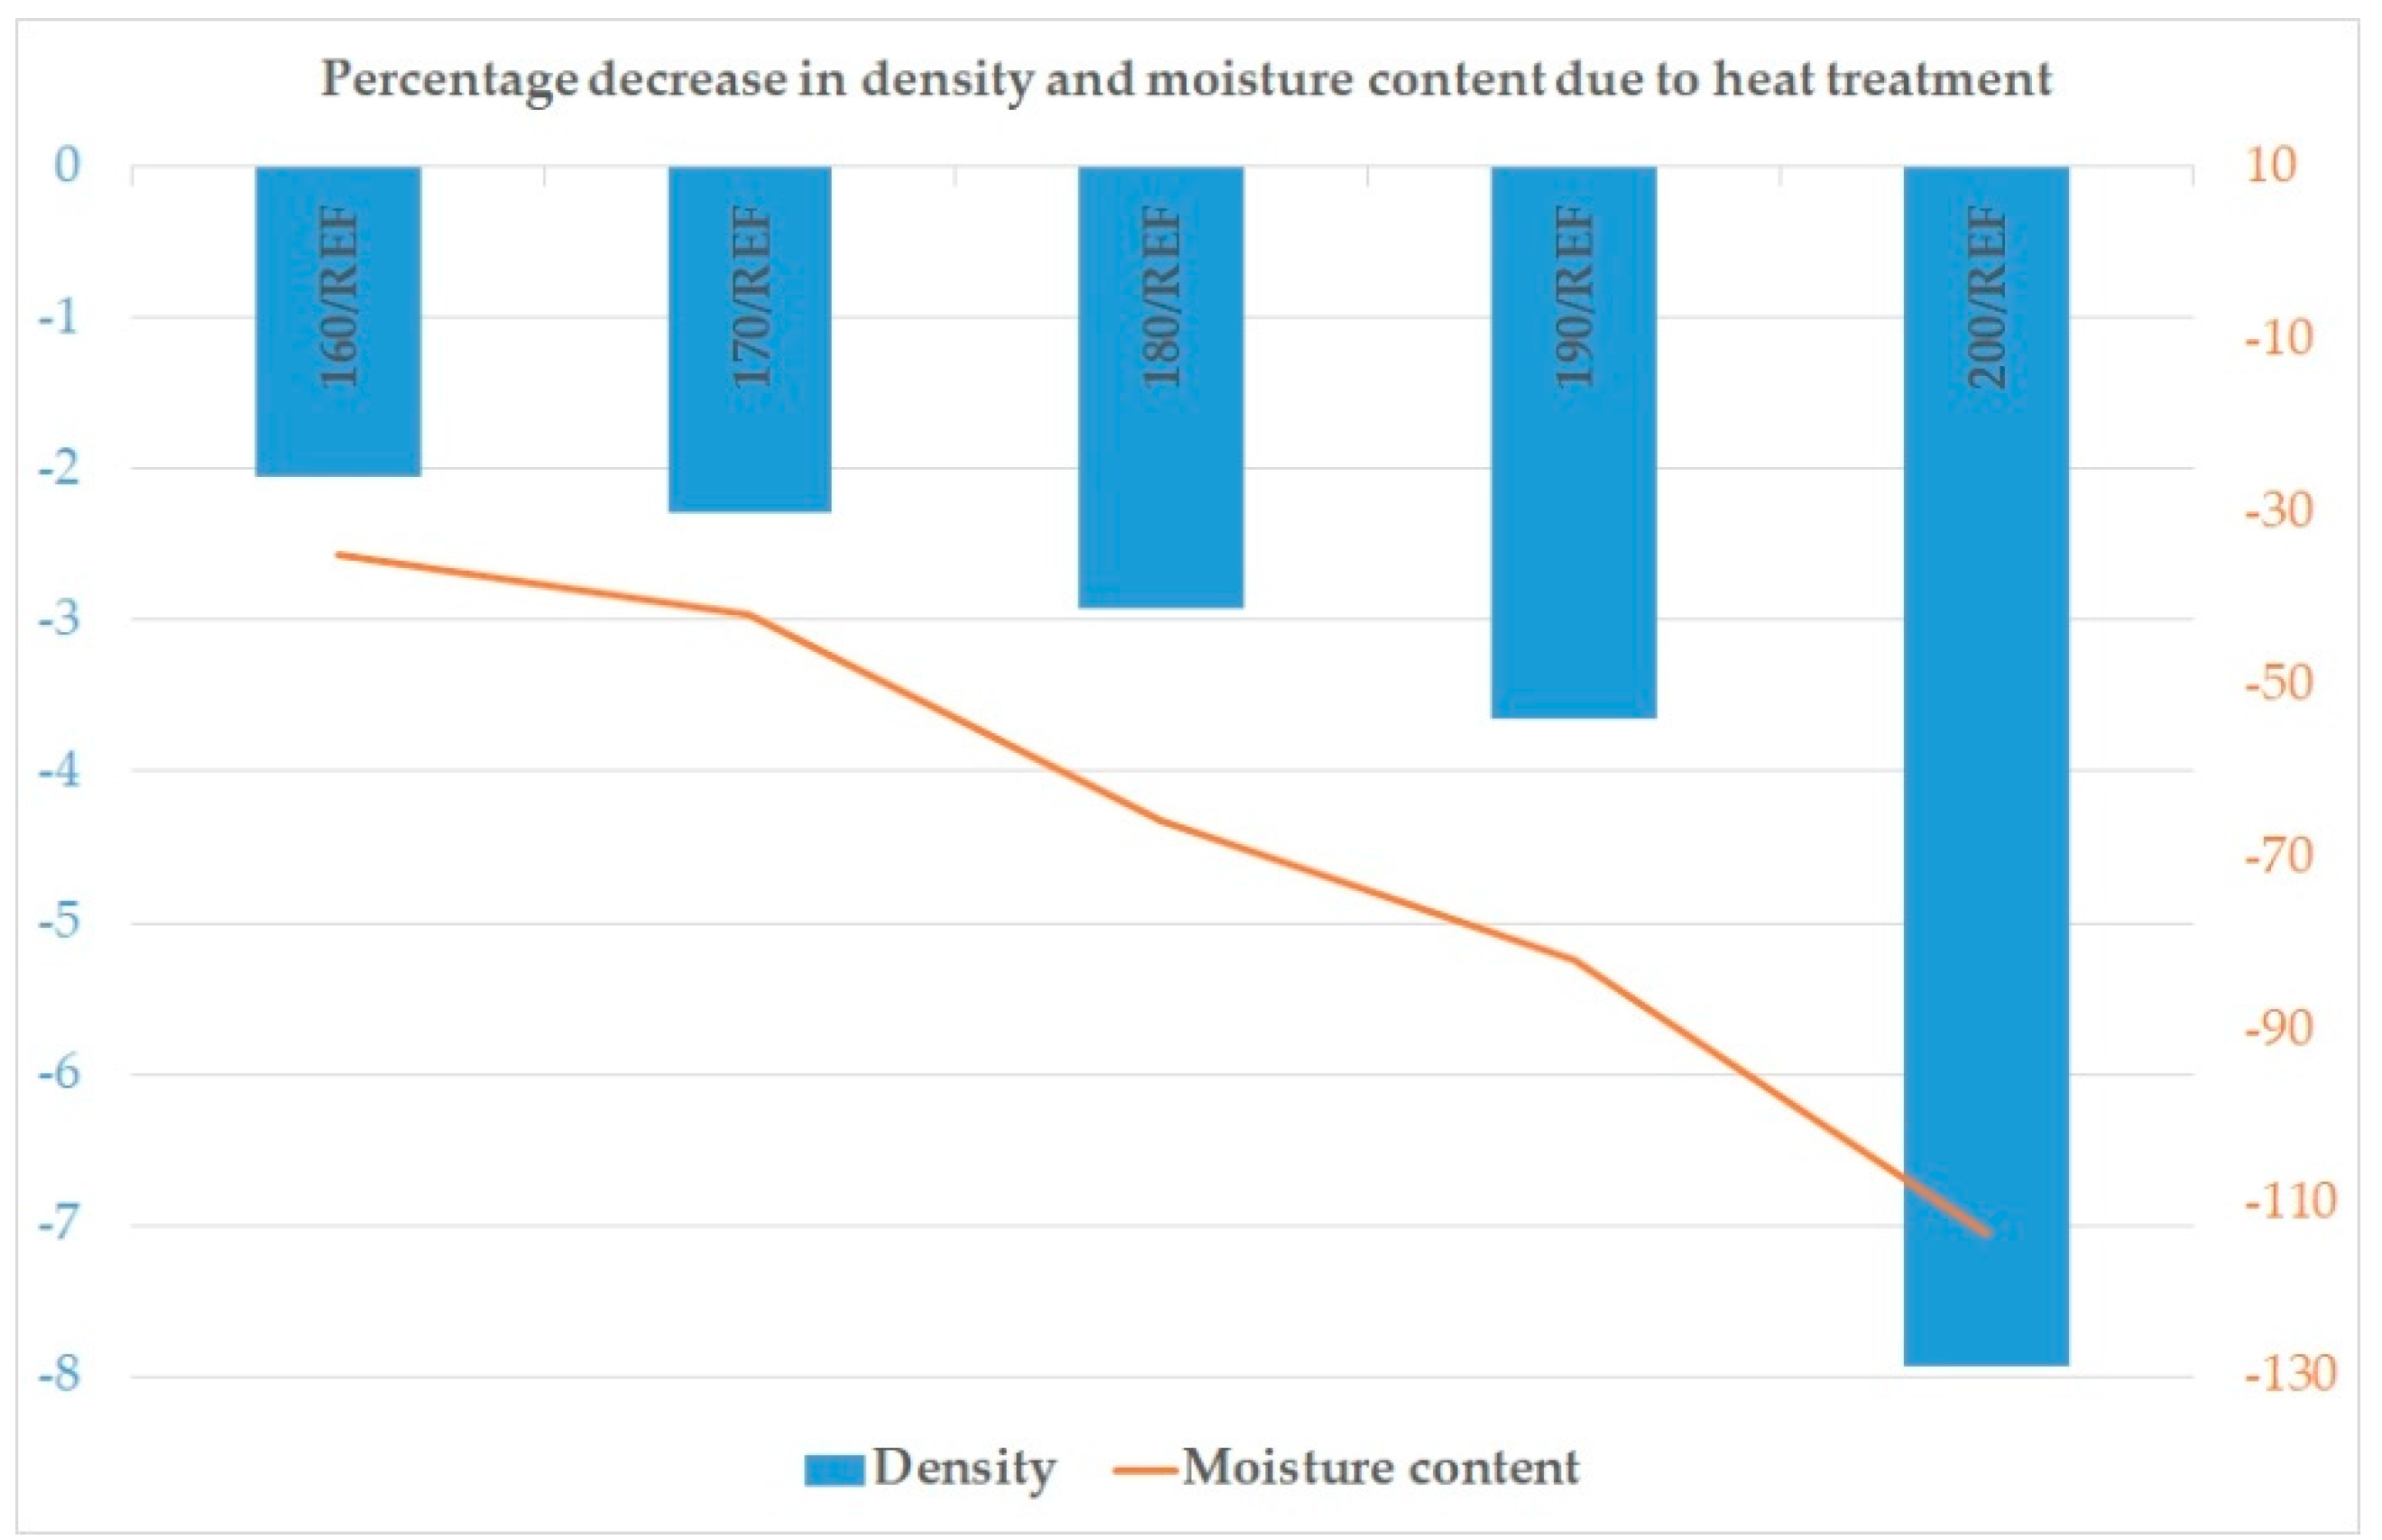
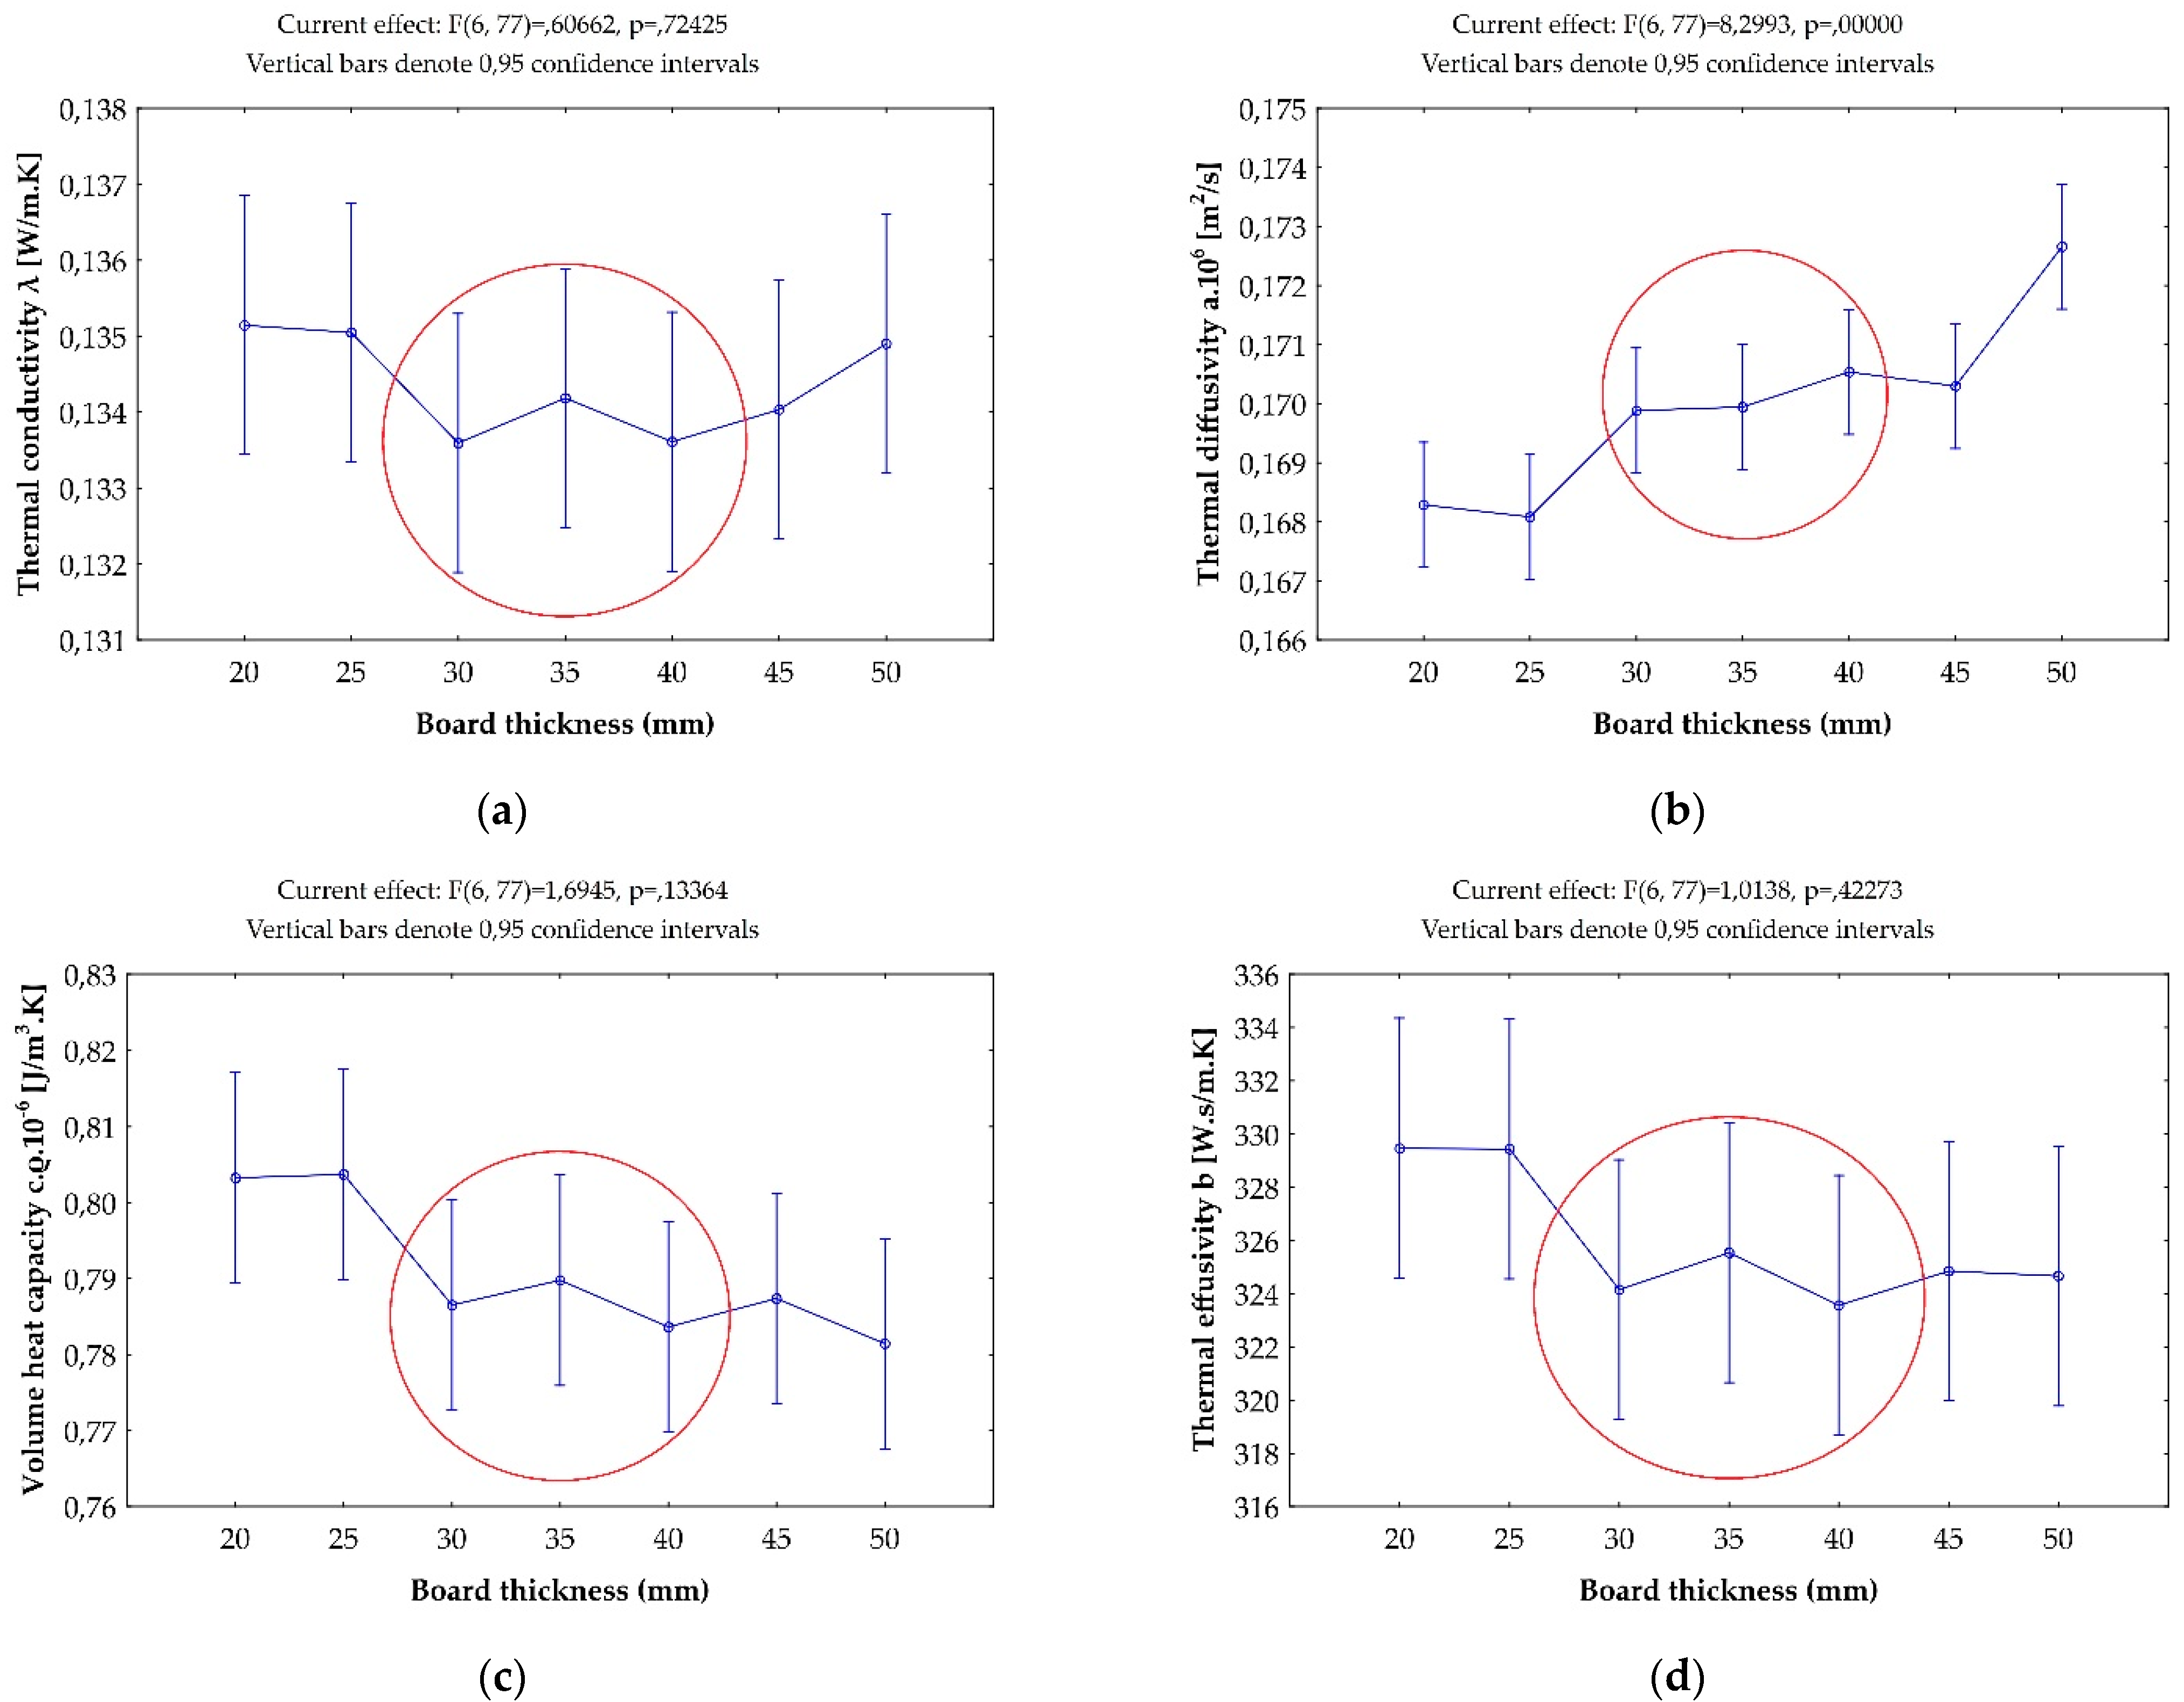
The basic descriptive statistics of all monitored quantities for each level of wood heat treatment are shown in Table 1 and Table 2. The changes in the quantity values of the variables are listed in the Annex (Table A1 and Table A2 in Appendix A). In these tables, the changes are presented as a percentage. The monitored change in the values of the individual observed quantities due to the treatment was related to the values after the treatment, i.e., this is an absolute expression. The statistical significance of the mean value differences depending on the wood heat treatment level is specified for each quantity in the Annex (Table A3, Table A4, Table A5, Table A6, Table A7, Table A8, Table A9, Table A10, Table A11, Table A12 and Table A13) through Duncan’s tests. The mean value of the investigated wood properties, i.e., wood density and wood moisture content, for each heat treatment level are shown in Table 3, and the percentage changes relative to the untreated wood are shown in Figure 13. Detailed explanation for each quantity as well as graphical visualisation of ANOVA outcomes or correlation dependencies between quantities follow (Figures 12 and 15). A statistically significant effect of the heat treatment factor was found for all quantities being examined (Figures 6 and 13); however, this was obviously not always found mutually between all levels (Table A3, Table A4, Table A5, Table A6, Table A7, Table A8, Table A9, Table A10, Table A11, Table A12 and Table A13, Figures 7 and 14). The effect of the sample thickness factor on the thermal characteristics is graphically depicted in Figure 11.
As shown in Figure 6, there is a decrease in thermal characteristics due to the heat treatment. At the lowest treatment temperature of 160 °C, there is a decrease in conductivity by 8.2%, a decrease in diffusivity by 5.7%, a decrease in volume heat capacity by 1.4%, and a decrease in effusivity by 5.0%. At the highest treatment temperature of 200 °C, there is a decrease in conductivity by 20.2%, a decrease in diffusivity by 6.0%, a decrease in volume heat capacity by 15.0%, and a decrease in effusivity by 17.7%. This decrease becomes progressively more noticeable with increasing treatment temperature, which is visually apparent from the greater slope of the line segments. This is even more evident when looking at the changes in the values of the individual observed quantities due to the treatment relative to the values after the treatment (Figure 7). At all treatment levels, the decrease in diffusivity is almost constant or the differences are statistically insignificant (Table A4).
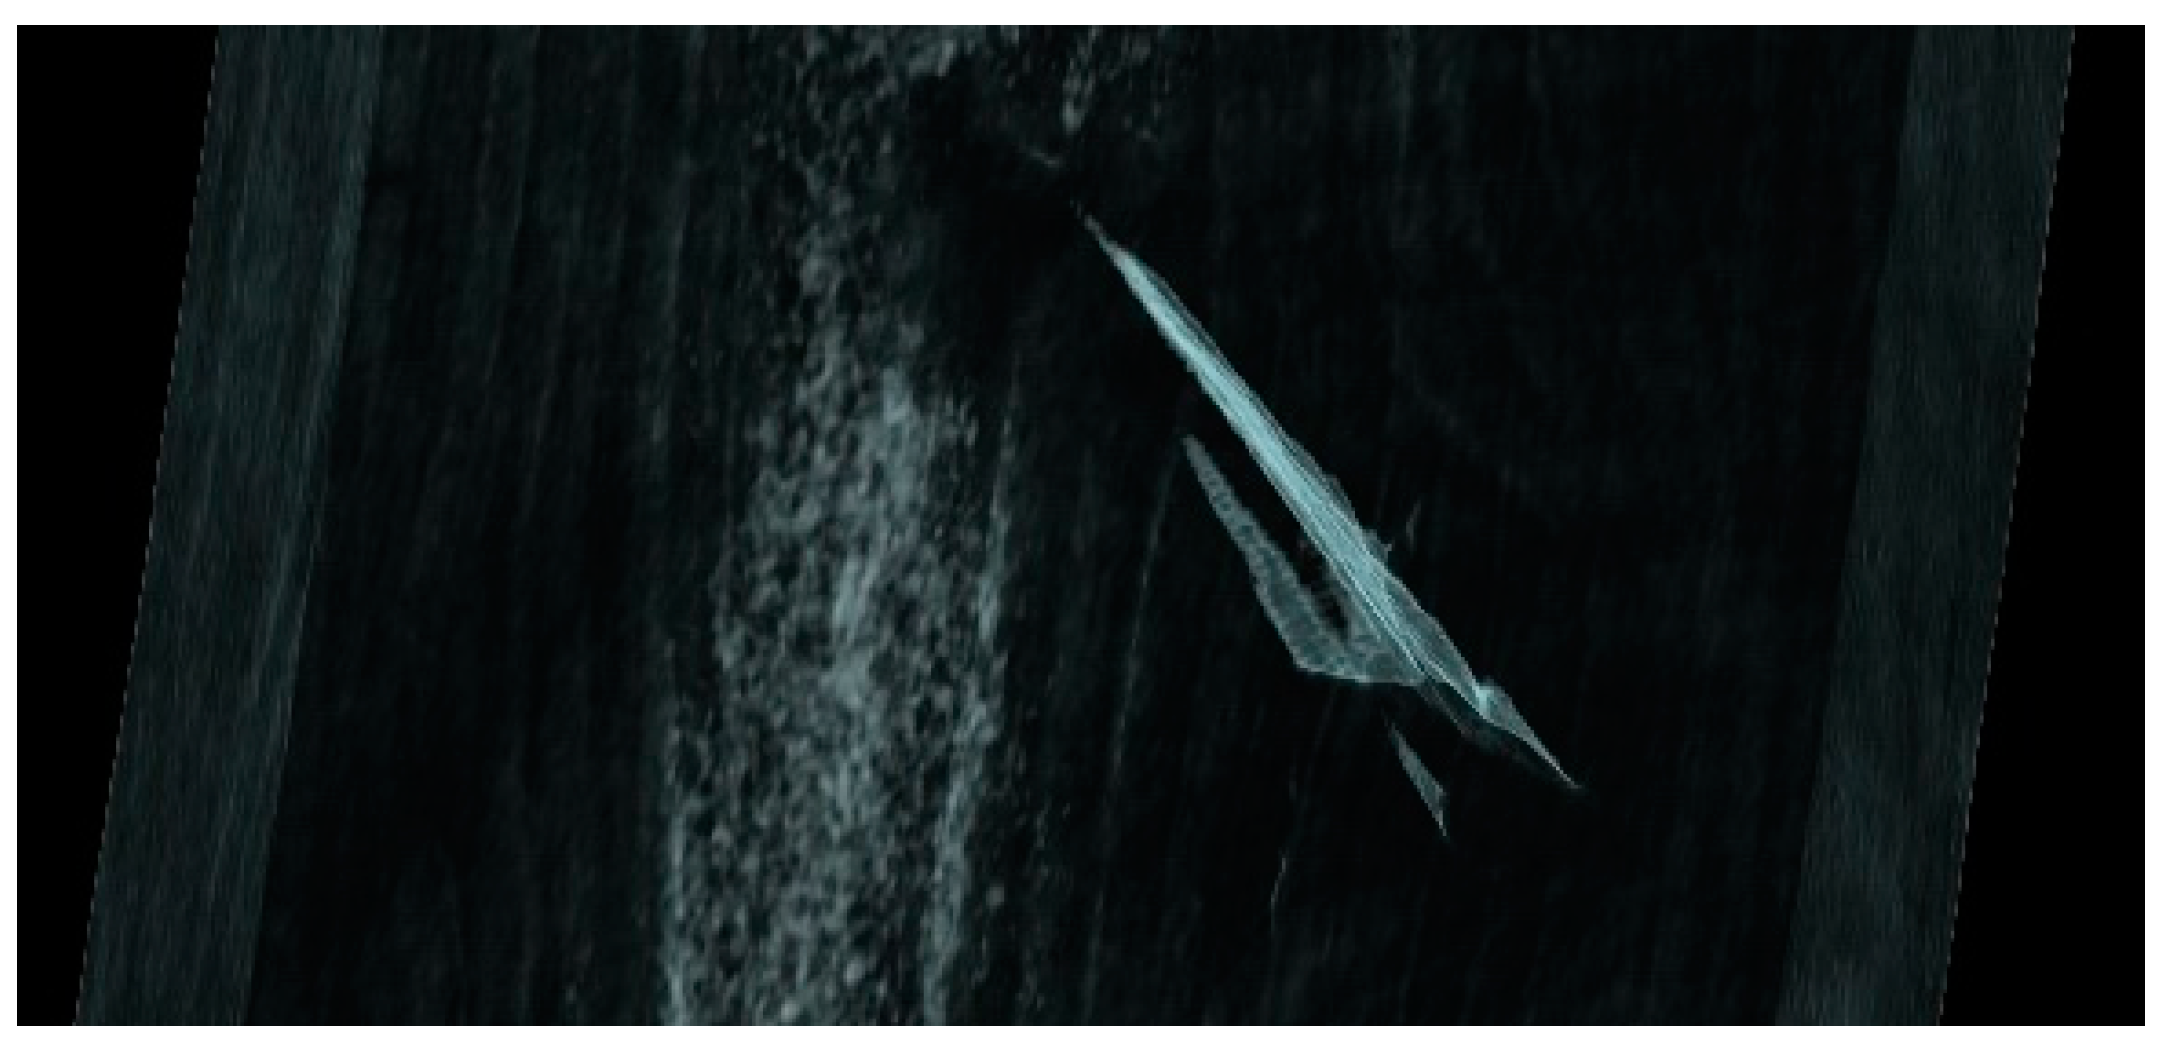
The influence of defects, or knots, is evident and shown in the graphical representation in Figure 7. This is particularly evident for diffusivity and volume heat capacity when treated at 160 °C and 170 °C, and these samples were found to have the highest incidence of mostly hidden defects via VRT (Figure 8). The micro(cracks) occasional occurrence was observed after treatment at higher treatment levels (Figure 9).
As for the thermal characteristic values themselves, they are pretty logical. The proportion of mass in volume, both wood substance and water, decreases with increasing treatment temperature. The reduction in volume is not as noticeable as the loss in mass. Therefore, the wood density decreases (Table 3, Figure 10), resulting in a decrease in conductivity, specific heat capacity and effusivity values. The diffusivity values result from the dependence among the thermal characteristics, (Formula 1). Logically, the fact mentioned relates to the values of these parameters for water and air [33,35,36]. Compared to air, water has about 830 times higher density, 4 times higher specific heat capacity, 23 times higher conductivity, and about 140 times lower diffusivity at a temperature of 20 °C.
The effect of the sample thickness factor on the thermal characteristics was not demonstrated in the range from 30 to 40 mm being studied (Figure 11), which is important in view of the fact that samples aligned in thickness after heat treatment should not show differences in the determinations caused by this factor. On the other hand, wood is indeed a heterogeneous material, so this factor cannot be eliminated entirely.
From the correlation dependencies between the observed quantities, regardless of the level of heat treatment, it can be seen that they are all statistically significant (Figure 12). Highly heavy dependencies were shown between effusivity and volume heat capacity (r = 0.9285), conductivity and volume heat capacity (r = 0.7482), and effusivity and conductivity (r = 0.8849), which logically follows from Formulas 1 and 2. No dependence between diffusivity and volume heat capacity was demonstrated (r = ‒0.1068).
The thermal characteristics of the heat-treated wood have not yet been the subject of extensive research, although this is research based on non-destructive methods [50]. In the Thermowood Handbook [7], a decrease in conductivity by 13.4% and 21.5% for spruce wood and pine wood is reported for the coniferous wood treated at 230 °C and the peak treatment phase of 3 h. In our experiments on birch wood, a decrease by 20.2% occurred already at a treatment temperature of 200 °C. However, deciduous trees are indeed more susceptible to higher treatment temperatures, and this has also been proven in this study.
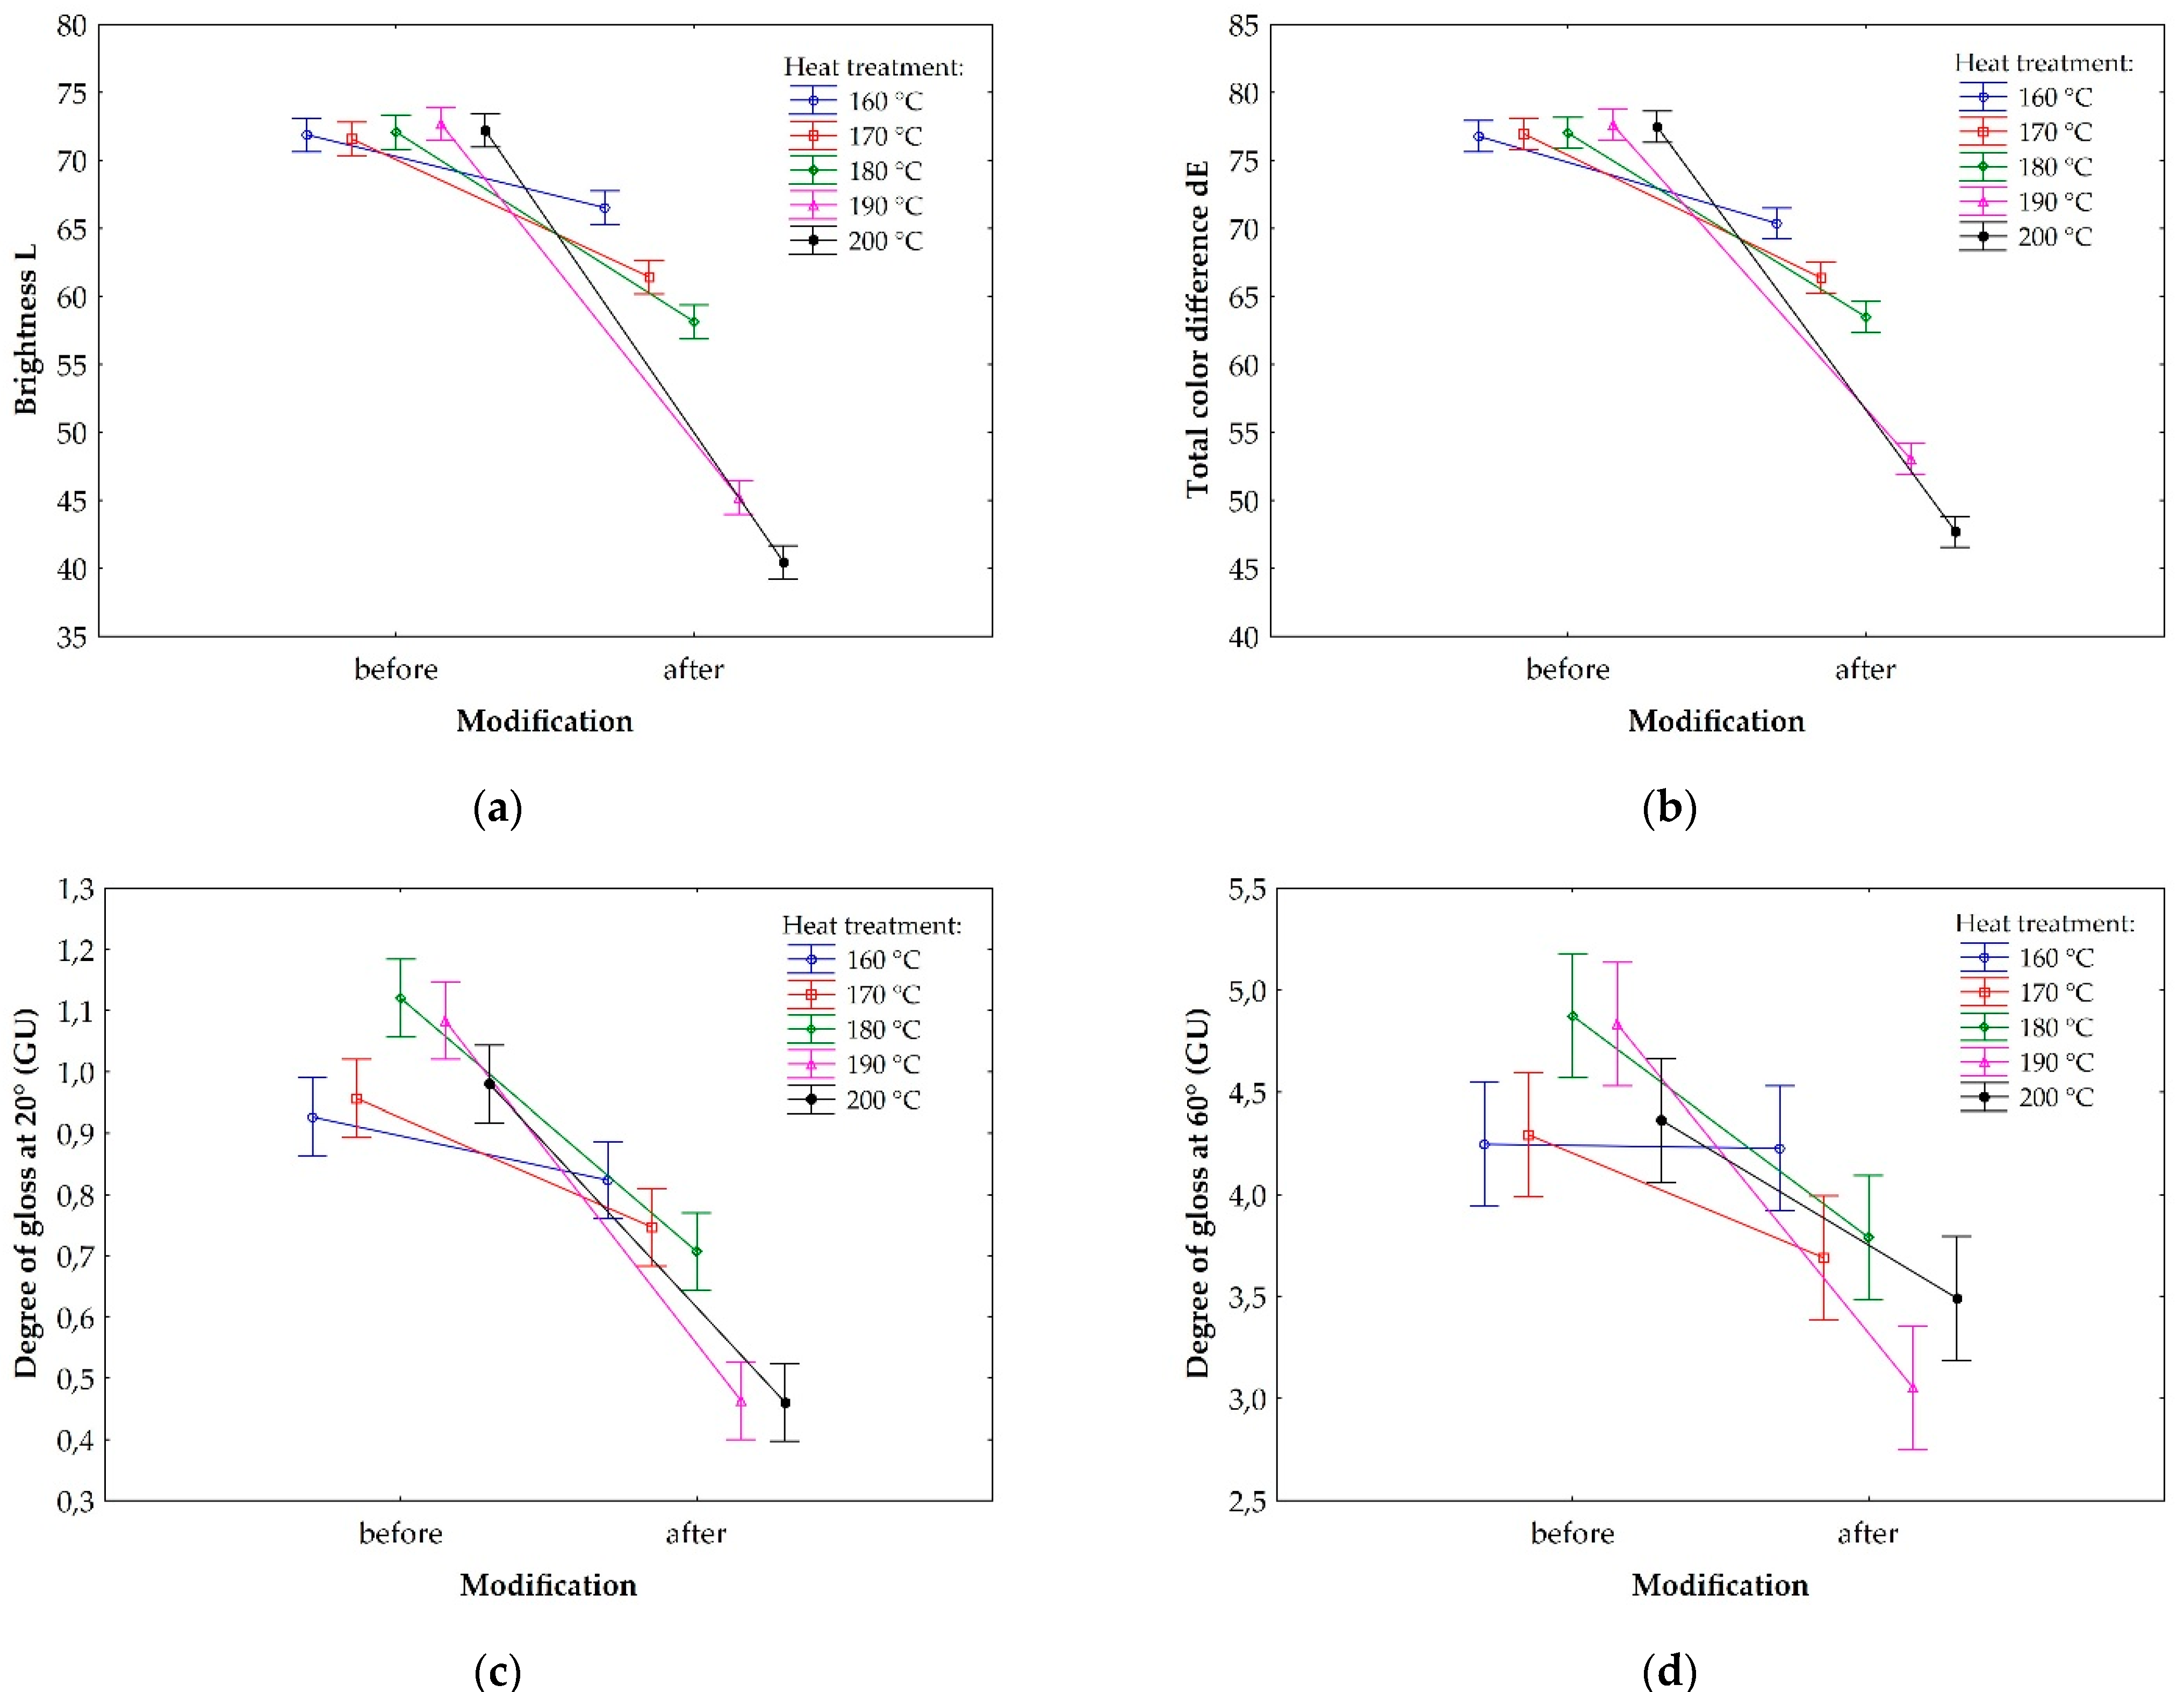
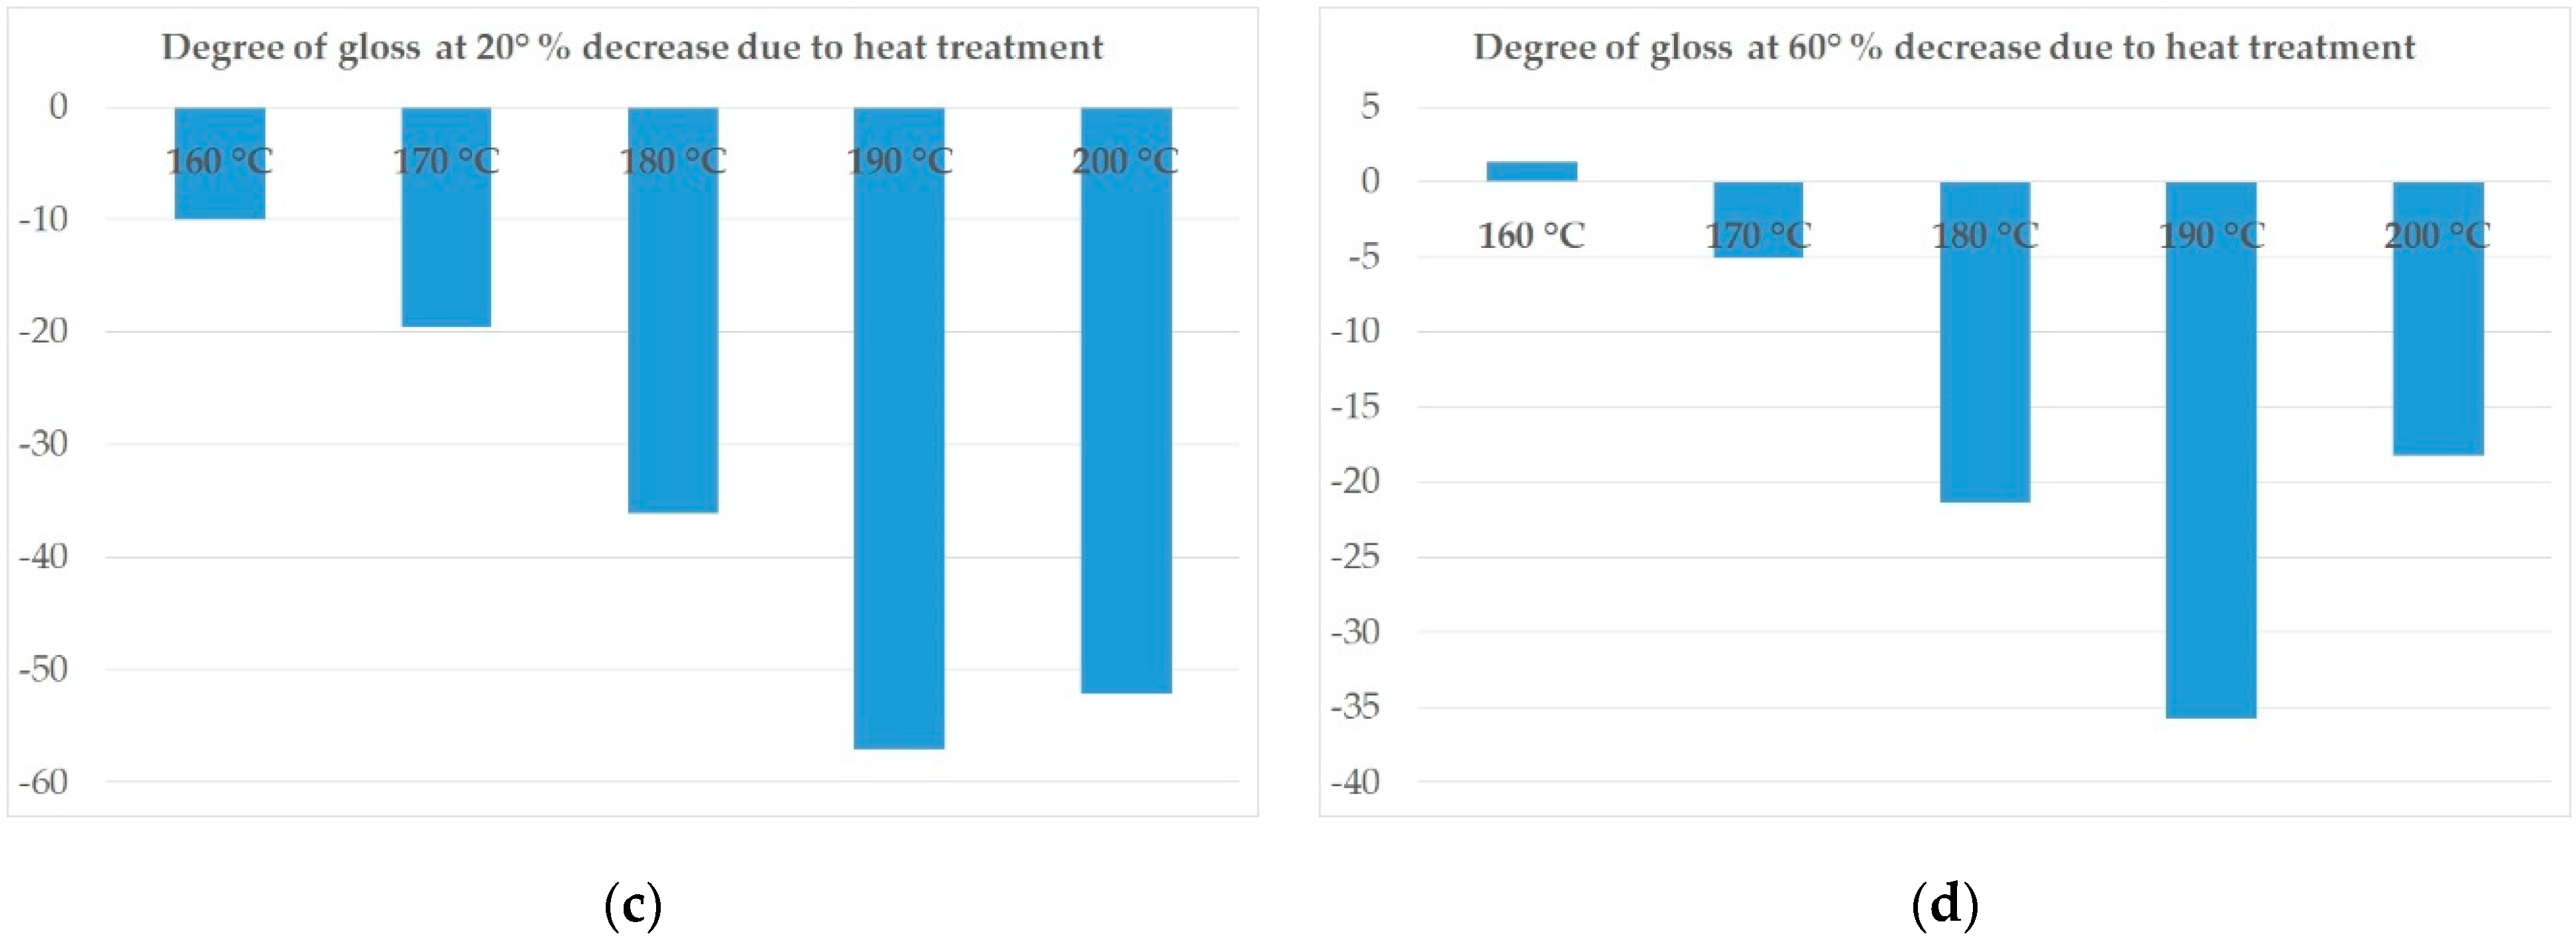
As shown in Figure 13, the heat treatment results in a decrease in parameters of colour (with the logical exception of both a and b parameters) and gloss. At the lowest treatment temperature of 160 °C, there is a decrease in brightness by 7.4%, a decrease in total colour difference by 8.4%, and an insignificant increase in gloss (at an angle of 60°) by 1.3%. At the highest treatment temperature of 200 °C, there is a decrease in brightness by 44.0%, a decrease in total colour difference by 38.4%, and a decrease in gloss (at an angle of 60°) by 18.2%. This decrease becomes progressively more noticeable with increasing treatment temperature, which is visually apparent from the greater slope of the line segments, as with the thermal characteristics. This is even more evident when looking at the changes in the values of the individual observed quantities due to the treatment, relative to the values after the treatment (Figure 14). The exception to the decrease is the gloss at 200 °C, where there is a statistically significant increase compared to the values for wood treated at 190 °C, which is interesting. On the other hand, gloss is indeed a specific quantity for which the inclination angle plays an important role. Covering such a wide range of material type at one inclination angle before and after the treatment is quite misleading; see the gloss results at three different inclination angles (see Table 2 and Table A2).
The correlations between the individual observed quantities, regardless of the level of heat treatment, are statistically significant (Figure 15). Logically, highly heavy dependencies were demonstrated between total colour difference and brightness (r = 0.9968), gloss and brightness (r = 0.8110).
The colour of heat-treated wood has been the subject of much research, including our previous papers [3,4]. For example, the Thermowood Handbook [7] states generally that the brightness of pine wood decreases by about 54% at a temperature of 200 °C and a peak treatment phase of 3 h. In our experiments on birch wood, the same level of treatment resulted in a decrease by 40.4%. Colour and gloss are extremely specific and have variable properties with a distinct atypicality for a particular wood species.
In any case, it is important to realise that wood defects or anomalies significantly affect the thermal characteristics of wood. As this research has shown, this issue will need to be given considerable attention in the case of heat-treated wood. In general, it will be necessary to pay attention to birch accordingly in Europe in terms of climate change and also in a social-economic context [51].

4. Conclusions

The most important findings of this research, which focused primarily on the thermal characteristics, as well as the colour and gloss of heat-treated wood, are as follows:
  • As the treatment temperature increases, the thermal characteristics gradually decrease. At the highest treatment temperature of 200 °C, there is a decrease in conductivity by 20.2%, a decrease in diffusivity by 6.0%, a decrease in volume heat capacity by 15.0%, and a decrease in effusivity by 17.7%. The decrease in diffusivity is almost constant at all treatment levels, or the differences are statistically insignificant.
  • As the treatment temperature increases, the selected colour and gloss parameters gradually decrease. At the highest treatment temperature of 200 °C, there is a decrease in brightness by 44.0%, a decrease in total colour difference by 38.4%, and a decrease in gloss (at an angle of 60°) by 18.2%.
  • From the correlation dependencies between the observed quantities, it can be seen that they are statistically significant, regardless of the level of heat treatment. Highly heavy dependencies have been shown between effusivity and volume heat capacity, conductivity and volume heat capacity, effusivity and conductivity, total colour difference and brightness, and gloss and brightness. No dependence between diffusivity and volume heat capacity has been demonstrated.
  • Wood defects or anomalies, which are usually a reality in practical wood usage, significantly affect the thermal characteristics of wood, and this issue will need to be given considerable attention in the case of heat-treated wood.
This paper is primarily intended to result in a targeted expansion of the database dealing with this issue and, thus, contribute to understanding the human perception of temperature, colour and gloss of wood surface. The conclusions mentioned above are positive in terms of the tactile perception of heat-treated wood, which can have a positive effect, for example, in furniture with surface application of heat-treated veneers, which are perceived positively by the majority of the human population visually as well, or, for example, in the use of thermally modified wood as a cladding material in saunas. The shift in the view of birch from a weed to an alternative economic tree species is certainly possible in the Czech Republic and Central Europe in general, as is applying the thermal modification process of birch wood to increase its added value.

Author Contributions

Conceptualization, V.B.; data curation, V.B.; formal analysis, V.B. and P.Š.; funding acquisition, V.B. and P.Š.; investigation, V.B., D.N., T.H. and J.T.; methodology, V.B.; project administration, V.B.; resources, V.B.; software, V.B.; supervision, V.B.; validation, V.B.; visualization, V.B., T.H. and J.T.; writing—original draft, V.B.; writing—review and editing, V.B., and P.Š. All authors have read and agreed to the published version of the manuscript.

Funding

This research was funded by the EVA4.0 (grant No. CZ.02.1.01/0.0/0.0/16_019/0000803) financed by OPRDE.

Data Availability Statement

Not applicable.

Acknowledgments

We would like to express our thanks to the Faculty of Forestry and Wood Sciences of the Czech University of Life Sciences Prague and School Forest Enterprise of the Czech University of Life Sciences in Kostelec nad Černými Lesy. Acknowledgement also belongs to the Grant service Forests of the Czech Republic, state enterprise, for the support of project No. 90 (internal No. 43170/9010/9028), within which the initial data was collected.

Conflicts of Interest

The authors declare no conflict of interest.

Appendix A

Table A1. Changes in thermal characteristics of heat-treated birch wood in comparison to the reference (untreated) birch wood in %.
With Defects160/REF170/REF180/REF190/REF200/REF
Without Defects
Thermal conductivity–8.2–9.7–11.9–15.5–20.2
–8.5–9.5–12.1–15.7–19.9
Thermal diffusivity–5.7–3.9–5.9–5.8–6.0
–3.3–1.8–5.7–5.0–5.5
Volume heat capacity–1.4–4.3–6.3–9.8–15.0
–5.3–7.6–6.7–10.6–15.1
Thermal effusivity–5.0–7.2–9.2–12.8–17.7
–6.9–8.6–9.5–13.3–17.6
REF = reference, with no treatment; 160 = heat treatment at 160 °C; 170 = heat treatment at 170 °C; 180 = heat treatment at 180 °C; 190 = heat treatment at 190 °C; 200 = heat treatment at 200 °C.
Table A2. Changes in colour and gloss parameters of heat-treated birch wood in comparison to the reference (untreated) birch wood in %; including defects.
160/REF170/REF180/REF190/REF200/REF
Brightness–7.4–14.1–19.3–37.8–44.0
Colour parameter a–11.2–2.711.236.817.5
Colour parameter b–14.8–11.7–7.9–2.3–13.1
Total colour difference–8.4–13.7–17.6–31.6–38.4
Degree of gloss at 20°–10.0–19.6–36.1–57.1–52.2
Degree of gloss at 60°1.3–5.1–21.4–35.7–18.2
Degree of gloss at 85°68.0118.766.775.5140.9
REF = reference, with no treatment; 160 = heat treatment at 160 °C; 170 = heat treatment at 170 °C; 180 = heat treatment at 180 °C; 190 = heat treatment at 190 °C; 200 = heat treatment at 200 °C.
Table A3. Duncan’s multiple range test for changes in thermal conductivity.
MS = 7.7787
DF = 445
160/REF170/REF180/REF190/REF200/REF
160/REF
170/REF0.000 *
180/REF0.000 *0.000 *
190/REF0.000 *0.000 *0.000 *
200/REF0.000 *0.000 *0.000 *0.000 *
* Values are significant at p < 0.05. Error: between MS = mean squares, DF = degrees of freedom. REF = reference, with no treatment. Modification: 160 = heat treatment at 160 °C; 170 = heat treatment at 170 °C; 180 = heat treatment at 180 °C; 190 = heat treatment at 190 °C; 200 = heat treatment at 200 °C.
Table A4. Duncan´s multiple range test for changes in thermal diffusivity.
MS = 49.928
DF = 445
160/REF170/REF180/REF190/REF200/REF
160/REF
170/REF0.103
180/REF0.8470.094
190/REF0.8940.0950.942
200/REF0.7580.0780.8890.843
* Values are significant at p < 0.05. Error: between MS = mean squares, DF = degrees of freedom. REF = reference, with no treatment. Modification: 160 = heat treatment at 160 °C; 170 = heat treatment at 170 °C; 180 = heat treatment at 180 °C; 190 = heat treatment at 190 °C; 200 = heat treatment at 200 °C.
Table A5. Duncan´s multiple range test for changes in volume heat capacity.
MS = 118.98
DF = 445
160/REF170/REF180/REF190/REF200/REF
160/REF
170/REF0.072
180/REF0.004 *0.225
190/REF0.000 *0.001 *0.031 *
200/REF0.000 *0.000 *0.000 *0.001 *
* Values are significant at p < 0.05. Error: between MS = mean squares, DF = degrees of freedom. REF = reference, with no treatment. Modification: 160 = heat treatment at 160 °C; 170 = heat treatment at 170 °C; 180 = heat treatment at 180 °C; 190 = heat treatment at 190 °C; 200 = heat treatment at 200 °C.
Table A6. Duncan´s multiple range test for changes in thermal effusivity.
MS = 33.456
DF = 445
160/REF170/REF180/REF190/REF200/REF
160/REF
170/REF0.011 *
180/REF0.000 *0.026 *
190/REF0.000 *0.000 *0.000 *
200/REF0.000 *0.000 *0.000 *0.000 *
* Values are significant at p < 0.05. Error: between MS = mean squares, DF = degrees of freedom. REF = reference, with no treatment. Modification: 160 = heat treatment at 160 °C; 170 = heat treatment at 170 °C; 180 = heat treatment at 180 °C; 190 = heat treatment at 190 °C; 200 = heat treatment at 200 °C.
Table A7. Duncan´s multiple range test for changes in brightness.
MS = 24.650
DF = 145
160/REF170/REF180/REF190/REF200/REF
160/REF
170/REF0.000 *
180/REF0.000 *0.000 *
190/REF0.000 *0.000 *0.000 *
200/REF0.000 *0.000 *0.000 *0.000 *
* Values are significant at p < 0.05. Error: between MS = mean squares, DF = degrees of freedom. REF = reference, with no treatment. Modification: 160 = heat treatment at 160 °C; 170 = heat treatment at 170 °C; 180 = heat treatment at 180 °C; 190 = heat treatment at 190 °C; 200 = heat treatment at 200 °C.
Table A8. Duncan´s multiple range test for changes in colour parameter a.
MS = 160.94
DF = 145
160/REF170/REF180/REF190/REF200/REF
160/REF
170/REF0.000 *
180/REF0.000 *0.000 *
190/REF0.000 *0.000 *0.000 *
200/REF0.000 *0.000 *0.0550.000 *
* Values are significant at p < 0.05. Error: between MS = mean squares, DF = degrees of freedom. REF = reference, with no treatment. Modification: 160 = heat treatment at 160 °C; 170 = heat treatment at 170 °C; 180 = heat treatment at 180 °C; 190 = heat treatment at 190 °C; 200 = heat treatment at 200 °C.
Table A9. Duncan´s multiple range test for changes in colour parameter b.
MS = 58.741
DF = 145
160/REF170/REF180/REF190/REF200/REF
160/REF
170/REF0.140
180/REF0.001 *0.059
190/REF0.000 *0.000 *0.004 *
200/REF0.4010.4670.012 *0.000 *
* Values are significant at p < 0.05. Error: between MS = mean squares, DF = degrees of freedom. REF = reference, with no treatment. Modification: 160 = heat treatment at 160 °C; 170 = heat treatment at 170 °C; 180 = heat treatment at 180 °C; 190 = heat treatment at 190 °C; 200 = heat treatment at 200 °C.
Table A10. Duncan´s multiple range test for changes in total colour difference.
MS = 19.419
DF = 145
160/REF170/REF180/REF190/REF200/REF
160/REF
170/REF0.000 *
180/REF0.000 *0.001 *
190/REF0.000 *0.000 *0.000 *
200/REF0.000 *0.000 *0.000 *0.000 *
* Values are significant at p < 0.05. Error: between MS = mean squares, DF = degrees of freedom. REF = reference, with no treatment. Modification: 160 = heat treatment at 160 °C; 170 = heat treatment at 170 °C; 180 = heat treatment at 180 °C; 190 = heat treatment at 190 °C; 200 = heat treatment at 200 °C.
Table A11. Duncan´s multiple range test for changes in degree of gloss at 20°.
MS = 204.76
DF = 145
160/REF170/REF180/REF190/REF200/REF
160/REF
170/REF0.010 *
180/REF0.000 *0.000 *
190/REF0.000 *0.000 *0.000 *
200/REF0.000 *0.000 *0.000 *0.187
* Values are significant at p < 0.05. Error: between MS = mean squares, DF = degrees of freedom. REF = reference, with no treatment. Modification: 160 = heat treatment at 160 °C; 170 = heat treatment at 170 °C; 180 = heat treatment at 180 °C; 190 = heat treatment at 190 °C; 200 = heat treatment at 200 °C.
Table A12. Duncan´s multiple range test for changes in degree of gloss at 60°.
MS = 685.97
DF = 145
160/REF170/REF180/REF190/REF200/REF
160/REF
170/REF0.343
180/REF0.001 *0.021 *
190/REF0.000 *0.000 *0.034 *
200/REF0.005 *0.0520.6390.013 *
* Values are significant at p < 0.05. Error: between MS = mean squares, DF = degrees of freedom. REF = reference, with no treatment. Modification: 160 = heat treatment at 160 °C; 170 = heat treatment at 170 °C; 180 = heat treatment at 180 °C; 190 = heat treatment at 190 °C; 200 = heat treatment at 200 °C.
Table A13. Duncan´s multiple range test for changes in degree of gloss at 85°.
MS = 30963
DF = 145
160/REF170/REF180/REF190/REF200/REF
160/REF
170/REF0.296
180/REF0.9790.304
190/REF0.8680.3420.857
200/REF0.1450.6240.1490.176
* Values are significant at p < 0.05. Error: between MS = mean squares, DF = degrees of freedom. REF = reference, with no treatment. Modification: 160 = heat treatment at 160 °C; 170 = heat treatment at 170 °C; 180 = heat treatment at 180 °C; 190 = heat treatment at 190 °C; 200 = heat treatment at 200 °C.

References

  1. Dudík, R.; Šišák, L.; Riedl, M. Regeneration of declining spruce stands in the Czech Republic—Economic view of an alternative species composition. In Book of Abstracts, Proceedings of the Sustainable Forest Management for the Future—The Role of Managerial Economics and Accounting, Zagreb, Croatia, 10–12 May 2018; Posavec, S., Ed.; Faculty of Forestry University of Zagreb: Zagreb, Croatia, 2018; pp. 25–26. [Google Scholar]
  2. Borůvka, V.; Zeidler, A.; Holeček, T.; Dudík, R. Elastic and Strength Properties of Heat-Treated Beech and Birch Wood. Forests 2018, 9, 197. [Google Scholar] [CrossRef] [Green Version]
  3. Borůvka, V.; Dudík, R.; Zeidler, A.; Holeček, T. Influence of Site Conditions and Quality of Birch Wood on Its Properties and Utilization after Heat Treatment. Part I—Elastic and Strength Properties, Relationship to Water and Dimensional Stability. Forests 2019, 10, 189. [Google Scholar] [CrossRef] [Green Version]
  4. Dudík, R.; Borůvka, V.; Zeidler, A.; Holeček, T.; Riedl, M. Influence of Site Conditions and Quality of Birch Wood on Its Properties and Utilization after Heat Treatment. Part II—Surface Properties and Marketing Evaluation of the Effect of the Treatment on Final Usage of Such Wood. Forests 2020, 12, 556. [Google Scholar] [CrossRef]
  5. Esteves, B.M.; Pereira, H.M. Wood modification by heat treatment: A review. BioResources 2009, 4, 370–404. [Google Scholar] [CrossRef]
  6. Hill, C.A.S. Wood Modification: Chemical, Thermal and Other Processes; John Wiley & Sons: London, UK, 2006; p. 260. ISBN 978-0-470-02172-9. [Google Scholar]
  7. ITA (International Thermowood Association). Thermowood Handbook; International Thermowood Association: Helsinki, Finland, 2003; Available online: https://asiakas.kotisivukone.com/files/en.thermowood.palvelee.fi/downloads/tw_handbook_080813.pdf (accessed on 15 March 2021).
  8. Reinprecht, L. Wood Deterioration, Protection and Maintenance, 1st ed.; John Wiley & Sons: Oxford, UK, 2016; p. 376. ISBN 978-1119106531. [Google Scholar]
  9. Sandberg, D.; Kutnar, A.; Mantanis, G. Wood modification technologies—A review. iForest 2017, 10, 895–908. [Google Scholar] [CrossRef] [Green Version]
  10. Haviarová, E.; Babiak, M.; Nemec, Ľ.; Joščák, P. Teplotný vnem človeka a tepelné vlastnosti vybraných materiálov a drevín používaných k tvorbe komplexného interiéru (Temperature sense of a person and thermal properties of selected materials and wood species used at the complex interior formation). Acta Fac. Xylologiae Zvolen 1996, 38, 7–14. [Google Scholar]
  11. Sadoh, T.; Nakato, K. Surface properties of wood in physical and sensory aspects. Wood Sci. Technol. 1987, 21, 111–120. [Google Scholar] [CrossRef]
  12. Tsoumis, G.T. Science and Technology of Wood—Structure, Properties, Utilization, 1st ed.; Van Nostrand Reinhold: New York, NY, USA, 1991; p. 494. ISBN 9780442239855. [Google Scholar]
  13. ČSN EN 12664. Tepelné Chování Stavebních Materiálů a Výrobků—Stanovení Tepelného Odporu Metodami Chráněné Topné Desky a Měřidla Tepelného Toku—Suché a Vlhké Výrobky o Středním a Nízkém Tepelném Odporu (Thermal Performance of Building Materials and Products—Determination of Thermal Resistance by Means of Guarded Hot Plate and Heat Flow Meter Methods—Dry and Moist Products with Medium and Low Thermal Resistence); Czech Office for Standards, Metrology and Testing: Prague, Czech Republic, 2001. [Google Scholar]
  14. ČSN EN 12667. Tepelné Chování Stavebních Materiálů a Výrobků—Stanovení Tepelného Odporu Metodami Chráněné Topné Desky a Měřidla Tepelného Toku—Výrobky o Vysokém a Středním Tepelném Odporu (Thermal Performance of Building Materials and Products—Determination of Thermal Resistance by Means of Guarded Hot Plate and Heat Flow Meter Methods—Products of High and Medium Thermal Resistence); Czech Office for Standards, Metrology and Testing: Prague, Czech Republic, 2001. [Google Scholar]
  15. Bouguerra, A.; Ledhem, A.; Laurent, J.P.; Diop, M.B.; Queneudec, M. Thermal effusivity of two-phase wood cement-based composites. J. Phys. D Appl. Phys. 1998, 31, 2184–2190. [Google Scholar] [CrossRef]
  16. Bouguerra, A.; Diop, M.B.; Laurent, J.P.; Benmalek, M.L.; Queneudec, M. Effect of moisture content on the thermal effusivity of wood cement-based composites. J. Phys. D Appl. Phys. 1998, 31, 3457–3462. [Google Scholar] [CrossRef]
  17. Gustafsson, S.E.; Karawacki, E.; Chohan, M.A. Thermal transport studies of electrically conducting materials using the transient hot-strip technique. J. Phys. D Appl. Phys. 1986, 19, 727–735. [Google Scholar] [CrossRef]
  18. Harada, T.; Hata, T.; Ishihara, S. Thermal constants of wood during the heating process measured with the laser flash method. J. Wood Sci. 1998, 44, 425–431. [Google Scholar] [CrossRef]
  19. He, Y. Rapid thermal conductivity measurement with a hot disk sensor. Thermochim. Acta 2005, 436, 130–134. [Google Scholar] [CrossRef]
  20. Hrčka, R.; Babiak, M. Wood Thermal Properties. In Wood in Civil Engineering, 2nd ed.; Concu, G., Ed.; IntechOpen: Rijeka, Croatia, 2017; pp. 25–43. [Google Scholar] [CrossRef] [Green Version]
  21. Hrčka, R.; Babiak, M. Some non-traditional factors influencing thermal properties of wood. Wood Res. 2012, 57, 367–374. [Google Scholar]
  22. Cha, J.; Seo, J.; Kim, S. Building materials thermal conductivity measurement and correlation with heat flow meter, laser flash analysis and TCi. J. Therm. Anal. Calorim. 2012, 109, 295–300. [Google Scholar] [CrossRef]
  23. Kadem, S.; Lachemet, A.; Younsi, R.; Kocaefe, D. 3d-Transient modeling of heat and mass transfer during heat treatment of wood. Int. Commun. Heat Mass Transf. 2011, 38, 717–722. [Google Scholar] [CrossRef]
  24. Kotlarewski, N.J.; Ozarska, B.; Gusamo, B.K. Thermal conductivity of Papua New Guinea balsa wood measured using the needle probe procedure. BioResources 2014, 9, 5784–5793. [Google Scholar] [CrossRef]
  25. Lagüela, S.; Bison, P.; Peron, F.; Romagnoni, P. Thermal conductivity measurements on wood materials with transient plane source technique. Thermochim. Acta 2015, 600, 45–51. [Google Scholar] [CrossRef]
  26. Maeda, K.; Tsunetsugu, Y.; Miyamoto, K.; Shibusawa, T. Thermal properties of wood measured by the hot-disk method: Comparison with thermal properties measured by the steady-state method. J. Wood Sci. 2021, 67, 20. [Google Scholar] [CrossRef]
  27. Olek, W.; Weres, J.; Guzenda, R. Effects of thermal conductivity data on accuracy of modeling heat transfer in wood. Holzforschung 2003, 57, 317–325. [Google Scholar] [CrossRef]
  28. Suleiman, B.; Larfeldt, J.; Leckner, B.; Gustavsson, M. Thermal conductivity and diffusivity of wood. Wood Sci. Technol. 1999, 33, 465–473. [Google Scholar] [CrossRef]
  29. Vay, O.; De Borst, K.; Hansmann, C.; Teischinger, A.; Müller, U. Thermal conductivity of wood at angles to the principal anatomical directions. Wood Sci. Technol. 2015, 49, 577–589. [Google Scholar] [CrossRef]
  30. Weres, J.; Olek, W.; Guzenda, R. Identification of mathematical model coefficients in the analysis of the heat and mass transport in wood. Dry. Technol. 2000, 18, 1697–1708. [Google Scholar] [CrossRef]
  31. Weres, J.; Olek, W. Inverse Finite Element Analysis of Technological Processes of Heat and Mass Transport in Agricultural and Forest Products. Dry. Technol. 2005, 23, 1737–1750. [Google Scholar] [CrossRef]
  32. Yapici, F.; Ozcifci, A.; Esen, R.; Kurt, S. The effect of grain angle and species on thermal conductivity of some selected wood species. BioResources 2011, 6, 2757–2762. [Google Scholar] [CrossRef]
  33. Bottomley, J.T. On the thermal conductivity of water. Proc. R. Soc. A Philospohical Trans. 1881, 172, 537–545. [Google Scholar] [CrossRef] [Green Version]
  34. Griffiths, E.; Kaye, G.W.C. The measurement of thermal conductivity. Proc. R. Soc. A Math. Phys. Eng. Sci. 1923, 104, 71–98. [Google Scholar] [CrossRef]
  35. Hercus, E.O.; Laby, T.H. The thermal conductivity of air. Proc. R. Soc. A Math. Phys. Eng. Sci. 1919, 95, 190–210. [Google Scholar] [CrossRef]
  36. Rohsenow, W.M.; Hartnett, J.P.; Cho, Y.I. Handbook of Heat Transfer, 3rd ed.; McGraw-Hill: New York, NY, USA, 1998; p. 1520. ISBN 9780070535558. [Google Scholar]
  37. Schroeder, D.V. An Introduction to Thermal Physics, 1st ed.; Pearson: London, UK, 1999; p. 432. ISBN 0-201-38027-7. [Google Scholar]
  38. Tritt, T.M. Thermal Conductivity—Theory, Properties, and Applications; Springer: New York, NY, USA, 2004; p. 290. ISBN 0-306-48327-0. [Google Scholar]
  39. Siau, J.F. Transport. Processes in Wood; Springer: Berlin/Heidelberg, Germany, 1984; p. 248. ISBN 978-3-642-69213-0. [Google Scholar]
  40. Zobel, B.J.; Buijtenen, J.P. Wood Variation: Its Causes and Control, 1st ed.; Springer: Berlin/Heidelberg, Germany, 1989; p. 363. ISBN 978-3-642-74071-8. [Google Scholar]
  41. Kollmann, F.F.P.; Côté, W.A. Principles of Wood Science and Technology—I Solid Wood; Springer: Berlin/Heidelberg, Germany, 1968; p. 592. ISBN 978-3-642-87930-2. [Google Scholar]
  42. Niemz, P. Physik des Holzes und der Holzwerkstoffe; DRW-Verlag: Leinfelden-Echterdingen, Germany, 1993; p. 243. ISBN 3-87181-324-9. [Google Scholar]
  43. ČSN 49 0101. Drevo. Všeobecné Požiadavky na Fyzikálne a Mechanické Skúšky (Wood. General Requirements for Physical and Mechanical Testing); Office for Standardization and Measurement: Prague, Czech Republic, 1980. [Google Scholar]
  44. Viitaniemi, P.; Ranta-Maunus, A.; Jämsä, S.; Ek, P. Method for Processing of Wood at Elevated Temperatures. Patent EP-0759137 VTT, 11 May 1995. [Google Scholar]
  45. ČSN EN ISO 11664-4. Kolorimetrie—Část 4: Kolorimetrický Prostor CIE 1976 L*a*b* (Colorimetry—Part 4: CIE 1976 L*a*b* Colour Space); Czech Office for Standards, Metrology and Testing: Prague, Czech Republic, 2011. [Google Scholar]
  46. ČSN EN ISO 11664-6. Kolorimetrie—Část 6: CIEDE2000 Vzorce Výpočtu Barevného Rozdílu (Colorimetry—Part 6: CIEDE2000 Colour-Difference Formula); Czech Office for Standards, Metrology and Testing: Prague, Czech Republic, 2017. [Google Scholar]
  47. ČSN EN ISO 2813. Nátěrové Hmoty—Stanovení Čísla Lesku při Úhlu 20°, 60° a 85° (Paints and Varnishes—Determination of Gloss Value at 20 Degrees, 60 Degrees and 85 Degrees); Czech Office for Standards, Metrology and Testing: Prague, Czech Republic, 2016. [Google Scholar]
  48. ČSN 49 0108. Drevo. Zisťovanie Hustoty (Wood. Determination of the Density); Czech Standards Institute: Prague, Czech Republic, 1993. [Google Scholar]
  49. ČSN 49 0103. Drevo. Zisťovanie Vlhkosti pri Fyzikálnych a Mechanických Skúškach (Wood. Determination of Moisture Content at Physical and Mechanical Testing); Office for Standardization and Measurement: Prague, Czech Republic, 1979. [Google Scholar]
  50. Bucur, V. Nondestructive Characterization and Imaging of Wood, 1st ed.; Springer: Berlin/Heidelberg, Germany, 2003; p. 354. ISBN 978-3-540-43840-3. [Google Scholar]
  51. Dubois, H.; Verkasalo, E.; Claessens, H. Potential of Birch (Betula pendula Roth and B. pubescens Ehrh.) for Forestry and Forest-Based Industry Sector within the Changing Climatic and Socio-Economic Context of Western Europe. Forests 2020, 11, 336. [Google Scholar] [CrossRef] [Green Version]
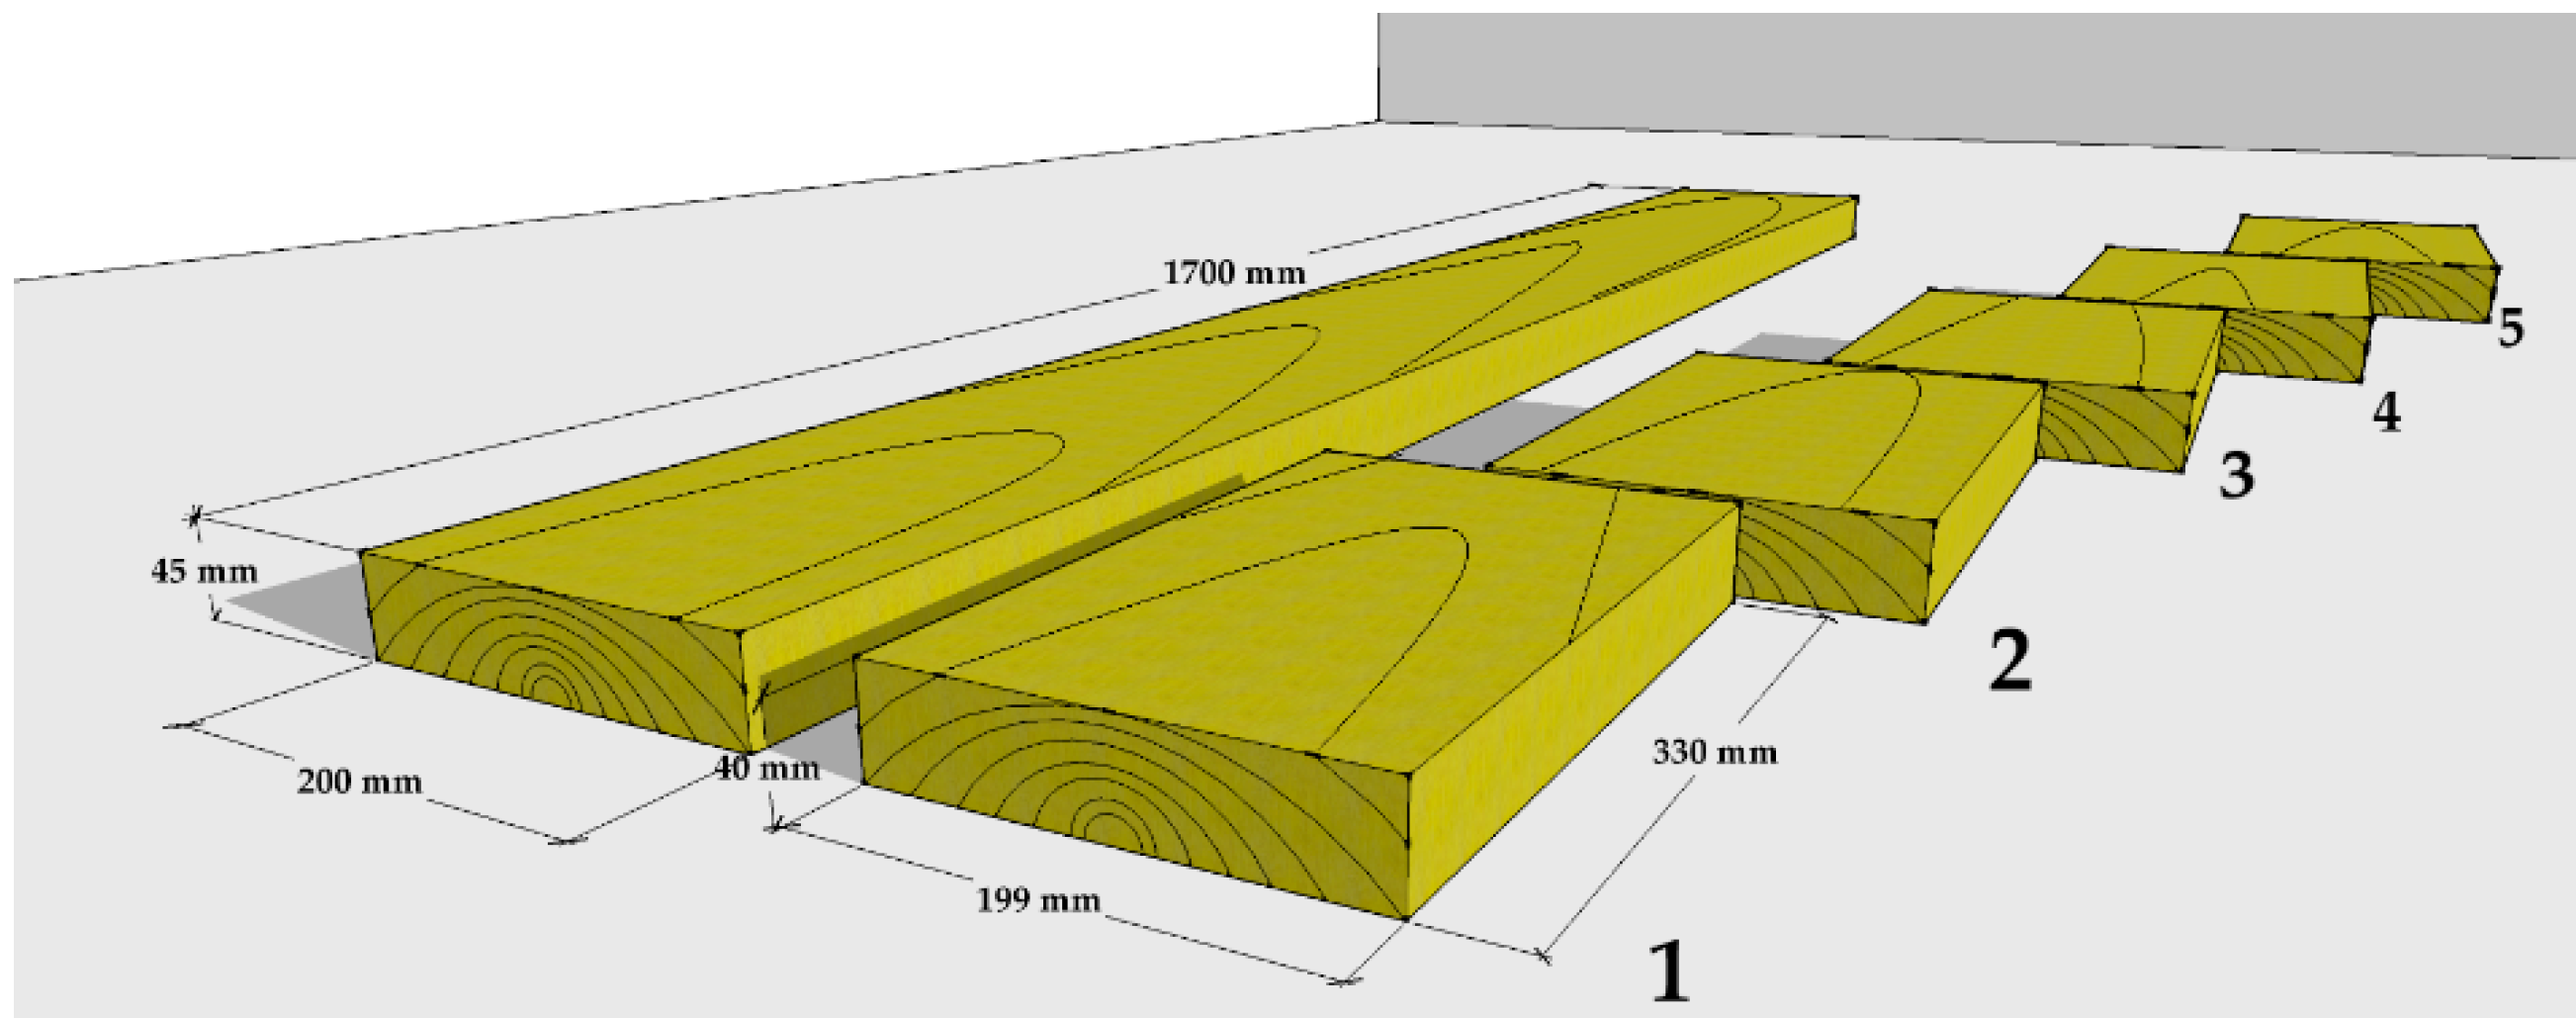
Figure 1. Scheme of preparation of test specimens from the tangential board.
Forests 12 01081 g001
Figure 2. Scheme of gradual comparison of the thickness of the central radial sample.
Forests 12 01081 g002
Figure 3. Scheme of distribution of area of the test sample to the individual measuring places.
Forests 12 01081 g003
Figure 4. Photos from the measurement of thermal characteristics; (a) instrument ISOMET 2114 during measurement, (b) display of the instrument, (c) surface probe of the instrument and test sample.
Forests 12 01081 g004
Figure 5. Practical demonstration of graphic output of multiplanar reconstruction (MPR) and volume rendering technique (VRT) of test specimens from scanning on CT Siemens Somatom Scope Power; (a) MPR of cross section of the sample before modification, (b) MPR of cross section of the sample after modification, (c) VRT of the sample before modification, and (d) VRT of the sample after modification.
Forests 12 01081 g005aForests 12 01081 g005b
Figure 6. Graphic visualization of the effect of heat treatment temperature on (a) thermal conductivity, (b) thermal diffusivity, (c) volume heat capacity, and (d) thermal effusivity. Significance level is at a 95%.
Forests 12 01081 g006
Figure 7. Graphic visualization of the effect of heat treatment temperature to percentage changes of (a) thermal conductivity, (b) thermal diffusivity, (c) volume heat capacity, and (d) thermal effusivity.
Forests 12 01081 g007
Figure 8. Demonstration of the identification of a knot inside a test sample and its exact position (range) through volume rendering technique.
Forests 12 01081 g008
Figure 9. Demonstration of identification of internal cracks in the tested sample and their exact position (range) by volume rendering technique.
Forests 12 01081 g009
Figure 10. Graphic visualization of the effect of heat treatment temperature to percentage changes of wood density and moisture content. REF = reference, with no treatment; 160 = heat treatment at 160 °C; 170 = heat treatment at 170 °C; 180 = heat treatment at 180 °C; 190 = heat treatment at 190 °C; 200 = heat treatment at 200 °C.
Forests 12 01081 g010
Figure 11. Graphic visualization of the effect of board (test sample) thickness on (a) thermal conductivity, (b) thermal diffusivity, (c) volume heat capacity, and (d) thermal effusivity. The monitored area is in the red oval.
Forests 12 01081 g011
Figure 12. The relationship between (a) volume heat capacity and thermal conductivity, (b) volume heat capacity and thermal diffusivity, (c) volume heat capacity and thermal effusivity, and (d) thermal conductivity and thermal effusivity, are shown regardless of heat-treatment degree. Significance level is at a 95%.
Forests 12 01081 g012
Figure 13. Graphic visualization of the effect of heat treatment temperature on (a) brightness, (b) total colour difference, (c) degree of gloss at 20°, and (d) degree of gloss at 60°. Significance level is at a 95%.
Forests 12 01081 g013
Figure 14. Graphic visualization of the effect of heat treatment temperature to percentage changes of (a) brightness, (b) total colour difference, (c) degree of gloss at 20°, and (d) degree of gloss at 60°.
Forests 12 01081 g014aForests 12 01081 g014b
Figure 15. The relationship between (a) brightness and total colour difference, and (b) brightness and degree of gloss at 20°, are shown regardless of heat-treatment degree. Significance level is at a 95%.
Forests 12 01081 g015
Table 1. Descriptive statistics (Mean value and Standard deviation) of thermal characteristics for unmodified birch wood and individual stages of heat-treated birch wood; including defects.
REF *160170180190200
Thermal conductivity0.1350.1250.1290.1120.1140.104
(W/m.K)0.0130.0130.0140.0050.0070.006
Thermal diffusivity0.1790.1710.1730.1650.1670.166
.106 (m2/s)0.0180.0100.0170.0060.0050.005
Volume heat capacity0.7540.7330.7470.6820.6830.631
.10−6 (J/m3.K)0.0620.0720.0720.0400.0450.041
Thermal effusivity318.2302.6309.9276.9278.9256.5
(W.s/m.K)24.328.827.513.017.515.2
Valid N = 90 for all properties. * From all samples before heat treatment. REF = reference, with no treatment. Modification: 160 = heat treatment at 160 °C; 170 = heat treatment at 170 °C; 180 = heat treatment at 180 °C; 190 = heat treatment at 190 °C; 200 = heat treatment at 200 °C.
Table 2. Descriptive statistics (Mean value and Standard deviation) of colour and gloss parameters for unmodified birch wood and individual stages of heat-treated birch wood; including defects.
REF *160170180190200
Brightness72.0866.5361.4158.1245.2040.44
2.803.005.602.223.114.52
Colour parameter a8.937.988.759.7911.7810.28
1.080.610.790.510.490.40
Colour parameter b25.9621.3923.4423.5025.0623.02
1.741.301.031.251.111.89
Total colour difference77.1770.3666.3763.4853.0447.68
2.442.875.061.992.874.68
Degree of gloss at 20°1.00.80.70.70.50.5
(GU)0.20.20.20.10.10.1
Degree of gloss at 60°4.54.23.73.83.13.5
(GU)0.90.71.20.60.50.5
Degree of gloss at 85°2.33.13.23.54.24.6
(GU)0.81.21.20.61.11.4
Valid N = 30 for all properties. * From all samples before heat treatment. REF = reference, with no treatment. Modification: 160 = heat treatment at 160 °C; 170 = heat treatment at 170 °C; 180 = heat treatment at 180 °C; 190 = heat treatment at 190 °C; 200 = heat treatment at 200 °C.
Table 3. Mean values of density and equilibrium moisture content of thermally modified birch wood after air conditioning (RH = 65 ± 5%, t = 20 ± 2 °C).
REF160170180190200
Density (kg/m3)before modification-629640609623613
after modification-617625592601567
Moisture content (%)-13.410.09.58.17.46.3
REF = reference, with no treatment; 160 = heat treatment at 160 °C; 170 = heat treatment at 170 °C; 180 = heat treatment at 180 °C; 190 = heat treatment at 190 °C; 200 = heat treatment at 200 °C.
Publisher’s Note: MDPI stays neutral with regard to jurisdictional claims in published maps and institutional affiliations.