
The Impact of Local Climate Change on Radial Picea abies Growth: A Case Study in Natural Mountain Spruce Stand and Low-Lying Spruce Monoculture


Abstract
:1. Introduction
- The strength and nature of dendroclimatic relationships differ in the natural mountain spruce stand, as well as in those planted outside the area of natural spruce distribution. In the mountain stand, a temperature-driven signal takes place, while the low-situated monoculture is characterized by a moisture-driven signal.
- P. abies growth responses to the consequences of climate change (namely, temperature rise and changes in precipitation distribution) are more consistent in the natural mountain stand when compared to the low-situated monoculture.
2. Materials and Methods
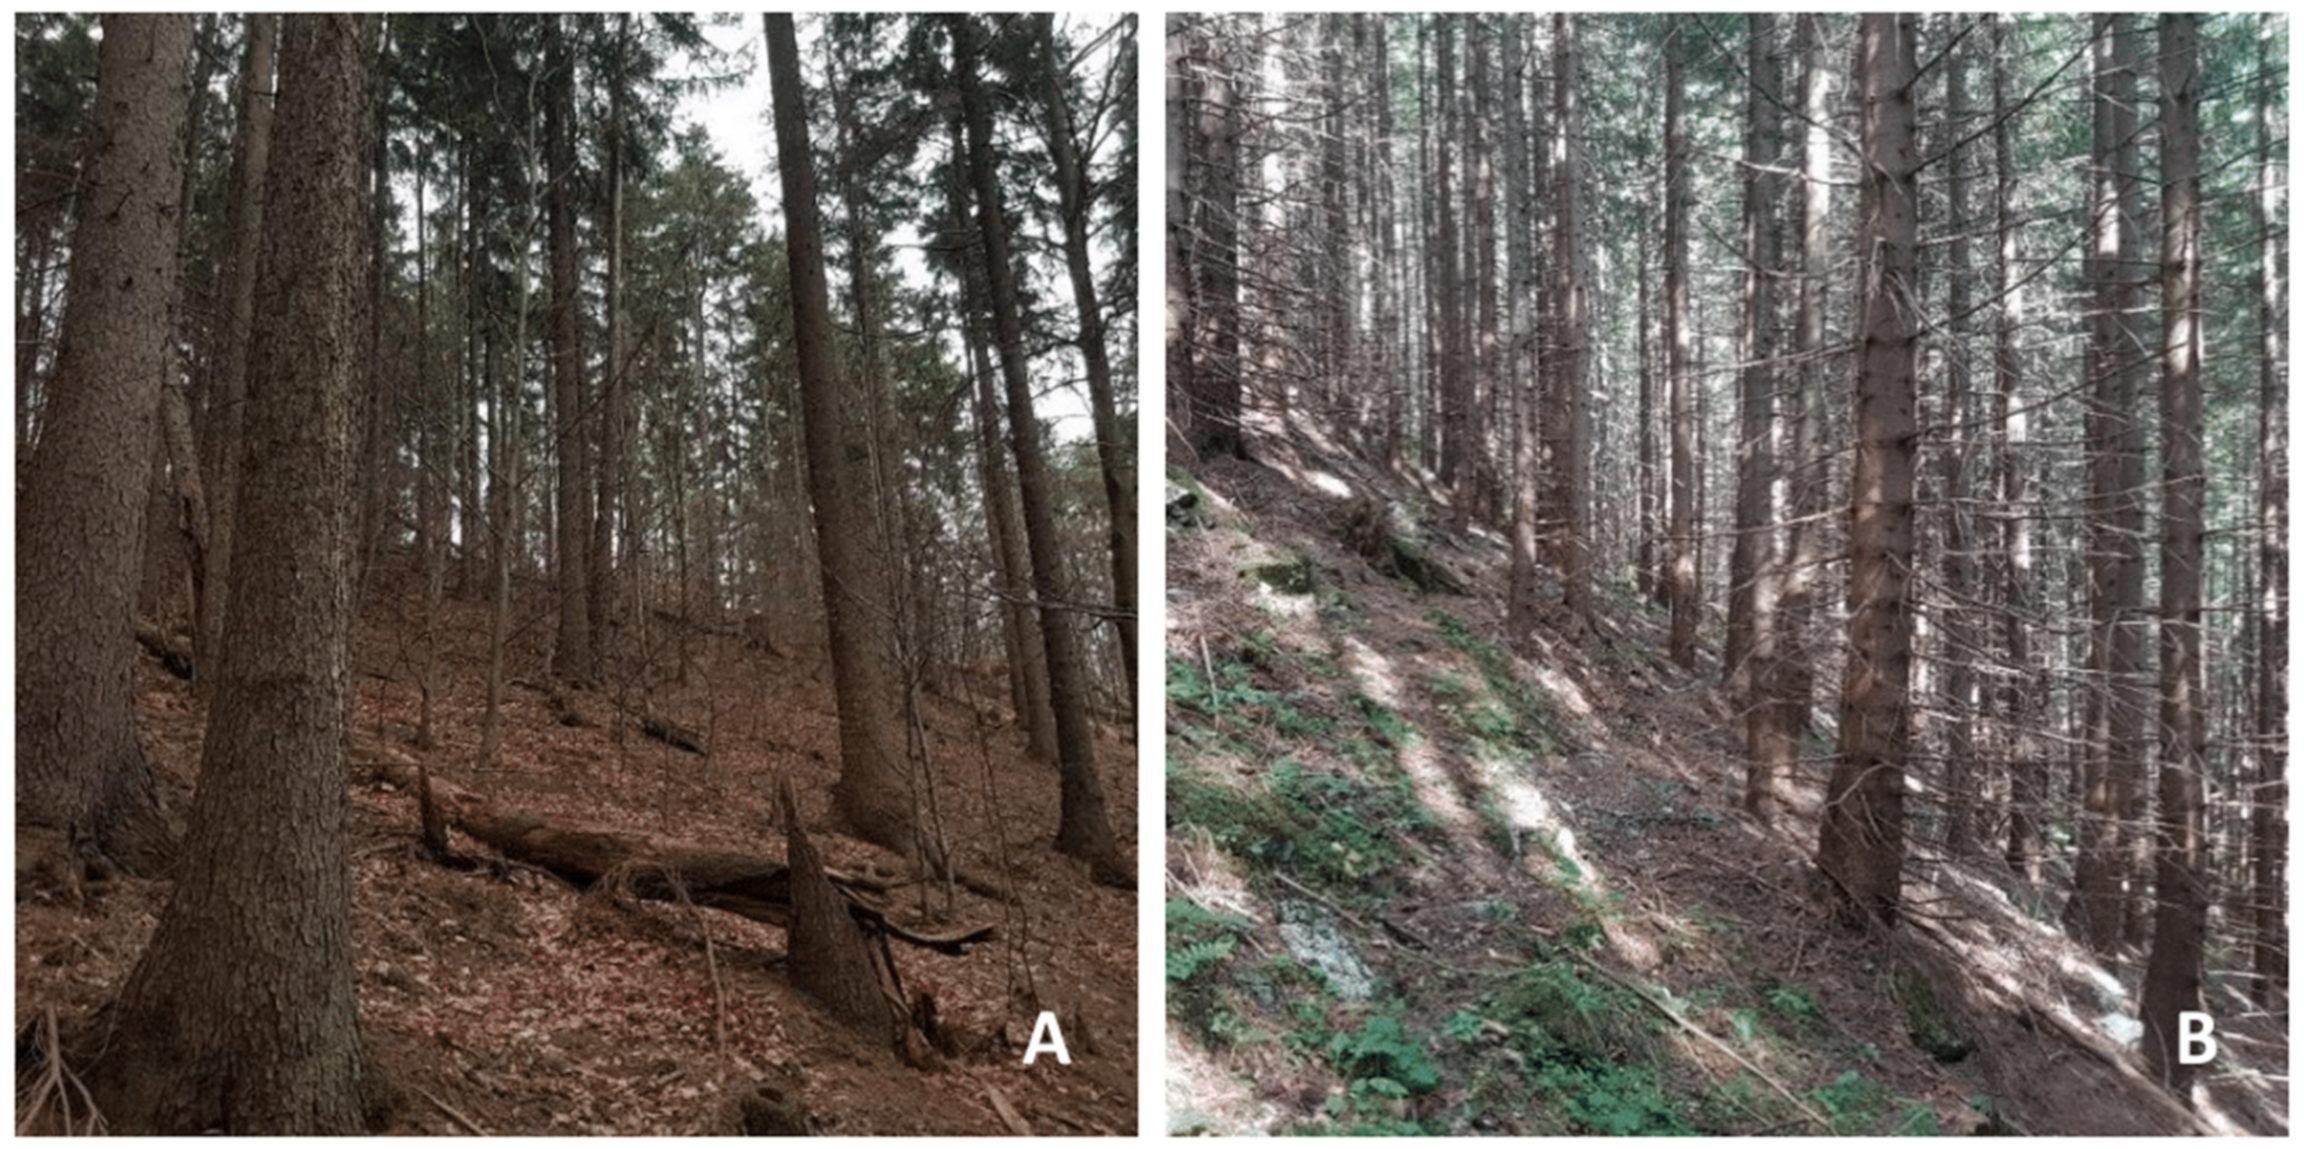
2.1. Study Areas
2.2. Field Sampling and Laboratory Samples Processing
2.3. Building Climate Data Chronologies
2.4. Statistical Processing
3. Results
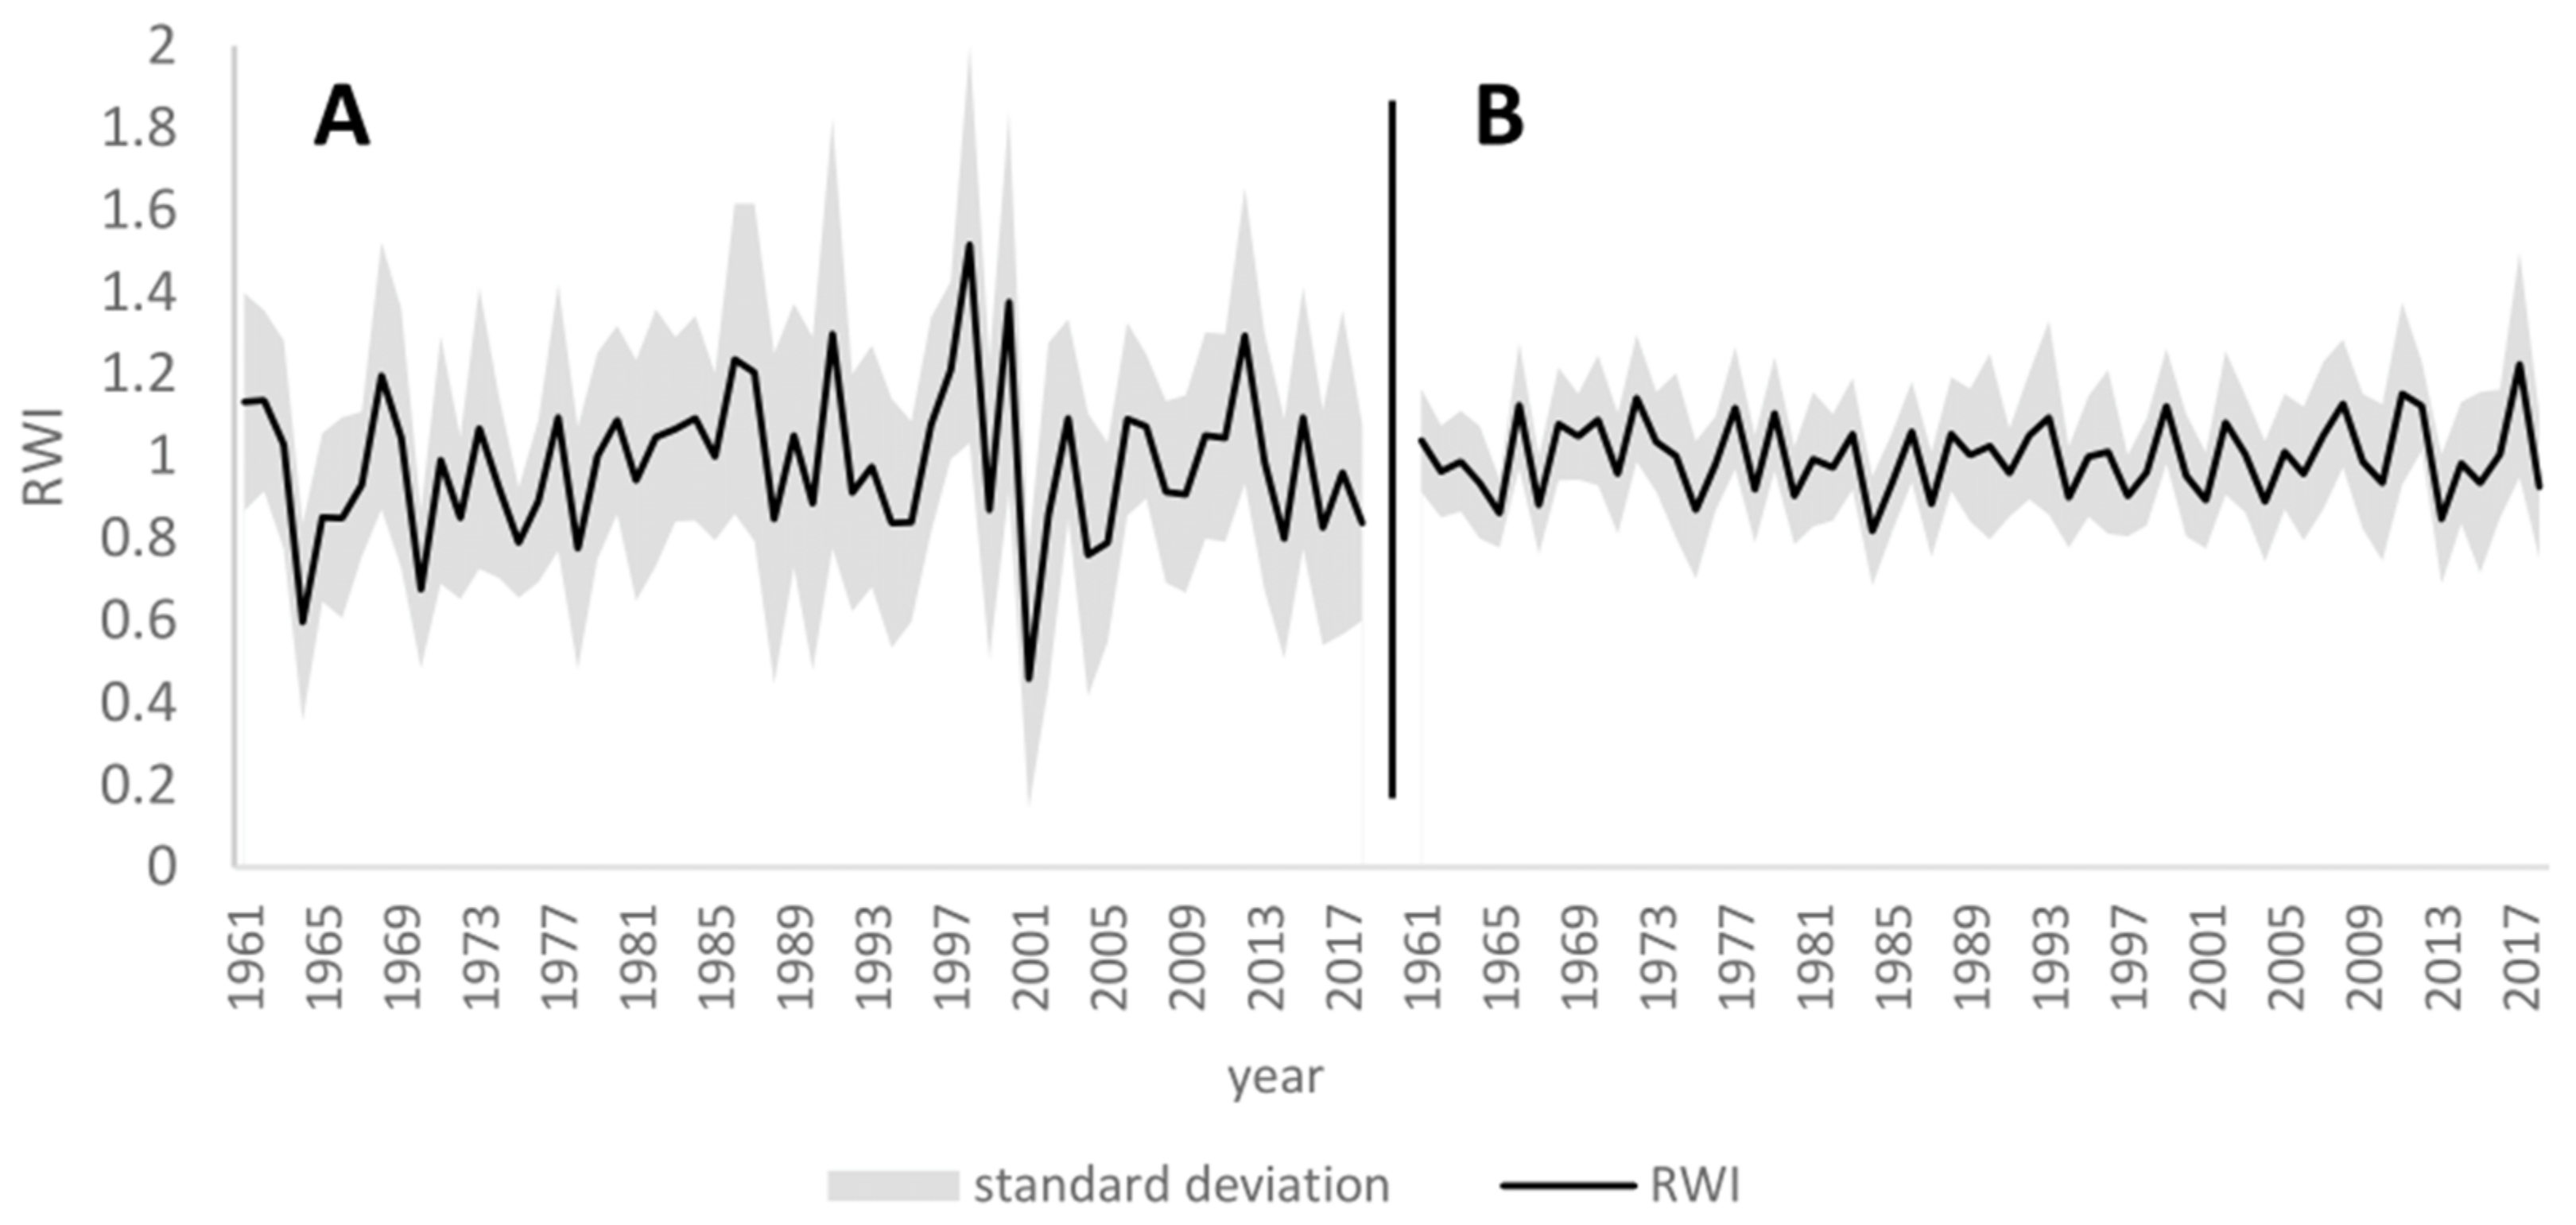
3.1. RWI Chronologies
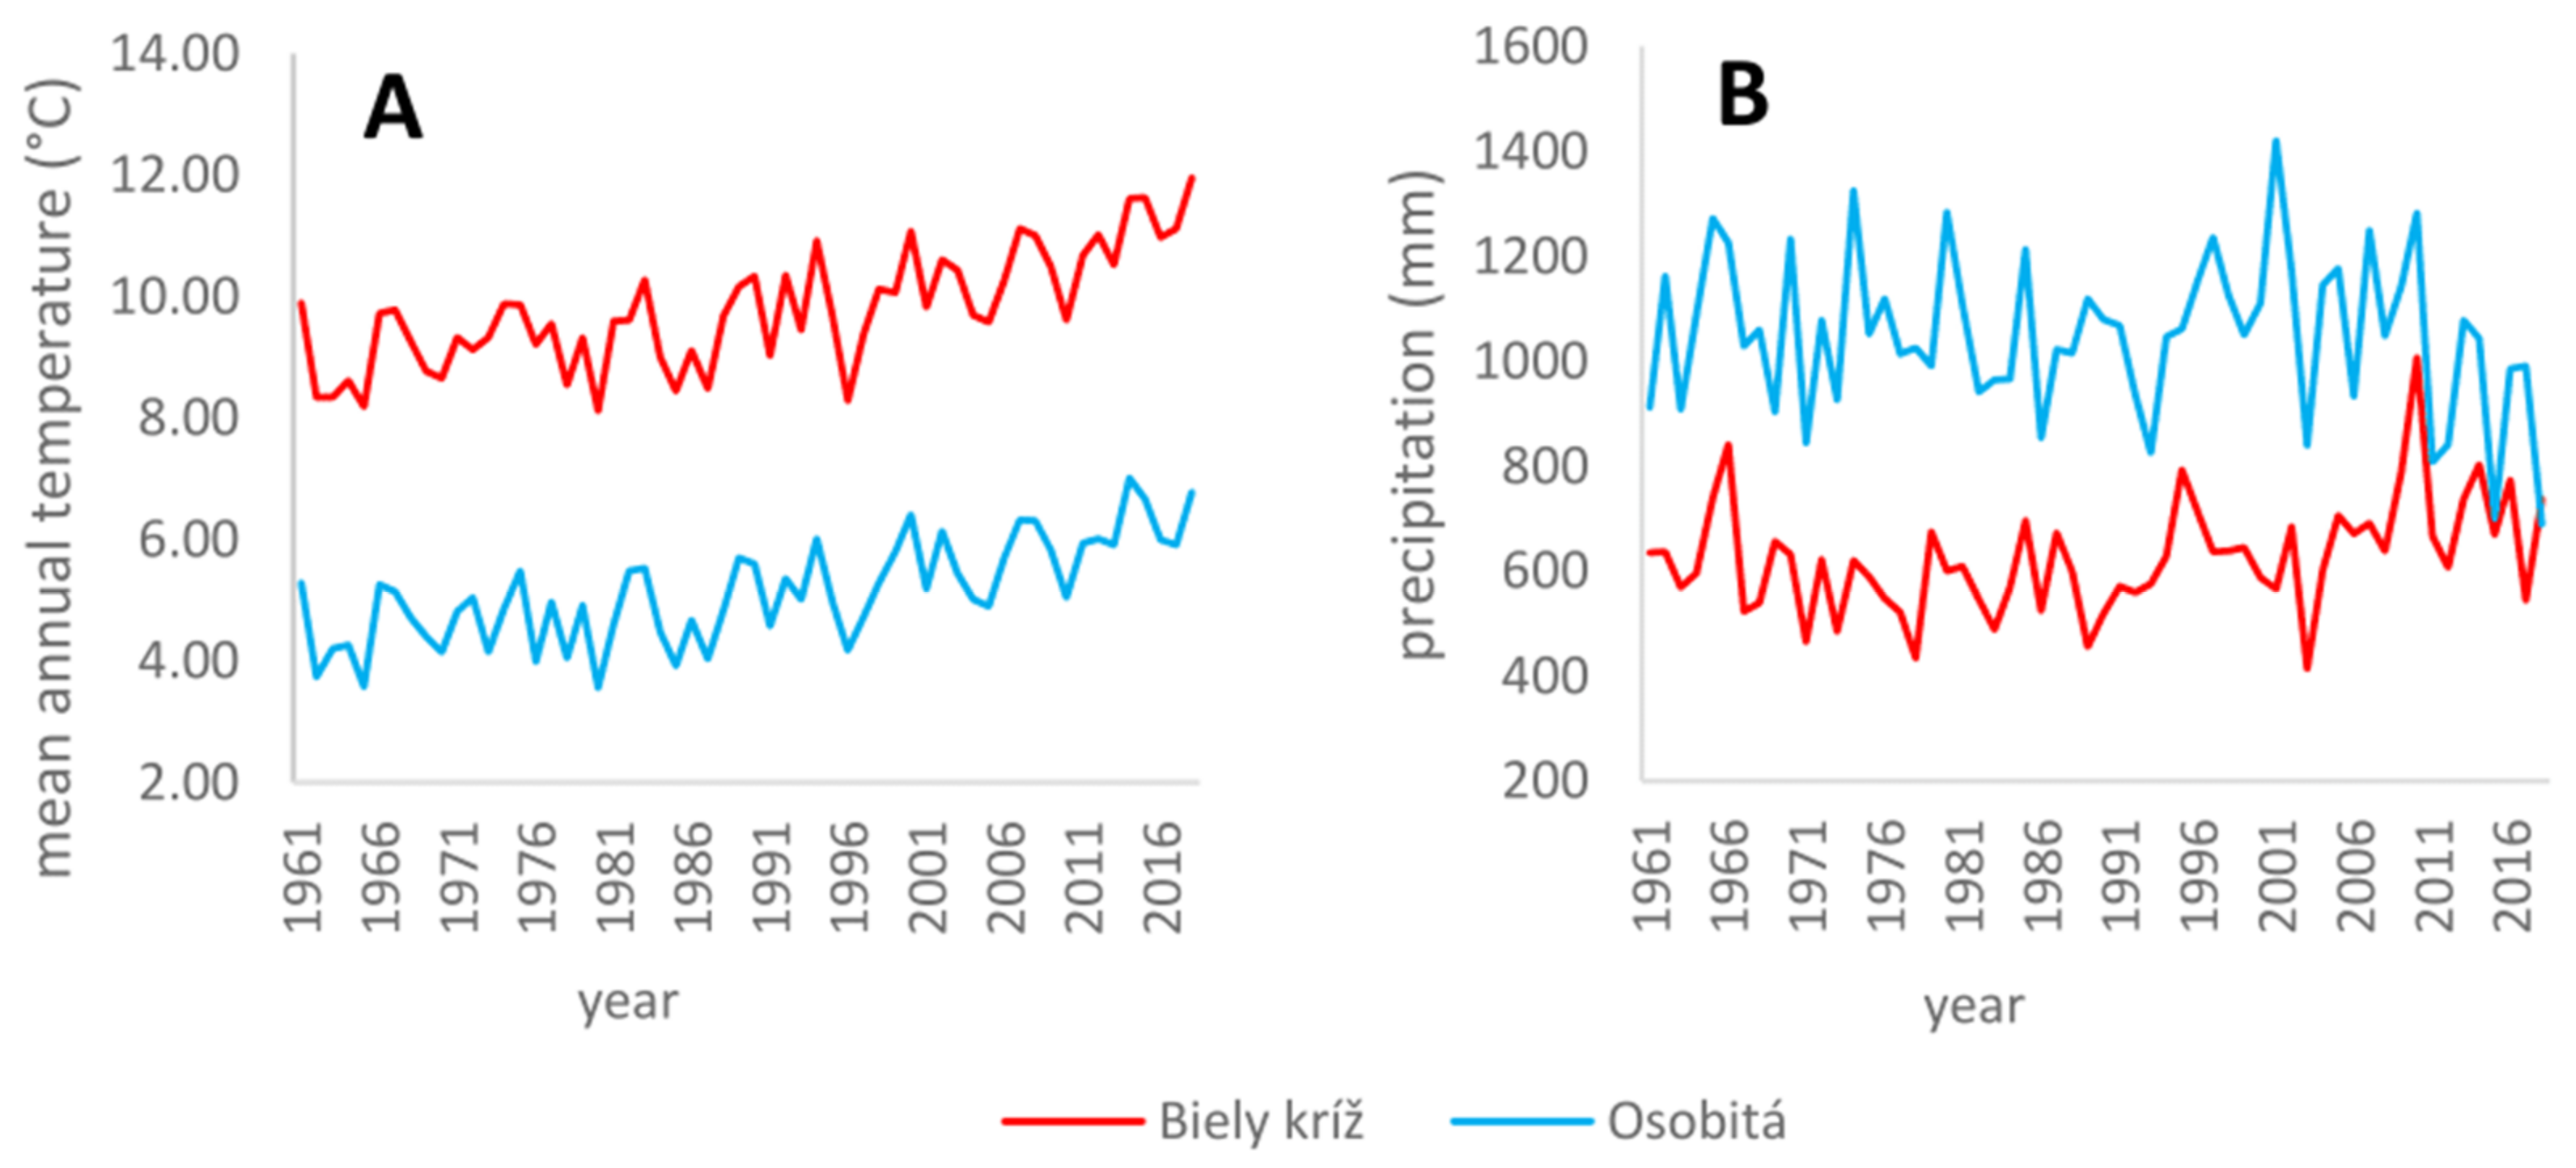
3.2. Temperature and Precipitation Temporal Variability
3.3. Relationships between Tree Ring Record and Climatic Variables
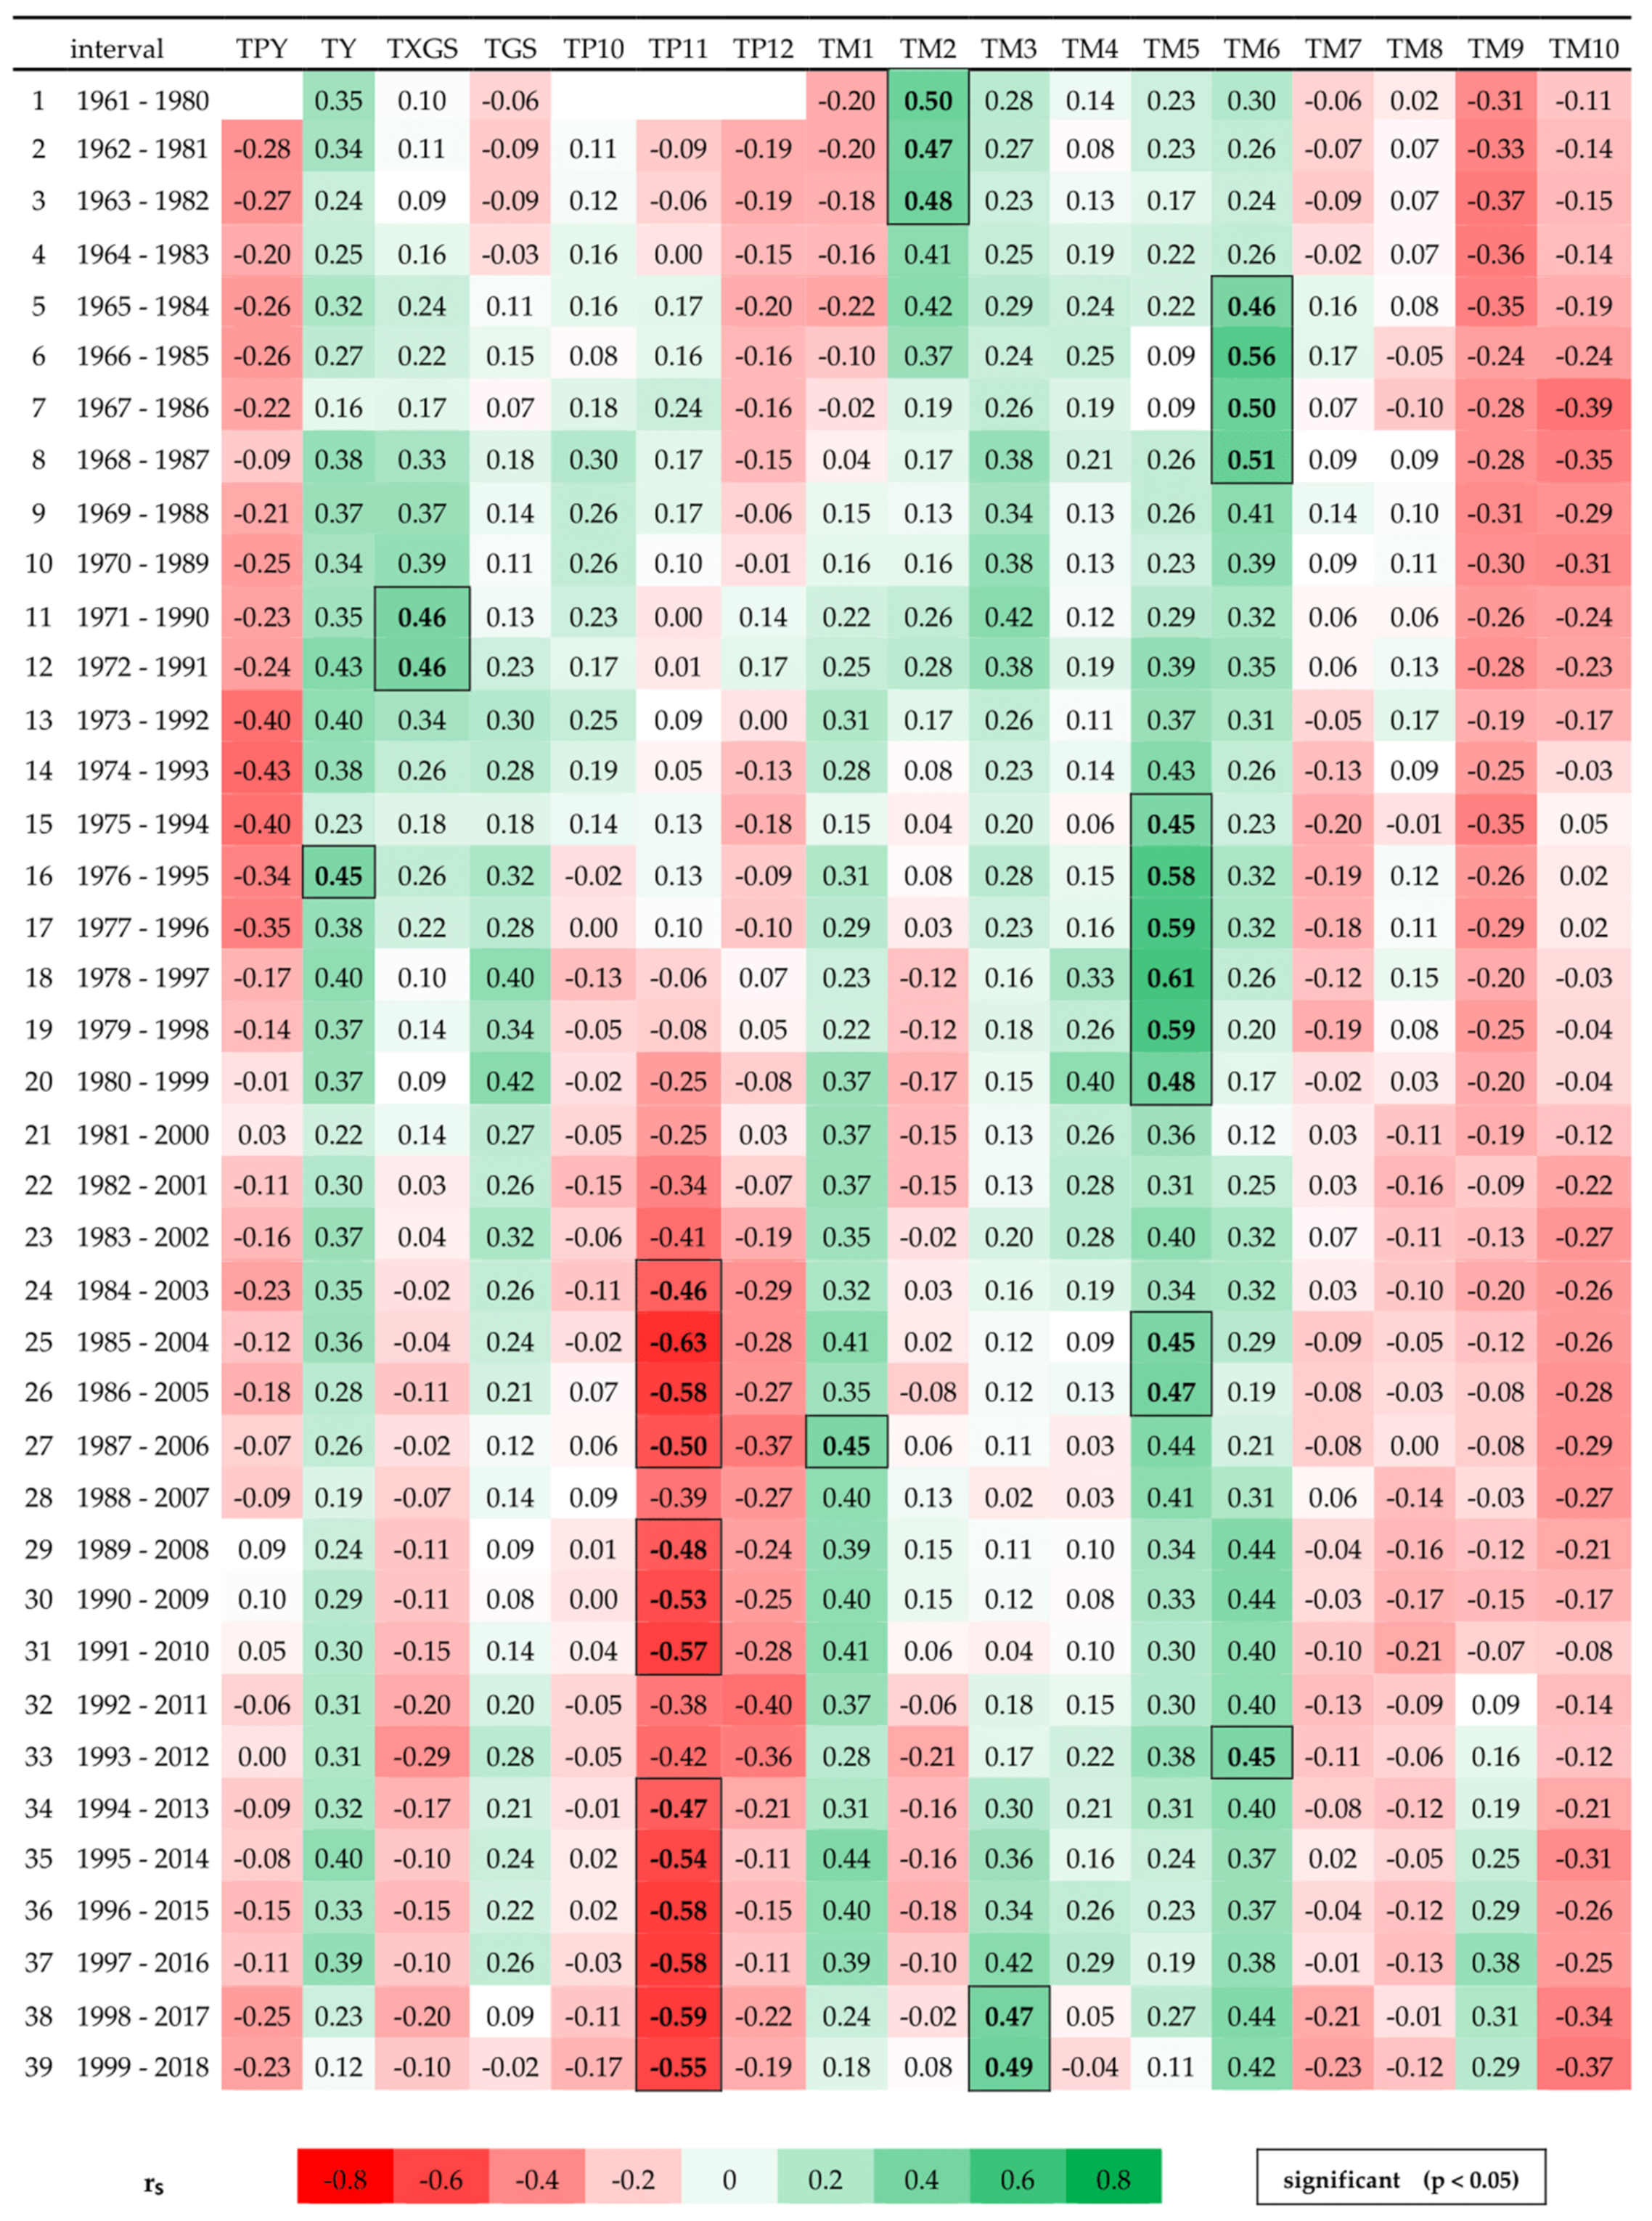
3.3.1. Temporal Variability of the Temperature–Growth Relationships
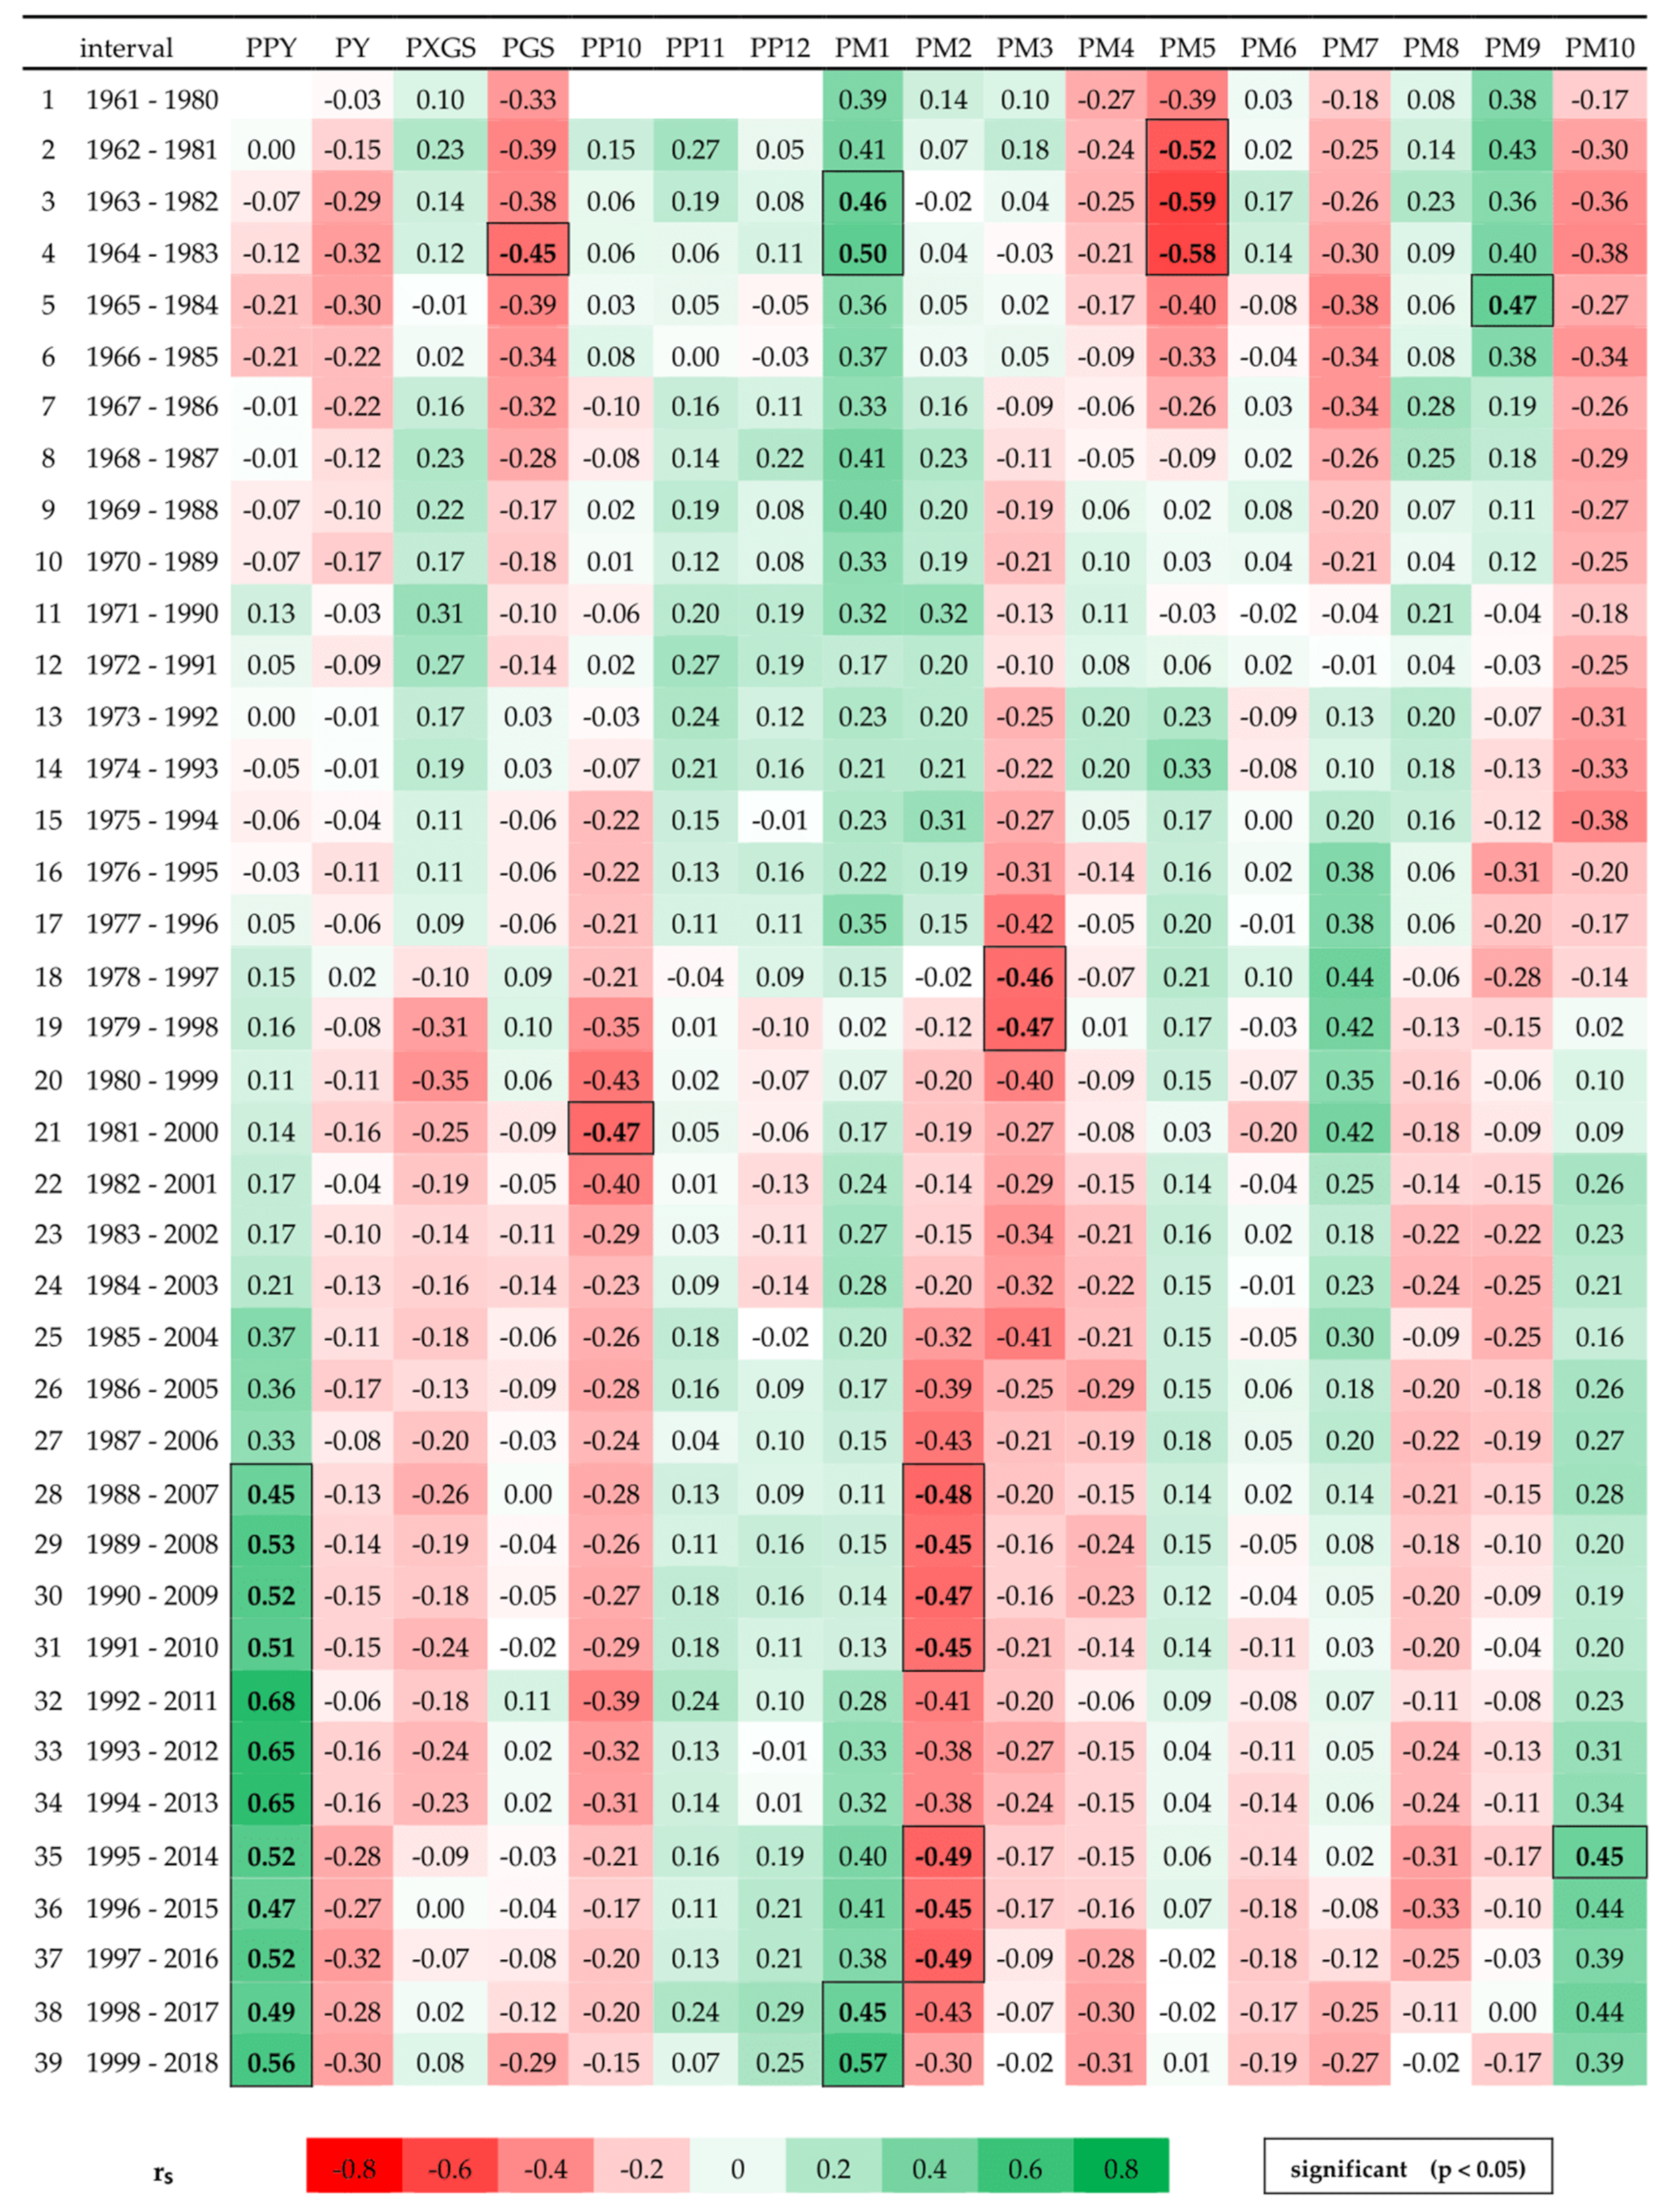
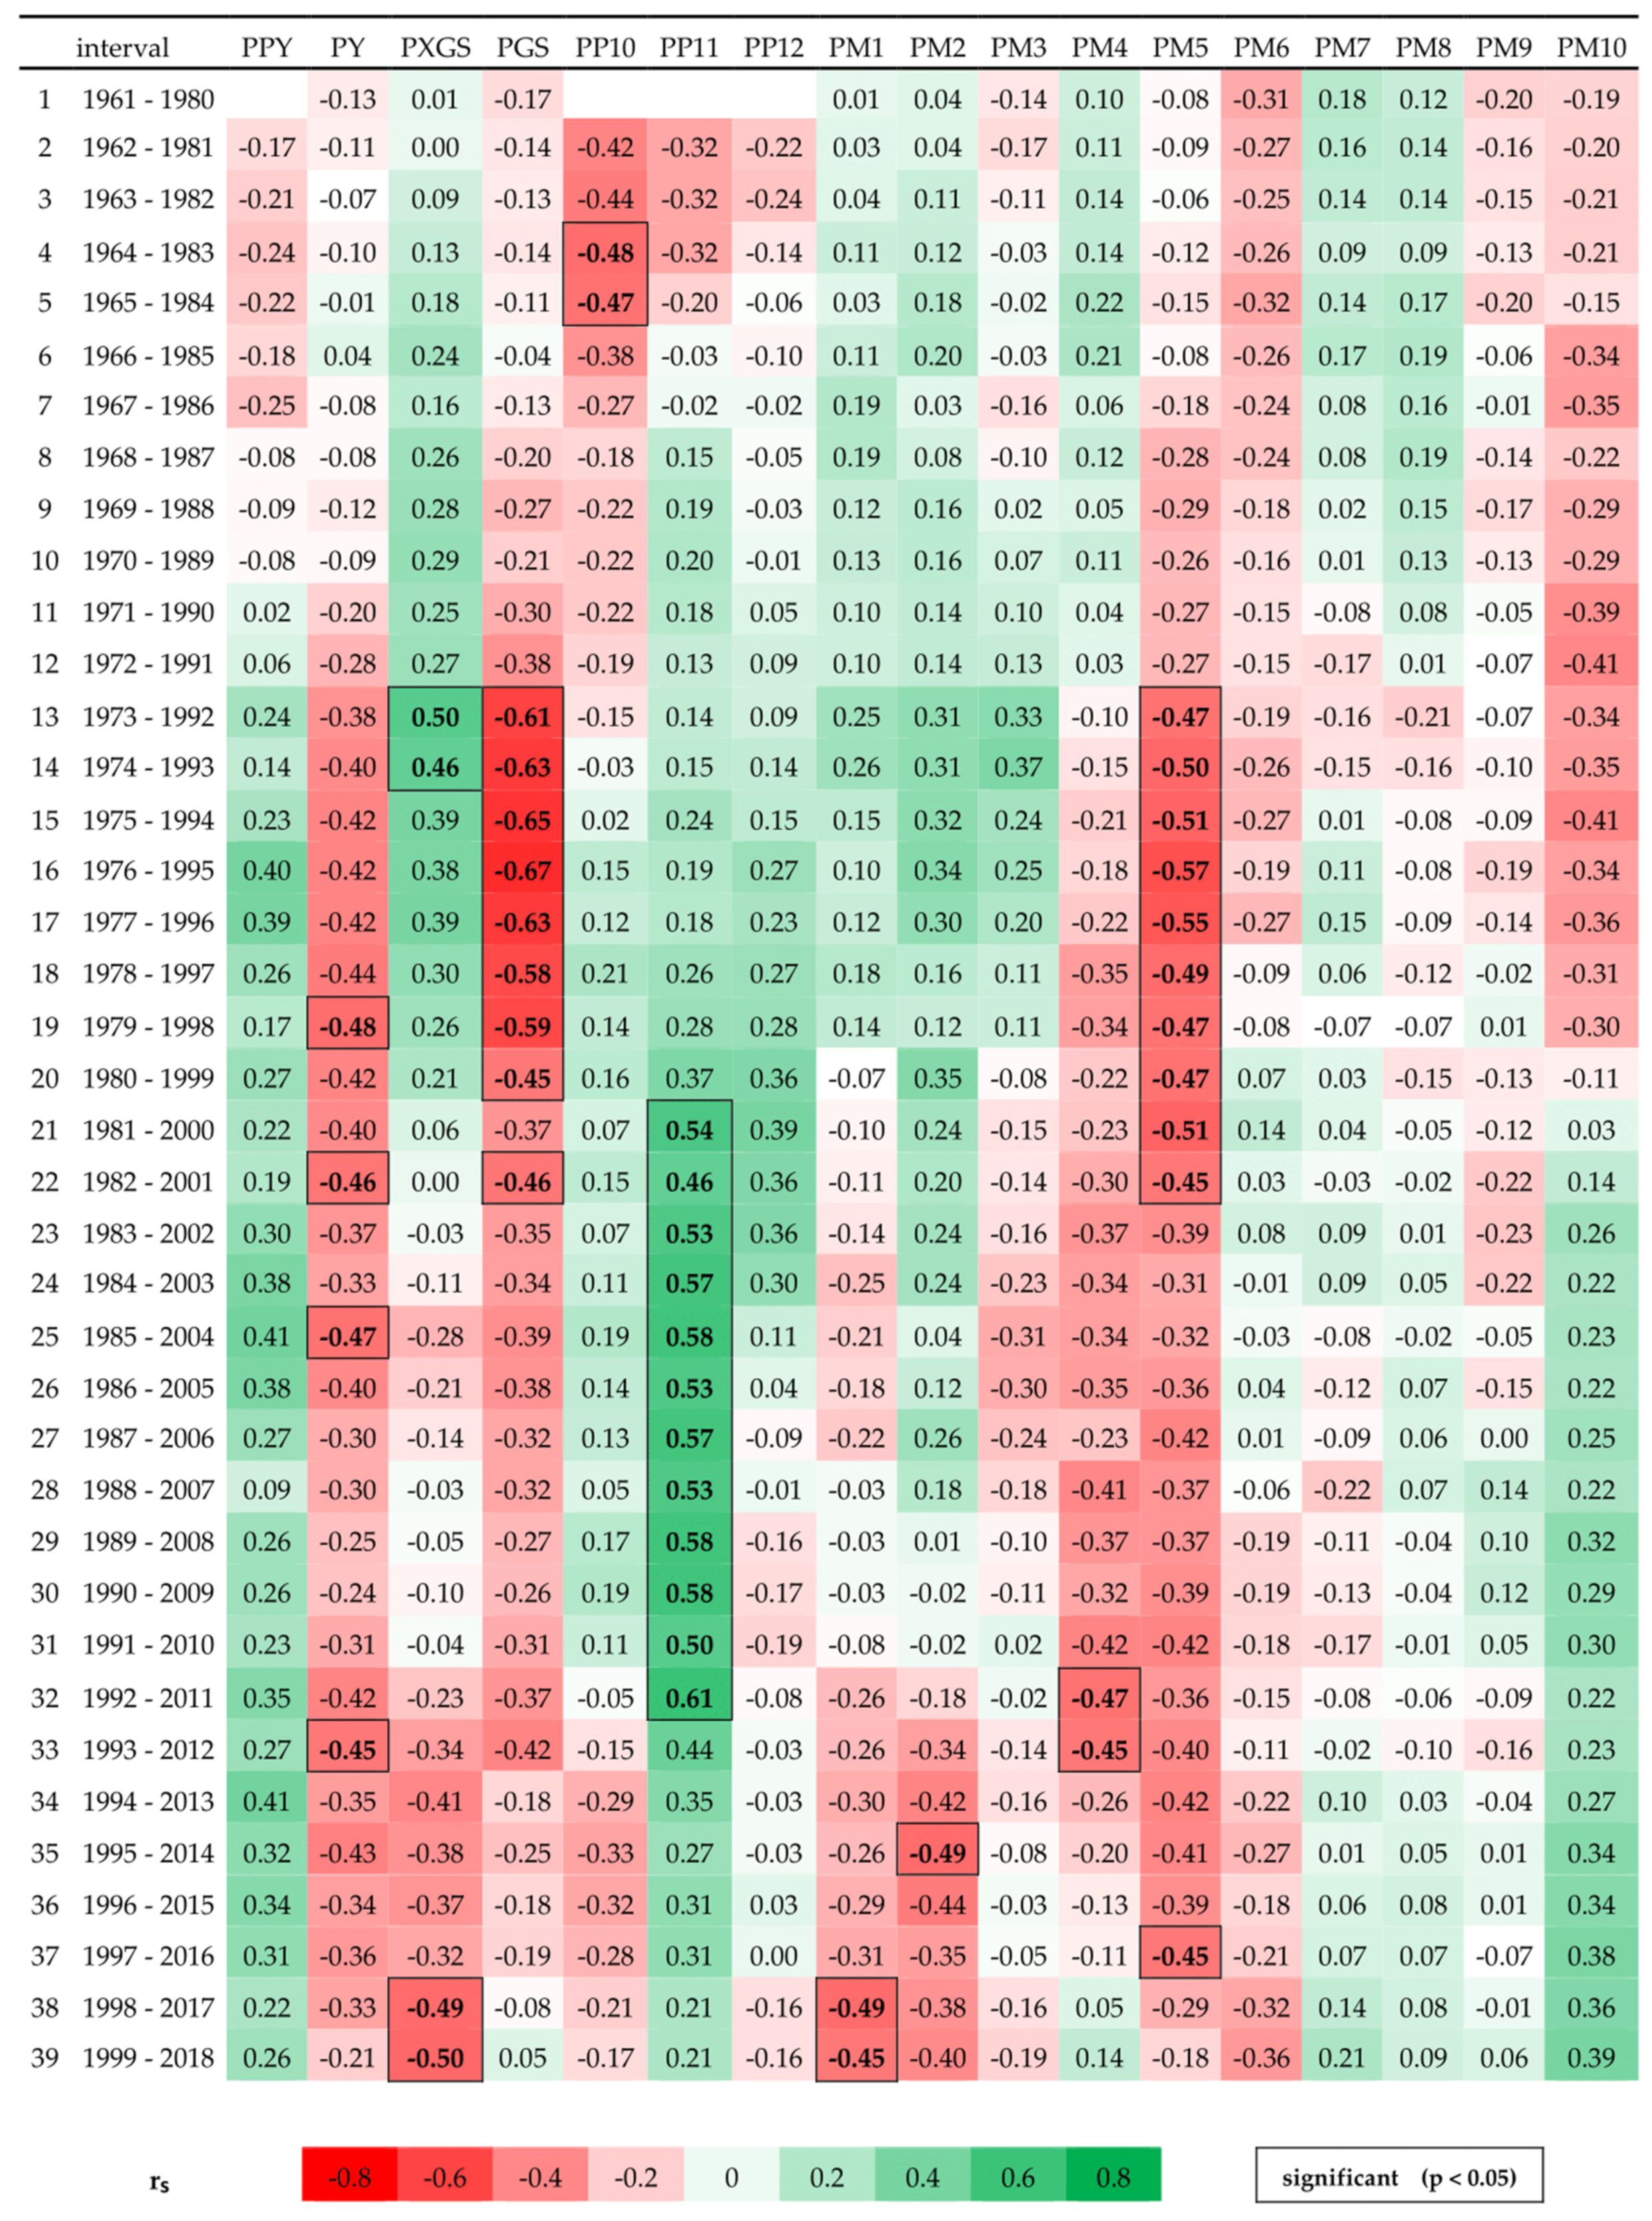
3.3.2. Temporal Variability of the Precipitation–Growth Relationships
4. Discussion
4.1. Temperature as a Driver of the Radial Picea Abies Growth
4.2. Precipitation as a Driver of the Radial Picea Abies Growth
4.3. Identification of Temperature-Driven Signal and Moisture-Driven Signal
4.4. Limitations and Further Research Suggestions
5. Conclusions
Author Contributions
Funding
Data Availability Statement
Conflicts of Interest
Appendix A

| Year | RWI | Year | RWI | Year | RWI | Year | RWI |
|---|---|---|---|---|---|---|---|
| 1961 | 1.13 | 1976 | 0.89 | 1991 | 1.30 | 2006 | 1.09 |
| 1962 | 1.14 | 1977 | 1.10 | 1992 | 0.91 | 2007 | 1.07 |
| 1963 | 1.03 | 1978 | 0.78 | 1993 | 0.98 | 2008 | 0.91 |
| 1964 | 0.60 | 1979 | 1.00 | 1994 | 0.84 | 2009 | 0.91 |
| 1965 | 0.85 | 1980 | 1.09 | 1995 | 0.84 | 2010 | 1.05 |
| 1966 | 0.85 | 1981 | 0.94 | 1996 | 1.08 | 2011 | 1.05 |
| 1967 | 0.93 | 1982 | 1.05 | 1997 | 1.21 | 2012 | 1.30 |
| 1968 | 1.20 | 1983 | 1.07 | 1998 | 1.52 | 2013 | 0.99 |
| 1969 | 1.04 | 1984 | 1.09 | 1999 | 0.87 | 2014 | 0.80 |
| 1970 | 0.68 | 1985 | 1.00 | 2000 | 1.38 | 2015 | 1.09 |
| 1971 | 0.99 | 1986 | 1.24 | 2001 | 0.46 | 2016 | 0.83 |
| 1972 | 0.85 | 1987 | 1.20 | 2002 | 0.86 | 2017 | 0.96 |
| 1973 | 1.07 | 1988 | 0.85 | 2003 | 1.09 | 2018 | 0.84 |
| 1974 | 0.92 | 1989 | 1.05 | 2004 | 0.76 | ||
| 1975 | 0.79 | 1990 | 0.89 | 2005 | 0.79 |
| Year | RWI | Year | RWI | Year | RWI | Year | RWI |
|---|---|---|---|---|---|---|---|
| 1961 | 1.04 | 1976 | 0.98 | 1991 | 0.96 | 2006 | 0.96 |
| 1962 | 0.96 | 1977 | 1.12 | 1992 | 1.05 | 2007 | 1.05 |
| 1963 | 0.99 | 1978 | 0.92 | 1993 | 1.09 | 2008 | 1.13 |
| 1964 | 0.94 | 1979 | 1.10 | 1994 | 0.90 | 2009 | 0.99 |
| 1965 | 0.86 | 1980 | 0.90 | 1995 | 1.00 | 2010 | 0.94 |
| 1966 | 1.12 | 1981 | 0.99 | 1996 | 1.01 | 2011 | 1.15 |
| 1967 | 0.88 | 1982 | 0.97 | 1997 | 0.90 | 2012 | 1.12 |
| 1968 | 1.08 | 1983 | 1.06 | 1998 | 0.96 | 2013 | 0.85 |
| 1969 | 1.05 | 1984 | 0.82 | 1999 | 1.12 | 2014 | 0.98 |
| 1970 | 1.09 | 1985 | 0.94 | 2000 | 0.95 | 2015 | 0.94 |
| 1971 | 0.96 | 1986 | 1.06 | 2001 | 0.89 | 2016 | 1.01 |
| 1972 | 1.14 | 1987 | 0.88 | 2002 | 1.08 | 2017 | 1.22 |
| 1973 | 1.04 | 1988 | 1.05 | 2003 | 1.01 | 2018 | 0.93 |
| 1974 | 1.00 | 1989 | 1.00 | 2004 | 0.89 | ||
| 1975 | 0.87 | 1990 | 1.02 | 2005 | 1.01 |

References
- Škvarenina, J.; Vido, J.; Minďaš, J.; Střelcová, K.; Škvareninová, J.; Flesicher, P.; Bošeľa, M. Globálne Zmeny Klímy a Lesné Ekosystémy; Technical University in Zvolen: Zvolen, Slovakia, 2018; 210p. [Google Scholar]
- Jakuš, R.; Blaženec, M.; Gurtsev, A.; Holuša, J.; Hroššo, B.; Křenova, Z.; Longauerová, V.; Lukášová, K.; Majdák, A.; Mezei, P.; et al. Princípy Ochrany Dospelých Smrekových Porastov Pred Podkôrnym Hmyzom; Department of Forest Ecology of Slovak Academy of Science: Zvolen, Slovakia, 2015; 152p. [Google Scholar]
- Fritts, H.C. Tree Rings and Climate; Academic Press: London, UK, 1976; 567p. [Google Scholar]
- Kyncl, J. Letokruhy Jako Kalendář I Záznamník; Grada: Praha, Czech Republic, 2016; 144p. [Google Scholar]
- Treml, V.; Ponocná, T.; Büntgen, U. Growth trends and temperature responses of treeline Norway spruce in the Czech-Polish Sudetes Mountains. Clim. Res. 2012, 55, 91–103. [Google Scholar] [CrossRef] [Green Version]
- Ponocná, T.; Chuman, T.; Rydval, M.; Urban, G.; Migaɬa, K.; Treml, V. Deviations of treeline Norway spruce radial growth from summer temperatures in East-Central Europe. Agric. For. Meteorol. 2018, 253, 62–70. [Google Scholar] [CrossRef]
- Vitali, V.; Büntgen, U.; Jürgen, B. Seasonality matters—The effects of past and projected seasonal climate change on the growth of native and exotic conifer species in Central Europe. Dendrochronologia 2018, 48, 1–9. [Google Scholar] [CrossRef]
- Cienciala, E.; Altman, J.; Doležal, J.; Kopáček, J.; Štěpánek, P.; Ståhl, G.; Tumajer, J. Increased spruce tree growth in Central Europe since 1960s. Sci. Total Environ. 2018, 619, 1637–1647. [Google Scholar] [CrossRef]
- Altman, J.; Fibich, P.; Šantrůčková, H.; Doležal, J.; Štěpánek, P.; Kopáček, J.; Hůnová, I.; Oulehle, F.; Tumajer, J.; Cienciala, E. Environmental factors exert strong control over the climate-growth relationships of Picea abies in Central Europe. Sci. Total Environ. 2017, 609, 506–516. [Google Scholar] [CrossRef] [PubMed]
- Sedmáková, D.; Sedmák, R.; Bošeľa, M.; Ježík, M.; Blaženec, M.; Hlásny, T.; Marušák, R. Growth-climate responses indicate shifts in the competitive ability of European beech and Norway spruce under recent climate warming in East-Central Europe. Dendrochronologia 2019, 54, 37–48. [Google Scholar] [CrossRef]
- Bošeľa, M.; Sedmák, R.; Sedmáková, D. Vplyv Zmien Prostredia na Dynamiku Radiálneho Rastu Jedle a Smreka v Západných Karpatoch: Konzekvencie pre Strategické Rozhodovanie, Dendrofórum 2014 Aktuální Dendrochronologický Výzkum, Prague, Czech Republic, 20–21 November 2014; Faculty of the Natural Sciences, Charles University: Prague, Czech Republic, 2014. [Google Scholar]
- Parobeková, Z.; Sedmáková, D.; Kucbel, S.; Pittner, J.; Jaloviar, P.; Saniga, M.; Balanda, M.; Vencurik, J. Influence of disturbances and climate on high-mountain Norway spruce forests in the Low Tatra Mts., Slovakia. For. Ecol. Manag. 2016, 380, 128–138. [Google Scholar] [CrossRef]
- Buras, A.; Spyt, B.; Janecka, K.; Kaczka, R. Divergent growth of Norway spruce on Babia Góra Mountain in the western Carpathians. Dendrochronologia 2018, 50, 33–43. [Google Scholar] [CrossRef]
- Kaczka, R.; Czajka, B.; Łajczak, A. The Tree Ring Growth Responses to Climate in the Timberline Ecotone of Babia Góra Mountain. Geogr. Pol. 2015, 88, 163–176. [Google Scholar] [CrossRef] [Green Version]
- Carrer, M.; Motta, R.; Nola, P. Significant Mean and Extreme Climate Sensitivity of Norway Spruce and Silver Fir at Mid-Elevation Mesic Sites in the Alps. PLoS ONE 2012, 11, e50755. [Google Scholar] [CrossRef] [Green Version]
- Ding, H.; Pretzsch, H.; Schütze, G.; Rötzer, T. Size-dependence of tree growth response to drought for Norway spruce and European beech individuals in monospecific and mixed-species stands. Plant Biol. 2017, 5, 709–719. [Google Scholar] [CrossRef]
- Eastaugh, C.; Pötzelsberger, E.; Hasenauer, H. Assessing the impacts of climate change and nitrogen deposition on Norway spruce (Picea abies L. Karst) growth in Austria with BIOME-BGC. Tree Physiol. 2011, 3, 262–274. [Google Scholar] [CrossRef] [PubMed] [Green Version]
- Hlásny, T.; Sitková, Z. Spruce Forest Decline in the Beskids; National Forest Centre, Forest Research Institute: Zvolen, Slovakia; Czech University of Life Sciences: Prague, Czech Republic; Forestry and Game Management Research Institute: Strnady, Czech Republic, 2010; 182p. [Google Scholar]
- Kolář, T.; Čermák, P.; Trnka, M.; Žid, T.; Rybníček, M. Temporal changes in the climate sensitivity of Norway spruce and European beech along an elevation gradient in Central Europe. Agric. For. Meteorol. 2017, 239, 24–33. [Google Scholar] [CrossRef]
- Rybníček, M.; Čermák, P.; Žid, T.; Kolář, T. Radial Growth and Health Condition of Norway Spruce (Picea abies (L.) Karst.) Stands in Relation to Climate (Silesian Beskids, Czech Republic). Geochronometria 2010, 36, 9–16. [Google Scholar] [CrossRef] [Green Version]
- Savva, Y.; Oleksyn, J.; Reich, P.B.; Tjoelker, M.G.; Vaganov, E.A.; Modrzynski, J. Interannual growth response of Norway spruce to climate along an altitudinal gradient in the Tatra Mountains, Poland. Trees 2006, 20, 735–746. [Google Scholar] [CrossRef]
- Sidor, C.G.; Ionel, P.; Vlad, R.; Cherubini, P. Different tree-ring responses of Norway spruce to air temperature across an altitudinal gradient in the Eastern Carpathians (Romania). Trees 2015, 29, 985–997. [Google Scholar] [CrossRef]
- Cook, E.R.; Kairiukstis, L.A. Methods of Dendrochronology: Applications in the Environmental Sciences; Springer: Berlin/Heidelberg, Germany, 2008; 394p. [Google Scholar]
- Stokes, M.A.; Smiley, T.L. An Introduction to Tree-Ring Dating; University of Chicago Press: Chicago, IL, USA, 1968; 73p. [Google Scholar]
- Speer, J.H. Fundamentals of Tree-Ring Research; University of Arizona Press: Tucson, AZ, USA, 2010; 333p. [Google Scholar]
- Vienna Institute of Archaeological Science. Time Table. Installation and Instruction Manual, Ver. 2.1; Vienna Institute of Archaeological Science: Vienna, Austria, 2005. [Google Scholar]
- Holmes, R. Computer-assisted quality control in tree-ring dating and measurement. Tree Ring Bull. 1983, 43, 69. [Google Scholar]
- Cook, E. A Time Series Analysis Approach to Tree-Ring Standardization. Ph.D. Thesis, University of Arizona, Tucson, IL, USA, 1985. [Google Scholar]
- Polanco-Martínez, J.M. RolWinMulCor: An R package for estimating rolling window multiple correlation in ecological time series. Ecol. Inform. 2020, 60, 101163. [Google Scholar] [CrossRef]
- Hartl-Meier, C.; Zang, C.; Dittmar, C.; Esper, J.; Göttlein, A.; Rothe, A. Vulnerability of Norway spruce to climate change in mountain forests of the European Alps. Clim. Res. 2014, 60, 119–132. [Google Scholar] [CrossRef]
- Shelford, V.E. Some concepts of bioecology. Ecology 1931, 3, 455–467. [Google Scholar] [CrossRef]
- Putalová, T.; Vacek, Z.; Vacek, S.; Štefančík, I.; Bulušek, D.; Král, J. Tree-ring widths as an indicator of air pollution stress and climate conditions in different Norway spruce forest stands in the Krkonoše Mts. Cent. Eur. For. J. 2019, 65, 21–33. [Google Scholar]
- Park Williams, A.; Allen, C.D.; Macalady, C.D.; Griffin, D.; Woodhouse, C.A.; Meko, D.M.; Swetnam, T.W.; Rauscher, S.A.; Seager, R.; Grissino-Mayer, H.D.; et al. Temperature as a potent driver of regional forest drought stress and tree mortality. Nat. Clim. Chang. 2012, 3, 292. [Google Scholar] [CrossRef]
- Čejková, A.; Kolář, T. Extreme radial growth reaction of Norway spruce along an altitudinal gradient in the Šumava Mountains. Geochronometria 2009, 1, 41. [Google Scholar] [CrossRef] [Green Version]
- Juráň, S.; Grace, J.; Urban, O. Temporal Changes in Ozone Concentrations and Their Impact on Vegetation. Atmosphere 2021, 12, 82. [Google Scholar] [CrossRef]
- Zapletal, M.; Juráň, S.; Krpeš, V.; Michna, K.; Edwards-Jonášová, M.; Cudlín, P. Effect of Ozone Flux on Selected Structural and Antioxidant Characteristics of a Mountain Norway Spruce Forest. Balt. For. 2018, 24, 261–267. [Google Scholar]

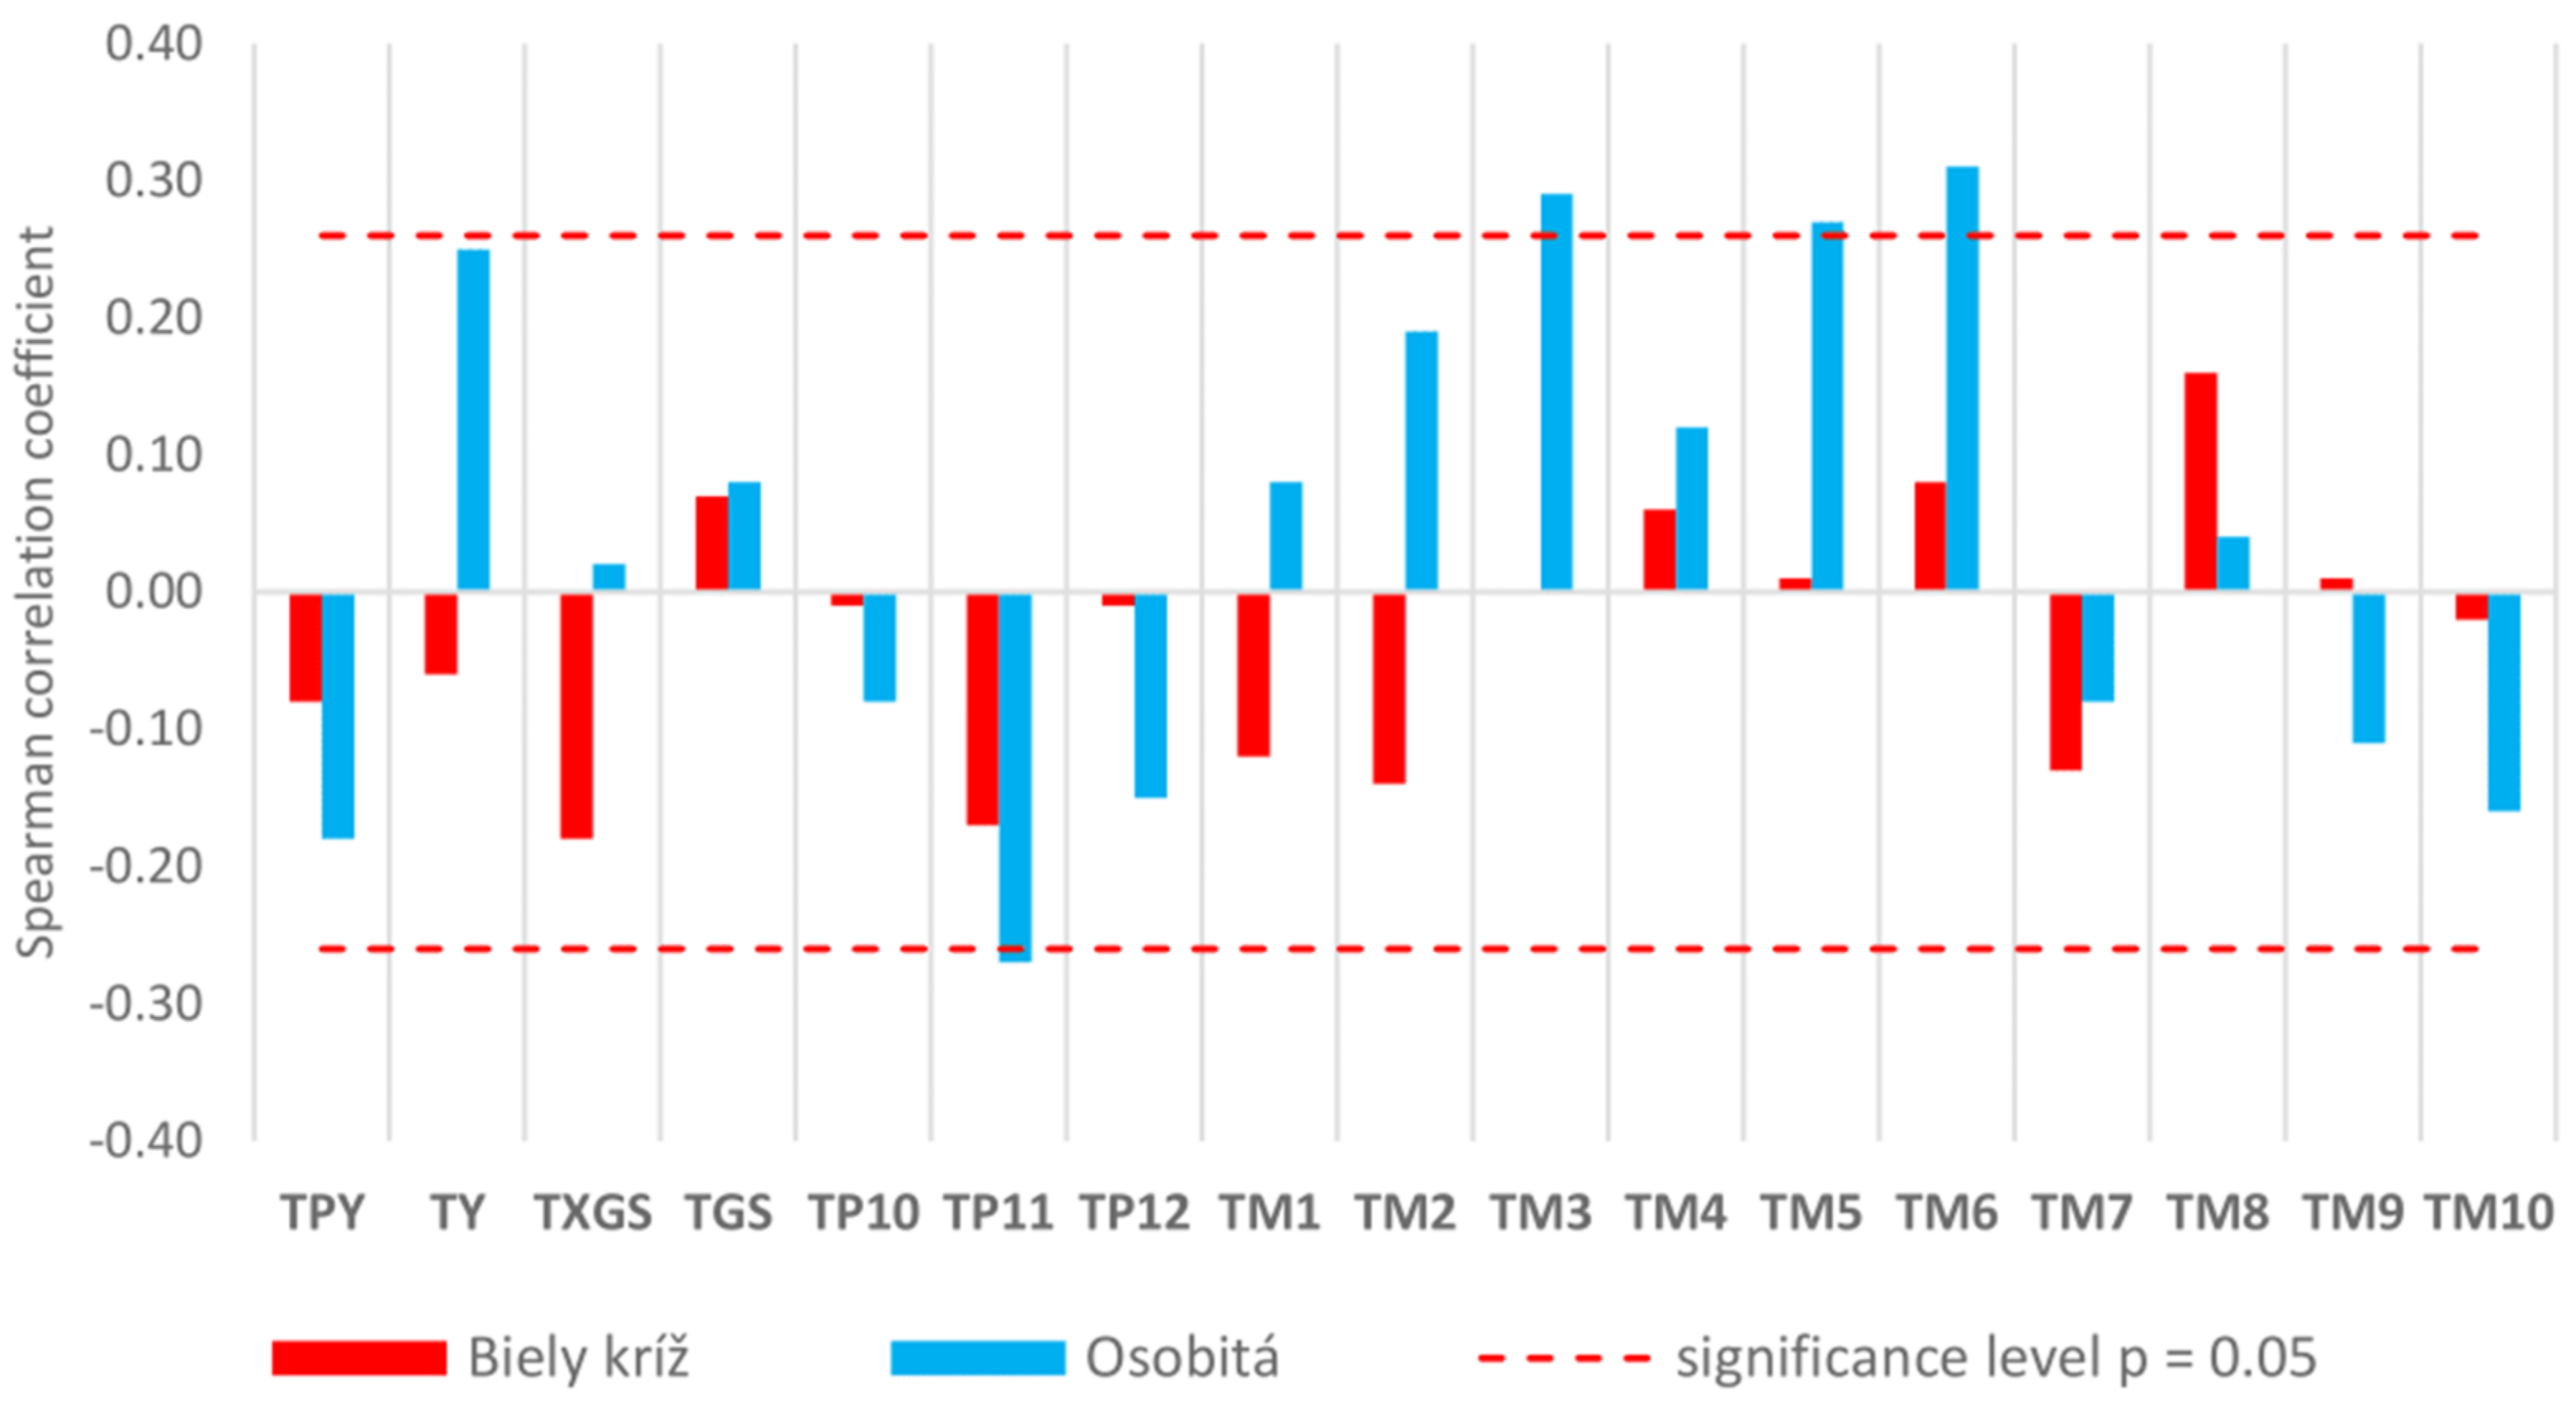
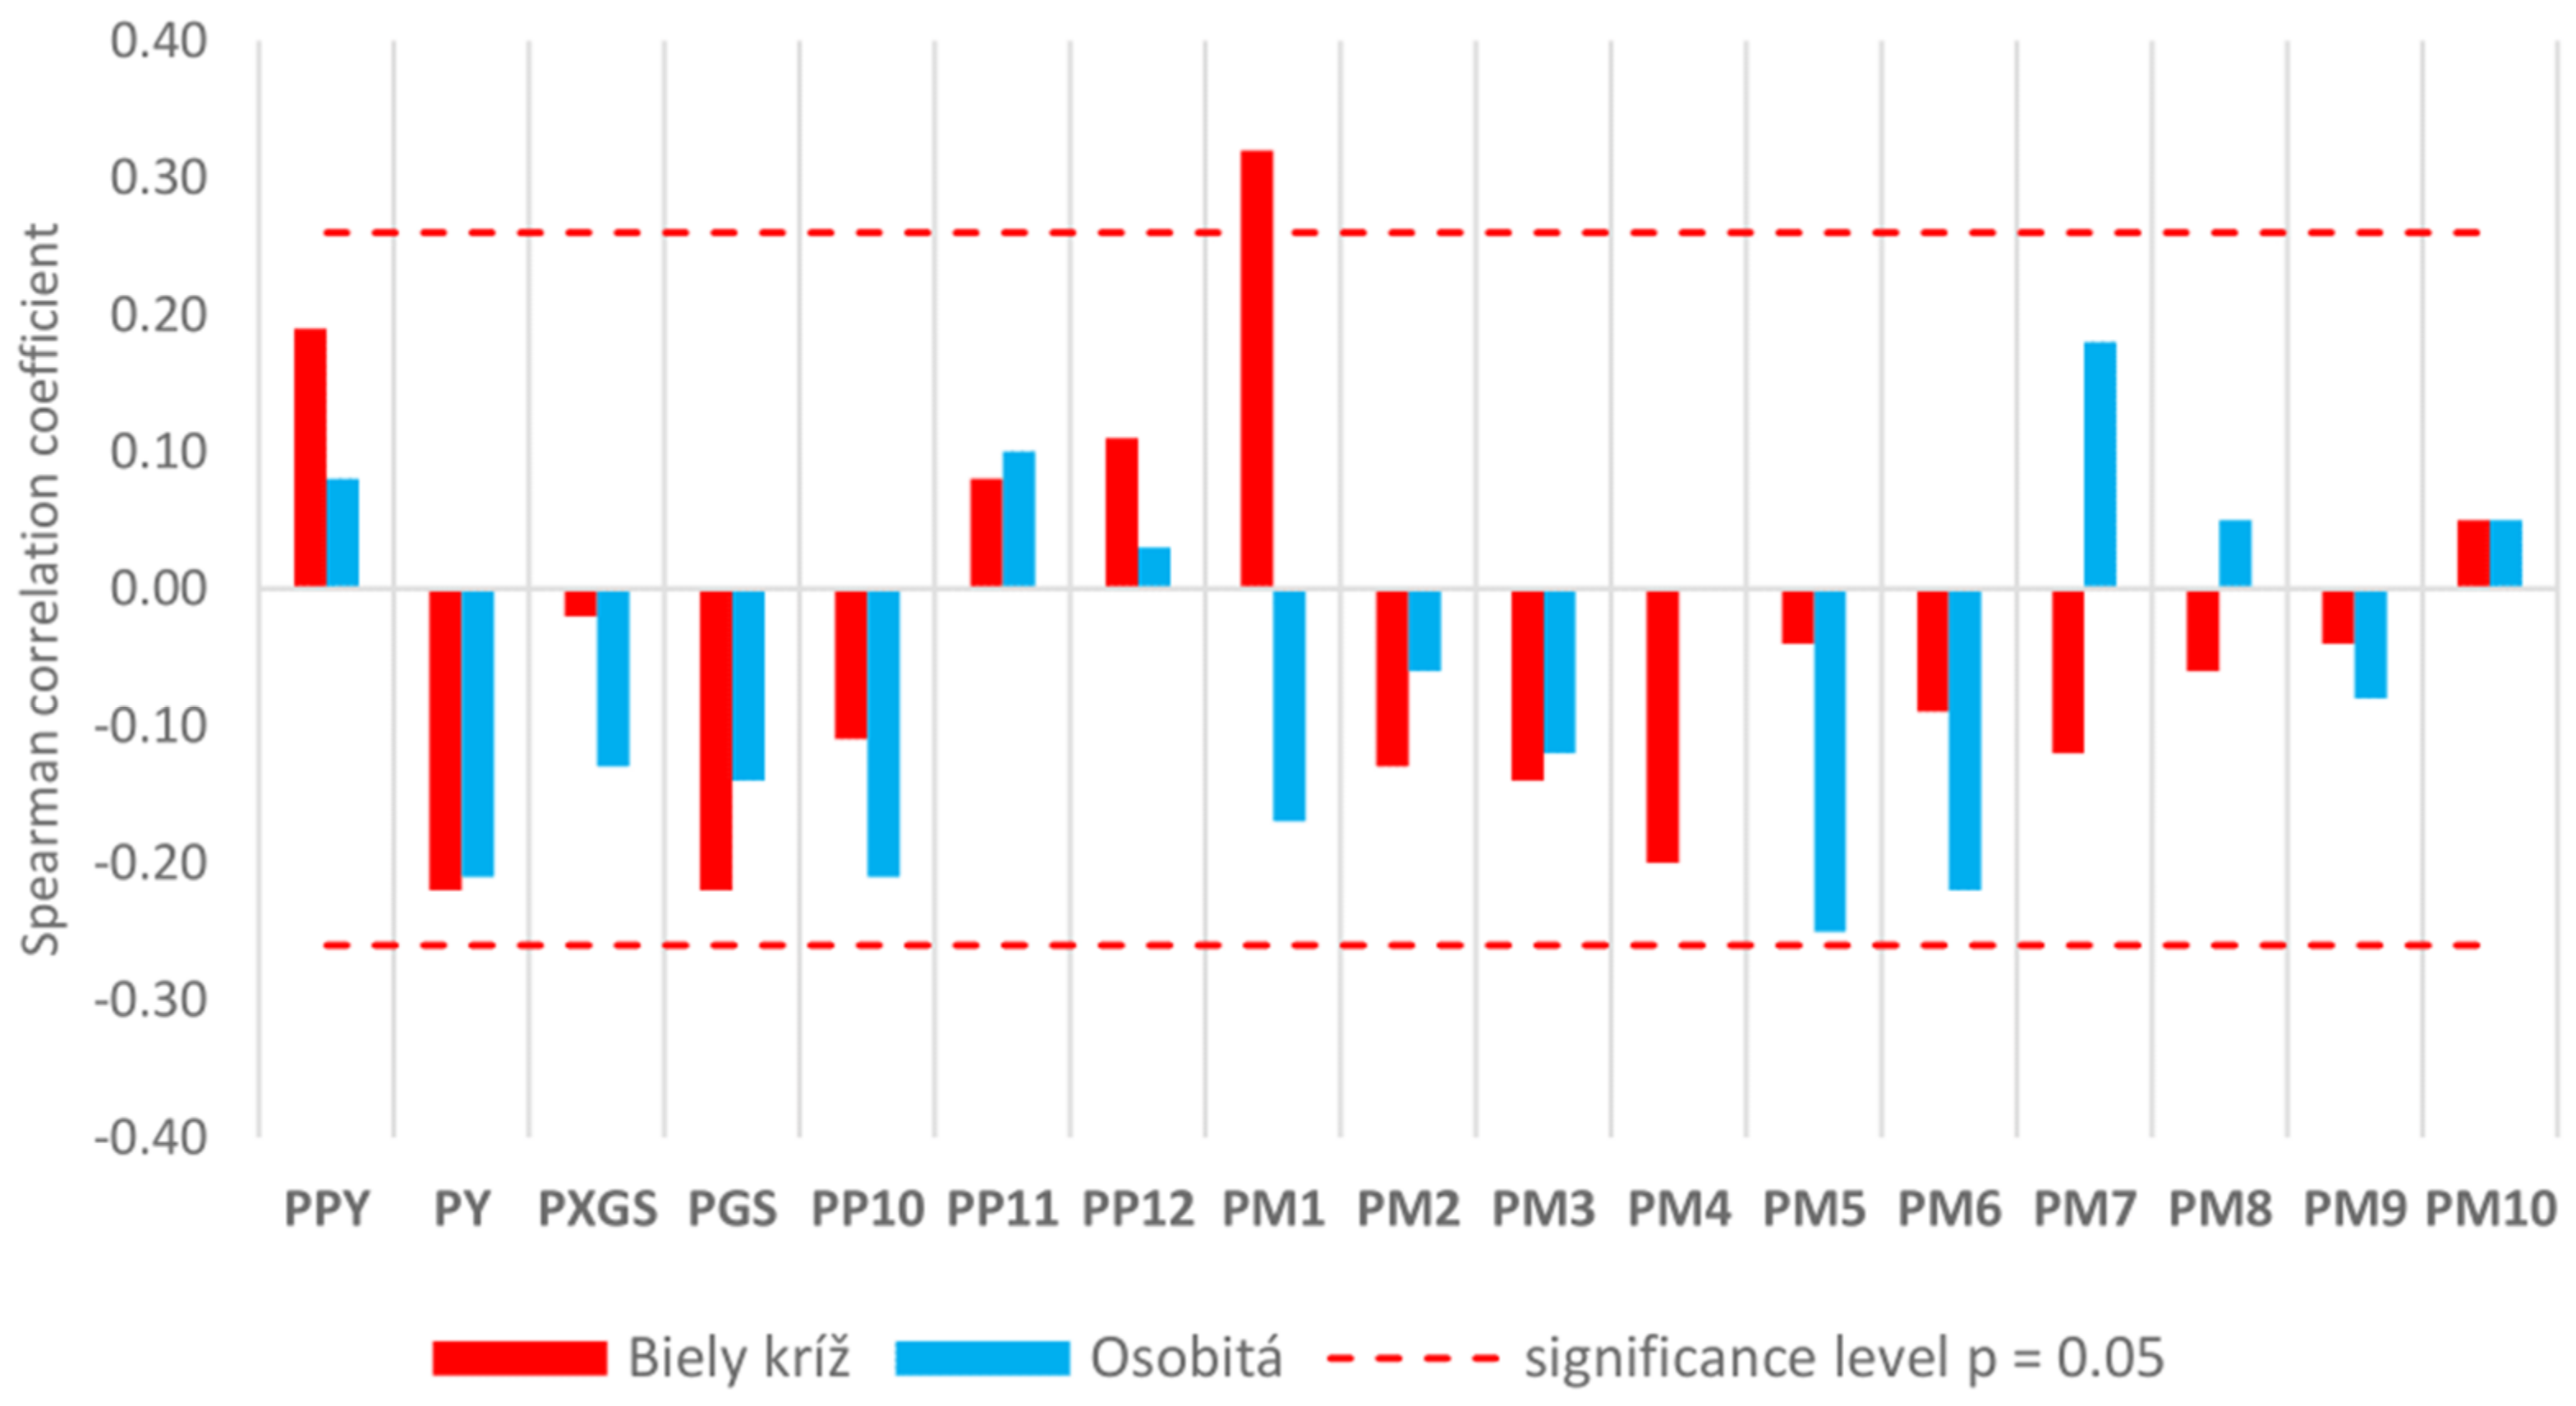
 = Biely kríž,
  = Osobitá,
  = significance level p = 0.05, year CE = central year of correlation window.
= Biely kríž, = Osobitá, = significance level p = 0.05, year CE = central year of correlation window.
= significance level p = 0.05, year CE = central year of correlation window.
= Biely kríž, = Osobitá, = significance level p = 0.05, year CE = central year of correlation window. = Biely kríž, = Osobitá, = significance level p = 0.05, year CE = central year of correlation window.
= Biely kríž, = Osobitá, = significance level p = 0.05, year CE = central year of correlation window.
= Biely kríž, = Osobitá, = significance level p = 0.05, year CE = central year of correlation window.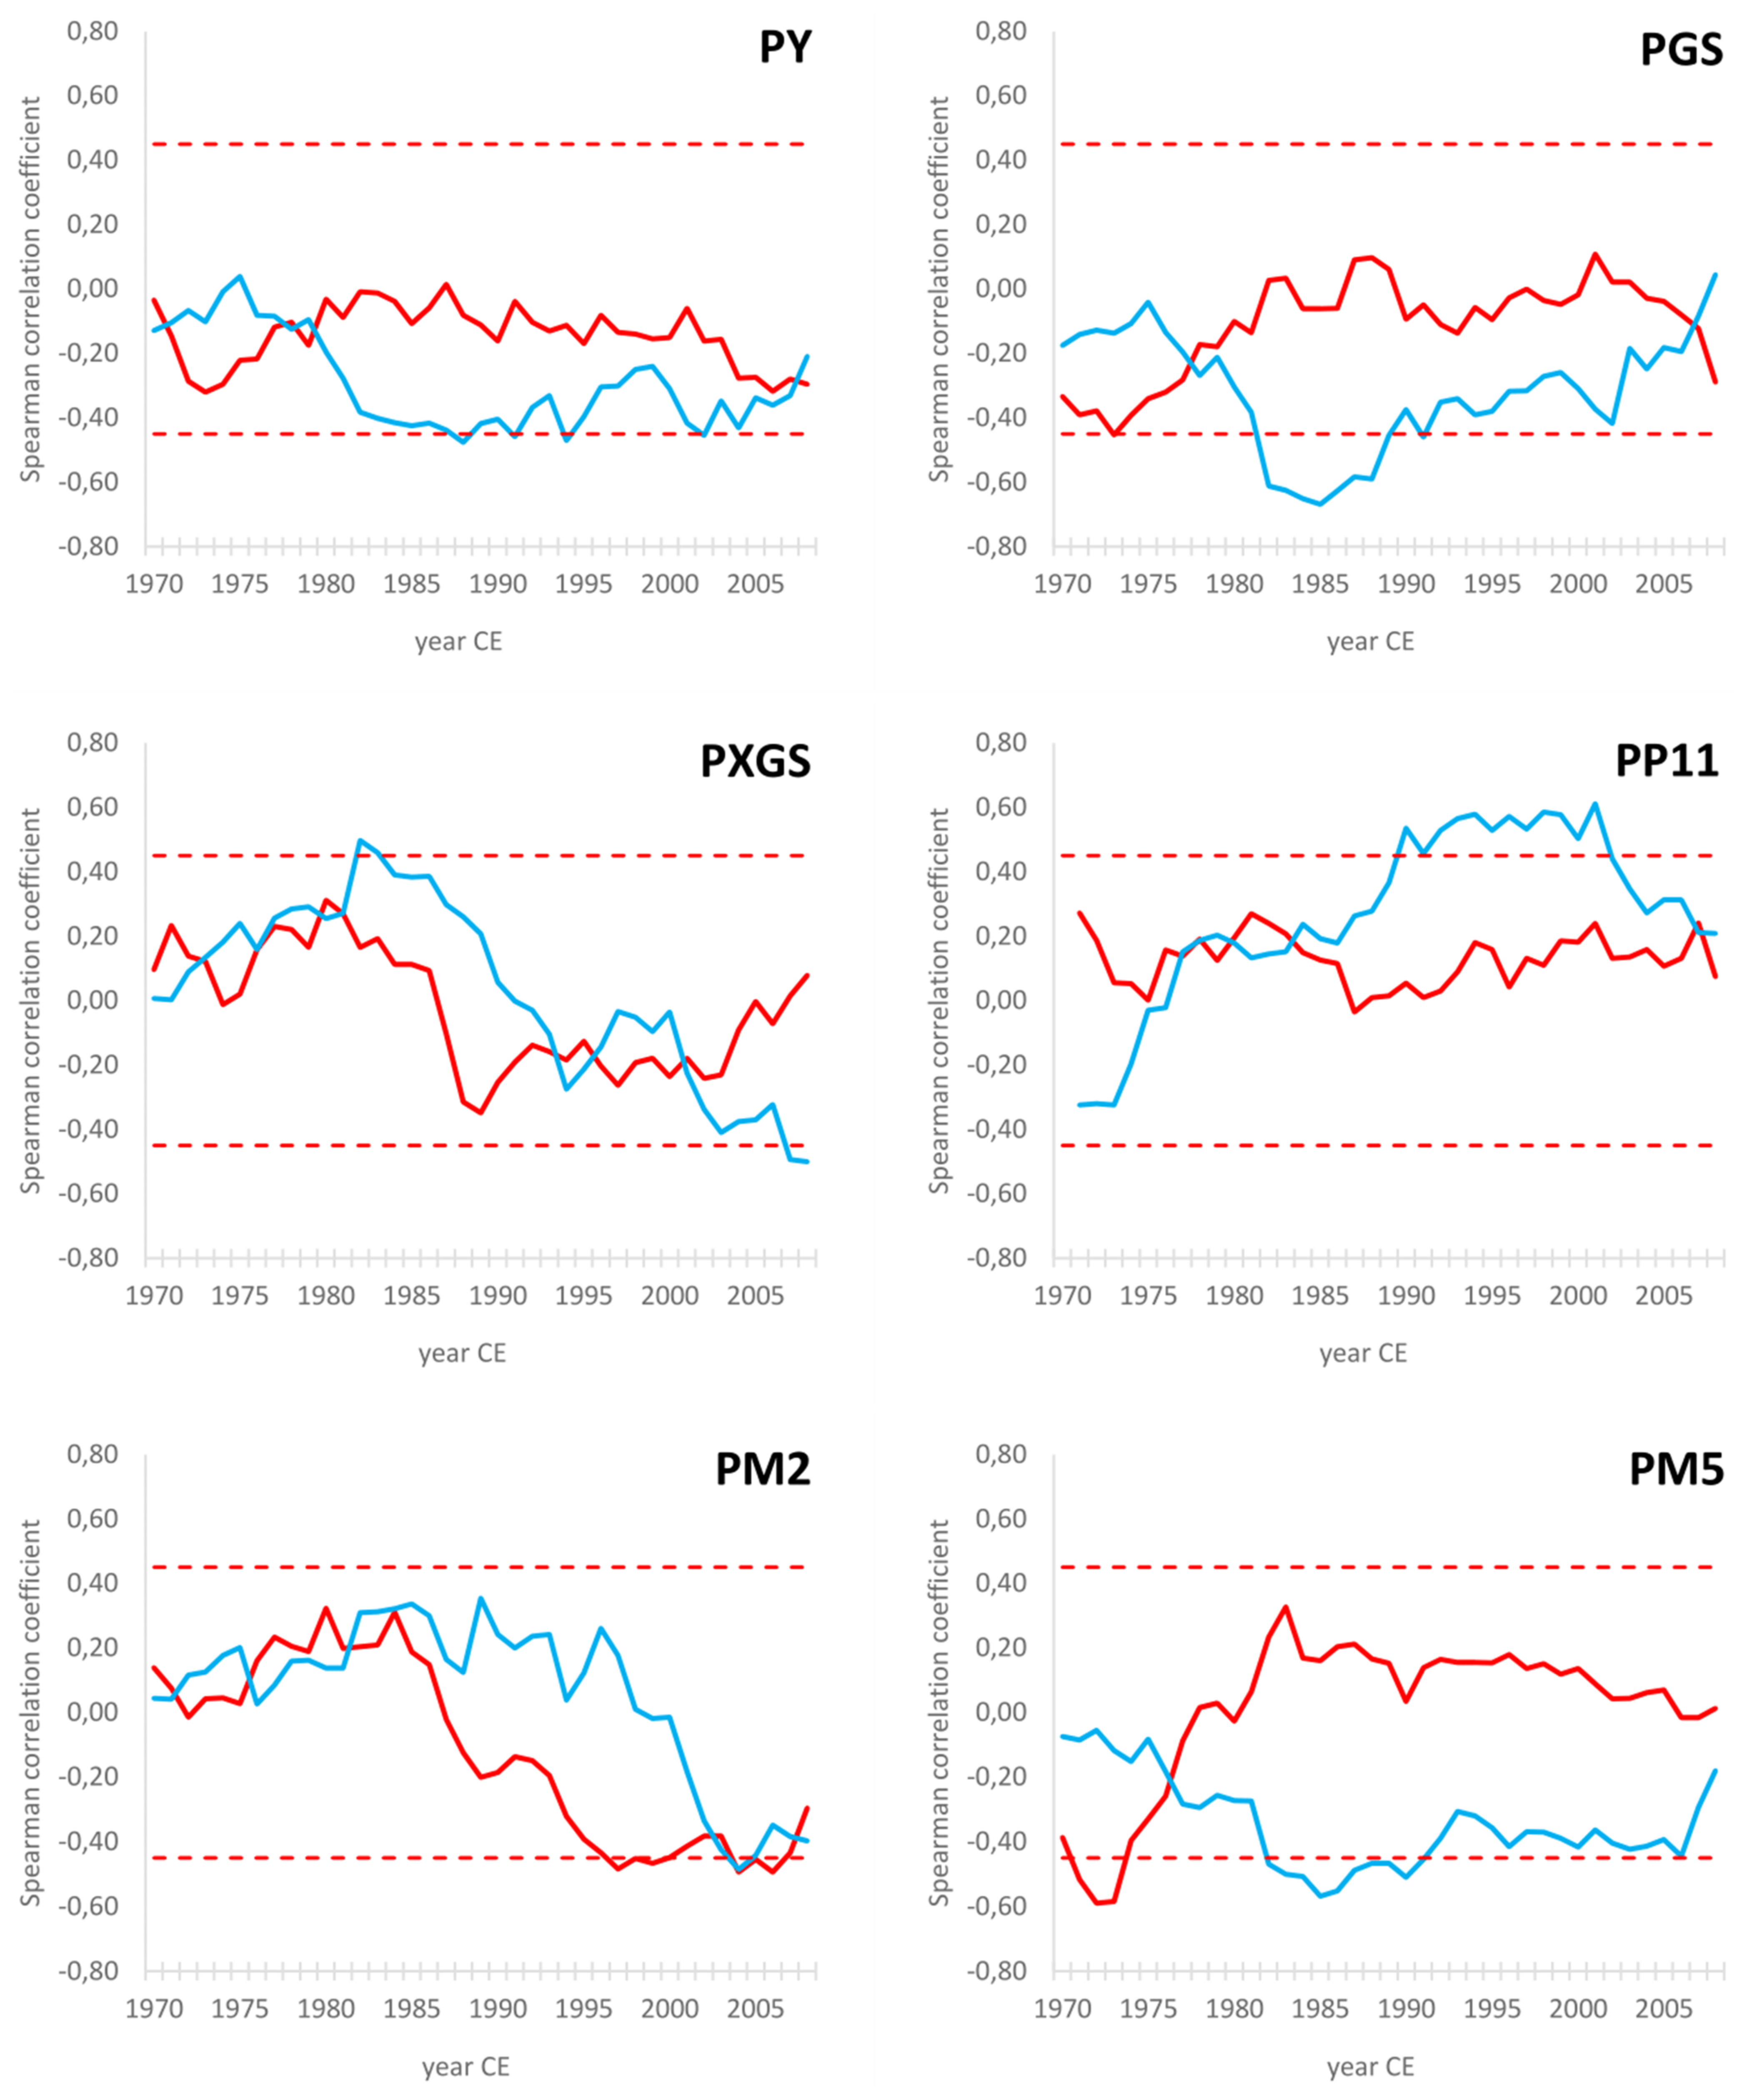
| Study Area | Biely Kríž | Osobitá |
|---|---|---|
| Number of plots | 1 | 1 |
| Plot size (ha) | 1 | 1 |
| Location | N 48.2329° E 17.1405° | N 49.2589° E 19.7032° |
| Year of measurement | 2019 | 2019 |
| Number of cores | 50 | 58 |
| Average altitude (m) | 390 | 1120 |
| Average slope (°) | 35 | 15 |
| Aspect | SW | S |
| Soil type | Cambisoil | Rendzina |
| Forest plant community | Piceion excelsae | |
| Stand age | 120+ years | 80+ years |
| Stand origin | Planted monoculture | Successive stand |
| Variable | Abbreviation |
|---|---|
| Mean annual temperature | TY |
| Mean annual temperature of the previous year | TPY |
| Mean monthly temperature | TM1–TM10; TP10–TP12 * |
| Mean temperature of the growing season | TGS |
| Mean temperature out of the growing season | TXGS |
| Annual precipitation | PY |
| Monthly precipitation | PM1–PM10; PP10–PP12 * |
| Precipitation of the growing season | PGS |
| Precipitation out of the growing season | PXGS |
Publisher’s Note: MDPI stays neutral with regard to jurisdictional claims in published maps and institutional affiliations. |
© 2021 by the authors. Licensee MDPI, Basel, Switzerland. This article is an open access article distributed under the terms and conditions of the Creative Commons Attribution (CC BY) license (https://creativecommons.org/licenses/by/4.0/).
Share and Cite
Šagát, V.; Ružek, I.; Šilhán, K.; Beracko, P. The Impact of Local Climate Change on Radial Picea abies Growth: A Case Study in Natural Mountain Spruce Stand and Low-Lying Spruce Monoculture. Forests 2021, 12, 1118. https://doi.org/10.3390/f12081118
Šagát V, Ružek I, Šilhán K, Beracko P. The Impact of Local Climate Change on Radial Picea abies Growth: A Case Study in Natural Mountain Spruce Stand and Low-Lying Spruce Monoculture. Forests. 2021; 12(8):1118. https://doi.org/10.3390/f12081118
Chicago/Turabian StyleŠagát, Vladimír, Ivan Ružek, Karel Šilhán, and Pavel Beracko. 2021. "The Impact of Local Climate Change on Radial Picea abies Growth: A Case Study in Natural Mountain Spruce Stand and Low-Lying Spruce Monoculture" Forests 12, no. 8: 1118. https://doi.org/10.3390/f12081118
APA StyleŠagát, V., Ružek, I., Šilhán, K., & Beracko, P. (2021). The Impact of Local Climate Change on Radial Picea abies Growth: A Case Study in Natural Mountain Spruce Stand and Low-Lying Spruce Monoculture. Forests, 12(8), 1118. https://doi.org/10.3390/f12081118