Article

Climate-Driven Differences in Growth Performance of Cohabitant Fir and Birch in a Subalpine Forest in Dhorpatan Nepal

1
Department of Earth Science and Geography, California State University Dominguez Hills, Carson, CA 90747, USA
2
Department of Environmental Studies, Prescott College, Prescott, AZ 86301, USA
3
Department of Biological Sciences, University of Bergen, N 5020 Bergen, Norway
*
Author to whom correspondence should be addressed.
Forests 2021, 12(9), 1137; https://doi.org/10.3390/f12091137
Submission received: 10 July 2021 / Revised: 19 August 2021 / Accepted: 20 August 2021 / Published: 24 August 2021
(This article belongs to the Section Forest Ecology and Management)

Abstract

:
Himalayan Silver Fir (Abies spectabilis) and Himalayan Birch (Betula utilis) are tree species often found coexisting in sub-alpine forests of the Nepal Himalayas. To assess species-specific growth performances of these species, tree-ring samples were collected from the subalpine forest in the Dhorpatan Hunting Reserve, Nepal. Standard ring width chronologies of both species were correlated with climatic variables in both static and running windows. Differential and contrasting temporal responses of radial growth of these species to climate were found. Warmer and drier springs appeared to limit birch radial growth. Whereas radial growth of fir showed weakened climate sensitivity. Moving correlation analyses revealed divergent influences of spring climate on both fir and birch. Significant warming that occurred in the 1970s coincided with growth declines in birch and an increase in fir, as indicated by basal area increment. In summary, recent warming has been unfavorable for birch, and favorable to fir radial growth.

1. Introduction

Environmental factors, dispersal, and biotic interactions are important fundamental ecological filters shaping community structure and species co-occurrence [1]. Global change drivers, particularly climate and land-use changes, induce individual or species level changes in plant phenology, physiological traits and habitat location [2]. Such changes influence species differently, thereby altering species coexistence mechanisms and bringing community level changes to local and regional scales [2]. Within a community, species coexistence occurs through niche partitioning and differences in species specific key functional traits, such as phenology, depth of root systems, responses to varied environmental gradients [2], trade-offs in their physiology, and wood structure and functioning [3]. Therefore, increased habitat heterogeneity supports the coexistence of multiple species with different requirements.
Primary productivity among coexisting species varies with their life history and ecophysiological characteristics [4]. Vegetative as well as reproductive processes determine species productivity and thus their competitive ability [5]. Because evolutionary trade-offs in resource allocation between growth and reproduction regulate the productivity of a species, changes in environmental conditions, and the resulting selection pressure can result in a species varying its key functional traits. Evolution and/or phenotypic plasticity can enable a species to adapt to altered environmental settings [2]. Within the context of climatic change, such species-specific traits and physiological responses to altered conditions help define the environmental niche of the species.
High elevation mountain areas are characterized by highly variable microsite conditions due to sharp changes in slope and aspect over a short distance. Studies have shown high-mountain plant communities are sensitive to climatic warming [6,7,8] and are experiencing rapid changes in composition and abundance. For example, Harsch et al. [9] reported 57% of worldwide treelines (including latitudinal) experiencing warming have advanced upslope and seen increases in recruitment. The Himalayas are experiencing greater warming than the global mean [7,8,10,11,12]. Forecasted warming is expected to bring dynamic changes to temperature sensitive subalpine plant communities [13,14]. Recent studies have shown increased tree recruitments and range shifts in the subalpine forests over the Nepal Himalayas at varying spatiotemporal intensity [8,10,15,16,17,18,19,20], with some instances of low recruitment and a lack of range shifts [10,21].
The recruitment performances and growth responses of trees at high elevation forests in the Nepal Himalayas are species- and site-specific [10,20,22] and impact how species will respond to climate change. While a warming climate can promote tree growth by lengthening the growing season [23], the species specific traits offer varied fitness differences, and those trees with better fitness advantages are more likely to reproduce. For instance, in a resource (nutrient, water) limited habitat, warming induced moisture deficit can subject angiosperm trees to cavitation quickly compared to conifers with homoxylous woods [3]. By assessing how climate change impacts the growth and productivity of forests, we will have a better understanding of forest structure and community dynamics.
Abies spectabilis and Betula utilis are two high elevation tree species from the Nepal Himalayas. Mixed forest stands of A. spectabilis and B. utilis are often found below the pure B. utilis belt below timberline in the central and western Himalayas [24]. Because angiosperms and conifers are quite different in their hydraulic safety margins [25], the contrasting ecophysiological trait differences allow these cohabiting species to respond differently to warming and droughts. While there have been varying site-and species-specific growth responses to climate, a more consistent finding is that A. spectabilis growth and treeline shift rate is higher than B. utilis [20]. Warm growing season temperature has often been found to favor the growth of A. spectabilis [10,11,13,17] in the eastern part of the Nepal Himalayas. However, radial growth of the same species from Rolwaling [12] and Mustang [19] was limited by spring moisture deficit. There is a general consensus that warming induced moisture stress during the spring disrupts growth in B. utilis [10,11,14,26,27]. Although mixed stands of A. spectabilis and B. utilis are often found in the subalpine zone, very few studies have compared both species [10,11,13,18,20], and their dynamics of climate sensitivity have not been sufficiently addressed. We hypothesize that current climate trends have favored A. spectabilis compared to B. utilis in mixed stands. This study aims to look at the successional dynamics of A. spectabilis and B. utilis where they co-occur in the Nepal Himalayas. The long-term growth performances in relation to climate were assessed by (1) exploring the main climatic factors controlling radial growth, (2) examining the stability of the relationships, and (3) observing the temporal dynamics of species-specific productivity (rates of annual basal area increment) of both tree species.

2. Materials and Methods

2.1. Study Area

The study site (28°33′ N, 83°11′ E, 3500–3600 m asl) lies in Rughakharka, in the eastern boundary of the Dhorpatan Hunting Reserve (hereafter DHR) in western Nepal (Figure 1). Nearly 26.4%, 14.13% and 59.45% of DHR lie in Baglung, Myagdi, and Rukum District, respectively [28]. There is a wide range of topographic variations within DHR, and the climate and vegetation vary accordingly. Within DHR, different types of climate are found; ranging from sub-tropical climate at the lower elevation, to alpine at higher elevations [28]. The region receives monsoonal precipitation until late September. Daytime temperature in winter is very low and is often exacerbated by wind and clouds at high elevations. At treeline, snow cover persists until early April [29].
Supported by wide topo-climatic variation, subtropical to alpine vegetation are found in the region [28,29]. Common tree and shrub species found in the reserve are Abies spectabilis (silver fir), Pinus wallichiana (blue pine), Betula utilis (birch), Quercus semecarpifolia (oak), Rhododendron arboretum, and R. campanulatum (rhododendrons), Picea smithiana (spruce), Juniperus recurva (juniper), Tsuga dumosa (hemlock) and others [28,29]. Betula utilis is a dominant tree species within the treeline ecotone where Buki (Tussock sp.), grass (Carex sp.), R. anthropogon, and Cassiope fastigiata are the dominant lower stature vegetation species above the treeline [28]. Abies spectabilis is often found below the B. utilis band in mixed stands. Human settlements and agricultural practices occur in all but the northern side near the reserve boundary (Figure 1). Local people are dependent on the reserve for natural resources, including pasture use [29].

2.2. Tree Species

Abies spectabilis (D. Don) Mirb. (Himalayan Silver Fir) is an endemic conifer species in the Himalayas, usually found in mesic subalpine habitats reaching up to treeline elevation [15,19], and is sensitive to late spring frosts [21]. The low branching trees with denser foliage are often found associated with Betula utilis and Rhododendron species [19,21]. Within the study site, the species is confined to lower elevations in association with B. utilis, just below the treeline. Several studies have highlighted the recent population dynamics of A. spectabilis at its upper distribution [10,13,15,19].
Betula utilis D. Don (Himalayan Birch) is the only broadleaved tree species occurring at treeline in the Himalayas [18,20,30]. The B. utilis forests thrive on humid, north aspects and shady slopes and ravines with deeply weathered podzolic soils. The species is more or less absent from south-facing slopes [30]. Betula utilis is often found associated with conifers and shrubby understory rhododendrons. At the high elevations of Dhorpatan, this species forms treeline. Warming induced moisture deficit has increasingly inhibited the growth of B. utilis in the Nepal Himalayas [10,14,26].

2.3. Climate Data

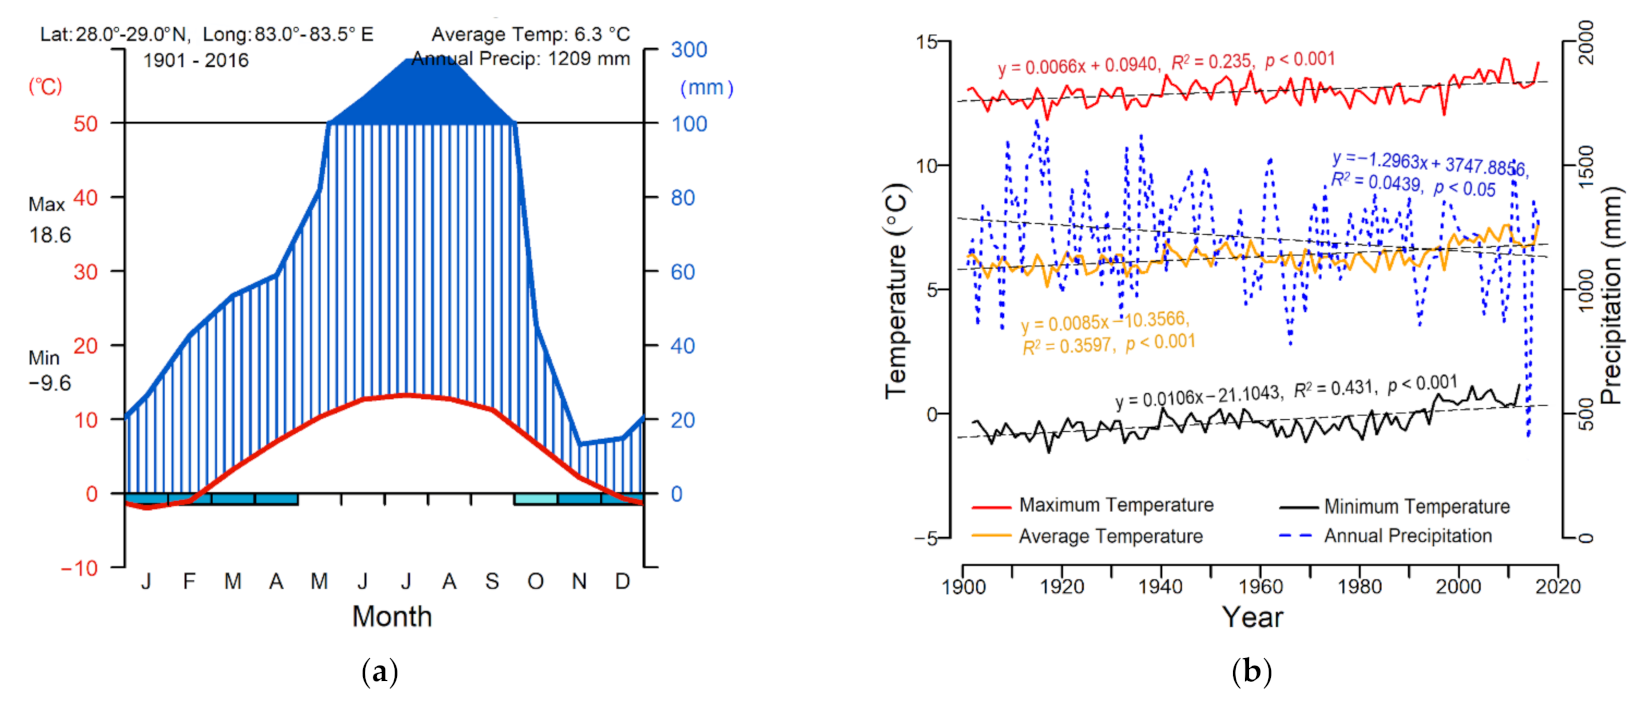
Station climate data from the study area were unavailable. Therefore, the high-resolution Time-Series (TS) version 4.04 data from the University of East Anglia [31] Climatic Research Unit (CRU) were used at 0.5° spatial resolution [32]. Monthly temperature (mean maximum, mean, mean minimum) and total precipitation were available for the period 1901–2019. The datasets were the means of the two 0.5° resolution grid cells (28.0°–28.5° N, 83.0°–83.5° E and 28.5°–29.0° N, 83.0°–83.5° E) closest to the study site. The average CRU grid based annual mean temperature of the area is 6.3 °C and the average annual precipitation sum is 1206 mm (Figure 2). Total annual precipitation has declined over time and the annual mean temperature has risen significantly.
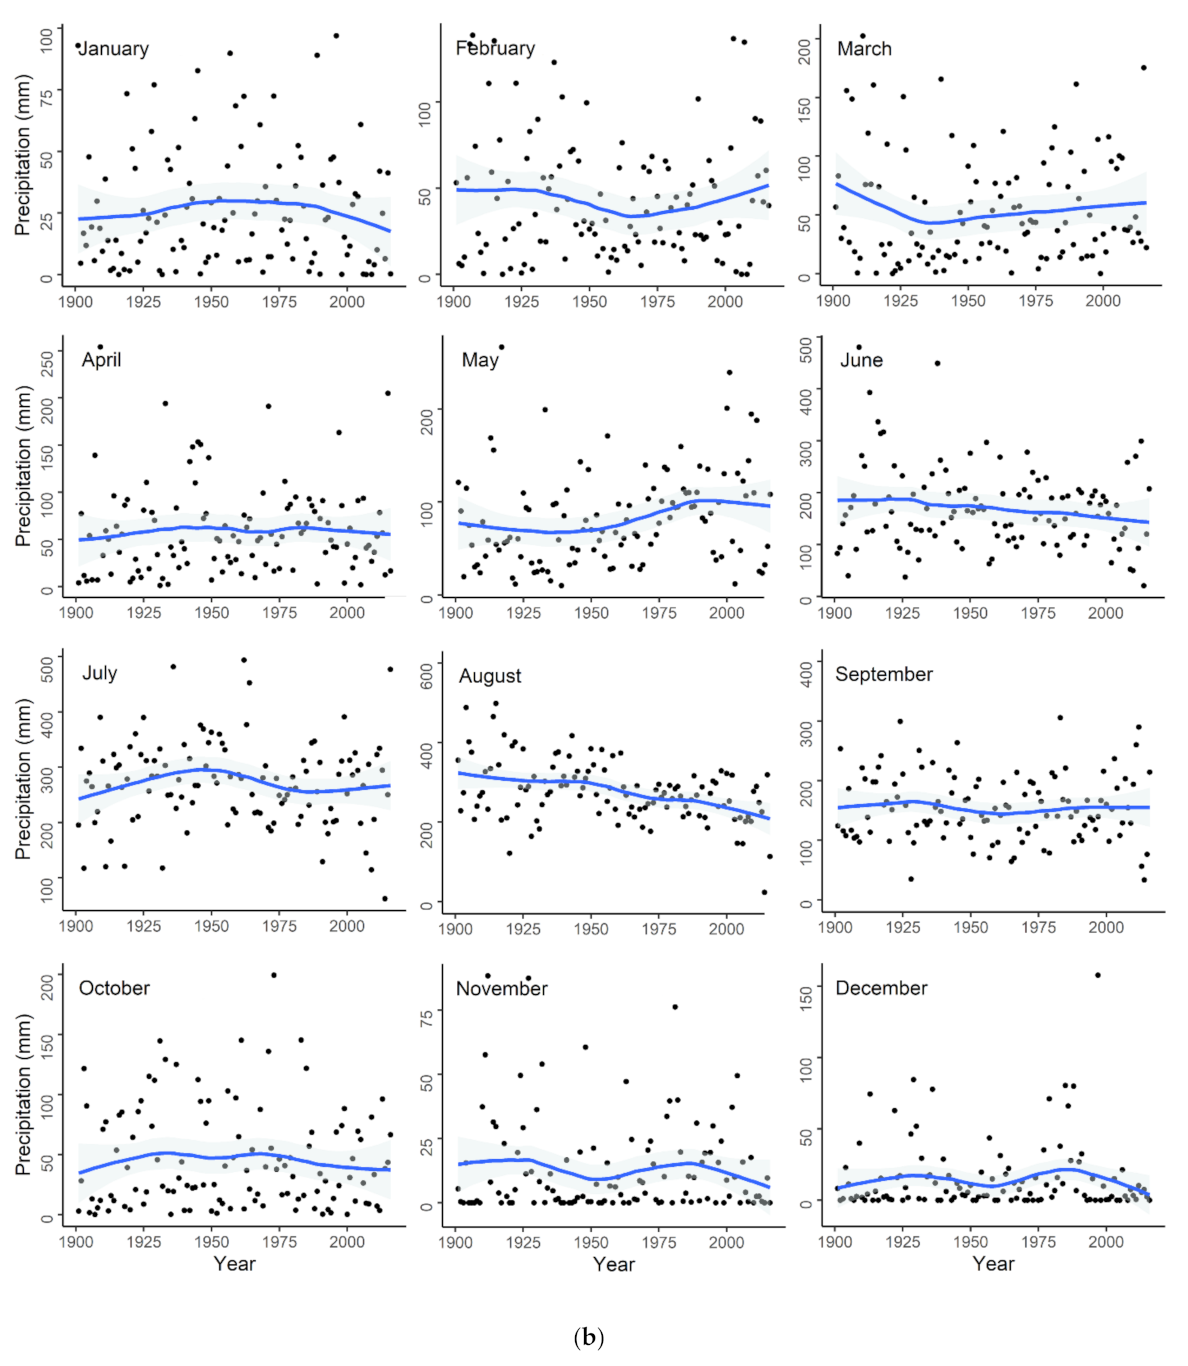
The overall climate trends as revealed from the CRU data are obvious, especially the temperature increase over the last quarter of the 20th century. Temperature exhibited a sharp increase by the 1980s (Figure 3). The annual mean CRU temperature after the 1980s was significantly warmer by 0.52 °C than the mean temperature between 1901–1980 (Table A1). The temperature of all the months except April, May, June, July, and August also increased significantly after 1980, and November and December have seen more than a 1 °C increase in temperature after 1980 compared to the monthly mean before 1980 (Figure 3 and Figure A1a). Precipitation, though, did not show a clear trend (Figure 3 and Figure A1b). Precipitation exhibited wide fluctuations. Comparing mean annual or monthly sum of precipitation before and after 1980 showed irregular trends. Mean total May precipitation after 1980 was higher by 28 mm (p < 0.05) compared to pre-1980 mean totals (Table A1). Another significant difference was in August precipitation sum, the monthly mean after 1980 was 53 mm less than pre 1980 means (p < 0.05). The overall trend of the CRU data has been an increase in temperature during the last four decades.

2.4. Tree-Ring Data

Increment core samples were collected from a mixed subalpine stand of A. spectabilis and B. utilis at 3500–3600 m asl on a north-east facing slope in Simudar Khola valley. Trees without any discernible damage on stem, branches and crowns were chosen for both species. Individuals near water and those with apparent resource (light, water, substrates) favorability or constraints were avoided. Thirty trees from each species were sampled. From each tree, two increment cores were extracted at breast height (1.3 m), in the opposite direction, using an increment borer. To avoid reaction wood in trees growing on steep slopes, the cores were taken along the contour [34], i.e., trees were bored at a right angle to the slope. The cores were labeled, safely stored and processed in the laboratory following standard dendrochronological techniques [35,36,37]. The air-dried cores were mounted on wooden frames. The cores were sanded with the progressively finer grit to make the core surface smooth and enhance the visibility of the tree rings. All cores were visually crossdated and the tree ring widths were measured with a Velmex tree-ring measurement system, to a precision of 0.001 mm. Furthermore, CDendro (Cybis Dendro Dating Program, 8.1.1) was used to crossdate the measured series. The dating quality of all measured tree-ring series was checked in dplR [38] in the R statistical program version 4.0.3 [39] and COFECHA [40] was used to identify missing and false rings. Problematic cores with low correlation were discarded.
Ring-width series were standardized to eliminate age-related growth trends and low frequency variation due to non-climatic factors so that the high frequency climate signals were strengthened [41]. For each series, detrending was carried out using a cubic smoothing spline with a 50% frequency response at a wavelength of 67% of the series length using dplR [38]. Calculating the bi-weight robust means (that reduces outlier effects) of all detrended index series [42], a standard chronology (Ring Width Index (RWI)) of the index series was developed using dplR [38]. Several statistical measures were used to test the strength of the chronology, including inter-series correlation (Rbar) and expressed population signal (EPS) that shows the common variability among series within the chronology [43]. The signal strength throughout the chronology was examined using the running mean of Rbar and EPS in 20-year moving windows and 10-year overlaps. EPS depends on sample depth and its value above 0.85 is generally considered a reliable representation of the population [43,44]. Likewise, the signal-to-noise ratio (SNR) is the sample size dependent statistic that shows the strength of the common climate signals of all series [37,41].
Basal Area Increment (BAI), as the unstandardized sigmoidal model, minimizes the age-related growth trend [45,46], better reflects the radial growth trend of trees, and is a more biologically meaningful measure of productivity [45]. To estimate the growth rate, BAI was calculated from the raw ring-width series using dplR [38]. Several cores did not contain the pith. Therefore, for the ring-area series based on the diameter of the trees and the width of each ring moving towards the pith, bai.out() function in dplR [47], was used to transform the raw ring-width series into BAI series. The function calculates BAI for each series using the formula; BAI = π(Rt2 − Rt−12), where Rt is tree radius in the year t and Rt−1 is the radius of the previous year [48]. Then, averaging BAI for all the series, a mean BAI is calculated [45,47].

2.5. Tree Growth-Climate Correlations

Pearson’s correlation analysis between the RWI and temperature and precipitation data was performed to examine the relationships of climate and radial growth. Because climate conditions influence tree growth in the following year [49], the correlation was assessed for the previous growing season months from June to the current year’s September. To evaluate the stability of the growth-climate correlations, 35-year moving window correlations were examined with a two year offset between the consecutive windows. EPS of the A. spectabilis chronology was above 0.85 after 1919. Therefore, with the two year offset, the first correlation window was 1921–1955. For B. utilis, EPS reached the threshold in 1808. With the CRU climate data available from 1901, the first correlation window for B. utilis was 1903–1937. Then the static correlation of RWI and average monthly maximum, mean and minimum temperature, and monthly total precipitation were assessed for the period 1970–2015. Correlation analyses were performed using the dcc() function of the treeclim 2.0.5.1 package [50] in R [39].

3. Results

3.1. Tree-Ring Chronology and Radial Growth Trend

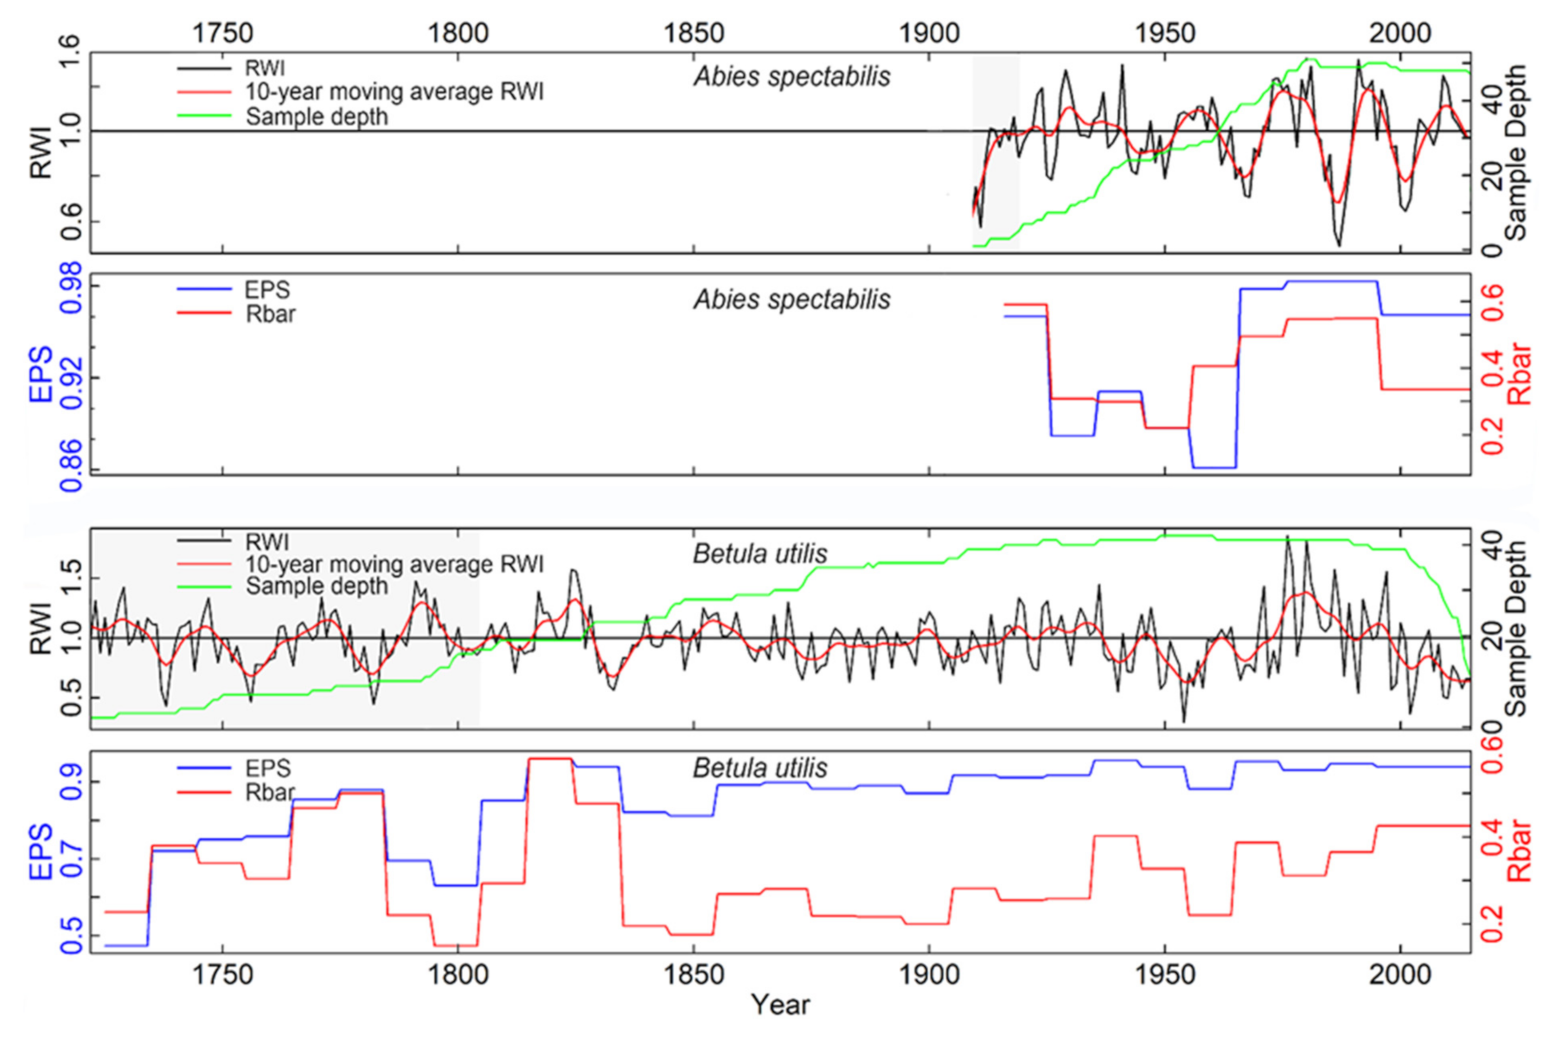
Among the sampled trees, A. spectabilis did not have missing rings. Betula utilis, though, had 0.41% absent rings. Amongst the absent rings, the year 2003 was missing in six different trees. The year 1955 was also absent in four series from four different trees. Other occasionally absent rings were 1941, 1967, 1989, 1999, and 2000. The chronology of A. spectabilis and B. utilis (Figure 4) ranged from 1909 to 2015 and 1721 to 2015, respectively. There were discernible growth reductions in A. spectabilis during 1967–1968, 1986–1989 and 2000–2002 (1986 and 1987 were the years with minimal growth). B. utilis had distinct growth depression in the years 1755–1756, 1781–1783, 1832–1834, 1873, 1940, 1949–1950, 1954–1958, 1967–1969, 1988, 1991, 1998–1999, 2002–2003, and all rings after 2009. The years 1954 and 2002 were the years with the least growth. Whereas 1824–1825 and 1976–1977 were the years with the highest radial growth.
The chronologies from both species revealed some strong signals to assess growth-climate relationships (Table 1). The mean sensitivity was 0.21 for A. spectabilis and 0.35 for B. utilis indicating remarkable inter annual variation in radial growth, and identifying B. utilis as being even more sensitive to climatic variations. The moderate and similar within-tree series correlation (Rbarwt) and lower between-tree correlation (Rbarbt) indicated that ring-width variations were consistent between both species, but the agreement between the series even within the same tree was not high. For both species, Rbarbt was relatively lower in the 1950s and 1960s (Figure 4). There were similarities in SNR and EPS as well. Both chronologies were higher than the arbitrary EPS threshold of 85%, signifying reliable signal strength and justification for further analysis of climate growth relationships.
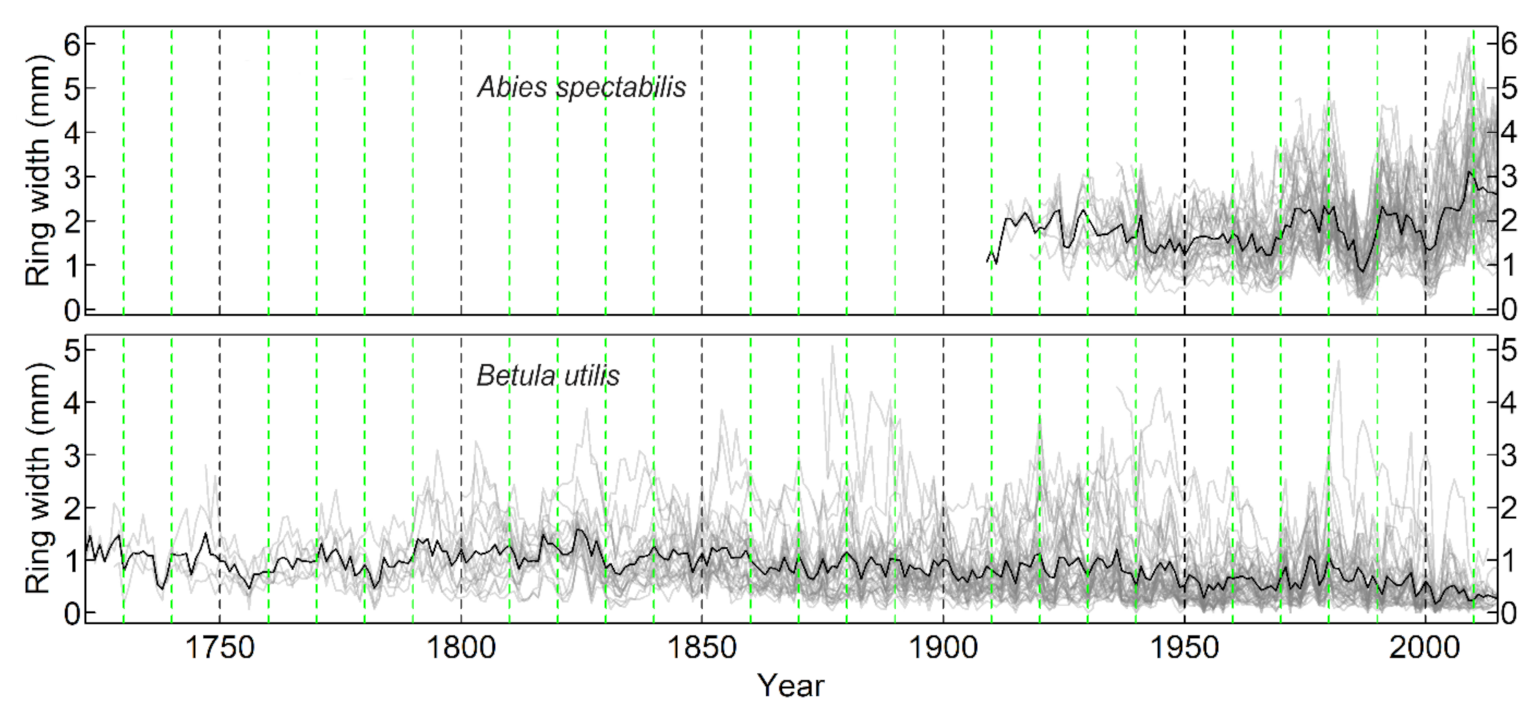
Estimates of wood productivity and growth trends were better shown by raw ring width chronologies (Figure A2) and basal area increment (Figure 5). Both curves showed fluctuating growth trends over time. While B. utilis chronologies were longer compared to that of A. spectabilis, the former never experienced a sharp transition in growth, rarely exceeding 500 mm2 of basal area per year. The BAI trends of these species began to diverge noticeably with the temperature transition by the 1970s. BAI of A. spectabilis increased sharply, while that of B. utilis showed a declining trend after the temperature transition. Specifically, annual mean BAI of A. spectabilis increased from 520 mm2 in the 1970s to 1865 mm2 after 2010. In contrast, the mean annual basal area growth of B. utilis declined from 448 mm2 to 233 mm2 during the same period.

3.2. Growth Response to Climate Variation

The EPS of the A. spectabilis chronology reached the 0.85 threshold in 1919. Therefore, moving growth-climate correlations were computed for the common span of 1919–2015 to assess radial growths. Calculating the growth correlations with temperature and precipitation data over the available record of CRU data and additionally from 1970 onwards provided quite different scenarios. Moreover, there was a noticeable shift in biomass productivity (BAI) for both species by the 1970s. Therefore, static growth-climate relationships were also assessed for the later windows.

3.2.1. Static Correlation

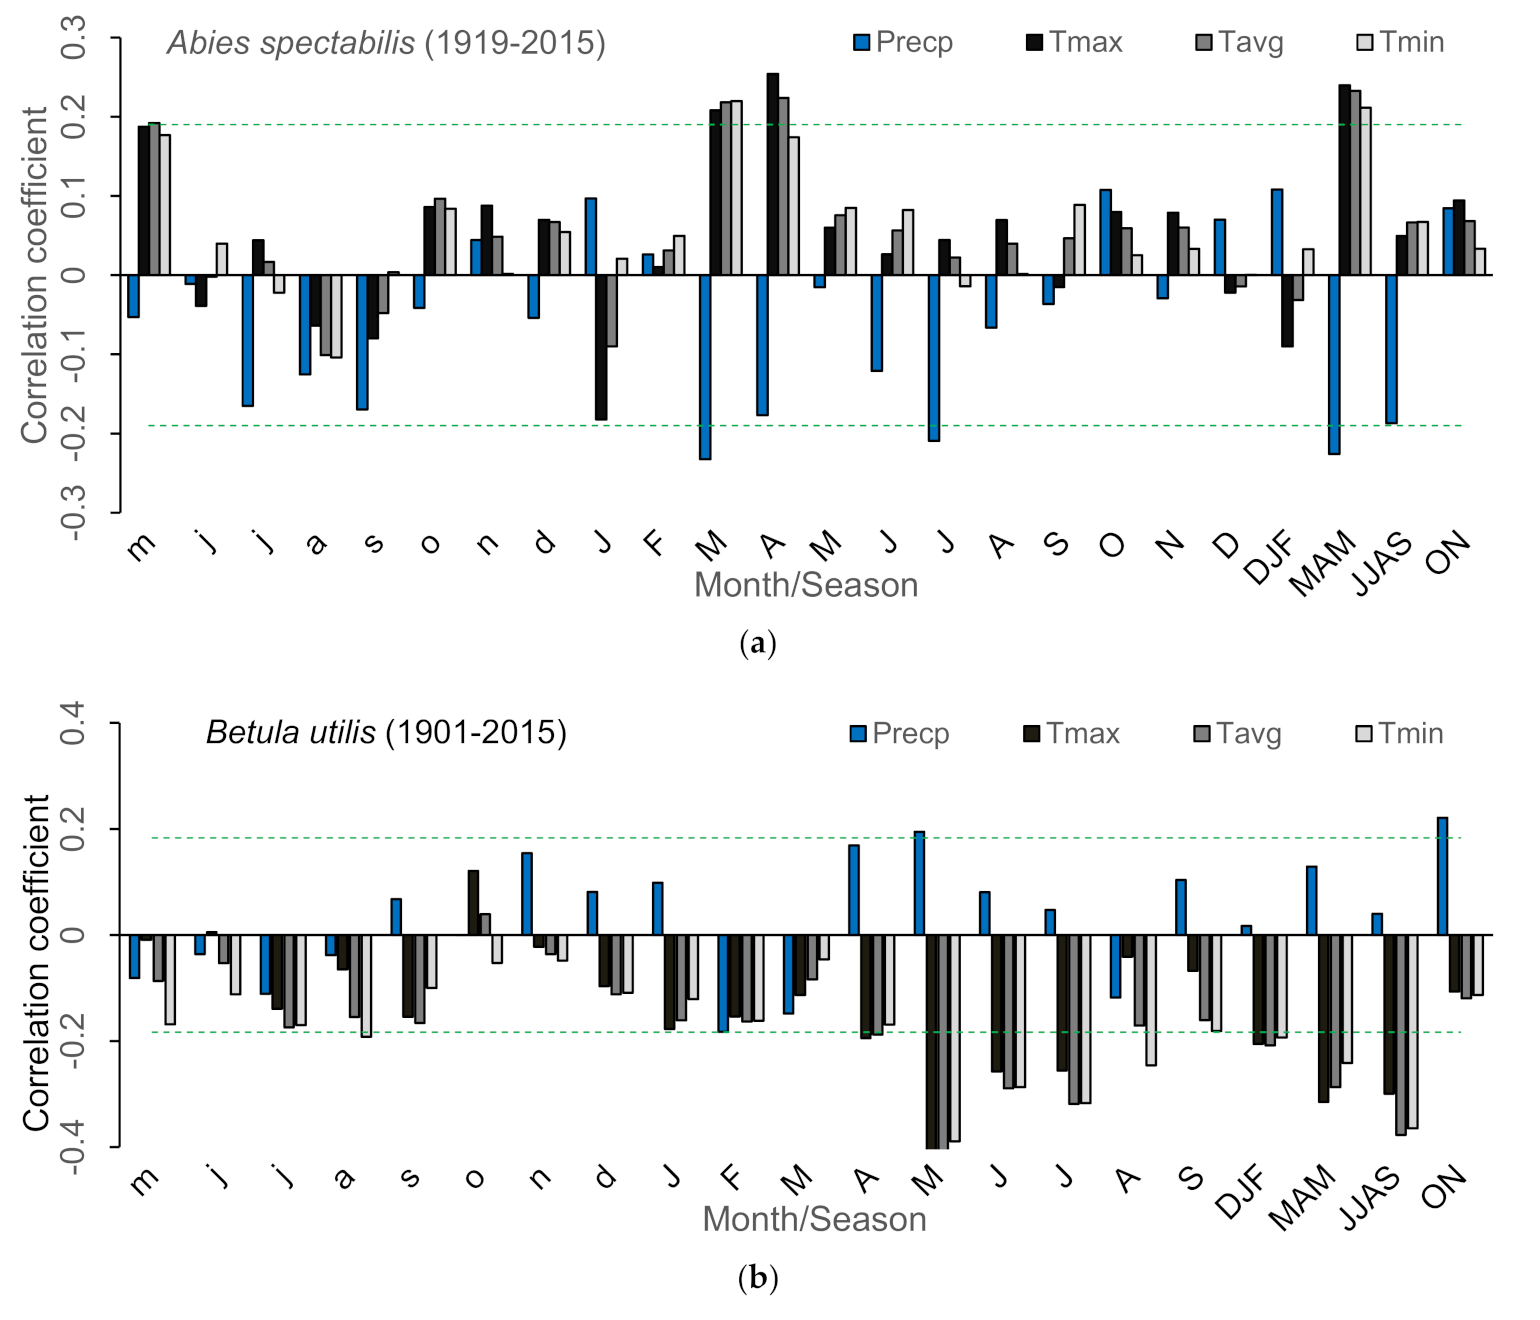
The correlations after 1970 exhibited weaker growth-climate relationships for A. spectabilis (Figure 6). Significance of climate correlations occurred only for precipitation in the previous year’s July (R2 = −0.32, p = 0.05), December (R2 = −0.34, p = 0.05), and the current years July (R2 = −0.40, p = 0.01). Betula utilis radial growth after 1970 was found to be correlated with growing season temperature. The growth limiting influence was correlated with the minimum and mean temperature. The maximum temperature appeared to be as limiting to growth for both spring and early summers. Relationships between precipitation and radial growth were, however, positive and significant for the month of April of current year (R2 = 0.31, p = 0.05).

3.2.2. Moving Correlation

The Pearson’s correlation of radial growth of A. spectabilis with climate during 1919–2015 showed growth to be limited by low temperature and higher precipitation in the early spring season and high July precipitation (Figure A3). Betula utils radial growth was negatively correlated with spring and summer temperature during the period 1901–2015, with spring precipitation favoring growth. However, moving correlation analysis showed non-stationarity in the relationships over time for both species (Figure 7 and Figure A4). The significance of the A. spectabilis growth climate relationships was fragmented and unstable, with patterns of insignificant phases for almost all months (Figure A4a). However, there were clear trends in the growth correlation with April and May temperature and precipitation. The significance of the positive temperature influence persisted until the late 1970s and then gradually became weaker and disappeared in recent years. Similarly, the significant negative correlation with precipitation for the spring months lasted until the 1970s. July’s precipitation showed a significantly negative effect after the 1960s.
The stationarity analysis of correlations between B. utilis growth and climate showed rather clearer trends (Figure 7 and Figure A4b). The growth correlation with spring precipitation was significant. There was periodic significance of growth-precipitation correlations over time for other months, but precipitation during the spring months has been more influential in recent windows. Precipitation in the previous year’s autumn was significant during the first half of the 20th century, but has become less important in recent decades. The analysis suggested that the negative growth correlation with previous summer precipitation during the first half of the 20th century has shifted to a weak positive relationship. The temperature in the previous summer and current year’s spring was, in all windows, correlated negatively with tree growth. However, an increase in temperature in the previous year’s autumn showed a limiting effect by 1970.
Moving window correlation analysis highlighted the opposite trend of climate sensitivity between A. spectabilis and B. utilis, particularly during the spring (Figure 7). The divergence of the sensitivity between these tree species appeared to start by the late 1940s. The significance of spring climate to A. spectabilis radial growth began to decline following the 1940s and became non-significant in the later windows. In contrast, the B. utilis growth correlation to climate during spring grew stronger, temperature in particular.

4. Discussion

We found that coexisting A. spectabilis and B. utilis have distinctly different species-specific growth responses to temperature and precipitation. Early successional B. utilis showed decreased radial growth in recent decades resulting from changing climate. In contrast, the radial growth of the late successional and younger A. spectabilis was found to have increased growth responses during the same period. While temperature, minimum and mean in particular, during the previous year’s summer and current year’s spring was unfavorable for B. utilis, the significance of climatic variability was found to be weaker for A. spectabilis radial growth. Growth sensitivity to climatic variables was unstable over time. The most obvious difference between these two tree species was the divergent growth sensitivity to spring temperature and precipitation. Betula utilis radial growth relationships with temperature and precipitation during spring are becoming stronger in recent decades. This finding is in contrast to the significance of these climate parameters for A. spectabilis growth which gradually became weaker over time. Among coexisting conifers and angiosperms, angiosperms outperform gymnosperms under normal conditions [5]. However, in resource-limited and low-temperature habitats, conifers often perform better and adapt [5]. In terms of BAI, A. spectabilis gained wood at a rapid rate by the 1970s when temperature also began to rise noticeably. However, BAI of B. utilis began to decline by the 1980s. Seemingly, the better growth performance of A. spectabilis indicates the climatic influences on habitat conditions. Age dependent variation in growth rates must also be considered when partitioning the variance explained by climate. However, considering the coincidence of the temperature transition with the diverging climate sensitivity and productivity between these species, it is plausible that warming differentially favors these two cohabitants.

4.1. Tree-Ring Chronology and Growth Trend

Growth-climate relationships were supported by EPS, Rbar, and correlations with temperature and precipitation. EPS was well above the arbitrary threshold value (0.85), and higher MS values signified that there was coherence in year-to-year variability in annual ring widths caused by climatic variations obtained for detrended chronologies. Stand dynamics and ecological disturbances, which impact some individual trees, may lower Rbar values and indicate the overall agreement between trees in a stand [37]. In habitats with sharp microsite differences, as well as human impacts, we might expect low Rbar values. Several studies across the Nepal Himalaya have reported lower value of Rbar. For example, Rbar values of A. spectabilis in Sagarmatha [10,11,17], Rolwaling [12], and B. utilis chronologies in Sagarmatha [10,11,27], Mustang [14], Langtang and Manasalu [27], all had similar correlation coefficients compared to our results. Pandey et al. [11,51] in eastern Nepal, and Dawadi et al. [26] in central Nepal, reported much lower Rbar values for both species compared to our results. Since EPS value depends on Rbar as well as the number of samples that build a standard chronology [44], the higher EPS and signal-to-noise ratios, still support the between-tree agreement and justify the growth-climate relationships. Influences of non-climatic factors and disturbances could not be traced back in our study. However, the lower agreement of ring-width variations in both tree species during the mid-20th century points towards large scale disturbances.
Higher autocorrelation values for both species imply significant physiological preconditioning by the previous year’s growing conditions, with B. utilis having an even larger dependence on prior growing season conditions. For example, lower precipitation in 1966–67, 1988, 2000. The lower precipitation during autumn and spring prior to the current growing season resulted in a lag effect conducive to narrower rings, which was more obvious for B. utilis. Noticeably, when 2014 received significantly less precipitation, there were many narrow rings during the years 2014 and 2015. Most of the 2015 rings in B. utilis were not recorded (lower sample depth for the year). Similar to our study site, Dawadi et al. [26] and Liang et al. [27] also reported a high frequency of locally absent rings in 2003, 2004, and 1999, among other years, with the frequency of rings in B. utilis from different regions of the Nepal Himalayas being independent of tree ages. The A. spectabilis chronology from our site was without missing rings. One possible interpretation is that A. spectabilis has not experienced stressful conditions, such as drought, as Kharal et al. [52] had speculated causing missing rings in trees below the timberline in Manang.
BAI in the two species showed obvious differences in productivity. Higher growth rates in younger age classes might suggest why significantly younger trees of A. spectabilis had higher BAI values. However, BAI of B. utilis was always lower. It is possible that conifers have a fitness advantage over angiosperms in resource-limited habitats [3,53]. Although, angiosperms grow faster than gymnosperms [5,53], in this study, carbon gain in B. utilis appeared to be disadvantageous, coinciding with a rise in temperature. The chronology revealed that B. utilis was present two centuries before A. spectabilis. Therefore, consideration of either age or temperature alone is not enough while explaining BAI trends of these species. For example, below average growth of B. utilis, roughly between 1940–1970, was not coupled with climatic adversity for long. The RWI (Figure 4), raw ring-width chronology (Figure A2), and BAI (Figure 5), and their alternating opposite trend in intermittent phases, leads us to hypothesize that limiting factors including disturbances might affect growth outcomes differently between these two species. In addition, the deciduous B. utilis is leafless in winter and spring, and the understory A. spectabilis seedlings have significant opportunities for carbon gain with better light conditions in spring. Moreover, a significant phase of increased growth that lasts for more than 10 years may indicate disturbance events in a closed forest stand. A forest disturbance would more likely stimulate growth and tree recruitment compared to climate favorability, which is often shorter in duration or intensity [54]. However, considering climatic sensitivity, A. spectabilis is more likely to adapt to temperature or precipitation variability [3]. Therefore, thriving under the same conditions, cases of locally missing rings simply denote that B. utilis experienced more adverse conditions. Tiwari et al. [14] also reported declining BAI of B. utilis in the Mustang area because of increasing drought stress with increased temperature in recent decades. The growth-climate correlation analysis further clarifies the relative growth performance relationships between the two species.

4.2. Growth-Climate Relationships

Temperature was a more important control than precipitation for these two species. Our results suggest that A. spectabilis has low sensitivity to climate and B. utilis is sensitive to temperature throughout the growing season and to spring precipitation. Moreover, B. utilis growth showed increased sensitivity to temperature over time. The negative correlation of A. spectabilis radial growth with winter precipitation (significance for December) may be due to a deeper snowpack with delayed melting in spring and reduced soil temperature which could delay cambial onset and growth initiation. Negative impacts of winter precipitation in A. spectabilis growth have also been reported by Shrestha et al. [55], Rayback et al. [7], Kharal et al. [52] and Gaire et al. [56]. The negative A. spectabilis growth correlation to summer precipitation was in line with the results of Schwab et al. [12] and Kharal et al. [52]. Most precipitation at our study site falls during the summer monsoon (Figure 2). Higher precipitation generally results in lower soil temperatures. Furthermore, high precipitation may imply an increase cloud cover that would lower air temperature and light availability impacting photosynthetic capacity and reducing growth [12,23,56]. Because we found weak correlations with temperature, the latter scenario is more plausible. High autocorrelation signaled the importance of the previous year’s growth, however, only July and December precipitation from the previous year appeared to be influential. This negative correlation means the physiological preconditioning associated with better light conditions, but not high precipitation, would be favorable for carbon gain and growth in the following season [12,49]. Gaire et al. [10,56], Kharal et al. [52], Lv and Zhang [17], and Tiwari et al. [19] found negative and positive correlation respectively to spring temperature and precipitation in the same species. The growth climate correlation for A. spectabilis in this study and previous studies from all over the Nepal Himalayas (e.g., [7,16,52,55,57]) are not consistent. This may imply that the local effects of varying microsite conditions are important.
Most previous studies of B. utilis have highlighted a more consistent response of spring climate [11,19,26,27] with particular emphasis on moisture deficits in pre-monsoon periods; our results were similar. The precipitation contributing to spring snow did explain the regeneration success of B. utilis in Manang [18]. Moreover, higher temperature likely exacerbates moisture deficit [10,11,26]. The relationships with temperature in this study slightly differ compared to previous analyses. Earlier studies established temperature correlations for common periods starting prior to this analysis [11,26,27], which only assessed the period of warming transition beginning in the 1970s. We identified higher minimum temperature as limiting growth for B. utilis. The warmer minimum temperature might have promoted better masting efforts in B. utilis to invest less in radial growth. Furthermore, warmer minimum temperature reduces growth in areas already experiencing drought, by worsening soil moisture availability, particularly during the night [58].
There were species-specific responses to temperature and precipitation. In a comparative study, at the treeline belt, Gaire et al. [10] found A. spectabilis had more growth and regeneration sensitivity in eastern Nepal than B. utilis. While A. spectabilis growth positively correlated with summer temperature, there was low sensitivity to spring temperature and precipitation. In the case of B. utilis, growth correlations with spring temperature and precipitation were similar to our results. In the central Himalayas, the prevalence of locally absent rings in B. utilis indicates moisture deficit delaying xylogenesis onset in the spring [59] or inhibiting cambial resumption [27]. Increased temperature influences the onset of xylogenesis, cambial cell division [60,61], and lengthens plant growing season [23], impacting tree productivity. The onset of xylogenesis is expected to advance because of global warming if and where water is not a limiting factor [62]. So, the phenological changes induced by increased temperature led to altered tree growth responses. Here, the temperature rise appears to have a different growth response for these two species, more remarkably in the spring. Compared to broadleaved trees, conifers have lower sensitivity of stomatal conduction in response to increased vapor pressure deficit [25]. Thus, conifers can avoid cavitation by earlier closure of stomata, but angiosperms maintain stomatal conductance and risk cavitation [25]. Therefore, warming during the dry pre-monsoon, and its associated moisture deficit [63], might have been more adverse to B. utilis while the hydraulic safety margins of A. spectabilis still favored its growth. In Tibetan Plateau (China) and Nevada (United States), xylogenesis in conifers too was found to be affected by moisture deficit, outweighing the productivity of conifers due to a longer growing season [64]. However, in eastern Nepal, Pandey et al. [11] analyzed stable carbon isotopes and found that A. spectabilis was less sensitive to precipitation than B. utilis, as the conifer has a higher water-use efficiency compared to broad-leaved trees. In the mixed forest in Dhorpatan, A. spectabilis has been found to be less sensitive to climate, whereas B. utilis is responsive to temperature and spring precipitation.

4.3. Shifts in Growth-Climate Sensitivity

Relationships between radial growth and climate were found to be unstable over time for both A. spectabilis and B. utilis. The trend, particularly with spring climate, has been identified as diverging between A. spectabilis and B. utilis. The literature on temporal stability analysis of growth-climate correlations from the Nepal Himalayas is lacking. Studies from Schwab et al. [12] and Gaire et al. [56], both on A. spectabilis, showed an unstable correlation of tree radial growth with climate, these correlations were more pronounced with precipitation. Sohar et al. [63] also reported a similar instability in the A. spectabilis growth-climate relationships in the western Himalayas. However, despite both of these study areas [12,56] having a similar precipitation regime as ours, A. spectabilis growth showed a positive correlation with spring climatic variables over time, the relationships becoming stronger in contrast to our findings.
Temporal variation in the growth-climate relationship may reflect changing tree growth factors, temperature, moisture, or tree physiology related to carbon dynamics [65,66]. Under normal environmental conditions, cambial activity and followed by cell enlargement begins by early April and peaks by mid-June when the photoperiod is at its maximum and finally ceases by early September [61]. Therefore, environmental conditions at the beginning of the vegetation period have considerable control over tree radial growth. The most likely explanation for the difference in temperature and precipitation correlation is the differences in the xylem functional traits. Having different life history characteristics (conifers have lower tracheid diameters compared to wider vessels in broad-leaved trees [3,67]), A. spectabilis is less vulnerable to cavitation with freeze-thaw than B. utilis. Therefore, current warming might cause stress in the spring for B. utilis. Root pressure can refill the freeze-thaw embolized vessels to restore the xylem conductivity in diffuse porous angiosperm [48]. However, increased warming enhances evapotranspiration, and reduced snowpack during spring reduces soil temperature. This means that there remains a possibility of reduced capacity to recover from winter embolism in B. utilis. In well-watered habitats, angiosperms can grow faster than conifers [5]. The functional constraints of lower efficiency in transport system would, during normal resource availability, lead to an expectation of higher growth rates in B. utilis compared to A. spectabilis. In our study, we found the reverse in the mixed stands. Larger vessels are often constrained by an efficiency-safety trade-off, as larger lumen diameter always poses increased risks of embolism [5]. In habitats with seasonal water deficiency, low nutrients, and freeze-thaw situations, tracheids and weakly vascularized evergreen leaves are safer functional traits in conifers [5]. Considering little change in the trend for precipitation, temperature appeared to be the main driver of this growth divergence between the two species.
Age effects and microsite conditions could lead to unstable temporal correlations [12]. Abies spectabilis moving correlation revealed inconsistent and fragmented relationships in the species in eastern Nepal [56]. Schwab et al. [12] argued the A. spectabilis growth in the Rolwaling area had been more climate sensitive in recent decades, opposite of our findings. Their samples were from treeline elevation. However, Yadav et al. [68] in western Himalaya reported a weakening negative relationship of spring temperature and A. spectabilis growth. They speculated that increased winter precipitation influenced the onset of growing season. The lower Rbar in the mid-20th century may indicate more disturbances at that time [12], which might have influenced the correlations. Alternatively, the loss of sensitivity of A. spectabilis compared to high correlation in the early stages, may be an age effect. Juveniles are more sensitive to climatic variability, especially conifers which have relatively lower cohorts of leaves during juvenile stages [5]. Trees found growing under the canopy of larger trees might also have a greater sensitivity to climate. Recent findings from a wide-ranging study of forests and species in the northeastern United States found that understory trees had stronger growth sensitivity to climate [69]. By the mid-20th century, when our A. spectabilis chronology began to show decreasing correlation to climate, the age of trees was approximately 3–4 decades. After gaining height, more mature trees might be less sensitive to climate because larger trees can take advantages of deep soil for water and nutrients, as well as previous year’s photosynthetic products, or are less vulnerable to snow pack and freeze-thaw disturbance [53]. Changing climate itself may cause temporal instability in the growth response of trees to climatic variations. However, the reduced climate sensitivity of A. spectabilis suggests, along with climate, other biotic and abiotic factors are important.
Low temperature during the early growing season no longer seems to be the limiting factor it used to be during the early 20th century, when the A. spectabilis stand was younger. Spring temperature was positively correlated then, but now, there is no correlation. Abies spectabilis, when young, showed more sensitivity to climatic variation. Moreover, higher precipitation during spring could increase snow accumulation. The delayed snow melt and associated lower temperature might have delayed cambial reactivation so that the shortened growing period might have limited A. spectabilis growth. This explains why A. spectabilis growth correlations were positive with temperature and negative with precipitation in spring. Our findings now suggest that previous constraints have been lifted by warming such that A. spectabilis growth is no longer constrained by low spring temperature. The divergent relationship may be the result of both the combined age-related effect and warming. Young conifer stands tend to accumulate carbon slower compared to angiosperms [5], and with hydraulic or nutrient limitations, climate sensitivity can change in older ages [70]. Schwab et al. [12] also found increased plasticity of A. spectabilis due to altered climate in Rolwaling, Nepal. During the mid-20th century, Schwab et al. [12] detected A. spectabilis growth that was positively correlated with winter, spring, and summer temperature and inversely to winter precipitation.
The decreasing climate sensitivity of A. spectabilis may indicate a divergence problem that can arise when tree growth in temperature-limited habitats tends to develop a weakening sensitivity to temperature [65]. Although there are various environmental factors that can cause the divergence, moisture stress induced by warming is one of them [71]. The decline of positive temperature sensitivity recently in some Alaskan treelines has been attributed to moisture stress induced by warming [71]. The drought stress is unlikely to cause divergence problem in A. spectabilis in Dhorpatan because growth-climate correlation doesn’t show the stress. Decreasing sensitivity may have arisen from a threshold mechanism such that above an optimal temperature, warming doesn’t bring positive effects on ring width even at treeline [71]. Davi et al. [72] also detected a decline in temperature sensitivity and tree growth after the 1970s in ring width data from elevational treeline sites in Alaska. Normally, the longer growing season favors growth in the positively responding trees. Different species have their own physiological traits, and B. utilis has been increasingly at risk of mortality from temperature induced moisture deficit [14,26,27]. Moving window correlation analysis clearly identified increased growth limitation because of increased temperature. Based on increasing climate sensitivity, we speculate that the early successional B. utilis [14,18] may be in regressive successions [24].

5. Conclusions

TRW-climate correlation signals the significant, differential, and nonstationary nature of the influences of temperature and precipitation on radial growth of A. spectabilis and B. utilis. Because there are many other covarying forcing factors, in addition to climate, to consider, such as atmospheric carbon dioxide and nitrogen deposition, additional detailed studies are needed to assess their respective influence on growth. Nevertheless, under the warming scenario, species specific growth performances with differing climate sensitivity suggest that warming is the most plausible driver of tree growth. Spring climate has a distinct trend whereas those in other months are inconsistent. Abies spectabilis BAI appears to be attuned to current warming whereas the growth of the already slow growing B. utilis is declining. Conifers are predominant in colder habitats where risks of embolism generally exclude angiosperm trees [25]. Although our study incorporated dissimilar ages of the two species we suggest that the climate trend has subjected B. utilis to increased risk, supporting the inference of Liang et al. [27]. Covering wide geographical distribution to assess spatial synchrony, time-dependent variables including the age specific sensitivity, disturbance, competition, and others are required to further understand the underlying controls.

Author Contributions

Conceptualization, P.K.C.; data curation, R.B. and P.K.C.; methodology, R.B. and P.K.C.; formal analysis, R.B.; validation, P.K.C., J.S.J. and A.S.; writing—original draft preparation, R.B.; writing—review and editing, R.B., J.S.J., P.K.C., K.B.S. and A.S. All authors have read and agreed to the published version of the manuscript.

Funding

This research received no external funding.

Institutional Review Board Statement

Not applicable.

Informed Consent Statement

Not applicable.

Data Availability Statement

Data are contained within the article.

Acknowledgments

Authors are thankful to the Department of National Park and Wildlife Conservation, Nepal for the permission to conduct this study within the Dhorpatan Hunting Reserve. R.B. and P.K.C. thank CSUDH 2020/21 AY Faculty RSCA grant program (FRG ’20).

Conflicts of Interest

The authors declare no conflict of interest.

Appendix A

Table A1. Difference in mean temperature and total precipitation in monthly and annual resolution, before and after 1980 (based on Climatic Research Unit climate data).
ClimateTemperature (°C)Precipitation (mm)
Annual0.52 *−61.02
January0.48 *−1.97
February0.87 *−1.74
March0.72 *9.23
April0.430.52
May0.0228.50 *
June0.17−27.95
July0.19−16.39
August0.34−53.11 *
September0.36 *6.96
October0.59 *−8.95
November1.06 *−0.37
December1.02 *4.26
Note: * denotes the significance of the difference at 95% confidence interval.

Appendix B

Figure A1. (a) Monthly mean temperature based on the CRU gridded dataset 1901–2019. The blue lines are the LOWESS smoothing, gray shades are 95% confidence interval. (b) Monthly sum of precipitation based on the CRU gridded dataset 1901–2019. The blue lines are the LOWESS smoothing, gray shades are 95% confidence interval.
Forests 12 01137 g0a1aForests 12 01137 g0a1b

Appendix C

Figure A2. Raw ring width overview of Abies spectabilis (upper) and Betula utilis (lower). Grey lines are individual ring width series, black bold lines are mean of all the series.
Forests 12 01137 g0a2

Appendix D

Figure A3. Radial growth-climate correlations of (a) Abies spectabilis (1919–2015) and (b) Betula utilis (1901–2015). Green dashed lines define 0.05 significance level. Lowercase letters on the x-axis are months of previous years, and uppercase letters are the current year months. DJF, MAM, JJAS and ON are winter, spring, summer and autumn seasons respectively.
Forests 12 01137 g0a3

Appendix E

Figure A4. Moving windows correlation analysis between climate and radial growth of (a) Abies spectabilis and (b) Betula utilis. The correlation windows were of 35 years with two years’ offset. Asterisks (*) denote the significance of correlation (at 0.05) in either directions.
Forests 12 01137 g0a4

References

  1. Götzenberger, L.; de Bello, F.; Bråthen, K.A.; Davison, J.; Dubuis, A.; Guisan, A.; Lepš, J.; Lindborg, R.; Moora, M.; Pärtel, M.; et al. Ecological Assembly rules in plant communities—Approaches, patterns and prospects. Biol. Rev. 2012, 87, 111–127. [Google Scholar] [CrossRef] [PubMed]
  2. Valladares, F.; Bastias, C.C.; Godoy, O.; Granda, E.; Escudero, A. Species coexistence in a changing world. Front. Plant Sci. 2015, 6, 866. [Google Scholar] [CrossRef]
  3. Sperry, J.S.; Hacke, U.G.; Pittermann, J. Size and function in conifer tracheids and angiosperm vessels. Am. J. Bot. 2006, 93, 1490–1500. [Google Scholar] [CrossRef] [Green Version]
  4. Stewart, G.H. Population dynamics of a montane conifer forest, western Cascade Range, Oregon, USA. Ecology 1986, 67, 534–544. [Google Scholar] [CrossRef]
  5. Bond, W.J. The tortoise and the hare: Ecology of angiosperm dominance and gymnosperm persistence. Biol. J. Linn. Soc. 1989, 36, 227–249. [Google Scholar] [CrossRef]
  6. Körner, C. Alpine Plant Life: Functional Plant Ecology of High Mountain Ecosystems, 2nd ed.; Springer: New York, NY, USA, 2003. [Google Scholar]
  7. Rayback, S.A.; Shrestha, K.B.; Hofgaard, A. growth variable-specific moisture and temperature limitations in co-occurring alpine tree and shrub species, central Himalayas, Nepal. Dendrochronologia 2017, 44, 193–202. [Google Scholar] [CrossRef]
  8. Schickhoff, U.; Bobrowski, M.; Böhner, J.; Bürzle, B.; Chaudhary, R.P.; Gerlitz, L.; Heyken, H.; Lange, J.; Müller, M.; Scholten, T.; et al. Do Himalayan treelines respond to recent climate change? An evaluation of sensitivity indicators. Earth Syst. Dyn. 2015, 6, 245–265. [Google Scholar] [CrossRef]
  9. Harsch, M.A.; Hulme, P.E.; McGlone, M.S.; Duncan, R.P. Are treelines advancing? A global meta-analysis of treeline response to climate warming. Ecol. Lett. 2009, 12, 1040–1049. [Google Scholar] [CrossRef]
  10. Gaire, N.P.; Koirala, M.; Bhuju, D.R.; Carrer, M. Site- and species-specific treeline responses to climatic variability in eastern Nepal Himalaya. Dendrochronologia 2017, 41, 44–56. [Google Scholar] [CrossRef]
  11. Pandey, S.; Cherubini, P.; Saurer, M.; Carrer, M.; Petit, G. Effects of climate change on treeline trees in Sagarmatha (Mt. Everest, Central Himalaya). J. Veg. Sci. 2020, 31, 1144–1153. [Google Scholar] [CrossRef]
  12. Schwab, N.; Kaczka, R.J.; Janecka, K.; Böhner, J.; Chaudhary, R.P.; Scholten, T.; Schickhoff, U. Climate change-induced shift of tree growth sensitivity at a central Himalayan treeline ecotone. Forests 2018, 9, 267. [Google Scholar] [CrossRef] [Green Version]
  13. Gaire, N.P.; Koirala, M.; Bhuju, D.R.; Borgaonkar, H.P. Treeline dynamics with climate change at the central Nepal Himalaya. Clim. Past 2014, 10, 1277–1290. [Google Scholar] [CrossRef] [Green Version]
  14. Tiwari, A.; Fan, Z.-X.; Jump, A.S.; Zhou, Z.-K. Warming induced growth decline of Himalayan birch at its lower range edge in a semi-arid region of trans-Himalaya, central Nepal. Plant Ecol. 2017, 218, 621–633. [Google Scholar] [CrossRef]
  15. Chhetri, P.K.; Cairns, D.M. Contemporary and historic population structure of Abies spectabilis at treeline in Barun Valley, eastern Nepal Himalaya. J. Mt. Sci. 2015, 12, 558–570. [Google Scholar] [CrossRef]
  16. Chhetri, P.K.; Cairns, D.M. Dendroclimatic response of Abies spectabilis at treeline ecotone of Barun Valley, eastern Nepal Himalaya. J. For. Res. 2016, 27, 1163–1170. [Google Scholar] [CrossRef]
  17. Lv, L.-X.; Zhang, Q.-B. Asynchronous recruitment history of Abies spectabilis along an altitudinal gradient in the Mt. Everest region. J. Plant Ecol. 2012, 5, 147–156. [Google Scholar] [CrossRef] [Green Version]
  18. Shrestha, B.B.; Ghimire, B.; Lekhak, H.D.; Jha, P.K. Regeneration of treeline birch (Betula utilis D. Don) forest in a trans-Himalayan dry valley in Central Nepal. Mt. Res. Dev. 2007, 27, 259–267. [Google Scholar] [CrossRef]
  19. Tiwari, A.; Fan, Z.-X.; Jump, A.S.; Li, S.-F.; Zhou, Z.-K. Gradual expansion of moisture sensitive Abies spectabilis forest in the trans-Himalayan zone of central Nepal associated with climate change. Dendrochronologia 2017, 41, 34–43. [Google Scholar] [CrossRef]
  20. Tiwari, A.; Jha, P.K. An overview of treeline response to environmental changes in Nepal Himalaya. Trop. Ecol. 2018, 59, 273–285. [Google Scholar]
  21. Shrestha, K.B.; Hofgaard, A.; Vandvik, V. Recent treeline dynamics are similar between dry and mesic areas of Nepal, central Himalaya. J. Plant Ecol. 2015, 8, 347–358. [Google Scholar] [CrossRef] [Green Version]
  22. Chhetri, P.K.; Bista, R.; Shrestha, K.B. How Does the stand structure of treeline-forming species shape the treeline ecotone in different regions of the Nepal Himalayas? J. Mt. Sci. 2020, 17, 2354–2368. [Google Scholar] [CrossRef]
  23. Takahashi, K.; Tokumitsu, Y.; Yasue, K. Climatic factors affecting the tree-ring width of Betula ermanii at the timberline on Mount Norikura, Central Japan. Ecol. Res. 2005, 20, 445–451. [Google Scholar] [CrossRef] [Green Version]
  24. Miehe, G.; Miehe, S.; Böhner, J.; Bäumler, R.; Ghimire, S.K.; Bhattarai, K.; Chaudhary, R.P.; Subedi, M.; Jha, P.K.; Pendry, C. Vegetation ecology. In Nepal. An Introduction to the Natural History, Ecology and Human Environment of the Himalayas. A Companion to the Flora of Nepal; Miehe, G., Pendry, C., Chaudhary, R.P., Eds.; Royal Botanic Garden: Edinburgh, UK, 2015; pp. 144–168. [Google Scholar]
  25. Carnicer, J.; Barbeta, A.; Sperlich, D.; Coll, M.; Peñuelas, J. Contrasting trait syndromes in angiosperms and conifers are associated with different responses of tree growth to temperature on a large scale. Front. Plant Sci. 2013, 4, 409. [Google Scholar] [CrossRef] [PubMed] [Green Version]
  26. Dawadi, B.; Liang, E.; Tian, L.; Devkota, L.P.; Yao, T. Pre-monsoon precipitation signal in tree rings of timberline Betula utilis in the central Himalayas. Quat. Int. 2013, 283, 72–77. [Google Scholar] [CrossRef]
  27. Liang, E.; Dawadi, B.; Pederson, N.; Eckstein, D. Is the growth of birch at the upper timberline in the Himalayas limited by moisture or by temperature? Ecology 2014, 95, 2453–2465. [Google Scholar] [CrossRef] [Green Version]
  28. Chhetri, P.K.; Cairns, D.M. Low recruitment above treeline indicates treeline stability under changing climate in Dhorpatan Hunting Reserve, western Nepal. Phys. Geogr. 2018, 39, 329–342. [Google Scholar] [CrossRef]
  29. Department of National Parks and Wildlife Conservation (DNPWC); Dhorpatan Hunting Reserve. Available online: http://www.dnpwc.gov.np/en/conservation-area-detail/61/ (accessed on 14 December 2020).
  30. Bobrowski, M.; Gerlitz, L.; Schickhoff, U. Modelling the potential distribution of Betula utilis in the Himalaya. Glob. Ecol. Conserv. 2017, 11, 69–83. [Google Scholar] [CrossRef]
  31. University of East Anglia Climatic Research Unit; Harris, I.; Osborn, T.J.; Jones, P.; Lister, D. CRU TS4.04: Climatic Research Unit (CRU) Time-Series (TS) Version 4.04 of high-resolution gridded data of month-by-month variation in climate (January 1901–December 2019). Cent. Environ. Data Anal. 2020. Available online: https://catalogue.ceda.ac.uk/uuid/89e1e34ec3554dc98594a5732622bce9 (accessed on 16 November 2020).
  32. Harris, I.; Osborn, T.J.; Jones, P.; Lister, D. Version 4 of the CRU TS monthly high-resolution gridded multivariate climate dataset. Sci. Data 2020, 7, 109. [Google Scholar] [CrossRef] [Green Version]
  33. Guijarro, J.A. Climatol: Climate Tools (Series Homogenization and Derived Products). R Package Version 3.1.2. 2019. Available online: https://CRAN.R-project.org/package=climatol (accessed on 11 December 2020).
  34. Schweingruber, F.H.; Kairiukstis, L.; Shiyatov, S. Sample selection. In Methods of Dendrochronology; Cook, E.R., Kairiukstis, L.A., Eds.; Kluwer Academic Publishers: Dordrecht, The Netherlands, 1990; pp. 23–35. [Google Scholar]
  35. Phipps, R.L. Collecting, Preparing, Crossdating, and Measuring Tree Increment Cores; Department of the Interior, U.S. Geological Survey: Reston, VA, USA, 1985.
  36. Pilcher, J.R. Sample preparation, cross-dating, and measurement. In Methods of Dendrochronology; Cook, E.R., Kairiukstis, L.A., Eds.; Kluwer Academic Publishers: Dordrecht, The Netherlands, 1990; pp. 40–51. [Google Scholar]
  37. Speer, J.H. Fundamentals of Tree-Ring Research; University of Arizona Press: Tucson, AZ, USA, 2010. [Google Scholar]
  38. Bunn, A.G. A dendrochronology program library in R (DplR). Dendrochronologia 2008, 26, 115–124. [Google Scholar] [CrossRef]
  39. R Core Team. R: A Language and Environment for Statistical Computing; R Version 4.0.3; R Foundation for Statistical Computing: Vienna, Austria, 2020. [Google Scholar]
  40. Holmes, R.L. Computer-assisted quality control in tree-ring dating and measurement. Tree-Ring Bull. 1983, 43, 69–78. [Google Scholar]
  41. Cook, E.R.; Briffa, K.R.; Shiyatov, S.; Mazepa, V. Tree-ring standardization and growth-trend estimation. In Methods of Dendrochronology; Cook, E.R., Kairiukstis, L.A., Eds.; Kluwer Academic Publishers: Dordrecht, The Netherlands, 1990; pp. 104–123. [Google Scholar]
  42. Cook, E.R.; Shiyatov, S.; Mazepa, V. Estimation of the mean chronology. In Methods of Dendrochronology; Cook, E.R., Kairiukstis, L.A., Eds.; Kluwer Academic Publishers: Dordrecht, The Netherlands, 1990; pp. 123–132. [Google Scholar]
  43. Wigley, T.M.L.; Briffa, K.R.; Jones, P.D. On the average value of correlated time series, with applications in dendroclimatology and hydrometeorology. J. Clim. Appl. Meteorol. 1984, 23, 201–213. [Google Scholar] [CrossRef]
  44. St. George, S. An Overview of Tree-Ring Width Records across the Northern Hemisphere. Quat. Sci. Rev. 2014, 95, 132–150. [Google Scholar] [CrossRef]
  45. Biondi, F.; Qeadan, F. A theory-driven approach to tree-ring standardization: Defining the biological trend from expected basal area increment. Tree-Ring Res. 2008, 64, 81–96. [Google Scholar] [CrossRef] [Green Version]
  46. Weiner, J.; Thomas, S.C. The nature of tree growth and the “age-related decline in forest productivity”. Oikos 2001, 94, 374–376. [Google Scholar] [CrossRef] [Green Version]
  47. Bunn, A.; Korpela, M.; Biondi, F.; Campelo, F.; Mérian, P.; Qeadan, F.; Zang, C. DplR: Dendrochronology Program Library in R. R Package Version 1.7.1. 2020. Available online: https://CRAN.R-project.org/package=dplR (accessed on 16 November 2020).
  48. Phipps, R.L.; Field, M.L. Computer Programs to Calculate Basal Area Increment from Tree Rings; Department of the Interior, U.S. Geological Survey: Reston, VA, USA, 1989.
  49. Fritts, H.C. Tree Rings and Climate; Academic Press: New York, NY, USA, 1976. [Google Scholar]
  50. Zang, C.; Biondi, F. Treeclim: An R package for the numerical calibration of proxy-climate relationships (Version 2.0.5.1). Ecography 2014, 38, 431–436. [Google Scholar] [CrossRef]
  51. Pandey, S.; Carrer, M.; Castagneri, D.; Petit, G. Xylem anatomical responses to climate variability in Himalayan birch trees at one of the world’s highest forest limit. Perspect. Plant Ecol. Evol. Syst. 2018, 33, 34–41. [Google Scholar] [CrossRef]
  52. Kharal, D.K.; Thapa, U.K.; St. George, S.; Meilby, H.; Rayamajhi, S.; Bhuju, D.R. Tree-climate relations along an elevational transect in Manang Valley, central Nepal. Dendrochronologia 2017, 41, 57–64. [Google Scholar] [CrossRef]
  53. Lusk, C.H.; Jorgensen, M.A.; Bellingham, P.J. A conifer–angiosperm divergence in the growth vs. Shade tolerance trade-off underlies the dynamics of a New Zealand warm-temperate rain forest. J. Ecol. 2015, 103, 479–488. [Google Scholar] [CrossRef]
  54. Abrams, M.D.; Orwig, D.A. Structure, radial growth dynamics and recent climatic variations of a 320-year-old Pinus rigida rock outcrop community. Oecologia 1995, 101, 353–360. [Google Scholar] [CrossRef] [PubMed]
  55. Shrestha, K.B.; Hofgaard, A.; Vandvik, V. Tree-growth response to climatic variability in two climatically contrasting treeline ecotone areas, central Himalaya, Nepal. Can. J. For. Res. 2015, 45, 1643–1653. [Google Scholar] [CrossRef]
  56. Gaire, N.P.; Fan, Z.-X.; Braeuning, A.; Panthi, S.; Rana, P.; Shrestha, A.; Bhuju, D.R. Abies spectabilis shows stable growth relations to temperature, but changing response to moisture conditions along an elevation gradient in the central Himalaya. Dendrochronologia 2020, 60, 125675. [Google Scholar] [CrossRef]
  57. Shrestha, K.B.; Chhetri, P.K.; Bista, R. Growth responses of Abies spectabilis to climate variations along an elevational gradient in Langtang National Park in the central Himalaya, Nepal. J. For. Res. 2017, 22, 274–281. [Google Scholar] [CrossRef]
  58. Herrera-Soto, G.; González-Cásares, M.; Pompa-García, M.; Camarero, J.J.; Solís-Moreno, R. Growth of Pinus cembroides Zucc. in response to hydroclimatic variability in four sites forming the species latitudinal and longitudinal distribution limits. Forests 2018, 9, 440. [Google Scholar] [CrossRef] [Green Version]
  59. Liang, E.; Balducci, L.; Ren, P.; Rossi, S. Xylogenesis and moisture stress. In Secondary Xylem Biology; Kim, Y.S., Funada, R., Singh, A.P., Eds.; Academic Press: Cambridge, MA, USA; Elsevier: Amsterdam, The Netherlands, 2016; pp. 45–58. [Google Scholar]
  60. Begum, S.; Nakaba, S.; Yamagishi, Y.; Oribe, Y.; Funada, R. Regulation of cambial activity in relation to environmental conditions: Understanding the role of temperature in wood formation of trees. Physiol. Plant. 2013, 147, 46–54. [Google Scholar] [CrossRef]
  61. Rathgeber, C.B.K.; Cuny, H.E.; Fonti, P. Biological basis of tree-ring formation: A crash course. Front. Plant Sci. 2016, 7, 734. [Google Scholar] [CrossRef] [Green Version]
  62. Rossi, S.; Deslauriers, A.; Griçar, J.; Seo, J.-W.; Rathgeber, C.B.; Anfodillo, T.; Morin, H.; Levanic, T.; Oven, P.; Jalkanen, R. Critical temperatures for xylogenesis in conifers of cold climates. Glob. Ecol. Biogeogr. 2008, 17, 696–707. [Google Scholar] [CrossRef]
  63. Sohar, K.; Altman, J.; Lehečková, E.; Doležal, J. Growth–climate relationships of Himalayan conifers along elevational and latitudinal gradients. Int. J. Climatol. 2017, 37, 2593–2605. [Google Scholar] [CrossRef]
  64. Ren, P.; Ziaco, E.; Rossi, S.; Biondi, F.; Prislan, P.; Liang, E. Growth rate rather than growing season length determines wood biomass in dry environments. Agric. For. Meteorol. 2019, 271, 46–53. [Google Scholar] [CrossRef]
  65. D’Arrigo, R.; Wilson, R.; Liepert, B.; Cherubini, P. On the ‘divergence problem’ in northern forests: A review of the tree-ring evidence and possible causes. Glob. Planet. Chang. 2008, 60, 289–305. [Google Scholar] [CrossRef]
  66. Peltier, D.M.P.; Ogle, K. Tree growth sensitivity to climate is temporally variable. Ecol. Lett. 2020, 23, 1561–1572. [Google Scholar] [CrossRef] [PubMed]
  67. Langan, S.J.; Ewers, F.W.; Davis, S.D. Xylem dysfunction caused by water stress and freezing in two species of co-occurring chaparral shrubs. Plant Cell Environ. 1997, 20, 425–437. [Google Scholar] [CrossRef]
  68. Yadav, R.R.; Singh, J.; Dubey, B.; Chaturvedi, R. Varying strength of relationship between temperature and growth of high-level fir at marginal ecosystems in western Himalaya, India. Curr. Sci. 2004, 86, 1152–1156. [Google Scholar]
  69. Rollinson, C.R.; Alexander, M.R.; Dye, A.W.; Moore, D.J.P.; Pederson, N.; Trouet, V. Climate sensitivity of understory trees differs from overstory trees in temperate mesic forests. Ecology 2021, 102, e03264. [Google Scholar] [CrossRef]
  70. Ryan, M.G.; Yoder, B.J. Hydraulic limits to tree height and tree growth. BioScience 1997, 47, 235–242. [Google Scholar] [CrossRef] [Green Version]
  71. D’Arrigo, R.D.; Kaufmann, R.K.; Davi, N.; Jacoby, G.C.; Laskowski, C.; Myneni, R.B.; Cherubini, P. Thresholds for warming-induced growth decline at elevational tree line in the Yukon Territory, Canada. Glob. Biogeochem. Cycles 2004, 18, GB3021. [Google Scholar] [CrossRef]
  72. Davi, N.K.; Jacoby, G.C.; Wiles, G.C. Boreal temperature variability inferred from maximum latewood density and tree-ring width data, Wrangell Mountain region, Alaska. Quat. Res. 2003, 60, 252–262. [Google Scholar] [CrossRef]
Figure 1. Land cover around the study area. The dots in the inset are the approximate position of Climatic Research Unit (CRU) grid cells. (Landcover data source: ICIMOD 2010).
Forests 12 01137 g001
Figure 2. Climate chart of CRU grid average data. (a) Walter-Leith climograph, produced with the climatol R package [33], (b) Annual climate trend from the CRU data. The uppercase letters in the x-axis of Walter-Leith climograph are initial letters of twelve months.
Forests 12 01137 g002
Figure 3. Growing season (spring (March, April, May) and summer (June, July, August, September) and annual mean temperature and total precipitation trends based on the CRU TS 4.04 grid average data. (a) Average annual temperature, (c) Average spring temperature, (e) Average summer temperature, (b) Total annual precipitation, (d) Total spring precipitation and (f) Total summer precipitation. The blue lines are the LOWESS smoothing (locally weighted scatterplot smoothing) with 50% span, gray shades are 95% confidence interval.
Forests 12 01137 g003
Figure 4. Tree-ring width standard chronology (black line), 10 year moving average of the ring width indices (red line), and sample depth (green line) for Betula utilis and Abies spectabilis. The light gray shade on the left of the chronology shows EPS less than 0.85. Blue and red lines below the respective chronologies are corresponding running EPS and Rbar (between-tree correlation), respectively, in 20-year window with overlap of 10 years.
Forests 12 01137 g004
Figure 5. Basal Area Increment (BAI) trend of Abies spectabilis and Betula utilis trees. Blue and black bold lines are 10-year moving average of BAI for Abies spectabilis and Betula utilis, respectively.
Forests 12 01137 g005
Figure 6. Static radial growth-climate relationships of (a) Abies spectabilis and (b) Betula utilis for common period of 1970–2015. The upper and lower horizontal green dashed lines for both plots denotes the significance at 0.05. Lowercase and uppercase letters on x-axis represent previous year’s and current year’s months, respectively. Precp = precipitation, Tmax = maximum temperature, Tavg = mean temperature, and Tmin = minimum temperature.
Forests 12 01137 g006
Figure 7. Moving correlation of Abies spectabilis and Betula utilis radial growth with mean spring temperature and precipitation sum over time. Solid fill indicates the significance at 0.05.
Forests 12 01137 g007
Table 1. Dendrochronological statistics for raw and standardized chronologies.
StatisticSpecies
Abies spectabilisBetula utilis
Series number (tree number)53 (28)44 (24)
Span (Year)1909–20151721–2015
Average mean sensitivity (MS)0.210.35
First order autocorrelation (Ar1)0.700.76
Mean inter-series correlation (R) 0.540.55
Mean within-tree correlation (Rbarwt)0.550.53
Mean between-tree correlation (Rbarbt)0.310.33
Expressed population signal (EPS)0.910.92
Year after which EPS > 0.8519191808
Signal-to-noise ratio (SNR)10.2810.89
Publisher’s Note: MDPI stays neutral with regard to jurisdictional claims in published maps and institutional affiliations.