
Biological Legacies and Rockfall: The Protective Effect of a Windthrown Forest

 , , and
Abstract
:1. Introduction
2. Materials and Methods
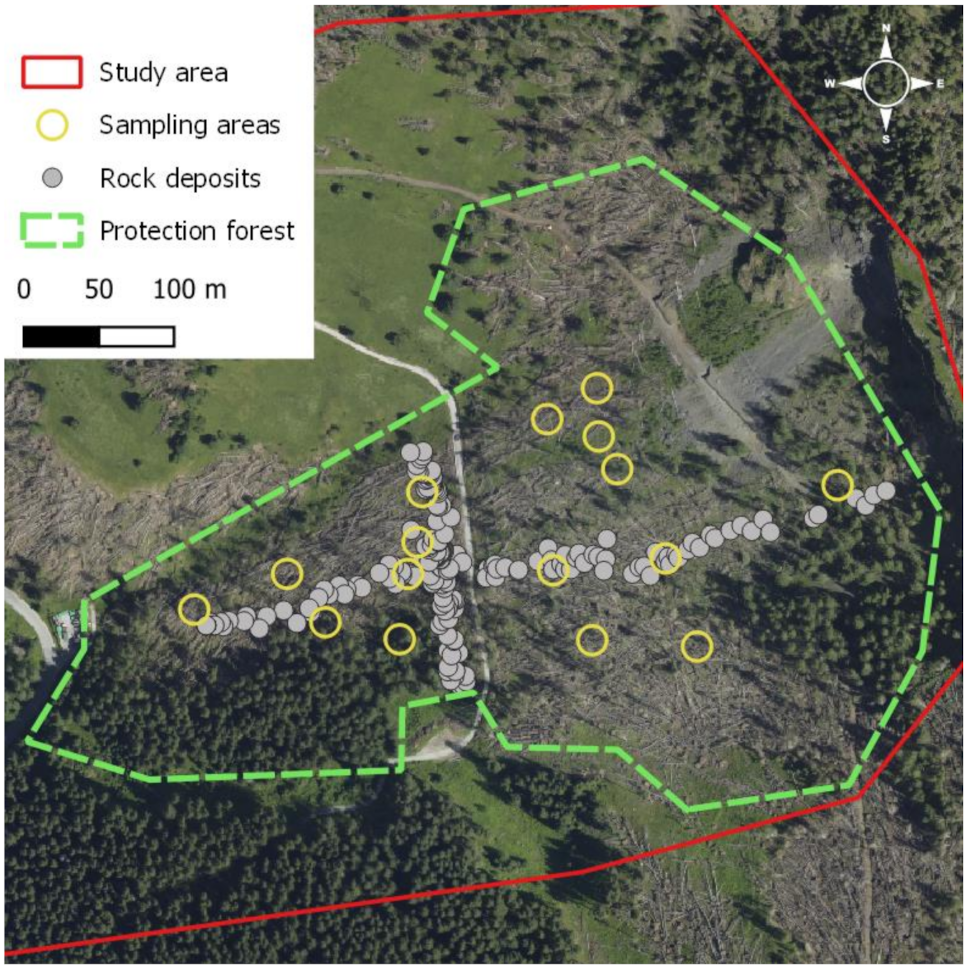
2.1. Study Area
2.2. Field Data
2.2.1. Rockfall Activity
2.2.2. Slope Surface Parameters
2.3. Remote Sensing Data
2.4. Data Pre-Processing
Post-Event Layers
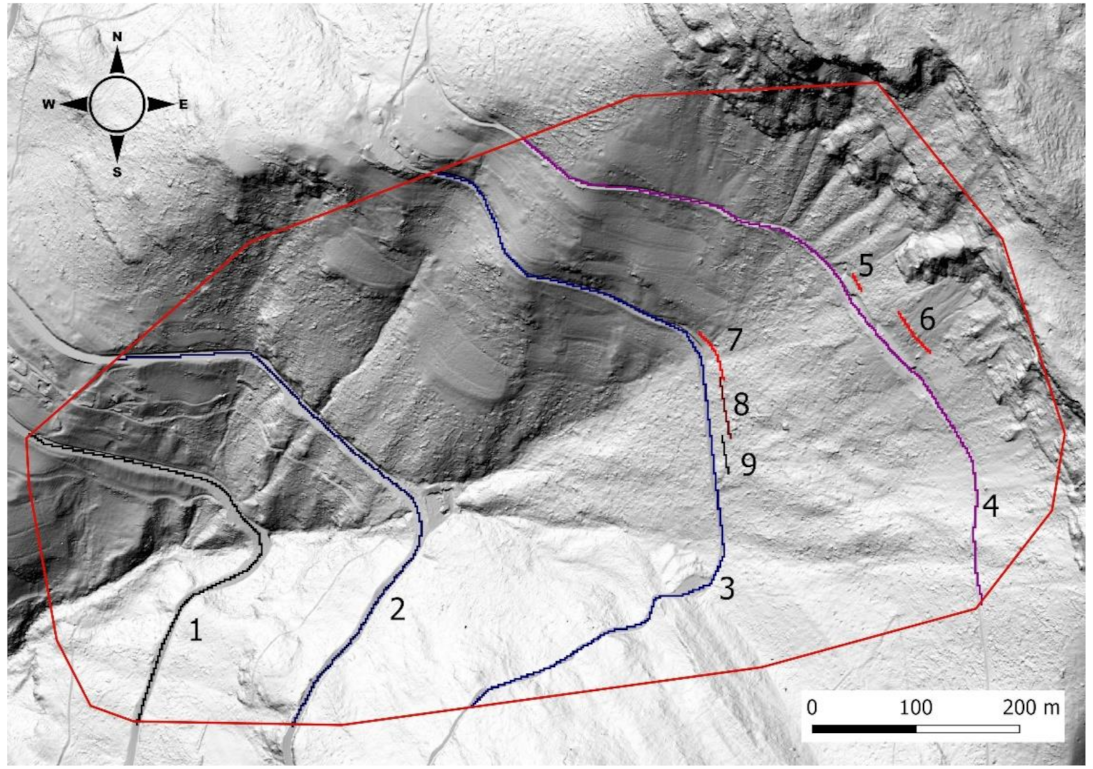
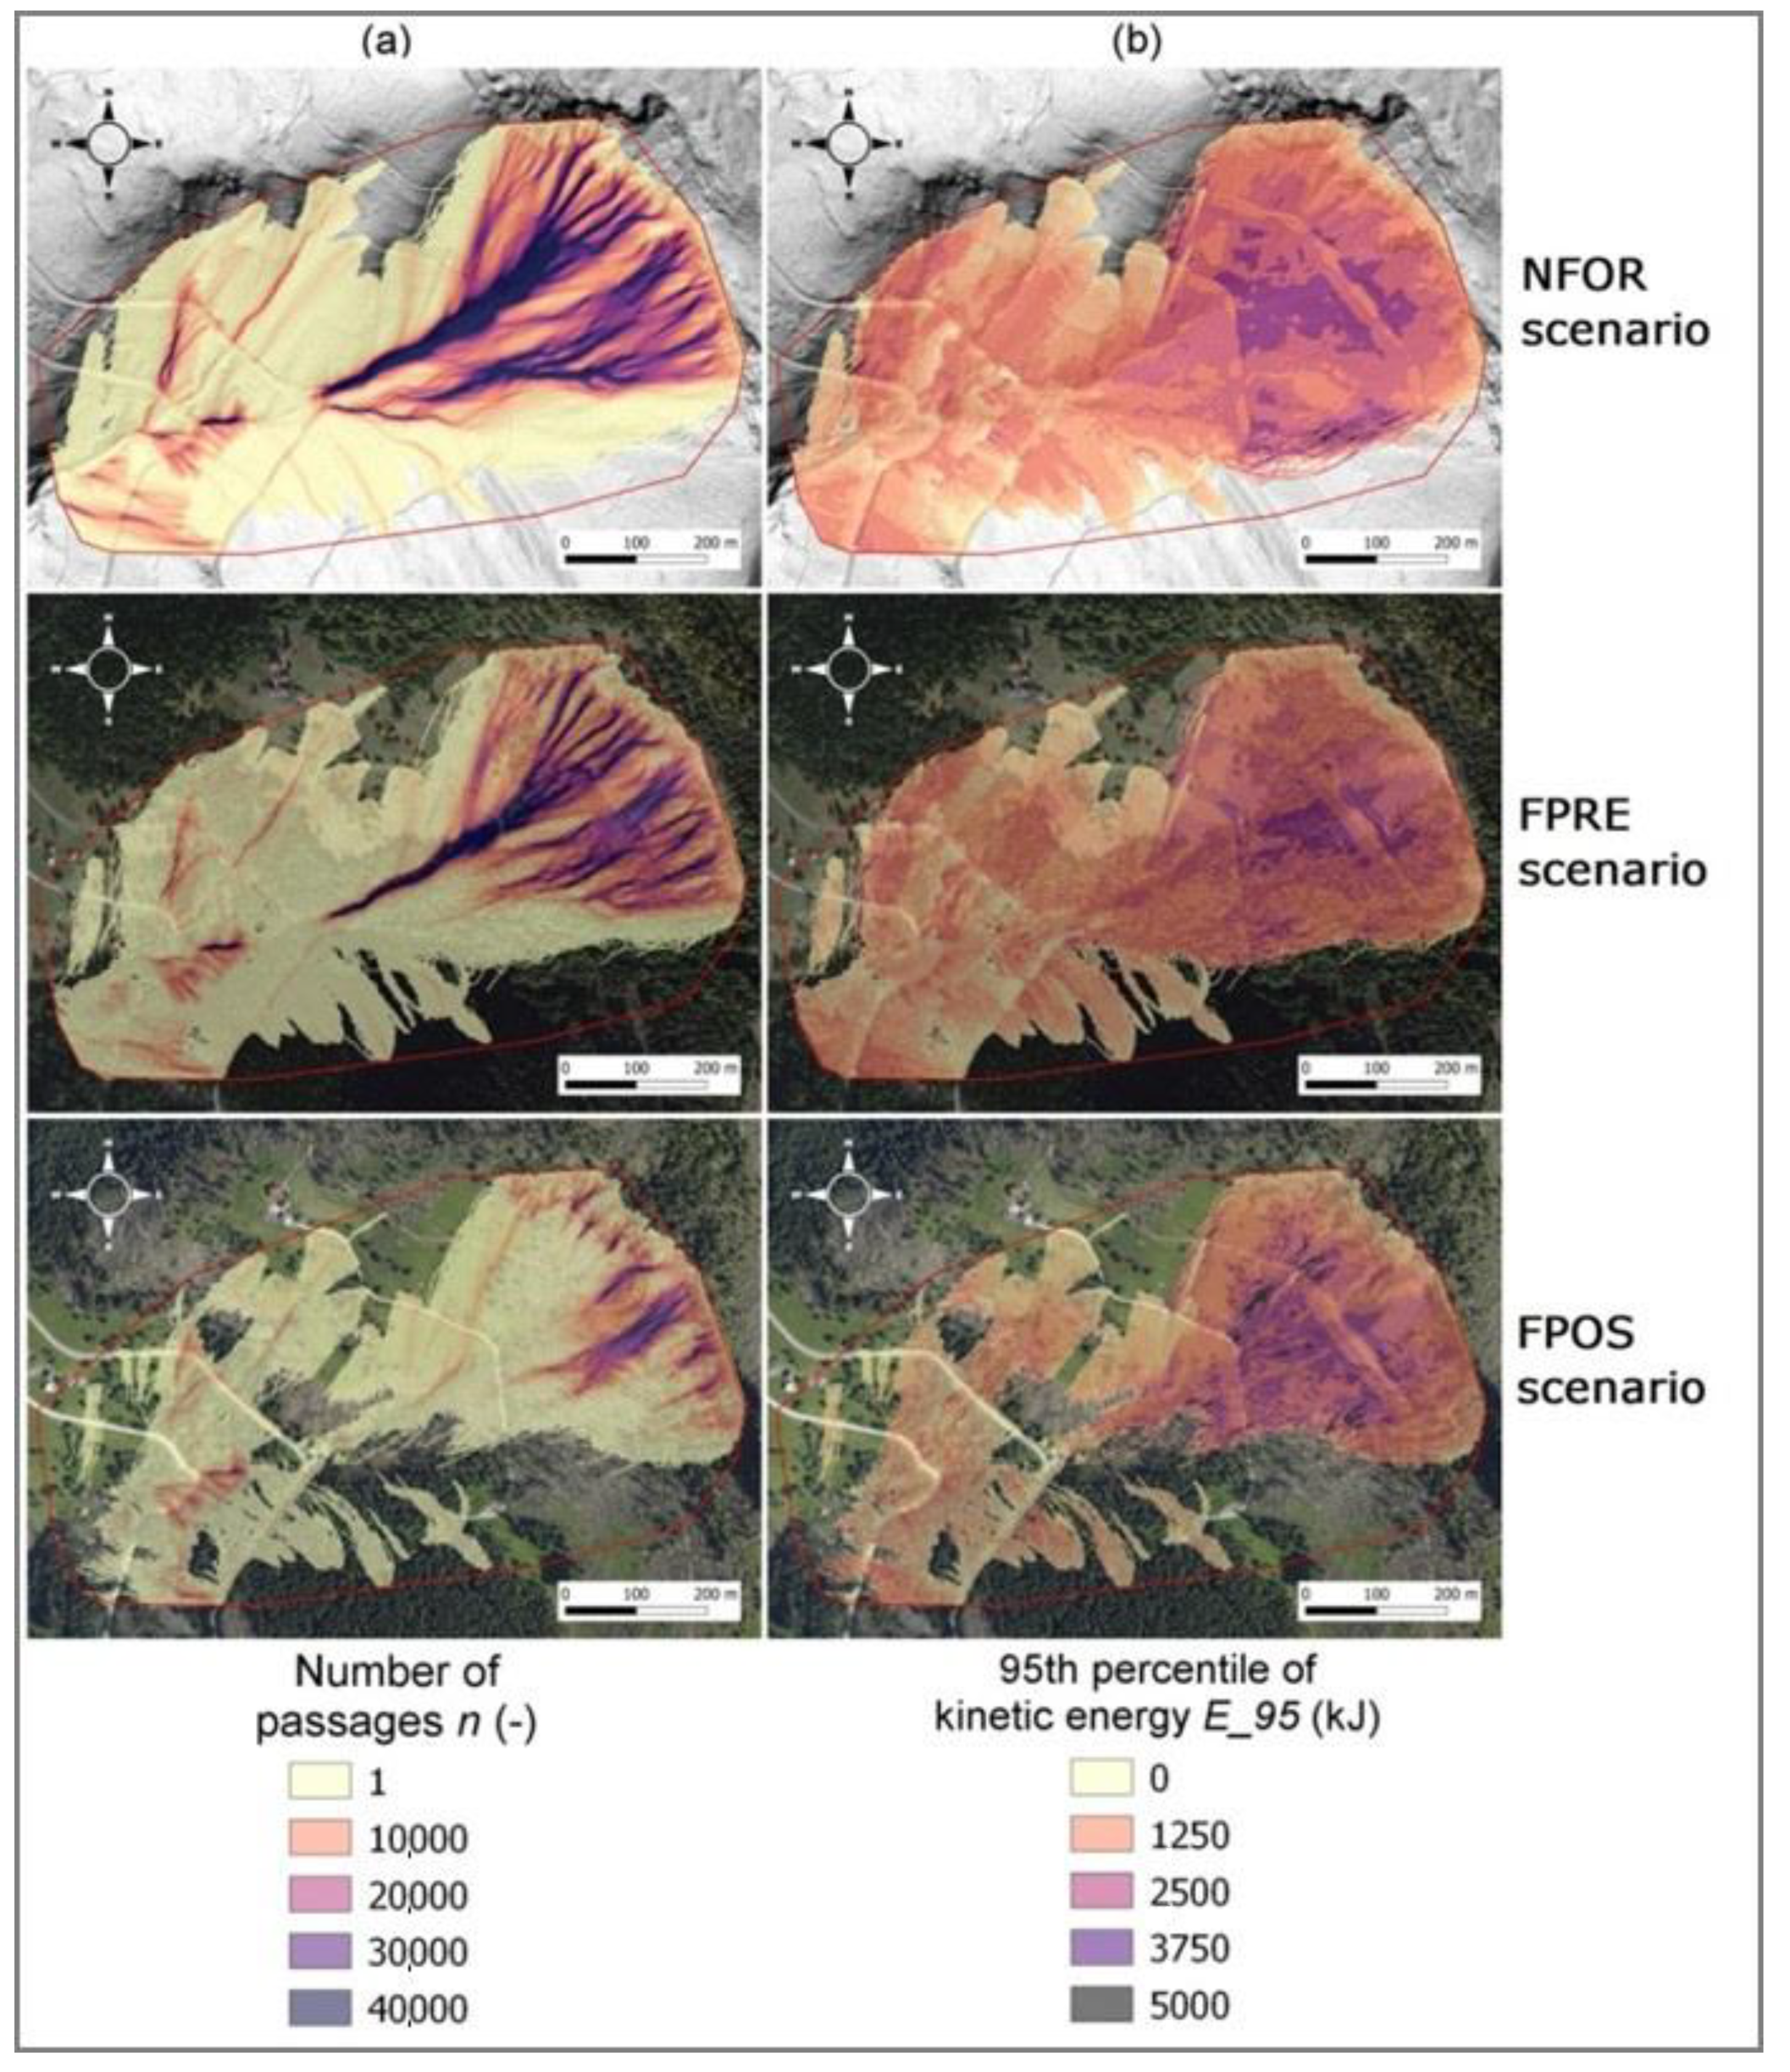
2.5. Simulations
- no forest (NFOR; reference): free-falling rocks; it is used to determine the potential energy, distance, and trajectory of rocks,
- with forest (FPRE; pre-event): rock falling under pre-event conditions, simulating the presence of the protection forest,
- with forest (FPOS; post-event): rock falling under post-event conditions, simulating the presence of biological legacies in the windthrown stand.
2.6. Protective Effect
3. Results
3.1. Field Results
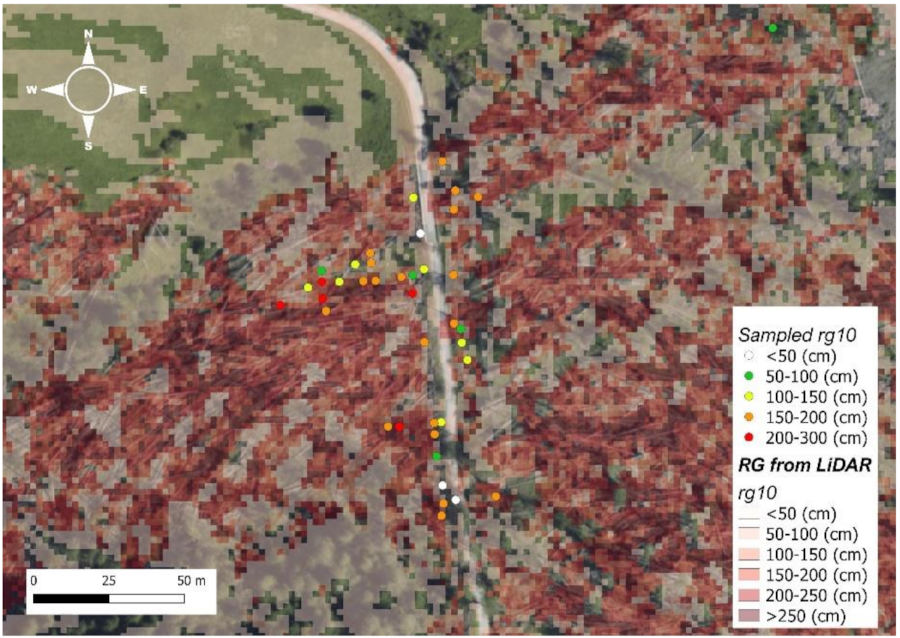
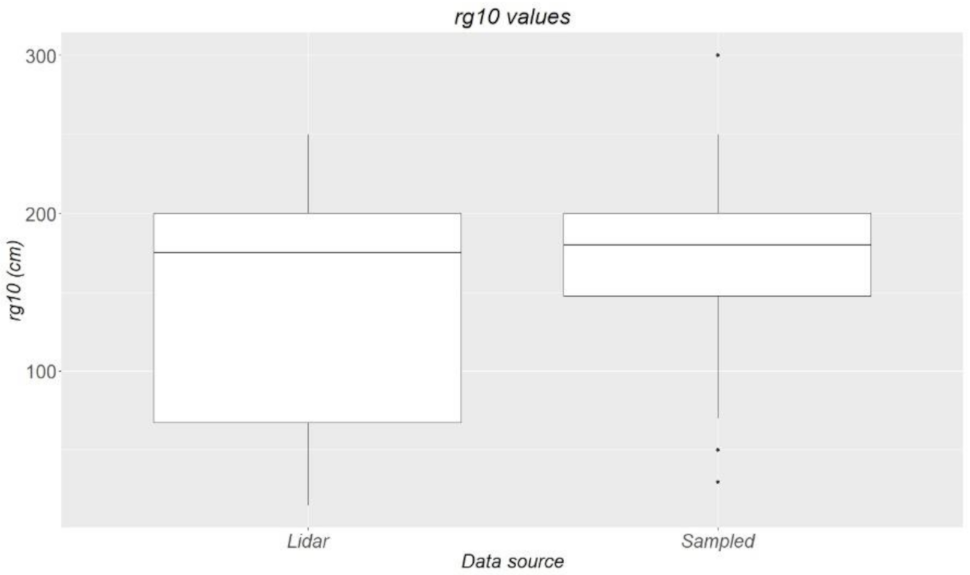
3.2. Validation of LiDAR Derived Roughness Values
3.3. Simulations Results
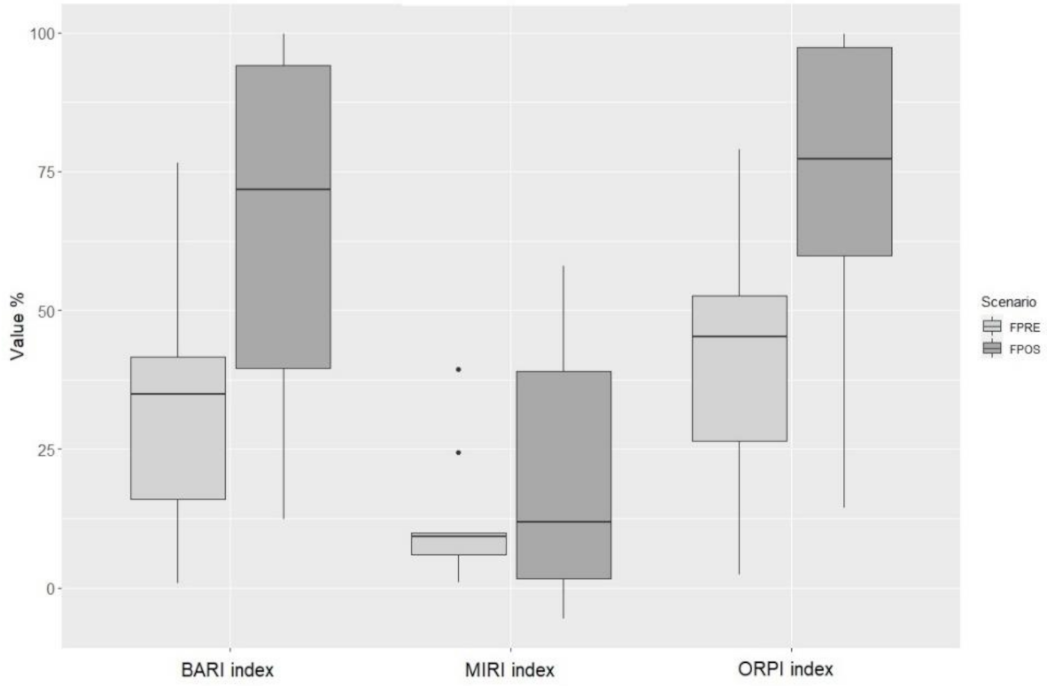
3.4. Indices Computation
4. Discussion
5. Conclusions
Author Contributions
Funding
Acknowledgments
Conflicts of Interest
References
- Motta, R.; Haudemand, J.-C. Protective Forests and Silvicultural Stability. Mt. Res. Dev. 2000, 20, 180–187. [Google Scholar] [CrossRef] [Green Version]
- Brang, P. Resistance and elasticity: Promising concepts for the management of protection forests in the European Alps. For. Ecol. Manag. 2001, 145, 107–119. [Google Scholar] [CrossRef]
- Berger, F.; Quetel, C.; Dorren, L.K.A. Forest: A natural protection mean against rockfalls, but with which efficiency? Interpraevent 2002 Pac. Rim Matsumoto Jpn. 2002, 2, 815–826. [Google Scholar]
- Briones-Bitar, J.; Carrión-Mero, P.; Montalván-Burbano, N.; Morante-Carballo, F. Rockfall research: A bibliometric analysis and future trends. Geosciences 2020, 10, 403. [Google Scholar] [CrossRef]
- Moos, C.; Fehlmann, M.; Trappmann, D.; Stoffel, M.; Dorren, L. Integrating the mitigating effect of forests into quantitative rockfall risk analysis—Two case studies in Switzerland. Int. J. Disaster Risk Reduct. 2018, 32, 55–74. [Google Scholar] [CrossRef]
- Dorren, L.K.A. A review of rockfall mechanics and modelling approaches. Prog. Phys. Geogr. Earth Environ. 2003, 27, 69–87. [Google Scholar] [CrossRef]
- Moos, C.; Thomas, M.; Pauli, B.; Bergkamp, G.; Stoffel, M.; Dorren, L. Economic valuation of ecosystem-based rockfall risk reduction considering disturbances and comparison to structural measures. Sci. Total Environ. 2019, 697, 134077. [Google Scholar] [CrossRef]
- Dupire, S.; Bourrier, F.; Monnet, J.M.; Bigot, S.; Borgniet, L.; Berger, F.; Curt, T. The protective effect of forests against rockfalls across the French Alps: Influence of forest diversity. For. Ecol. Manag. 2016, 382, 269–279. [Google Scholar] [CrossRef] [Green Version]
- Moos, C.; Khelidj, N.; Guisan, A.; Lischke, H.; Randin, C.F. A quantitative assessment of rockfall influence on forest structure in the Swiss Alps. Eur. J. For. Res. 2021, 140, 91–104. [Google Scholar] [CrossRef]
- Frey, W.; Thee, P. Avalanche protection of windthrow areas: A ten year comparison of cleared and uncleared starting zones. For. Snow Landsc. Res. 2002, 77, 89–107. [Google Scholar]
- Schönenberger, W. Windthrow research after the 1990 storm Vivian in Switzerland: Objectives, study sites, and projects. For. Snow Landsc. Res. 2002, 77, 9–16. [Google Scholar]
- Wohlgemuth, T.; Schwitter, R.; Bebi, P.; Sutter, F.; Brang, P. Post-windthrow management in protection forests of the Swiss Alps. Eur. J. For. Res. 2017, 136, 1029–1040. [Google Scholar] [CrossRef]
- Seidl, R.; Thom, D.; Kautz, M.; Martin-Benito, D.; Peltoniemi, M.; Vacchiano, G.; Wild, J.; Ascoli, D.; Petr, M.; Honkaniemi, J.; et al. Forest disturbances under climate change. Nat. Clim. Chang. 2017, 7, 395–402. [Google Scholar] [CrossRef] [Green Version]
- Beghin, R.; Lingua, E.; Garbarino, M.; Lonati, M.; Bovio, G.; Motta, R.; Marzano, R. Pinus sylvestris forest regeneration under different post-fire restoration practices in the northwestern Italian Alps. Ecol. Eng. 2010, 36, 1365–1372. [Google Scholar] [CrossRef]
- Franklin, J.F.; Lindenmayer, D.; Macmahon, J.A.; Mckee, A.; Perry, D.A.; Waide, R.; Foster, D. Threads of Continuity: Ecosystem disturbance, recovery, and the theory of biological legacies. Conserv. Pract. 2000, 1, 8–17. [Google Scholar] [CrossRef]
- Johnstone, J.F.; Allen, C.D.; Franklin, J.F.; Frelich, L.E.; Harvey, B.J.; Higuera, P.E.; Mack, M.C.; Meentemeyer, R.K.; Metz, M.R.; Perry, G.L.W.; et al. Changing disturbance regimes, ecological memory, and forest resilience. Front. Ecol. Environ. 2016, 14, 369–378. [Google Scholar] [CrossRef]
- Lindenmayer, D.B.; Westgate, M.J.; Scheele, B.C.; Foster, C.N.; Blair, D.P. Key perspectives on early successional forests subject to stand-replacing disturbances. For. Ecol. Manag. 2019, 454, 117656. [Google Scholar] [CrossRef]
- Gardiner, B.; Schuck, A.; Schelhaas, M.-J.; Orazio, C.; Blennow, K.; Nicoll, B. Living with Storm Damage to Forests. What Science Can. Tell Us 3; European Forest Institute: Joensuu, Finland, 2013; ISBN 9789525980080. [Google Scholar]
- Bebi, P.; Seidl, R.; Motta, R.; Fuhr, M.; Firm, D.; Krumm, F.; Conedera, M.; Ginzler, C.; Wohlgemuth, T.; Kulakowski, D. Changes of forest cover and disturbance regimes in the mountain forests of the Alps. For. Ecol. Manag. 2017, 388, 43–56. [Google Scholar] [CrossRef] [PubMed] [Green Version]
- Forzieri, G.; Girardello, M.; Ceccherini, G.; Spinoni, J.; Feyen, L.; Hartmann, H.; Beck, P.S.A.; Camps-Valls, G.; Chirici, G.; Mauri, A.; et al. Emergent vulnerability to climate-driven disturbances in European forests. Nat. Commun. 2018, 12, 1081. [Google Scholar] [CrossRef] [PubMed]
- Schönenberger, W.; Noack, A.; Thee, P. Effect of timber removal from windthrow slopes on the risk of snow avalanches and rockfall. For. Ecol. Manag. 2005, 213, 197–208. [Google Scholar] [CrossRef]
- Rammig, A.; Fahse, L.; Bugmann, H.; Bebi, P. Forest regeneration after disturbance: A modelling study for the Swiss Alps. For. Ecol. Manag. 2006, 222, 123–136. [Google Scholar] [CrossRef]
- Chirici, G.; Giannetti, F.; Travaglini, D.; Nocentini, S.; Francini, S.; D’Amico, G.; Calvo, E.; Fasolini, D.; Broll, M.; Maistrelli, F.; et al. Forest damage inventory after the “Vaia” storm in Italy. For. Riv. Selvic. Ecol. For. 2019, 16, 3–9. [Google Scholar] [CrossRef] [Green Version]
- Cadei, A.; Mologni, O.; Röser, D.; Cavalli, R.; Grigolato, S. Forwarder productivity in salvage logging operations in difficult terrain. Forests 2020, 11, 341. [Google Scholar] [CrossRef] [Green Version]
- Pellegrini, G.; Martini, L.; Cavalli, M.; Rainato, R.; Cazorzi, A.; Picco, L. The morphological response of the Tegnas alpine catchment (Northeast Italy) to a Large Infrequent Disturbance. Sci. Total Environ. 2021, 770, 145209. [Google Scholar] [CrossRef]
- Dorren, L.K. A Rockyfor3D (v5.2) revealed—Transparent description of the complete 3D rockfall model. ecorisQ Pap. 2016, 33. [Google Scholar]
- Dorren, L.K.A.; Berger, F.; Putters, U.S. Real-size experiments and 3-D simulation of rockfall on forested and non-forested slopes. Nat. Hazards Earth Syst. Sci. 2006, 6, 145–153. [Google Scholar] [CrossRef] [Green Version]
- Hammer, O.; Harper, D.A.T.; Ryan, P.D. PAST–Palaeontological statistics, ver. 1.89. Palaeontol. Electron. 2009, 4, 1–9. [Google Scholar]
- Dupire, S.; Bourrier, F.; Monnet, J.M.; Bigot, S.; Borgniet, L.; Berger, F.; Curt, T. Novel quantitative indicators to characterize the protective effect of mountain forests against rockfall. Ecol. Indic. 2016, 67, 98–107. [Google Scholar] [CrossRef] [Green Version]
- Scheidl, C.; Heiser, M.; Vospernik, S.; Lauss, E.; Perzl, F.; Kofler, A.; Kleemayr, K.; Bettella, F.; Lingua, E.; Garbarino, M.; et al. Assessing the protective role of alpine forests against rockfall at regional scale. Eur. J. For. Res. 2020, 139, 969–980. [Google Scholar] [CrossRef]
- Moos, C.; Dorren, L.; Stoffel, M. Quantifying the effect of forests on frequency and intensity of rockfalls. Nat. Hazards Earth Syst. Sci. 2017, 17, 291–304. [Google Scholar] [CrossRef] [Green Version]
- Bianchi, E.; Accastello, C.; Trappmann, D.; Blanc, S.; Brun, F. The Economic Evaluation of Forest Protection Service Against Rockfall: A Review of Experiences and Approaches. Ecol. Econ. 2018, 154, 409–418. [Google Scholar] [CrossRef]
- Irauschek, F.; Rammer, W.; Lexer, M.J. Evaluating multifunctionality and adaptive capacity of mountain forest management alternatives under climate change in the Eastern Alps. Eur. J. For. Res. 2017, 136, 1051–1069. [Google Scholar] [CrossRef] [Green Version]
- Marchi, N.; Pirotti, F.; Lingua, E. Airborne and terrestrial laser scanning data for the assessment of standing and lying deadwood: Current situation and new perspectives. Remote Sens. 2018, 10, 1356. [Google Scholar] [CrossRef] [Green Version]
- Fuhr, M.; Bourrier, F.; Cordonnier, T. Protection against rockfall along a maturity gradient in mountain forests. For. Ecol. Manag. 2015, 354, 224–231. [Google Scholar] [CrossRef]
- Olmedo, I.; Bourrier, F.; Bertrand, D.; Berger, F.; Limam, A. Discrete element model of the dynamic response of fresh wood stems to impact. Eng. Struct. 2016, 120, 13–22. [Google Scholar] [CrossRef]
- Bebi, P.; Bast, A.; Ginzler, C.; Rickli, C.; Schöngrundner, K.; Graf, F. Forest dynamics and shallow landslides: A large-scale gis-analysis. Schweiz. Z. Forstwes. 2019, 170, 318–325. [Google Scholar] [CrossRef]
- Petrillo, M.; Cherubini, P.; Fravolini, G.; Marchetti, M.; Ascher-Jenull, J.; Schärer, M.; Synal, H.A.; Bertoldi, D.; Camin, F.; Larcher, R.; et al. Time since death and decay rate constants of Norway spruce and European larch deadwood in subalpine forests determined using dendrochronology and radiocarbon dating. Biogeosciences 2016, 13, 1537–1552. [Google Scholar] [CrossRef] [Green Version]
- Bebi, P.; Putallaz, J.M.; Fankhauser, M.; Schmid, U.; Schwitter, R.; Gerber, W. Die Schutzfunktion in Windwurfflächen. Schweiz. Z. Forstwes. 2015, 166, 168–176. [Google Scholar] [CrossRef]
- Hagge, J.; Bässler, C.; Gruppe, A.; Hoppe, B.; Kellner, H.; Krah, F.S.; Müller, J.; Seibold, S.; Stengel, E.; Thorn, S. Bark coverage shifts assembly processes of microbial decomposer communities in dead wood. Proc. R. Soc. B Biol. Sci. 2019, 286, 20191744. [Google Scholar] [CrossRef] [Green Version]
- Maringer, J.; Ascoli, D.; Dorren, L.; Bebi, P.; Conedera, M. Temporal trends in the protective capacity of burnt beech forests (Fagus sylvatica L.) against rockfall. Eur. J. For. Res. 2016, 135, 657–673. [Google Scholar] [CrossRef] [Green Version]
- Marzano, R.; Garbarino, M.; Marcolin, E.; Pividori, M.; Lingua, E. Deadwood anisotropic facilitation on seedling establishment after a stand-replacing wildfire in Aosta Valley (NW Italy). Ecol. Eng. 2013, 51, 117–122. [Google Scholar] [CrossRef] [Green Version]
- Wohlgemuth, T.; Kull, P.; Wüthrich, H. Disturbance of microsites and early tree regeneration after windthrow in Swiss mountain forests due to the winter storm Vivian 1990. For. Snow Landsc. Res. 2002, 77, 17–47. [Google Scholar]
- Fischer, A.; Lindner, M.; Abs, C.; Lasch, P. Vegetation dynamics in Central European forest ecosystems (near-natural as well as managed) after storm events. Folia Geobot. 2002, 37, 17–32. [Google Scholar] [CrossRef]
- Fischer, A.; Fischer, H.S. Individual-based analysis of tree establishment and forest stand development within 25 years after wind throw. Eur. J. For. Res. 2012, 131, 493–501. [Google Scholar] [CrossRef]
- Taeroe, A.; de Koning, J.H.C.; Löf, M.; Tolvanen, A.; Heiðarsson, L.; Raulund-Rasmussen, K. Recovery of temperate and boreal forests after windthrow and the impacts of salvage logging. A quantitative review. For. Ecol. Manag. 2019, 446, 304–316. [Google Scholar] [CrossRef]
- Leverkus, A.B.; Buma, B.; Wagenbrenner, J.; Burton, P.J.; Lingua, E.; Marzano, R.; Thorn, S. Tamm review: Does salvage logging mitigate subsequent forest disturbances? For. Ecol. Manag. 2021, 481, 118721. [Google Scholar] [CrossRef]


| Checkpoint | n (-) | E_95 (kJ) | Ph_95 (m) | V_95 (m/s) |
|---|---|---|---|---|
| 1 | 776,172 | 1080 | 1.3 | 20.3 |
| 2 | 586,053 | 953 | 2.6 | 20.0 |
| 3 | 2,796,600 | 1971 | 2.7 | 25.8 |
| 4 | 3,180,107 | 1843 | 4.0 | 26.1 |
| 5 | 192,933 | 1807 | 1.8 | 25.6 |
| 6 | 530,231 | 1984 | 1.9 | 26.3 |
| 7 | 1,216,722 | 2126 | 3.1 | 26.7 |
| 8 | 390,563 | 1969 | 2.8 | 25.3 |
| 9 | 606,256 | 1722 | 2.2 | 24.0 |
| Checkpoint | n (-) | E_95 (kJ) | Ph_95 (m) | V_95 (m/s) |
|---|---|---|---|---|
| 1 | 478,121 | 816 | 0.9 | 17.1 |
| 2 | 490,779 | 578 | 1.3 | 15.7 |
| 3 | 1,523,292 | 1773 | 2.4 | 24.1 |
| 4 | 2,671,715 | 1733 | 4.1 | 25.3 |
| 5 | 191,329 | 1782 | 1.8 | 25.4 |
| 6 | 519,953 | 1965 | 1.9 | 26.2 |
| 7 | 792,383 | 1927 | 2.8 | 25.3 |
| 8 | 228,081 | 1787 | 2.5 | 23.9 |
| 9 | 141,892 | 1600 | 2.0 | 22.8 |
| Checkpoint | n (-) | E_95 (kJ) | Ph_95 (m) | V_95 (m/s) | |
|---|---|---|---|---|---|
| 1 | 291,697 | 658 | 0.8 | 14.7 | |
| 2 | 430,738 | 401 | 1.1 | 13.1 | |
| 3 | 228,487 | 1140 | 1.5 | 20.0 | |
| 4 | 901,333 | 1626 | 4.5 | 24.2 | |
| 5 | 116,717 | 1537 | 1.5 | 23.9 | |
| 6 | 464,749 | 1951 | 1.8 | 26.0 | |
| 7 | 6492 | 2098 | 2.6 | 26.2 | |
| 8 | 22,996 | 1839 | 2.4 | 24.1 | |
| 9 | 1042 | 1819 | 1.9 | 24.1 | |
| Checkpoint | Scenario | BARI (-) | MIRI (-) | ORPI (-) | Classification |
|---|---|---|---|---|---|
| 1 | FPRE | 38.4 | 24.4 | 52.6 | Medium PE |
| FPOS | 62.4 | 39.1 | 76.0 | Medium PE | |
| 2 | FPRE | 16.3 | 39.3 | 41.1 | Low PE |
| FPOS | 26.5 | 57.9 | 59.8 | Medium PE | |
| 3 | FPRE | 45.5 | 10.0 | 54.4 | Medium PE |
| FPOS | 91.8 | 42.2 | 97.4 | High PE | |
| 4 | FPRE | 16 | 6.0 | 26.4 | Low PE |
| FPOS | 71.7 | 11.8 | 77.2 | Medium PE | |
| 5 | FPRE | 0.8 | 1.4 | 2.4 | Low PE |
| FPOS | 39.5 | 14.9 | 58.4 | Medium PE | |
| 6 | FPRE | 1.9 | 1.0 | 3.1 | Low PE |
| FPOS | 12.3 | 1.7 | 14.5 | Low PE | |
| 7 | FPRE | 34.9 | 9.4 | 45.3 | Low PE |
| FPOS | 99.5 | 1.3 | 99.6 | High PE | |
| 8 | FPRE | 41.6 | 9.2 | 51.1 | Medium PE |
| FPOS | 94.1 | 6.6 | 94.9 | High PE | |
| 9 | FPRE | 76.6 | 7.1 | 78.9 | Medium PE |
| FPOS | 99.8 | −5.6 | 99.8 | High PE |
Publisher’s Note: MDPI stays neutral with regard to jurisdictional claims in published maps and institutional affiliations. |
© 2021 by the authors. Licensee MDPI, Basel, Switzerland. This article is an open access article distributed under the terms and conditions of the Creative Commons Attribution (CC BY) license (https://creativecommons.org/licenses/by/4.0/).
Share and Cite
Costa, M.; Marchi, N.; Bettella, F.; Bolzon, P.; Berger, F.; Lingua, E. Biological Legacies and Rockfall: The Protective Effect of a Windthrown Forest. Forests 2021, 12, 1141. https://doi.org/10.3390/f12091141
Costa M, Marchi N, Bettella F, Bolzon P, Berger F, Lingua E. Biological Legacies and Rockfall: The Protective Effect of a Windthrown Forest. Forests. 2021; 12(9):1141. https://doi.org/10.3390/f12091141
Chicago/Turabian StyleCosta, Maximiliano, Niccolò Marchi, Francesco Bettella, Paola Bolzon, Frédéric Berger, and Emanuele Lingua. 2021. "Biological Legacies and Rockfall: The Protective Effect of a Windthrown Forest" Forests 12, no. 9: 1141. https://doi.org/10.3390/f12091141