Article

Vegetation Type and Soil Moisture Drive Variations in Leaf Litter Decomposition Following Secondary Forest Succession

1
State Key Laboratory of Soil Erosion and Dryland Farming on the Loess Plateau, Institute of Soil and Water Conservation, Chinese Academy of Sciences and Ministry of Water Resources, Yangling 712100, China
2
Institute of Soil and Water Conservation, Northwest A&F University, Yangling 712100, China
*
Author to whom correspondence should be addressed.
Forests 2021, 12(9), 1195; https://doi.org/10.3390/f12091195
Submission received: 31 July 2021 / Revised: 24 August 2021 / Accepted: 31 August 2021 / Published: 3 September 2021
(This article belongs to the Special Issue The Effect of Vegetation Restoration on Forest Soil Nutrients)

Abstract

:
Soil moisture was an important factor affecting litter decomposition. However, less attention has been given to the complete succession ecosystem after farmland abandonment. To better understand the effect of moisture on leaf litter decomposition after farmland abandonment, in this study, we used three water gradients (10%, 25% and 50%) of field moisture capacity for succession vegetation. Furthermore, we used the typical species leaf litter decomposition of four succession stages—grassland (GL), shrubland (SL), pioneer forest (PF), and climax forest (CF) from the Loess Plateau of China. The results showed that leaves decomposition rate exhibited an increasing pattern with increasing moisture contents. The decomposition trend was shown as GL > SL > PF > CF. During the decomposition process, the leaf carbon concentration (LC) and leaf nitrogen concentration (LN) changed, but non-significantly. The effects of LC, LN, and LC: LN on leaf decomposition varied with vegetation type. Soil properties such as NH4+, NO3, dissolved organic nitrogen (DON), and leaf quality parameters such as leaf cellulose, lignin, lignin: LN, and lignin: LC played an important role in driving leaf litter decomposition. Overall, the results provide evidence that litter decomposition in secondary forest succession system was linked to leaf and soil nutrient dynamics, and was limited by soil moisture.

1. Introduction

Litter decomposition is one of the most important ecological processes that controls the conversion of carbon and nutrients in terrestrial ecosystems [1,2]. It is also an important link between material circulation and energy flow [3,4]. Soil moisture is an important environmental factor that regulates the decomposition of litter in terrestrial ecosystems [5]. Therefore, understanding how litter decomposition responds to changes in water will help to better understand ecosystem carbon and nutrient cycles.
In arid and semi-arid ecosystems, litter decomposition rate is largely limited by the availability of soil moisture [6]. Changes in soil moisture availability will affect soil microorganisms abundance and community [7], which will have a considerable impact on litter decomposition rate. Studies have found that litter decomposition rate is positively correlated with soil moisture [6], and the influence of soil moisture changes on litter decomposition rate varies with litter quality [8]. However, the effect of soil moisture on litter decomposition in different vegetation is still unclear.
Litter decomposition, can increase soil fertility, mainly by transporting organic matter to the soil [9]. Many factors affect litter decomposition, such as litter quality (e.g., N, P, lignin, cellulose, C: N ratio, N: P ratio, lignin: N ratio) [10], environmental variables (e.g., soil moisture, soil temperature, vegetation, soil fertility, dominant tree species) [10,11], and decomposers [12,13,14]. However, Castro, Fortunel and Freitas [13] found no significant correlation between litter lignin concentration, C: N ratio, lignin: N ratio and litter decomposition rate. Wang, et al. [15] found that the initial litter C and P concentrations were significantly correlated with litter decomposition rates. In short, under different environmental conditions, the indicators that can predict the decomposition of litter are uncertain.
On the Loess Plateau, some studies have been carried out on the effects of litter decomposition after returning farmland to forest and grassland [16]. More litter is returned to the soil following the ongoing practice of returning farmland to forest and grassland [16]. Most studies have focused on litter increasing soil water holding capacity [17], improvements in soil quality [2,18], contributions to soil respiration [19], soil microbial composition [20,21], and carbon sequestration [16,22]. However, the dynamics of litter decomposition following vegetation restoration on the Loess Plateau are not clear, especially in the long-term process of forest succession. Litter decomposition is a complex process that is related to soil nutrient dynamics and vegetation restoration age, and it is mainly restricted by matrix quality and environmental conditions [23,24]. For example, soil moisture drives the activities of soil microorganisms, which can promote the decomposition of litter and accelerate the release of nutrients [24]; additionally, nutrient release from litter could provide most of the nutritional requirements for plant growth [25]. Although these studies have provided valuable recommendations for understanding the effect of substrate quality on litter decomposition, many studies have focused only on single vegetation species or on two species of vegetation [20,26,27,28]. There are few reports on different kinds of plant litter decomposition of during the complete succession of the Loess Plateau. Therefore, it is necessary to reveal the dynamics of litter decomposition under the influence of different water contents during long-term forest succession.
This study focused on the typical vegetation of four succession stages under three water gradients after farmland abandonment in the Ziwuling area; specifically, the study assessed the effect of grassland (GL), shrubland (SL), pioneer forest (PF), and climax forest (CF) on leaf decomposition and nutrient dynamics, evaluate the effect of moisture on litter decomposition, and explore the factors that affecting litter decomposition. We hypothesize that (1) the leaf decomposition rate decreases with the succession of vegetation after the abandonment of farmland and (2) leaf decomposition rate increases with the increasing of soil moisture.

2. Materials and Methods

2.1. Study Site

The study was conducted at the Lianjiabian Forest Farm in the Ziwuling forest region of Gansu Province, China (35°03′–36°37′ N, 108°10′–109°18′ E, 1100–1687 m.a.s.l). The Ziwuling forest area is a well-preserved natural secondary forest area on the Loess Plateau and an important ecological forest in the central part of the Loess Plateau. The zone has a warm temperate continental monsoon climate and a semi-arid mid-latitude climate, with an annual average temperature of 7.4–9.3 °C, an average temperature of −5.9–7.4 °C in January, an average temperature of 20.7–23.1 °C in July, an extreme maximum temperature of 35.7 °C and an extreme minimum temperature of −22.7 °C; additionally, the annual sunshine duration is 2159.4 h. The annual precipitation is 500–600 mm, and it is mostly concentrated in the 3 months of July, August and September. Loessial soil is the main soil type, developed from the primary or secondary loess parent materials, which are evenly distributed at thicknesses of 50–130 m above red earth consisting of calcareous cinnamon soil. After the abandonment of farmland, grassland (GL), shrubland (SL), pioneer forest (PF) and climax forest (CF) developed one after another, forming a complete succession chronosequence. Among them, the plant communities at the GL stage include Bothriochloa ischaemum (L.) Keng, Carex lanceolata Boott, Artemisia gmelinii Web. ex Stechm., Artemisia sieversiana Ehrhart ex Willd., Artemisia lavandulaefolia DC., Setaria viridis (L.) Beauv.; Hippophae rhamnoides L. and C. lanceolata at the SL stage; PF stage has C. lanceolata, Artemisia campestris Linn. Sp. Pl., Ulmus macrocarpa Hance, Acer ginnala Maxim., Armeniaca sibirica (L.) Lam, Betula platyphylla Suk; And the CF stage mainly includes C. lanceolata, A. campestris, Populus davidiana Dode, B. platyphylla, Pinus tabuliformis Carr.

2.2. Experimental Design and Sampling

A field survey was undertaken in August 2017, and soil sampling and leaf litter collection were performed at the same time. The sampling areas of each succession stage were determined according to their sizes. There were five 20 m × 20 m plots chosen in PF and CF communities, five 5 m × 5 m plots in SL communities, and five 2 m × 2 m plots in GL communities. The plots were no more than 5 km apart and the largest relative elevation difference was less than 120 m. To minimize the effects of site conditions on experimental results, all selected communities had a similar slope aspect, slope gradient, soil type and land use history.
In each plot, ground litter and fine roots were removed and then soils (0–20 cm) were sampled at the five points and mixed to form one soil sample. Soil samples were taken at five points lying at the four corners and center of the soil sampling sites. All soil samples were sieved through a 5 mm screen and air-dried. In addition, before sampling soil, five 1 m × 1 m quadrats were set in the five soil sampling points of GL, SL, PF and CF sites. We collected all ground litter in quadrats to determine its physico-chemical properties.

2.3. Indoor Controlled Experiment

According to field leaf litter biomasses at every stage of vegetation succession, an indoor dark experiment with a constant temperature (25 °C) was used to simulate leaf litter decomposition. The added amount of litter was proportionally converted according to the area of the basin mouth and the area of the sample land per unit area in the field, and the added amount was consistent with the amount of litter in the same soil area in the field. The dry weight of soil in the basin was set at 300 g, and the maximum field moisture capacity of the four cultivated coverings was 157.6 g for GL, 181.6 g for SL, 192.4 g for PF and 190.6 g for CF, respectively. The water holding capacity was set to three water gradients in each vegetation stage: 10% (lower), 25% (medium) and 50% (higher) of field moisture capacity. Eighteen repeated treatments were set for each water gradient, and samples were taken six times. Three pots were assessed for each measurement. After leaf litter was added, water was replenished once every two days according to the weighing method. Samples were taken at the 1st, 3rd, 6th, 9th, 12th and 15th months after the addition of leaf litters. During sampling, the leaf litters were removed from the pot, and the soil on the surface was gently swept, dried and weighed to determine the related components of the leaves and soil.

2.4. Litter and Soil Property Assay

Litter carbon (LC) and nitrogen (LN) concentrations were determined by K2Cr2O7 oxidation and the Kjeldahl method, respectively [29]. The contents of lignin and cellulose were determined by the acid washing fiber method [30]. Soil organic carbon (SOC) and total nitrogen (TN) concentrations were determined by the same method as litter. Ammonium (NH4+) and nitrate (NO3) concentrations were assayed using Nessler’s reagent and the phenol disulfonic acid colorimetric method, respectively [31]. The chloroform fumigation extraction protocol with K2SO4 extraction was employed to determine the soil microbial biomass carbon (MBC) and nitrogen (MBN) using 10 g of oven-dried equivalent field-moist soil [29]. Soil dissolved organic carbon (DOC) and nitrogen (DON) were extracted with K2SO4 [32]. A PHS-3G digital pH meter was used to determine the pH of the soil (with a water to soil ratio of 5:1).

2.5. Data Analysis

The mass remaining (MR) was calculated as follows [33]:
M R = M t M 0 × 100 %
where ‘Mt’ is the mass of a leaf at time t (g); and ‘M0’ is the initial dry mass of a leaf (g).
The leaf mass loss rate was calculated as follows [33]:
L t = M 0 M t M 0 × 100 %
where ‘Lt’ is the mass loss rate of a leaf at time t; ‘M0’ is the initial weight of a leaf; and ‘Mt’ is the mass residual amount at time t.
Statistical analysis was carried out using IBM SPSS statistics 24.0 software (IBM Corp., Armonk, NY, USA). After the homogeneity and normal distribution tests were passed, the difference in mass loss of leaves in different species at different decomposition times was tested by two-way analysis of variance (p < 0.05). Redundancy analysis (RDA) was drawn using Canoco 5.0 (Microcomputer Power, Ithaca, NY, USA), and the line chart was plotted using SigmaPlot 12.0 (Systat Software Inc., San Jose, CA, USA).

3. Results

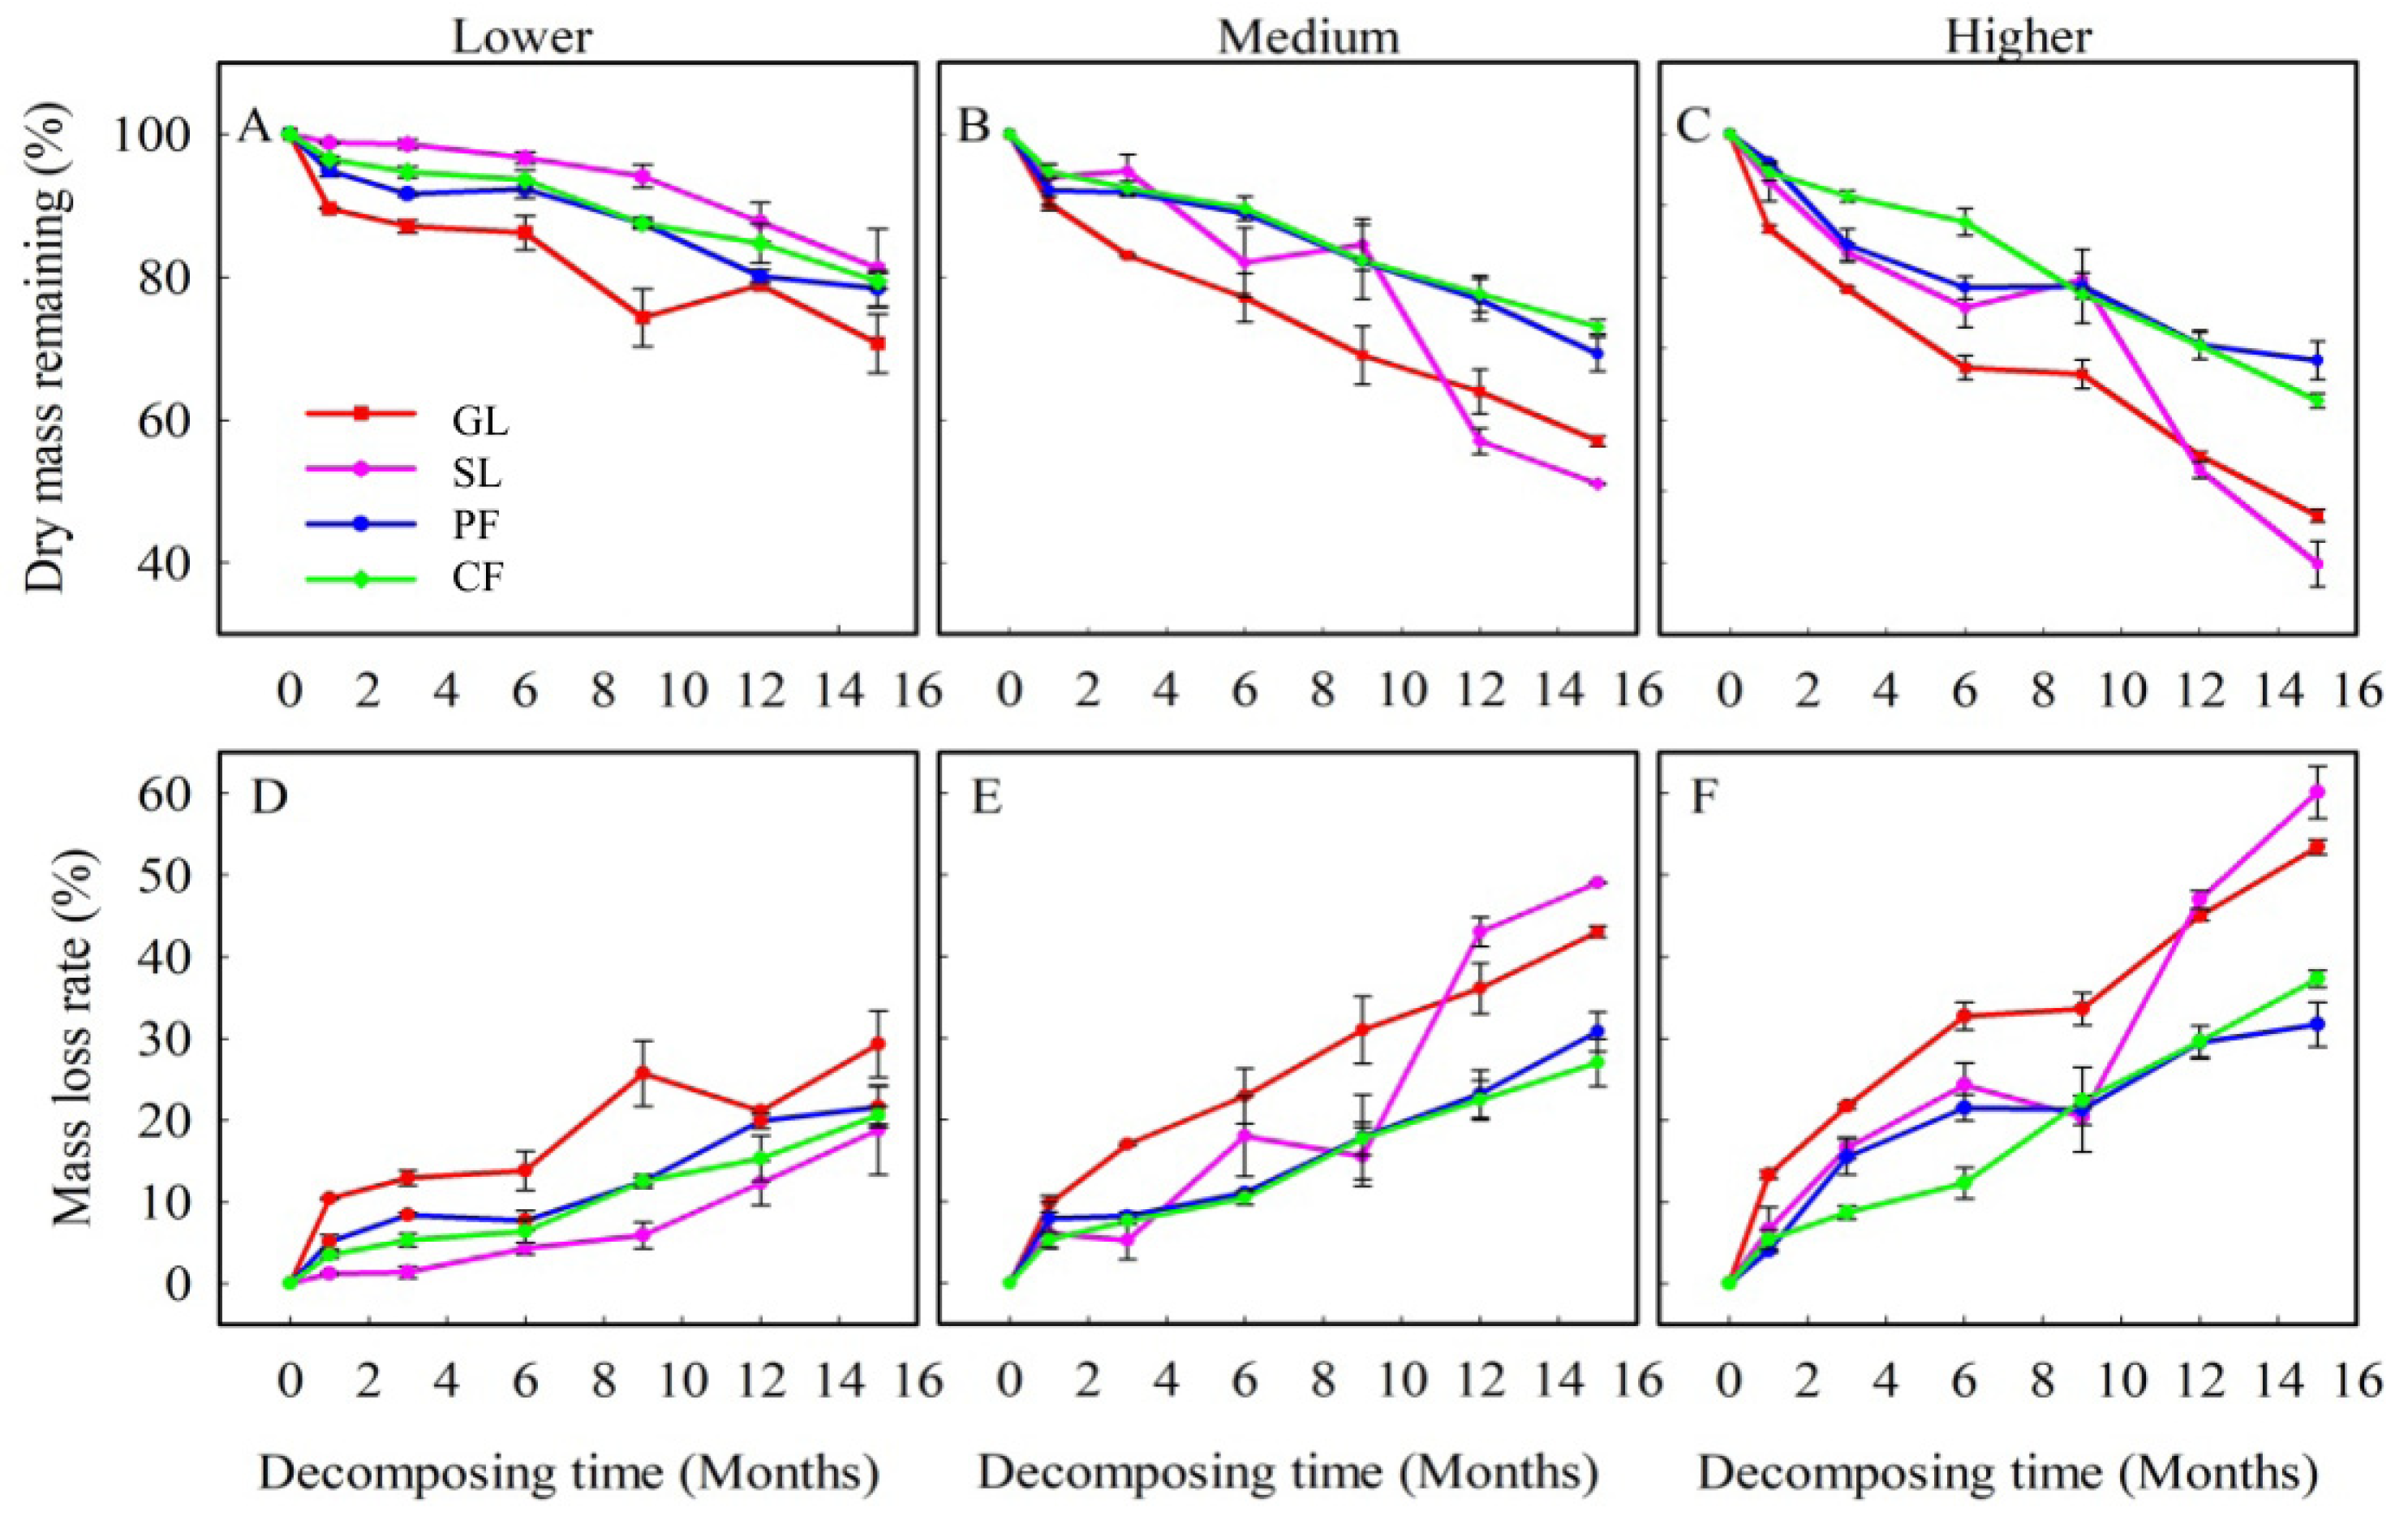
3.1. Dynamics of Leaf Litter Biomass Loss and Leaf Litter Decomposition Rate

The mass residual rate of litters in these four recovery stages of GL, SL, PF and CF all showed decreasing trends (Figure 1A–C). The soil water content determined the speed and the slow decomposition rate (Figure 1A–C). The residual rate changed slowly with time under the lower water conditions, while it changed rapidly under the higher water conditions (Figure 1A–C). Regardless of the water content, the lowest dry mass remaining was in the GL in the four recovery stages (Figure 1A–C).
Regardless of the water content, litters decomposition rate in the four recovery stages showed an increasing trend with time. However, the decomposition rate changes with soil water levels were as follows: higher > medium > lower. The fastest decomposition rates were all in the GL (Figure 1D–F). With the increase of water, litters decomposition rate was increasingly manifested as follows: GL > SL > PF > CF (Figure 1D–F).

3.2. Dynamics of Leaf Litter Quality

The LC changed regularly in the lower water stage, and the SL and CF showed an increasing trend, while the GL and PF showed an increasing trend and then a decreasing trend (Figure 2). However, in the medium water and higher water, except for the steady change in PF, the LC showed irregular changes and that of the SL had the largest change range (Figure 2A–C). The overall variation trend of LN was stable during decomposition (Figure 2D–F). The LC: LN of GL was the highest among the four stages, followed by that of CF. The LC: LN of SL and PF changed steadily and had similar ratios (Figure 2G–I). Overall, the cellulose content decreased (Figure 2J–L; Table 1), and the lignin first increased and then stabilized (Figure 2M–O; Table 1). The cellulose content in grassland was higher, and the lignin content was the lowest (Figure 2).

3.3. Effects of Factors on Leaf Litter Decomposition

Two-way ANOVA showed that vegetation type and soil moisture had significant effects on LC, LN, cellulose: LN, and lignin: LN (p < 0.001). However, the combination of the type of vegetation and soil water content had a significant effect on only LC (Table 2, p < 0.001). From the RDA results, the interpretation rate of GL and PF was higher in comparison, and all four vegetation succession stages are positively correlated with lignin and lignin: LC under the influences of different soil moisture (Figure 3, p < 0.01).

4. Discussion

4.1. Interactions of Vegetation Type and Soil Moisture on Leaf Litter Quality

Soil moisture could regulate litters quality loss [34]. In this study, the LC concentration decreased slightly with increasing soil water content (Figure 2A–C), and the most obvious reduction was in the stage of SL. Among them, in a water-deficient environment, and litter decomposes slowly [35,36]. With the increase in water content, insoluble substances will decompose accordingly, which will result in a higher litter decomposition rate, leading to the accelerated decomposition of LC and the decrease in LC concentration [36,37,38].
The vegetation community structure and composition changed significantly during the succession process [39], and changes in litter properties showed diverse patterns [9]. For example, although our results showed that the LC concentrations decreased with decomposition, the LN concentrations of GL, SL, PF, and CF tended to be stable during decomposition, and the concentrations of different recovery stages were as follows: SL > PF > CF > GL (Figure 2D–F). The difference between them did not change with the change in soil water content, which was contrary to the results of Montané, et al. [40] and Zhang, et al. [41]. The leaf litter of SL usually contained a high N concentration (Figure 2D–F), which is a nutrient resource that is easily accessible by microorganisms [42] and litter decomposition rate may be faster than other vegetation types. It shows that litter nutrient content may be an important factor in regulating decomposition [43]. Under all treatment conditions, GL litter decomposed faster than the litter of forest restoration stages (Figure 1), which may be because secondary compounds (such as lignin) are less abundant in the litter of GL [44]. Compared to other recovery stages, the GL had the highest LC: LN (Figure 2G–I) and the fastest decomposition, which was consistent with the results of other studies; that is, the unstable C source in the litter may accelerate quality loss [45]. SL had a higher N concentration and a lower LC: LN ratio; thus, the decomposition rate was slower (Figure 1D–F and Figure 2G–I). In addition, the results indicated that cellulose and lignin material affected litters decomposition through quick leaching from litter as the soil water content increased (Figure 2M–O) [46]. This may be due to a corresponding increase in microbial decomposition activity as soil moisture increases, promoting the uptake and conversion of nutrients from litter [46,47].

4.2. Interactions of Vegetation Type and Soil Moisture on Leaf Litter Decomposition

The early stages of litter decomposition were primarily rapid physical leaching processes [48], in which water soluble components and a small amount of unstable organic components were degraded [49,50]. In the later stages, the organic components (lignin and cellulose) were degraded [51]. The increase in soil moisture promoted the decomposition of litter (Figure 1D–F). Moreover, with the increase in soil moisture, the litter in early succession was faster than the litter in later vegetation (Figure 1) [52,53]. With the increase in soil moisture, the litter decomposition rate was increasingly manifested as follows: GL > SL > PF > CF (Figure 1D–F). This was consistent with the law of succession of vegetation. The higher the succession stage of vegetation, the more difficult litters are to decompose [38,54]. However, the mass loss of the two types of PF and CF litter were not affected by the soil moisture, indicating that the vegetation restoration stage itself may be the main controlling factor of decomposition (Table 2), and the different vegetation restoration stages and the related litter characteristics were significantly related [54].
Litters with lower LC: LN ratios decompose faster than litters with higher LC: LN ratios [24,55]. In this study, the LN of the SL litter was almost twice that of the GL and CF litter; however, the litter decomposition rate of SL was the lowest in the lower soil moisture treatment, and the rate rapidly increased in the late stage of the medium soil moisture and higher soil moisture treatments. This result may be related to the fact that SL itself is a nitrogen-fixing plant with high nitrogen-related properties [56], and the significant difference in the litter decomposition rates between different stages can be attributed to differences in litter quality [42,43]. Therefore, the variation in litter decomposition and its influencing factors during vegetation development was diverse and complex [11]. The differences between different vegetation may be due to the responsiveness and interaction with biotic or abiotic factors caused by vegetation succession [38].

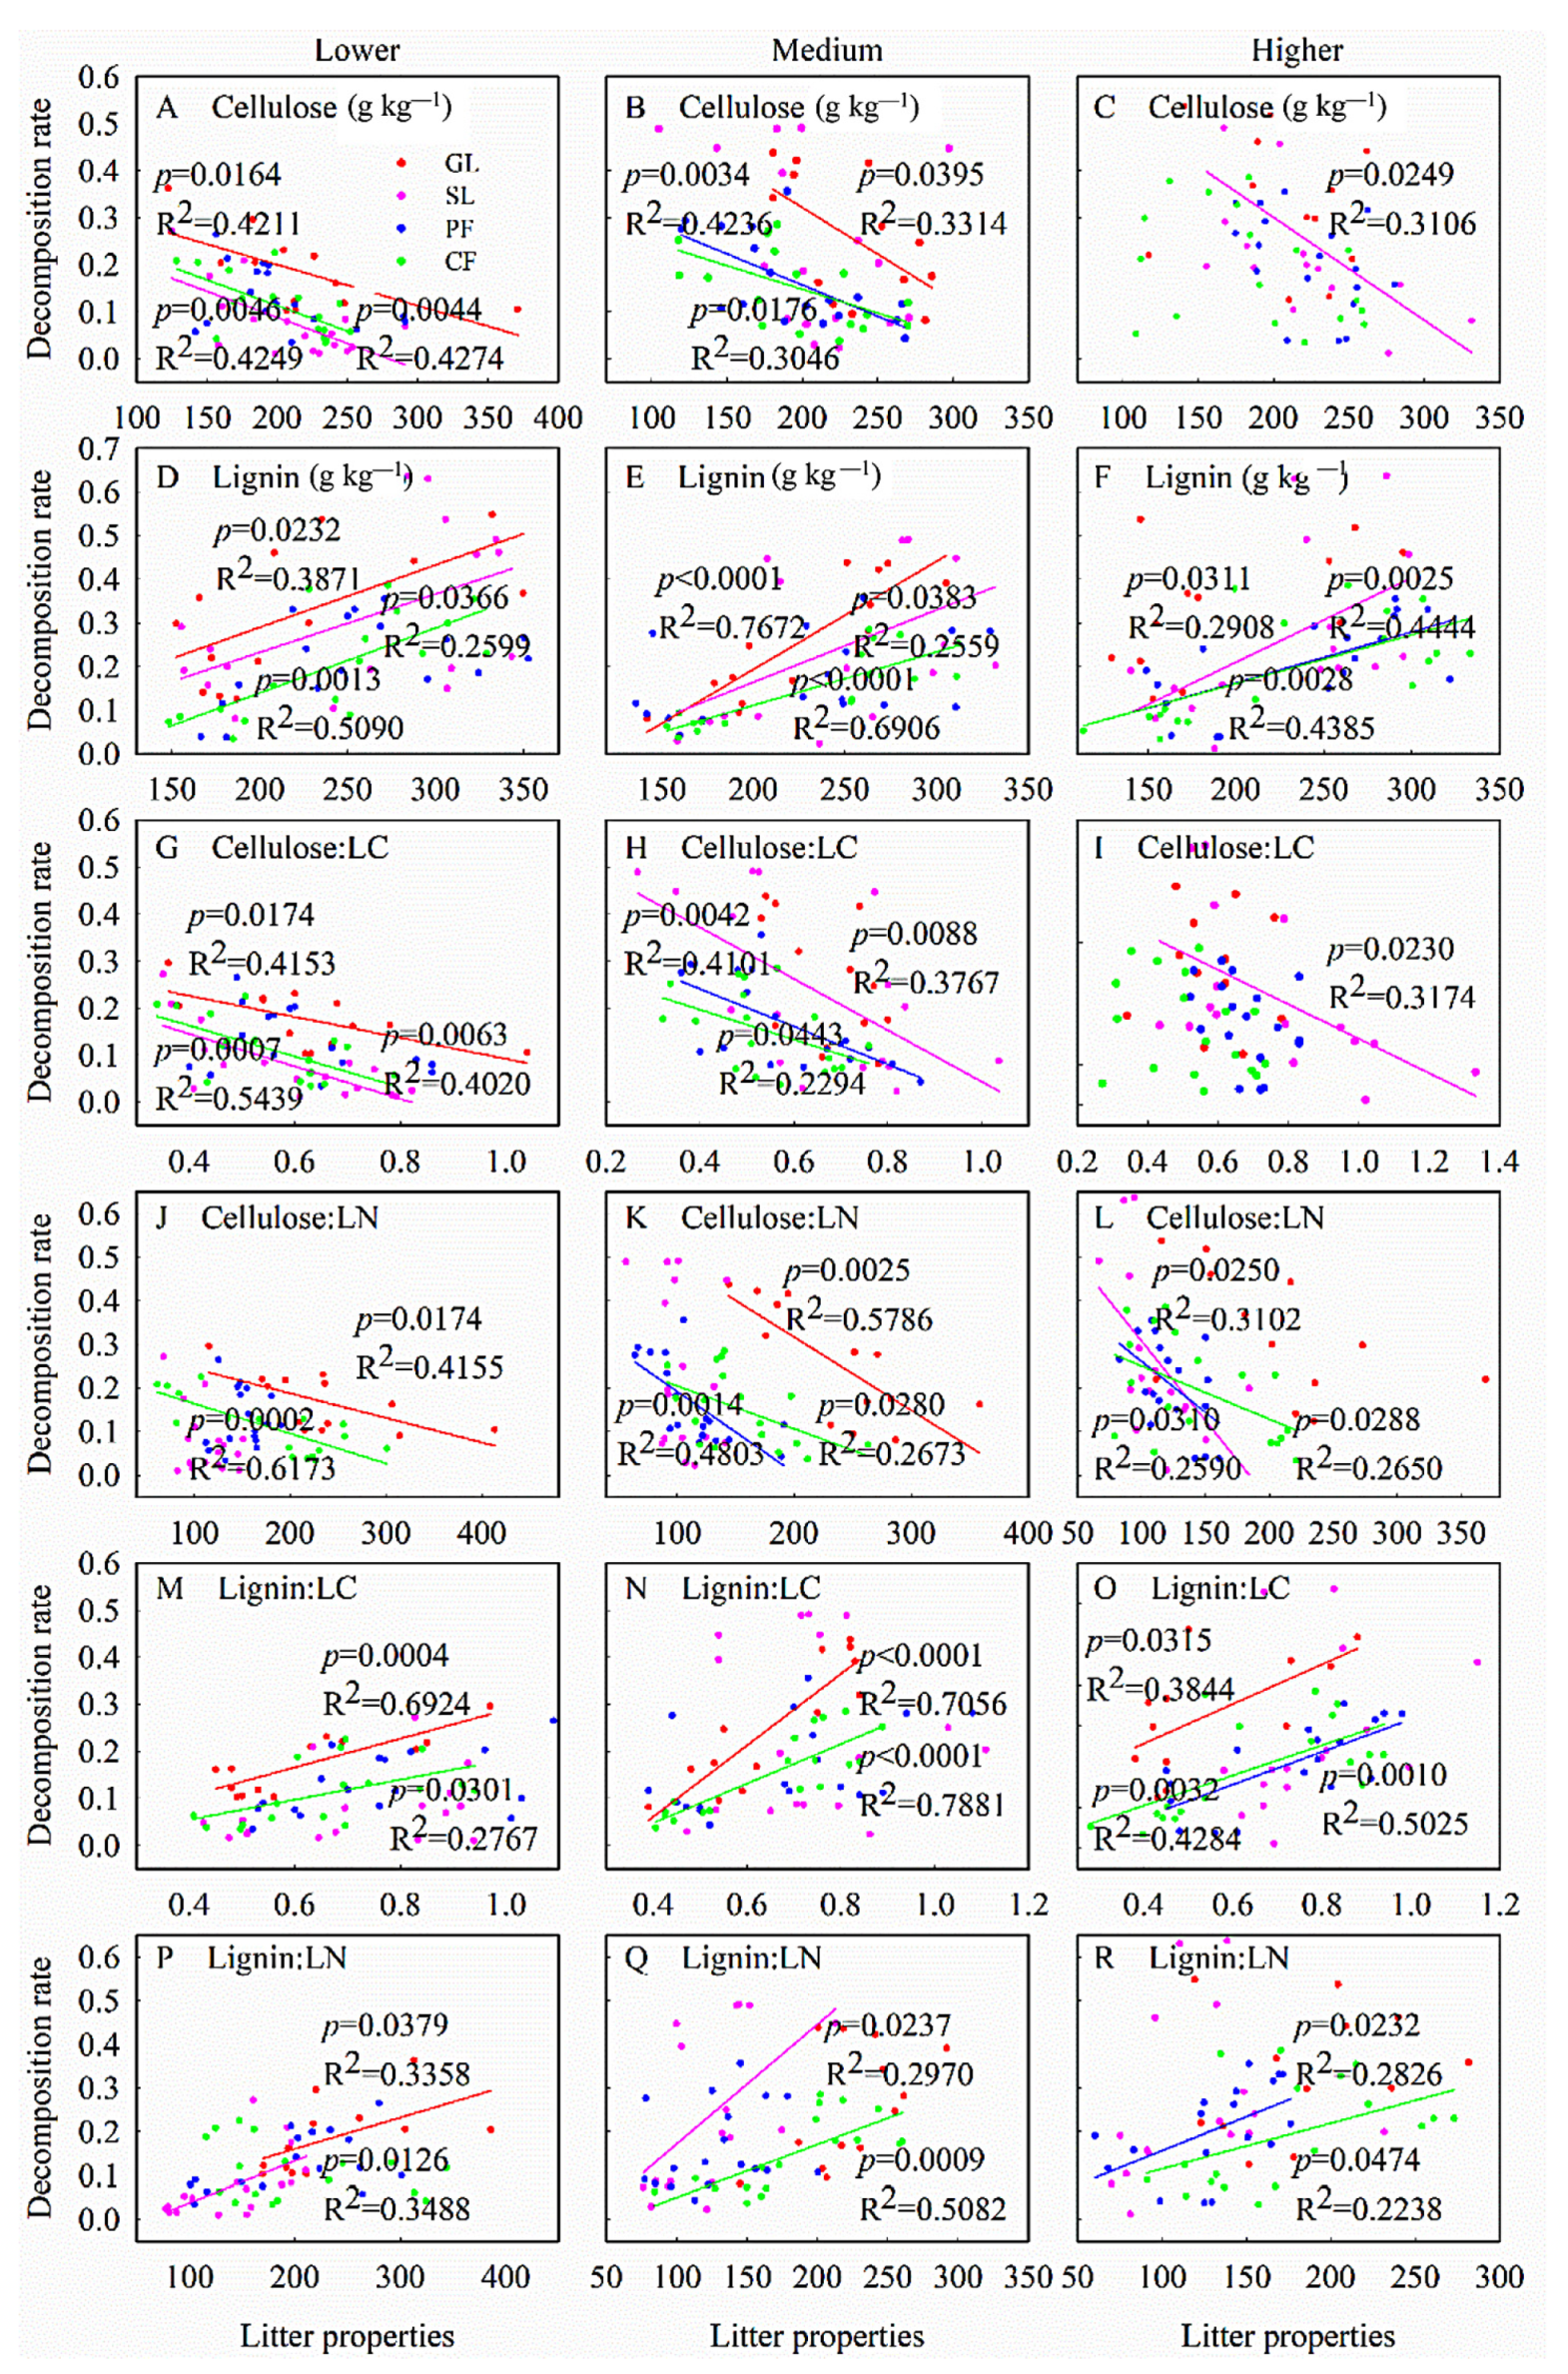
4.3. Effect of Leaf Litter Quality on Litter Decomposition Rate under Vegetation Type and Soil Moisture

In this study, the fluctuations of LN and LC: LN during decomposition (Figure 2) did not have a significant effect on litter decomposition (Figure 4G–I), which showed that the rate of litter decomposition was independent of vegetation type and seemed to suggest that it was affected by the chemical properties of the litters rather than by the microscopic environment and determined the observed difference in decomposition rates [43,57]. A similar result was obtained at the same sites, it shows that litter decomposition rate was closely related to its own quality [58]. In addition, there was no significant difference in the litter decomposition rates between PF and CF (Figure 1). Wang, Yang, Yang, Xin, Qu, Zhao and Gao [15] provided evidence that a higher N concentration in the soil accelerated the first stage of decomposition but negatively affected the rate of decomposition of insoluble compounds; therefore, the difference in decomposition between PF and CF was small.
Except for LC and LN, cellulose and lignin were more strongly related to litter decomposition (Figure 5), because cellulose and lignin content directly affect litter decay rate [59]. The litter decomposition could also be affected by affecting the biomass accumulation and the activity of extracellular enzymes of decomposers [60,61]. In addition, the decomposition rate of woody plant leaves was lower than that of herbs (Figure 1). Because herbs contain less lignin content (Figure 2M–O) [60,62]. It would limit decomposers growth and inhibit litter lignin degradation by microorganisms [12]. The difference in litter decomposition from different vegetation was driven by microorganisms that specialize in decomposing litter cellulose and lignin, and had the ability to degrade litter resources [59].

4.4. Effect of Soil Properties on Litter Decomposition Rate under Different Vegetation Types and Soil Moisture

Soil physico-chemistry properties play an important role in litter decomposition [63]. Among them, at the lower water level, soil NO3 had a significant positive effect on litter decomposition (Figure 3, Table 3, p < 0.01). This result indicated that there was nitrogen conversion between litter and soil, and litter decomposition was strongly correlated with the increase in NO3 [64,65]. The MBC and MBN had significant effects on litter decomposition only in the PF (Table 3, p < 0.05), but not in the GL and CF. This may be because specific microbial communities drive litter decomposition at different stages of recovery [21,66], because nutrients in litter are closely related to the soil microbial community [14,20]. The decomposition rate of SL was positively correlated with NH4+ and NO3 only at the lower water level (Table 3, p < 0.01). It shows that both soil moisture and NH4+, NO3 affect the litter decomposition and nutrient release [67,68]. The LC: LN of the SL was the lowest (Figure 2G–I), which may have been due to the biological nitrogen fixation of SL [56]. This process can increase TN, and the related nitrogen-fixing enzyme activity will affect the reduction of LN [69].
At the medium water level, NO3, DON and MBN (Table 3), which play a major role in litter decomposition, indicated that the turnover of N concentration and microbial biomass was closely related to the rate of litter decomposition [70,71]. Moreover, the suitability of water improved the availability of soil nutrients and provided sufficient nutrients for the growth of microorganisms, which in turn stimulated the growth of microorganisms and accelerated litter decomposition [64]. At the high water level, DON was the common factor affecting litter decomposition (Table 3 and Table 4). Moreover, there was a significant positive correlation between DON concentration in soil and litter decomposition rate (Figure 3), indicating that DON concentration was the controlling factor of litters decomposition (Table 4) [72].
In this study, litter decomposition of leaf was not affected by the SOC concentration (Table 3). These results were consistent with those of previous studies, which showed that the SOC concentration did not alter litter chemical changes [73,74]. Therefore, changes in litter decomposition were not very sensitive to changes in soil carbon pools because SOC was not a direct factor affecting litter decomposition. In summary, litter decomposition was more strongly correlated with the nitrogen NO3, NH4+, DON and MBN concentration, while it was weakly correlated with the carbon component [73,75]. In our study, the soil N element was the main factor that affected litters decomposition. With the increase in soil moisture, nitrogen will promote the change of litter composition mechanism, and then transform to the direction of rapid decomposition [47,72].

5. Conclusions

Both soil moisture and vegetation types in different succession stages affect litter decomposition rate. And litter chemical properties regulate litter decomposition. Among them, the cellulose content is negatively correlated with litter decomposition, which inhibits litter decomposition; While lignin, lignin: LC, lignin: LN, soil NO3, DON and MBN can promote it. This indicates that vegetation types affect litter chemistry properties, which in turn affect litter decomposition rate.

Author Contributions

Writing—original draft preparation, Y.L.; writing—review and editing, Z.S.; project administration, L.D.; data curation, Y.L.; methodology, L.D. All authors have read and agreed to the published version of the manuscript.

Funding

This study was sponsored by the National Natural Science Foundation of China (41877538), the Key Research and Development Program of Shaanxi Province (2021ZDLSF05-02), the Scientific and Technological Innovation Project of Shaanxi Forestry Academy of Sciences (SXLK2021-0206), and the Funding of Special Support Plan of Young Talents Project of Shaanxi Province and National Forestry and Grassland Administration in China (20201326015).

Data Availability Statement

Data is contained within the article.

Acknowledgments

We are greatly thankful to all who helped in fieldwork.

Conflicts of Interest

The authors declare no conflict of interest.

References

  1. Singh, K.; Trivedi, P.; Singh, G.; Singh, B.; Patra, D.D. Effect of different leaf litters on carbon, nitrogen and microbial activities of sodic soils. Land Degrad. Dev. 2014, 27, 1215–1226. [Google Scholar] [CrossRef]
  2. Fang, X.M.; Wang, G.G.; Xu, Z.J.; Zong, Y.Y.; Zhang, X.L.; Li, J.J.; Wang, H.; Chen, F.S. Litter addition and understory removal influenced soil organic carbon quality and mineral nitrogen supply in a subtropical plantation forest. Plant Soil 2021, 460, 527–540. [Google Scholar] [CrossRef]
  3. Gruber, N.; Galloway, J. An Earth-system perspective of the global nitrogen cycle. Nat. Cell Biol. 2008, 451, 293–296. [Google Scholar] [CrossRef]
  4. Jia, T.; Wang, Y.; Chai, B. Bacterial community characteristics and enzyme activities in Bothriochloa ischaemum litter over progressive phytoremediation years in a copper tailings dam. Front. Microbiol. 2020, 11, 3344. [Google Scholar] [CrossRef]
  5. Taylor, P.G.; Cleveland, C.C.; Wieder, W.; Sullivan, B.W.; Doughty, C.E.; Dobrowski, S.; Townsend, A.R. Temperature and rainfall interact to control carbon cycling in tropical forests. Ecol. Lett. 2017, 20, 779–788. [Google Scholar] [CrossRef] [Green Version]
  6. Campos, X.; Germino, M.J.; De Graaff, M.A. Enhanced precipitation promotes decomposition and soil C stabilization in semiarid ecosystems, but seasonal timing of wetting matters. Plant Soil 2017, 416, 427–436. [Google Scholar] [CrossRef]
  7. Manzoni, S.; Schimel, J.P.; Porporato, A. Responses of soil microbial communities to water stress: Results from a meta-analysis. Ecology 2012, 93, 930–938. [Google Scholar] [CrossRef]
  8. Wang, Y.; Li, F.Y.; Song, X.; Wang, X.; Suri, G.; Baoyin, T. Changes in litter decomposition rate of dominant plants in a semi-arid steppe across different land-use types: Soil moisture, not home-field advantage, plays a dominant role. Agric. Ecosyst. Environ. 2020, 303, 107119. [Google Scholar] [CrossRef]
  9. Otaki, M.; Tsuyuzaki, S. Succession of litter-decomposing microbial organisms in deciduous birch and oak forests, northern Japan. Acta Oecol. 2019, 101, 103485. [Google Scholar] [CrossRef]
  10. Cornwell, W.K.; Cornelissen, J.H.C.; Kathryn, A.; Ellen, D.; Eviner, V.T.; Oscar, G.; Hobbie, S.E.; Bart, H.; Hiroko, K.; Natalia, P.H. Plant species traits are the predominant control on litter decomposition rates within biomes worldwide. Ecol. Lett. 2010, 11, 1065–1071. [Google Scholar] [CrossRef]
  11. Urbanová, M.; Šnajdr, J.; Brabcová, V.; Merhautová, V.; Dobiášová, P.; Cajthaml, T.; Vaněk, D.; Frouz, J.; Šantrůčková, H.; Baldrian, P. Litter decomposition along a primary post-mining chronosequence. Biol. Fertil. Soils 2014, 50, 827–837. [Google Scholar] [CrossRef]
  12. Yang, X.; Chen, J. Plant litter quality influences the contribution of soil fauna to litter decomposition in humid tropical forests, southwestern China. Soil Biol. Biochem. 2009, 41, 910–918. [Google Scholar] [CrossRef]
  13. Castro, H.; Fortunel, C.; Freitas, H. Effects of land abandonment on plant litter decomposition in a montado system: Relation to litter chemistry and community functional parameters. Plant Soil 2010, 333, 181–190. [Google Scholar] [CrossRef]
  14. Bradford, M.; Ii, R.W.; Baldrian, P.; Crowther, T.W.; Maynard, D.; Oldfield, E.E.; Wieder, W.; Wood, S.; King, J.R. Climate fails to predict wood decomposition at regional scales. Nat. Clim. Chang. 2014, 4, 625–630. [Google Scholar] [CrossRef] [Green Version]
  15. Wang, X.; Yang, X.; Yang, N.; Xin, X.; Qu, Y.; Zhao, N.; Gao, Y. Effects of litter diversity and composition on litter decomposition characteristics and soil microbial community. Acta Ecol. Sin. 2019, 39, 6264–6272. [Google Scholar]
  16. Deng, L.; Wang, K.; Zhu, G.; Liu, Y.; Chen, L.; Shangguan, Z. Changes of soil carbon in five land use stages following 10 years of vegetation succession on the Loess Plateau, China. Catena 2018, 171, 185–192. [Google Scholar] [CrossRef]
  17. Chen, Y.; Ma, S.; Liu, J.; Cheng, G.; Lu, X. Soil C and N dynamics and their non-additive responses to litter mixture under different moisture conditions from an alpine steppe soil, Northern Tibet. Soil Biol. Biochem. 2018, 125, 231–238. [Google Scholar] [CrossRef]
  18. Wang, Z.; Liu, G.; Xu, M. Effect of revegetation on soil organic carbon concentration in deep soil layers in the hilly Loess Plateau of China. Acta Ecol. Sin. 2010, 30, 3947–3952. [Google Scholar]
  19. Zhou, Z.; Zhang, Z.; Zha, T.; Luo, Z.; Zheng, J.; Sun, O.J. Predicting soil respiration using carbon stock in roots, litter and soil organic matter in forests of Loess Plateau in China. Soil Biol. Biochem. 2013, 57, 135–143. [Google Scholar] [CrossRef]
  20. Zeng, Q.; Liu, Y.; Zhang, H.; An, S. Fast bacterial succession associated with the decomposition of Quercus wutaishanica litter on the Loess Plateau. Biogeochemistry 2019, 144, 119–131. [Google Scholar] [CrossRef]
  21. Williams, R.A. Afforestation potential in the Wana region to sequester carbon and improve soil quality. In Climate Change and Food Security in West Asia and North Africa; Springer: Berlin/Heidelberg, Germany, 2013; pp. 281–297. [Google Scholar] [CrossRef]
  22. Deng, L.; Liu, G.B.; Shangguan, Z.P. Land-use conversion and changing soil carbon stocks in China’s ‘Grain-for-Green’ program: A synthesis. Glob. Chang. Biol. 2014, 20, 3544–3556. [Google Scholar] [CrossRef] [PubMed]
  23. Xu, S.; Liu, L.; Sayer, E.J. Variability of above-ground litter inputs alters soil physicochemical and biological processes: A meta-analysis of litterfall-manipulation experiments. Biogeosciences 2013, 10, 5245–5272. [Google Scholar] [CrossRef] [Green Version]
  24. Zhang, W.; Gao, D.; Chen, Z.; Li, H.; Deng, J.; Qiao, W.; Han, X.; Yang, G.; Feng, Y.; Huang, J. Substrate quality and soil environmental conditions predict litter decomposition and drive soil nutrient dynamics following afforestation on the Loess Plateau of China. Geoderma 2018, 325, 152–161. [Google Scholar] [CrossRef]
  25. Han, M.Y.; Zhang, L.X.; Fan, C.H.; Liu, L.H.; Zhang, L.S.; Li, B.Z.; Alva, A.K. Release of nitrogen, phosphorus, and potassium during the decomposition of apple (Malus domestica) leaf litter under different fertilization regimes in Loess Plateau, China. Soil Sci. Plant Nutr. 2011, 57, 549–557. [Google Scholar] [CrossRef]
  26. Tateno, R.; Tokuchi, N.; Yamanaka, N.; Du, S.; Otsuki, K.; Shimamura, T.; Xue, Z.; Wang, S.; Hou, Q. Comparison of litterfall production and leaf litter decomposition between an exotic black locust plantation and an indigenous oak forest near Yan’an on the Loess Plateau, China. For. Ecol. Manag. 2007, 241, 84–90. [Google Scholar] [CrossRef]
  27. Li, J.; Liu, Y.; Hai, X.; Shangguan, Z.; Deng, L. Dynamics of soil microbial C:N:P stoichiometry and its driving mechanisms following natural vegetation restoration after farmland abandonment. Sci. Total Environ. 2019, 693, 133613. [Google Scholar] [CrossRef]
  28. Wang, K.B.; Ren, Z.P.; Deng, L.; Zhou, Z.C.; Shangguan, Z.P.; Shi, W.Y.; Chen, Y.P. Profile distributions and controls of soil inorganic carbon along a 150-year natural vegetation restoration chronosequence. Soil Sci. Soc. Am. J. 2016, 80, 193–202. [Google Scholar] [CrossRef]
  29. Robertson, G.P.; Coleman, D.C.; Sollins, P.; Bledsoe, C.S. Standard Soil Methods for Long-Term Ecological Research; Oxford University Press: Oxford, UK, 1999; Volume 2. [Google Scholar]
  30. Rowland, A.P.; Roberts, J.D. Lignin and cellulose fractionation in decomposition studies using acid-detergent fibre methods. Commun. Soil Sci. Plant Anal. 1994, 25, 269–277. [Google Scholar] [CrossRef]
  31. Nelson, D.W.; Sommers, L.E. Total carbon, organic carbon and organic matter. Methods Soil Anal. 1982, 9, 961–1010. [Google Scholar]
  32. Huffman, E.W., Jr. Performance of a new automatic carbon dioxide coulometer. Microchem. J. 1977, 22, 567–573. [Google Scholar] [CrossRef]
  33. Duan, J.; Wang, S.; Zhang, Z.; Xu, G.; Luo, C.; Chang, X.; Zhu, X.; Cui, S.; Zhao, X.; Wang, W.; et al. Non-additive effect of species diversity and temperature sensitivity of mixed litter decomposition in the alpine meadow on Tibetan Plateau. Soil Biol. Biochem. 2013, 57, 841–847. [Google Scholar] [CrossRef]
  34. Bosco, T.; Beatriz, M.; Bertiller, M.B.; Carrera, A.L. Combined effects of litter features, UV radiation, and soil water on litter decomposition in denuded areas of the arid Patagonian Monte. Plant Soil 2016, 406, 71–82. [Google Scholar] [CrossRef]
  35. Gingerich, R.T.; Anderson, J.T. Litter decomposition in created and reference wetlands in West Virginia, USA. Wetl. Ecol. Manag. 2011, 19, 449–458. [Google Scholar] [CrossRef]
  36. Mackintosh, T.J.; Davis, J.A.; Thompson, R.M. Impacts of multiple stressors on ecosystem function: Leaf decomposition in constructed urban wetlands. Environ. Pollut. 2016, 208, 221–232. [Google Scholar] [CrossRef]
  37. Fuell, A.K.; Entrekin, S.A.; Owen, G.S.; Owen, S.K. Drivers of leaf decomposition in two wetland types in the Arkansas River Valley, USA. Wetlands 2013, 33, 1127–1137. [Google Scholar] [CrossRef]
  38. Gingerich, R.T.; Merovich, G.; Anderson, J.T. Influence of environmental parameters on litter decomposition in wetlands in West Virginia, USA. J. Freshw. Ecol. 2014, 29, 535–549. [Google Scholar] [CrossRef]
  39. Zhang, K.; Dang, H.; Tan, S.; Wang, Z.; Zhang, Q. Vegetation community and soil characteristics of abandoned agricultural land and pine plantation in the Qinling Mountains, China. For. Ecol. Manag. 2010, 259, 2036–2047. [Google Scholar] [CrossRef]
  40. Montané, F.; Romanyà, J.; Rovira, P.; Casals, P. Aboveground litter quality changes may drive soil organic carbon increase after shrub encroachment into mountain grasslands. Plant Soil 2010, 337, 151–165. [Google Scholar] [CrossRef]
  41. Zhang, K.; Cheng, X.; Dang, H.; Ye, C.; Zhang, Y.; Zhang, Q. Linking litter production, quality and decomposition to vegetation succession following agricultural abandonment. Soil Biol. Biochem. 2013, 57, 803–813. [Google Scholar] [CrossRef]
  42. Zukswert, J.M.; Prescott, C.E. Relationships among leaf functional traits, litter traits, and mass loss during early phases of leaf litter decomposition in 12 woody plant species. Oecologia 2017, 185, 305–316. [Google Scholar] [CrossRef]
  43. Pei, G.; Liu, J.; Peng, B.; Gao, D.; Wang, C.; Dai, W.; Jiang, P.; Bai, E. Nitrogen, lignin, C/N as important regulators of gross nitrogen release and immobilization during litter decomposition in a temperate forest ecosystem. For. Ecol. Manag. 2019, 440, 61–69. [Google Scholar] [CrossRef]
  44. Orians, C.M.; Schweiger, R.; Dukes, J.S.; Scott, E.; Müller, C. Combined impacts of prolonged drought and warming on plant size and foliar chemistry. Ann. Bot. 2019, 124, 41–52. [Google Scholar] [CrossRef] [Green Version]
  45. Carrera, A.L.; Bertiller, M.B. Combined effects of leaf litter and soil microsite on decomposition process in arid rangelands. J. Environ. Manag. 2013, 114, 505–511. [Google Scholar] [CrossRef] [PubMed]
  46. Chomel, M.; Fernandez, C.; Bousquet-Mélou, A.; Gers, C.; Monnier, Y.; Santonja, M.; Gauquelin, T.; Gros, R.; Lecareux, C.; Baldy, V. Secondary metabolites of Pinus halepensis alter decomposer organisms and litter decomposition during afforestation of abandoned agricultural zones. J. Ecol. 2014, 102, 411–424. [Google Scholar] [CrossRef]
  47. Nielsen, U.N.; Ball, B. Impacts of altered precipitation regimes on soil communities and biogeochemistry in arid and semi-arid ecosystems. Glob. Chang. Biol. 2014, 21, 1407–1421. [Google Scholar] [CrossRef] [PubMed]
  48. Wu, F.; Yang, W.; Zhang, J.; Deng, R. Litter decomposition in two subalpine forests during the freeze–thaw season. Acta Oecologica 2010, 36, 135–140. [Google Scholar] [CrossRef]
  49. Zhang, J.; Zhang, D.; Jian, Z.; Zhou, H.; Zhao, Y.; Wei, D. Litter decomposition and the degradation of recalcitrant components in Pinus massoniana plantations with various canopy densities. J. For. Res. 2019, 30, 1395–1405. [Google Scholar] [CrossRef] [Green Version]
  50. Klotzbücher, T.; Kaiser, K.; Filley, T.R.; Kalbitz, K. Processes controlling the production of aromatic water-soluble organic matter during litter decomposition. Soil Biol. Biochem. 2013, 67, 133–139. [Google Scholar] [CrossRef]
  51. Yue, K.; Peng, C.; Yang, W.; Peng, Y.; Zhang, C.; Huang, C.; Wu, F. Degradation of lignin and cellulose during foliar litter decomposition in an alpine forest river. Ecosphere 2016, 7, 01523. [Google Scholar] [CrossRef]
  52. Cortez, J.; Garnier, E.; Pérez-Harguindeguy, N.; Debussche, M.; Gillon, D. Plant traits, litter quality and decomposition in a Mediterranean old-field succession. Plant Soil 2007, 296, 19–34. [Google Scholar] [CrossRef]
  53. Kazakou, E.; Violle, C.; Roumet, C.; Pintor, C.; Gimenez, O.; Garnier, E. Litter quality and decomposability of species from a Mediterranean succession depend on leaf traits but not on nitrogen supply. Ann. Bot. 2009, 104, 1151–1161. [Google Scholar] [CrossRef] [Green Version]
  54. Overbeek, C.C.; Van Der Geest, H.G.; Van Loon, E.E.; Admiraal, W. Decomposition of standing litter biomass in newly constructed wetlands associated with direct effects of sediment and water characteristics and the composition and activity of the decomposer community using phragmites australis as a single standard substrate. Wetlands 2019, 39, 113–125. [Google Scholar] [CrossRef] [Green Version]
  55. Giweta, M. Role of litter production and its decomposition, and factors affecting the processes in a tropical forest ecosystem: A review. J. Ecol. Environ. 2020, 44, 1–9. [Google Scholar] [CrossRef]
  56. Xiao, L.; Bi, Y.; Du, S.; Wang, Y.; Guo, C.; Christie, P. Response of ecological stoichiometry and stoichiometric homeostasis in the plant-litter-soil system to re-vegetation type in arid mining subsidence areas. J. Arid. Environ. 2021, 184, 104298. [Google Scholar] [CrossRef]
  57. Horodecki, P.; Jagodziński, A.M. Tree species effects on litter decomposition in pure stands on afforested post-mining sites. For. Ecol. Manag. 2017, 406, 1–11. [Google Scholar] [CrossRef]
  58. Celentano, D.; Zahawi, R.A.; Finegan, B.; Casanoves, F.; Ostertag, R.; Cole, R.J.; Holl, K.D. Restauración ecológica de bosques tropicales en Costa Rica: Efecto de varios modelos en la producción, acumulación y descomposición de hojarasca. Rev. Biol. Trop. 2011, 59, 1323–1336. [Google Scholar] [CrossRef] [Green Version]
  59. Chen, L.F.; He, Z.B.; Wu, X.R.; Du, J.; Zhu, X.; Lin, P.F.; Tian, Q.Y.; Kong, J.Q. Linkages between soil respiration and microbial communities following afforestation of alpine grasslands in the northeastern Tibetan Plateau. Appl. Soil Ecol. 2021, 161, 103882. [Google Scholar] [CrossRef]
  60. Mayer, P.M. Ecosystem and decomposer effects on litter dynamics along an old field to old-growth forest successional gradient. Acta Oecol. 2008, 33, 222–230. [Google Scholar] [CrossRef]
  61. Muller, R. Nutrient relations of the herbaceous layer in deciduous forest ecosystems. In The Herbaceous Layer in Forests of Eastern North America; Gilliam, F., Ed.; Oxford University Press: Oxford, UK, 2014; pp. 12–34. [Google Scholar]
  62. Halabuk, A.; Gerhátová, K. Comparative study of leaf litter decomposition of exotic and native species in an ecotop of the hornbeam-oak forest near Báb village, SW Slovakia. Folia Oecol. 2011, 38, 17–27. [Google Scholar]
  63. Wang, Q.; Wang, S.; He, T.; Liu, L.; Wu, J. Response of organic carbon mineralization and microbial community to leaf litter and nutrient additions in subtropical forest soils. Soil Biol. Biochem. 2014, 71, 13–20. [Google Scholar] [CrossRef]
  64. Zhang, X.; Liu, Z.; Zhu, B.; Bing, Y.; Luc, N.T.; Du, L.; Zhu, Z. Impacts of mixed litter decomposition from Robinia pseudoacacia and other tree species on C loss and nutrient release in the Loess Plateau of China. J. For. Res. 2016, 27, 525–532. [Google Scholar] [CrossRef]
  65. Delgado-Baquerizo, M.; Garcia-Palacios, P.; Milla, R.; Gallardo, A.; Maestre, F.T. Soil characteristics determine soil carbon and nitrogen availability during leaf litter decomposition regardless of litter quality. Soil Biol. Biochem. 2015, 81, 134–142. [Google Scholar] [CrossRef]
  66. Hansson, K.; Olsson, B.A.; Olsson, M.; Johansson, U.; Kleja, D.B. Differences in soil properties in adjacent stands of Scots pine, Norway spruce and silver birch in SW Sweden. For. Ecol. Manag. 2011, 262, 522–530. [Google Scholar] [CrossRef]
  67. Zhu, L.; Deng, Z.; Xie, Y.; Li, X.; Li, F.; Chen, X.; Zou, Y.; Zhang, C.; Wang, W. Factors controlling Carex brevicuspis leaf litter decomposition and its contribution to surface soil organic carbon pool at different water levels. Biogeosciences 2021, 18, 1–11. [Google Scholar] [CrossRef]
  68. Bani, A.; Pioli, S.; Ventura, M.; Panzacchi, P.; Borruso, L.; Tognetti, R.; Tonon, G.; Brusetti, L. The role of microbial community in the decomposition of leaf litter and deadwood. Appl. Soil Ecol. 2018, 126, 75–84. [Google Scholar] [CrossRef]
  69. Zhou, G.; Zhang, J.; Qiu, X.; Wei, F.; Xu, X. Decomposing litter and associated microbial activity responses to nitrogen deposition in two subtropical forests containing nitrogen-fixing or non-nitrogen-fixing tree species. Sci. Rep. 2018, 8, 12934. [Google Scholar] [CrossRef]
  70. Li, Q.; Moorhead, D.L.; DeForest, J.L.; Henderson, R.; Chen, J.; Jensen, R. Mixed litter decomposition in a managed Missouri Ozark forest ecosystem. For. Ecol. Manag. 2009, 257, 688–694. [Google Scholar] [CrossRef]
  71. Wu, J.; Liu, W.; Zhang, W.; Shao, Y.; Duan, H.; Chen, B.; Wei, X.; Fan, H. Long-term nitrogen addition changes soil microbial community and litter decomposition rate in a subtropical forest. Appl. Soil Ecol. 2019, 142, 43–51. [Google Scholar] [CrossRef]
  72. Mariano, E.; Jones, D.; Hill, P.W.; Trivelin, P.C. Mineralisation and sorption of dissolved organic nitrogen compounds in litter and soil from sugarcane fields. Soil Biol. Biochem. 2016, 103, 522–532. [Google Scholar] [CrossRef]
  73. Lajtha, K.; Bowden, R.D.; Nadelhoffer, K. Litter and root manipulations provide insights into soil organic matter dynamics and stability. Soil Sci. Soc. Am. J. 2014, 78, S261–S269. [Google Scholar] [CrossRef] [Green Version]
  74. Fang, X.; Zhao, L.; Zhou, G.; Huang, W.; Liu, J. Increased litter input increases litter decomposition and soil respiration but has minor effects on soil organic carbon in subtropical forests. Plant Soil 2015, 392, 139–153. [Google Scholar] [CrossRef]
  75. Sayer, E.J.; Wright, S.J.; Tanner, E.V.J.; Yavitt, J.B.; Harms, K.E.; Powers, J.S.; Kaspari, M.; Garcia, M.N.; Turner, B. Variable responses of lowland tropical forest nutrient status to fertilization and litter manipulation. Ecosystems 2012, 15, 387–400. [Google Scholar] [CrossRef]
Figure 1. Dynamics of litter biomass loss and decomposition rate changed with decomposing time (months) in different restoration stages. Lower, medium, higher represent three different water gradients, respectively. GL, grassland; SL, shrubland; PF, pioneer forests; CF, climax forests. (AC) represent the dry mass remaining under lower water, medium water and higher water treatment, respectively; (DF) represent the mass loss rate under lower water, medium water and higher water treatment, respectively. All bars represent the mean ± standard error.
Forests 12 01195 g001
Figure 2. Chemical properties of litter changed with decomposing time (months) in different restoration stages. Lower, medium, higher represent three different water gradients, respectively. LC: LN indicates the ratio of litter organic carbon to total nitrogen. GL, grassland; SL, shrubland; PF, pioneer forests; CF, climax forests. (AC) represent the dynamics of litter organic carbon under lower water, medium water and higher water treatment, respectively; (DF) represent the dynamics of litter total nitrogen under lower water, medium water and higher water treatment, respectively. (GI) represent the dynamics of the ratio of litter organic carbon (LC) to litter total nitrogen (LN) under lower water, medium water and higher water treatment, respectively; (JL) represent the dynamics of cellulose content under lower water, medium water and higher water treatment, respectively. (MO) represent the dynamics of lignin content under lower water, medium water and higher water treatment, respectively. All bars represent the mean ± standard error.
Forests 12 01195 g002
Figure 3. Redundancy analysis of vegetation litter decomposition rate and related factors of vegetation and soil under different soil water. (AD) represent the relationship between litter decomposition rate and plant, soil physicochemical properties under lower water (W1), medium water (W2) and higher water (W3) treatments of the four types vegetation (GL, SL, PF and CF), respectively. SOC: soil organic carbon, TN: total nitrogen, MBN: microbial biomass nitrogen, MBC: microbial biomass carbon, DOC: dissolved organic carbon, DON: dissolved organic nitrogen, NH4+: ammonium nitrogen, NO3: nitrate nitrogen, LC: litter carbon, LN: litter nitrogen. GL, grassland; SL, shrubland; PF, pioneer forests; CF, climax forests.
Forests 12 01195 g003
Figure 4. Correlation between LC, LN, LC: LN and litter decomposition rate. LC: litter carbon, LN: litter nitrogen. Lines not shown in the figure indicate no correlation (p > 0.05). GL, grassland; SL, shrubland; PF, pioneer forests; CF, climax forests. (AC) represent the correlation between litter decomposition rate and LC under lower water, medium water, and higher water treatments, respectively; (DF) represent the correlation between litter decomposition rate and LN under lower water, medium water, and higher water treatments, respectively; (GI) represent the correlation between litter decomposition rate and LC: LN under lower water, medium water, and higher water treatments, respectively.
Forests 12 01195 g004
Figure 5. Correlation between cellulose, lignin and litter decomposition rate. LC: litter carbon, LN: litter nitrogen. Lines not shown in the figure indicate no correlation (p > 0.05). GL, grassland; SL, shrubland; PF, pioneer forests; CF, climax forests. (AC) represent the correlation between litter decomposition rate and cellulose under lower water, medium water, and higher water treatments, respectively; (DF) represent the correlation between litter decomposition rate and lignin under lower water, medium water, and higher water treatments, respectively; (GI) represent the correlation between litter decomposition rate and cellulose: LC under lower water, medium water, and higher water treatments, respectively; (JL) represent the correlation between litter decomposition rate and cellulose: LN under lower water, medium water, and higher water treatments, respectively; (MO) represent the correlation between litter decomposition rate and lignin: LC under lower water, medium water, and higher water treatments, respectively; (PR) represent the correlation between litter decomposition rate and lignin: LN under lower water, medium water, and higher water treatments, respectively.
Forests 12 01195 g005
Table 1. Stepwise regression analysis of litter decomposition rate with litter properties.
Vegetation TypeEquationR2F
GLLC = 334.108 + 9.0460X − 0.6632X20.3189 ***11.9390
SLLC = 264.2299 + 13.4820X − 0.4378X20.3877 ***16.1432
PFLC = 326.8054 + 2.515X − 0.1620X20.020.5216
CFLC = 382.8769 − 6.7872X + 0.3938X20.1646 *5.0227
GLLN = 1.0444 − 0.0473X + 0.004X20.4652 ***22.1829
SLLN = 2.1413 − 0.0542X + 0.0027X20.07472.0582
PFLN = 1.6307 + 0.0109X0.05653.1158
CFLN = 1.1645 + 0.0123X0.0936 *5.3700
GLLC:LN = 319.8364 + 27.9883X − 2.1552X20.4298 ***19.2200
SLLC:LN = 140.6932 + 4.4725X0.2343 ***15.9100
PFLC:LN = 209.1411 − 1.5415X0.06673.7163
CFLC:LN = 366.5378 − 19.9371X + 0.9920X20.3207 ***12.0394
GLCellulose = 246.1229 − 1.5756X − 0.1910X20.2342 ***5.3508
SLCellulose = 253.3808 − 5.4886X0.3415 ***24.8911
PFCellulose = 252.1429 − 7.7153X + 0.1690X20.3371 ***12.7149
CFCellulose = 252.1429 − 3.6091X − 0.0903X20.2906 ***10.2428
GLLignin = 159.9363 + 7.3713X0.4216 ***26.2382
SLLignin = 159.7506 + 17.1866X − 0.5830X20.4489 ***19.1421
PFLignin = 130.5952 + 26.8986X − 1.2207X20.5156 ***26.6058
CFLignin = 116.9031 + 26.8906X − 1.0978X20.6808 ***53.3160
X: decomposition time (month), LC: litter carbon, LN: litter nitrogen. * p < 0.05; *** p < 0.001. GL, grassland; SL, shrubland; PF, pioneer forests; CF, climax forests.
Table 2. Multivariate analysis of variance of vegetation type and soil moisture and litter characteristics.
TreatmentsdfLCLNLC:LNCellulose: LCLignin: LCCellulose: LNLignin: LN
Mean SquareFMean SquareFMean SquareFMean SquareFMean SquareFMean SquareFMean SquareF
Vegetation type328,929.9930.20 ***17.04397.24 ***747,116.66266.27 ***0.145.74 ***0.165.12 **108,014.2648.98 ***62,473.4824.25 ***
Soil moisture29067.139.47 ***0.5612.96 ***30,009.8510.70 ***0.031.110.010.168775.183.98 *27,263.8610.58 ***
Vegetation type × Soil moisture66077.916.35 ***0.010.301210.640.430.052.020.030.811967.880.893938.451.53
LC: litter carbon, LN: litter nitrogen; * p < 0.05; ** p < 0.01; *** p < 0.001.
Table 3. Correlation coefficient between litter decomposition rate and soil physico-chemical properties under the influence of vegetation type and soil moisture.
Soil MoistureVegetation TypesSoil Properties
SOCTNNH4+NO3pHMBCMBNDOCDON
LowerGL0.338−0.1530.527 *0.684 **0.4530.0820.0140.714 **0.324
SL−0.304−0.2050.589 *0.828 **0.099−0.0260.2240.4110.563 *
PF0.214−0.2970.1970.913 **0.521 *0.789 **0.661 **−0.0700.374
CF0.040−0.275−0.2040.872 **0.0720.3150.4050.575 *0.784 **
MediumGL−0.265−0.3030.681 **0.860 **0.431−0.2910.4390.615 **0.795 **
SL−0.461−0.494 *0.0070.274−0.232−0.2840.621 **−0.1180.312
PF−0.170−0.0500.2810.713 **0.4290.614 **0.644 **0.580 *0.763 **
CF0.1550.078−0.3410.662 **0.4560.4050.686 **0.2450.353
HigherGL−0.783 **−0.603 **0.667 **0.797 **0.361−0.3860.4670.730 **0.767 **
SL−0.477 *−0.0880.1210.449−0.293−0.1800.633 **−0.0560.475 *
PF0.172−0.651 **0.4600.644 **0.3880.1790.560 *0.1800.743 **
CF−0.2340.286−0.4020.489 *0.2910.1010.3430.2990.660 **
SOC: soil organic carbon, TN: total nitrogen, MBN: microbial biomass nitrogen, MBC: microbial biomass carbon, DOC: dissolved organic carbon, DON: dissolved organic nitrogen, NH4+: ammonium nitrogen, NO3: nitrate nitrogen. * p < 0.05; ** p < 0.01. GL, grassland; SL, shrubland; PF, pioneer forests; CF, climax forests.
Table 4. Stepwise regression analysis of litter decomposition rate with litter and soil physico-chemical properties.
Soil MoistureVegetation TypeEquationR2
LowerGLMass loss = 0.856Cellulose:LC − 0.0410.733 ***
SLMass loss = 0.819NO3 − 0.0410.631 ***
PFMass loss = 0.907NO3 + 0.0570.827 ***
CFMass loss = 0.817MBC + 0.923DON − 0.356pH + 0.4710.958 ***
MediumGLMass loss = −0.305Cellulose + 0.774NO3 + 0.3020.927 ***
SLMass loss = −0.332SOC + 0.744DON + 0.6530.738 ***
PFMass loss = 0.744DON + 0.345Lignin:LC + 0.343pH − 2.1520.870 ***
CFMass loss = 0.306MBN − 0.334NH4+ + 0.736Cellulose:LC − 0.1420.942 ***
HigherGLMass loss = −0.254SOC + 0.415DON + 0.562NO3 + 0.5750.967 ***
SLMass loss = −0.18SOC + 0.277MBN − 0.246TN + 0.773DON + 1.8840.948 ***
PFMass loss = 0.645DON − 0.532TN + 0.8020.826 ***
CFMass loss = 0.508DON + 0.511Lignin − 0.060.674 ***
LC: litter carbon, NH4+: ammonium nitrogen, NO3: nitrate nitrogen, MBN: microbial biomass nitrogen, MBC: microbial biomass carbon, DON: dissolved organic nitrogen, SOC: soil organic carbon, TN: total nitrogen. *** p < 0.001. GL, grassland; SL, shrubland; PF, pioneer forests; CF, climax forests.
Publisher’s Note: MDPI stays neutral with regard to jurisdictional claims in published maps and institutional affiliations.

