1. Introduction
Tea plants grow globally, especially in China, India, Sri Lanka, and Kenya [
1]. The area under tea cultivation globally was 500 × 10
4 ha in 2019, which was seven times greater than the area measured in 1946 (66 × 10
4 ha) [
2]. To ensure the healthy growth of tea plants and maintain or increase the yield per unit area, it is necessary to regularly monitor the distribution and evaluate the status of tea plants to develop better management strategies. Tea plantation monitoring and management have traditionally relied on regular field surveys. This type of on-ground data collection is important because it provides first-hand information on tea plantations. However, these surveys are time- and labor-consuming and logically cannot be applied to large hilly or mountainous areas where tea plantations grow. Moreover, the structural characteristics of tea plants, such as the tree height and leaf area index, cannot be obtained continuously using traditional methods, and these characteristics determine the yield of tea plantations.
Remote sensing techniques, on the other hand, provide fast, repeatable, and cost-effective methods for mapping tea plants and estimating the biophysical and biochemical parameters of tea plants. Currently, various types of remote sensing platforms (satellite-, airborne-, and terrestrial-based) and various types of sensors (spectral, radar, lidar, photogrammetric, etc.) can be used for tea plantation monitoring depending on the scale and aim of the study. For example, Wang [
3] mapped tea plantations from multiseasonal Landsat-8 images using a random forest classifier. Snapir et al. [
4] monitored tea shoot growth using X-Band Synthetic Aperture Radar (SAR) images. Bian et al. [
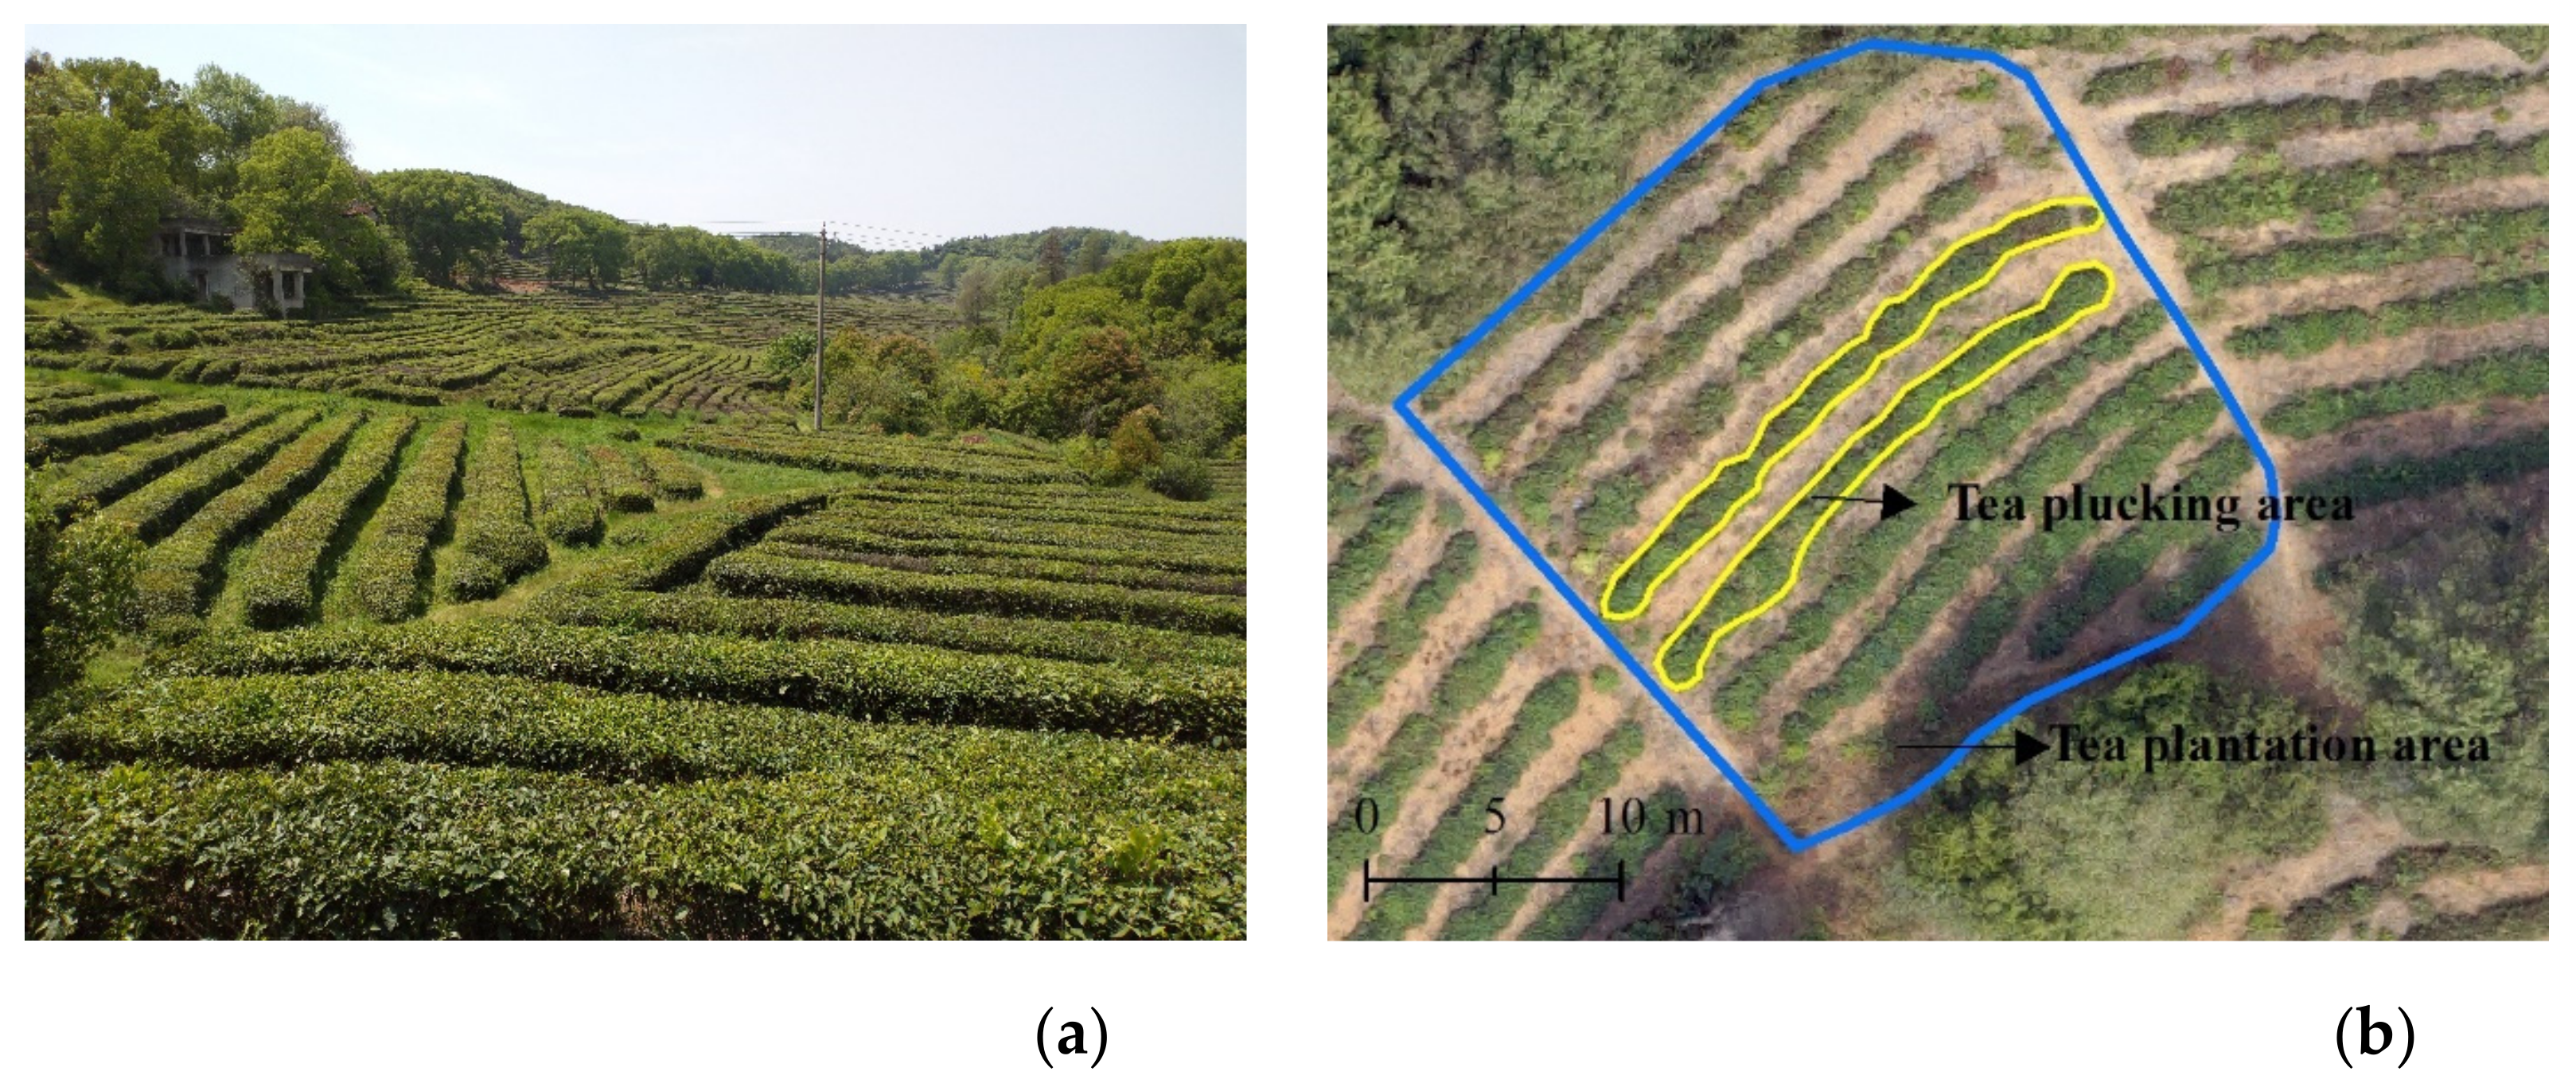
5] predicted the foliar biochemistry of tea based on hyperspectral technology. However, due to the elongated shapes of tea plantations (which have a typical width of 0.5–1.5 m, as illustrated in
Figure 1), remotely sensed satellite data might not be suitable for the regular monitoring of tea plantations at finer scales, such as at the scale of a cluster or the plucking area [
6]. Although manned aircraft data can provide the high resolution and high precision required for finer-scale monitoring, these data are expensive, not widely available, and not suitable for small area plantations (such as plantations ≤ 300 ha).
Unmanned aerial vehicles (UAVs) paired with digital cameras and lidar scanners have the potential to (1) provide imagery with very high spatial resolutions (≤0.20 m) and high-density lidar point clouds (footprint: 0.05–0.25 m, density: ≥20 points/m
2), hence making the plucking area of tea plantations accessible [
7]; (2) increase the efficiency of on-ground surveys by collecting full horizontal and vertical coverage information in less time than traditional field surveys [
8]; and (3) provide high-mobility, cost-effective, widely available methods that serve as alternatives to manned aircraft surveys while maintaining and even increasing the resolution and accuracy of the obtained data [
9,
10].
UAV-derived remotely sensed data have been widely used to obtain precision agriculture and forest inventories over the past decade. Husson et al. [
11] used visible images from UAVs to identify riparian species compositions in northern Sweden and rapidly mapped the distribution of vegetation along a shoreline. Senthilnath et al. [
12] fused Sentinel-2 data with UAV images to map crop distributions at a finer spatial scale. Wang et al. [
13] used UAV lidar as a sampling tool and combined it with Sentinel-2 images to estimate and map the height and aboveground biomass of mangrove forests on Hainan Island. Pourshamsi et al. [
14] integrated PolInSAR and lidar data to obtain better estimates of forest canopy height. With the rapid development of sensors and UAVs, the implementation of very high-resolution data acquired from cost-effective UAVs will become an increasingly valuable method used to map and evaluate various crops and forests.
Tea plucking areas are directly related to the tea yield and are important for tea garden precision management. Despite the importance of accurately mapping tea plantations and evaluating the status of tea plants at a finer scale, mapping the plucking area of tea plantations has not been concerned and addressed to date [
15]. Furthermore, to the best of our knowledge, no studies have explored the potential of UAV-derived remotely sensed data for mapping the plucking area of tea plantations. Few studies have used satellite or airborne imagery to map tea plantations. Dihkan et al. [
16], for example, employed high-resolution multispectral digital aerial images to map tea plantation distributions. Zhu et al. [
17] developed a method for identifying tea plantations based on multitemporal Sentinel-2 images and a multifeature random forest algorithm. Chuang and Shiu [
18] identified tea crops in a subtropical region with real-time high-resolution WorldView-2 imagery using random forest and support vector machine algorithms. The existing studies have not paid attention to the plucking area of tea plantations, and the previous study areas have been limited to flat areas, which are not the main region in which tea plants grow.
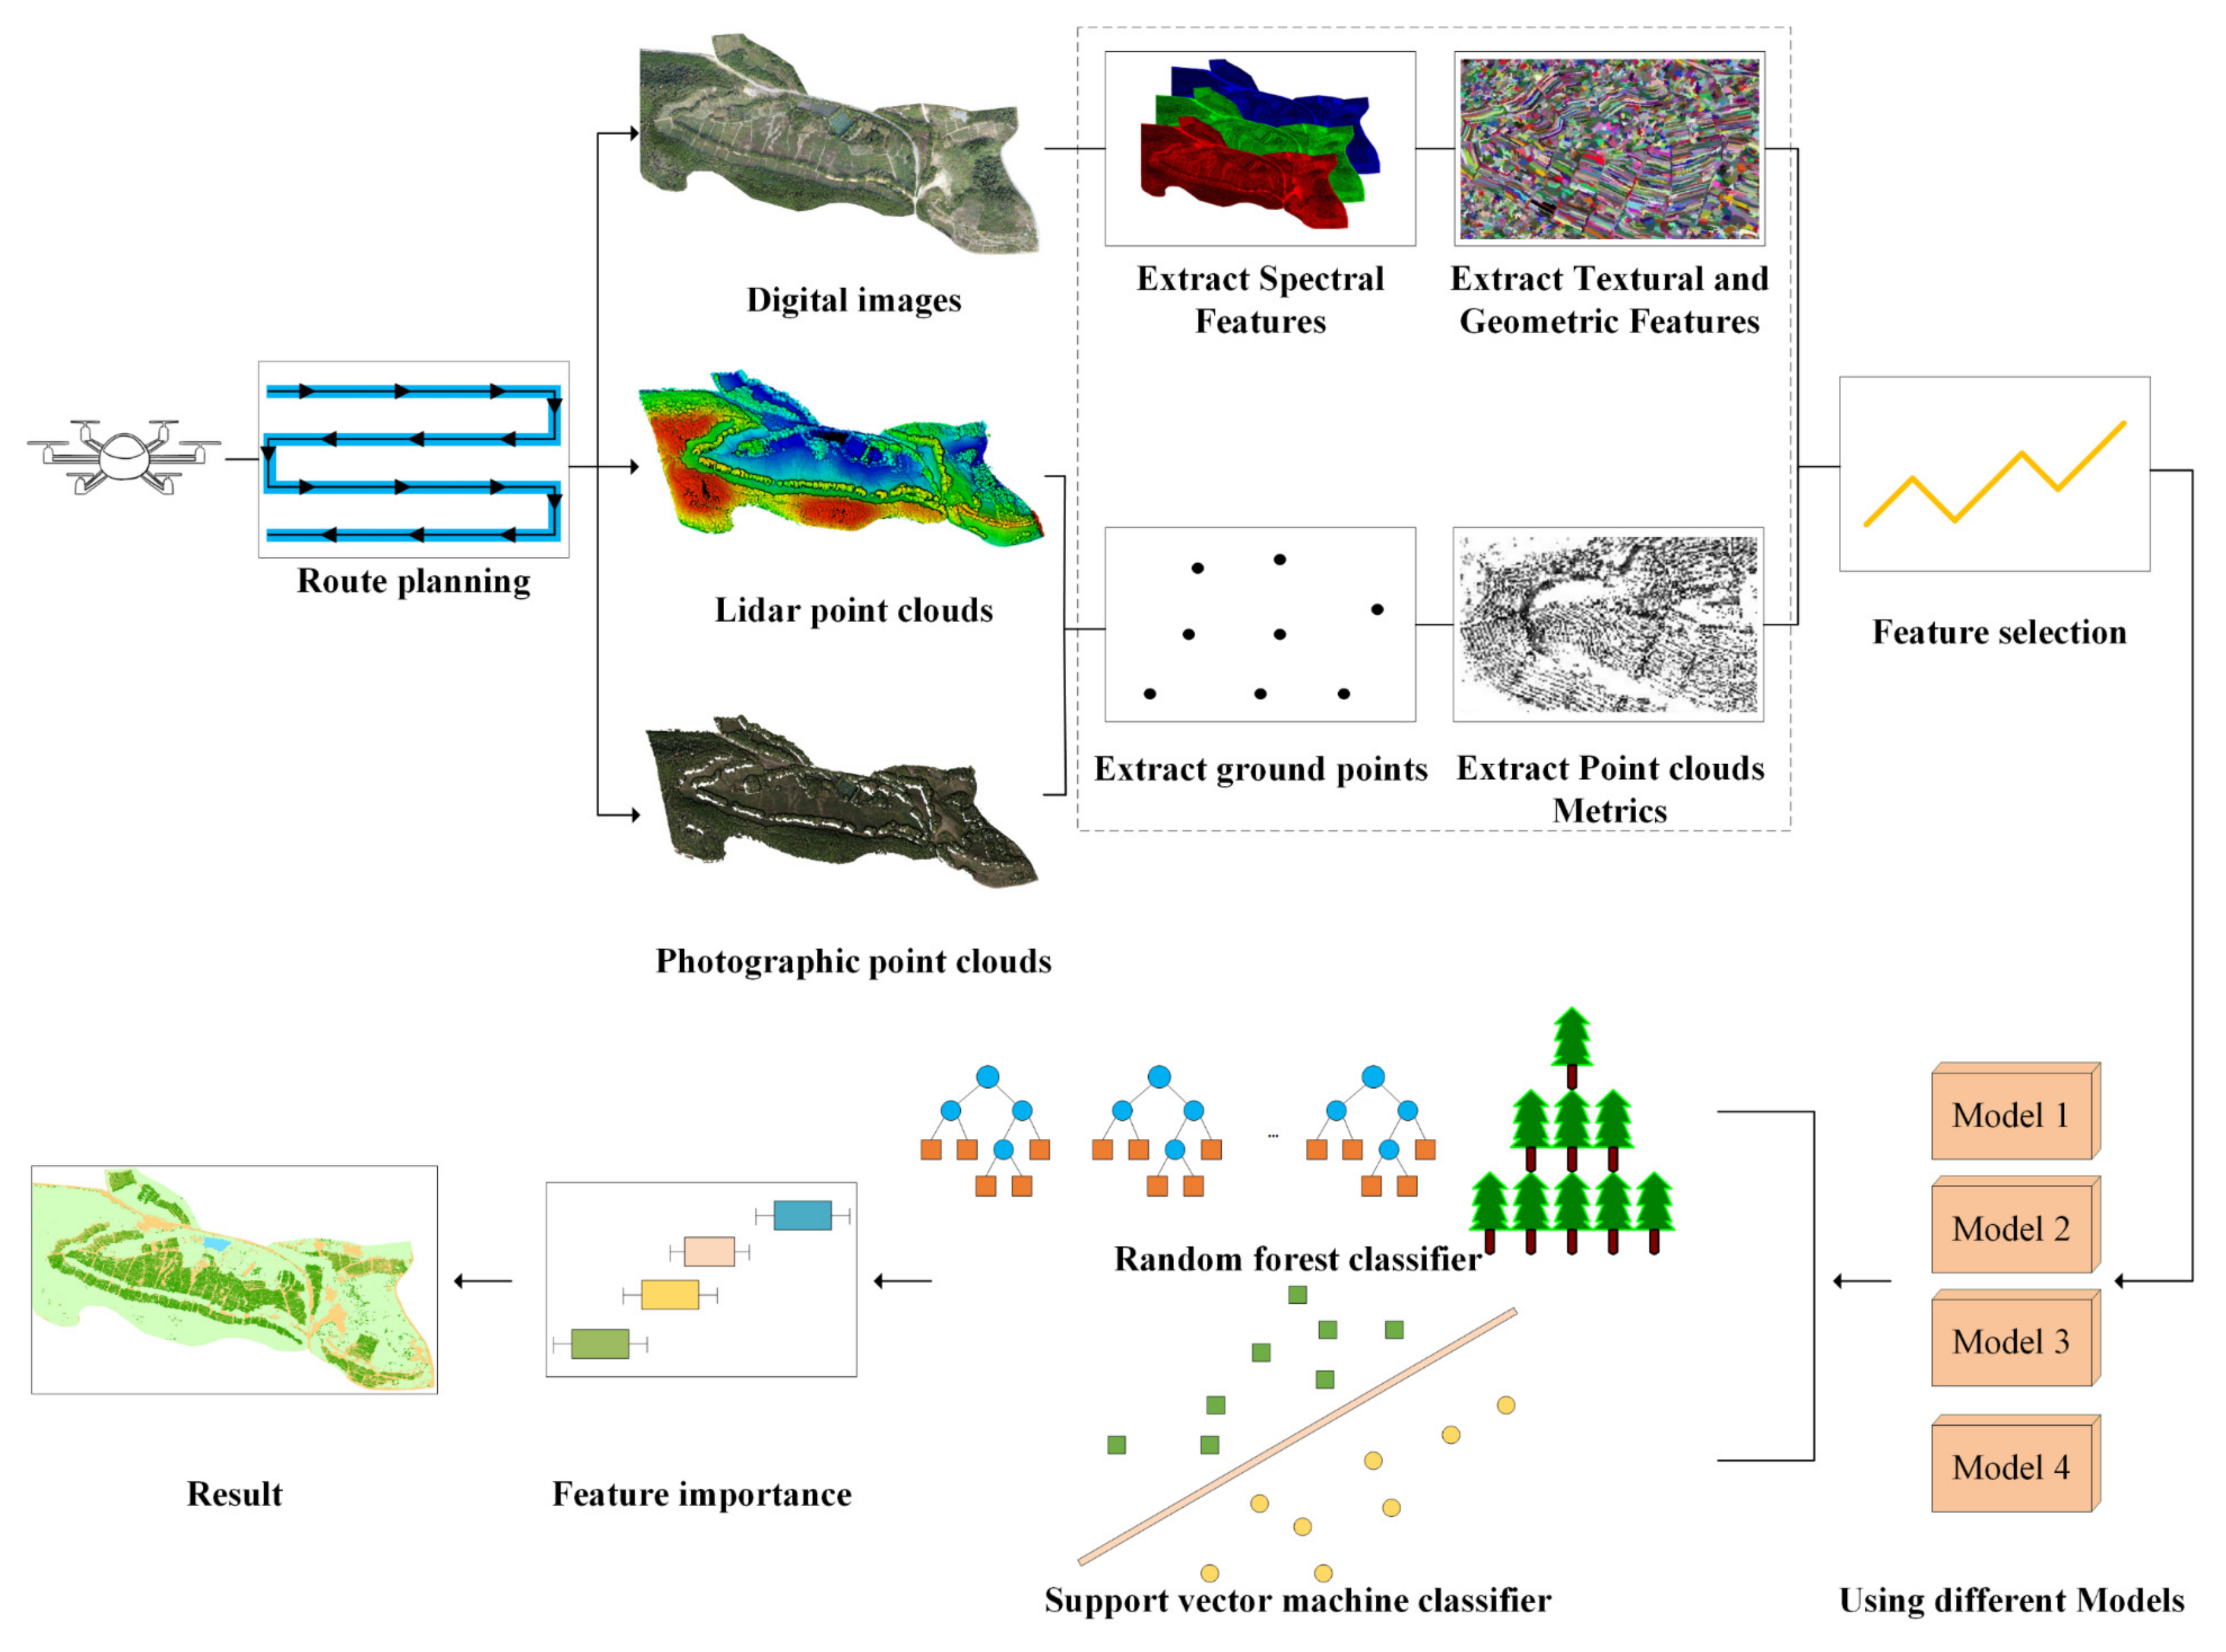
This study aimed to explore the potential of UAV remotely sensed data for mapping the plucking area of tea plantations. To pursue this objective, we collected optical imagery, digital aerial photogrammetry, and lidar data of a tea garden by UAV and designed four classification models based on different UAV remotely sensed data. A recursive feature elimination algorithm was applied to select the important features from optical imagery and point clouds. Finally, a novel method for mapping the plucking area of tea plantations based on UAV-derived data is proposed.
3. Results
3.1. Feature Selection
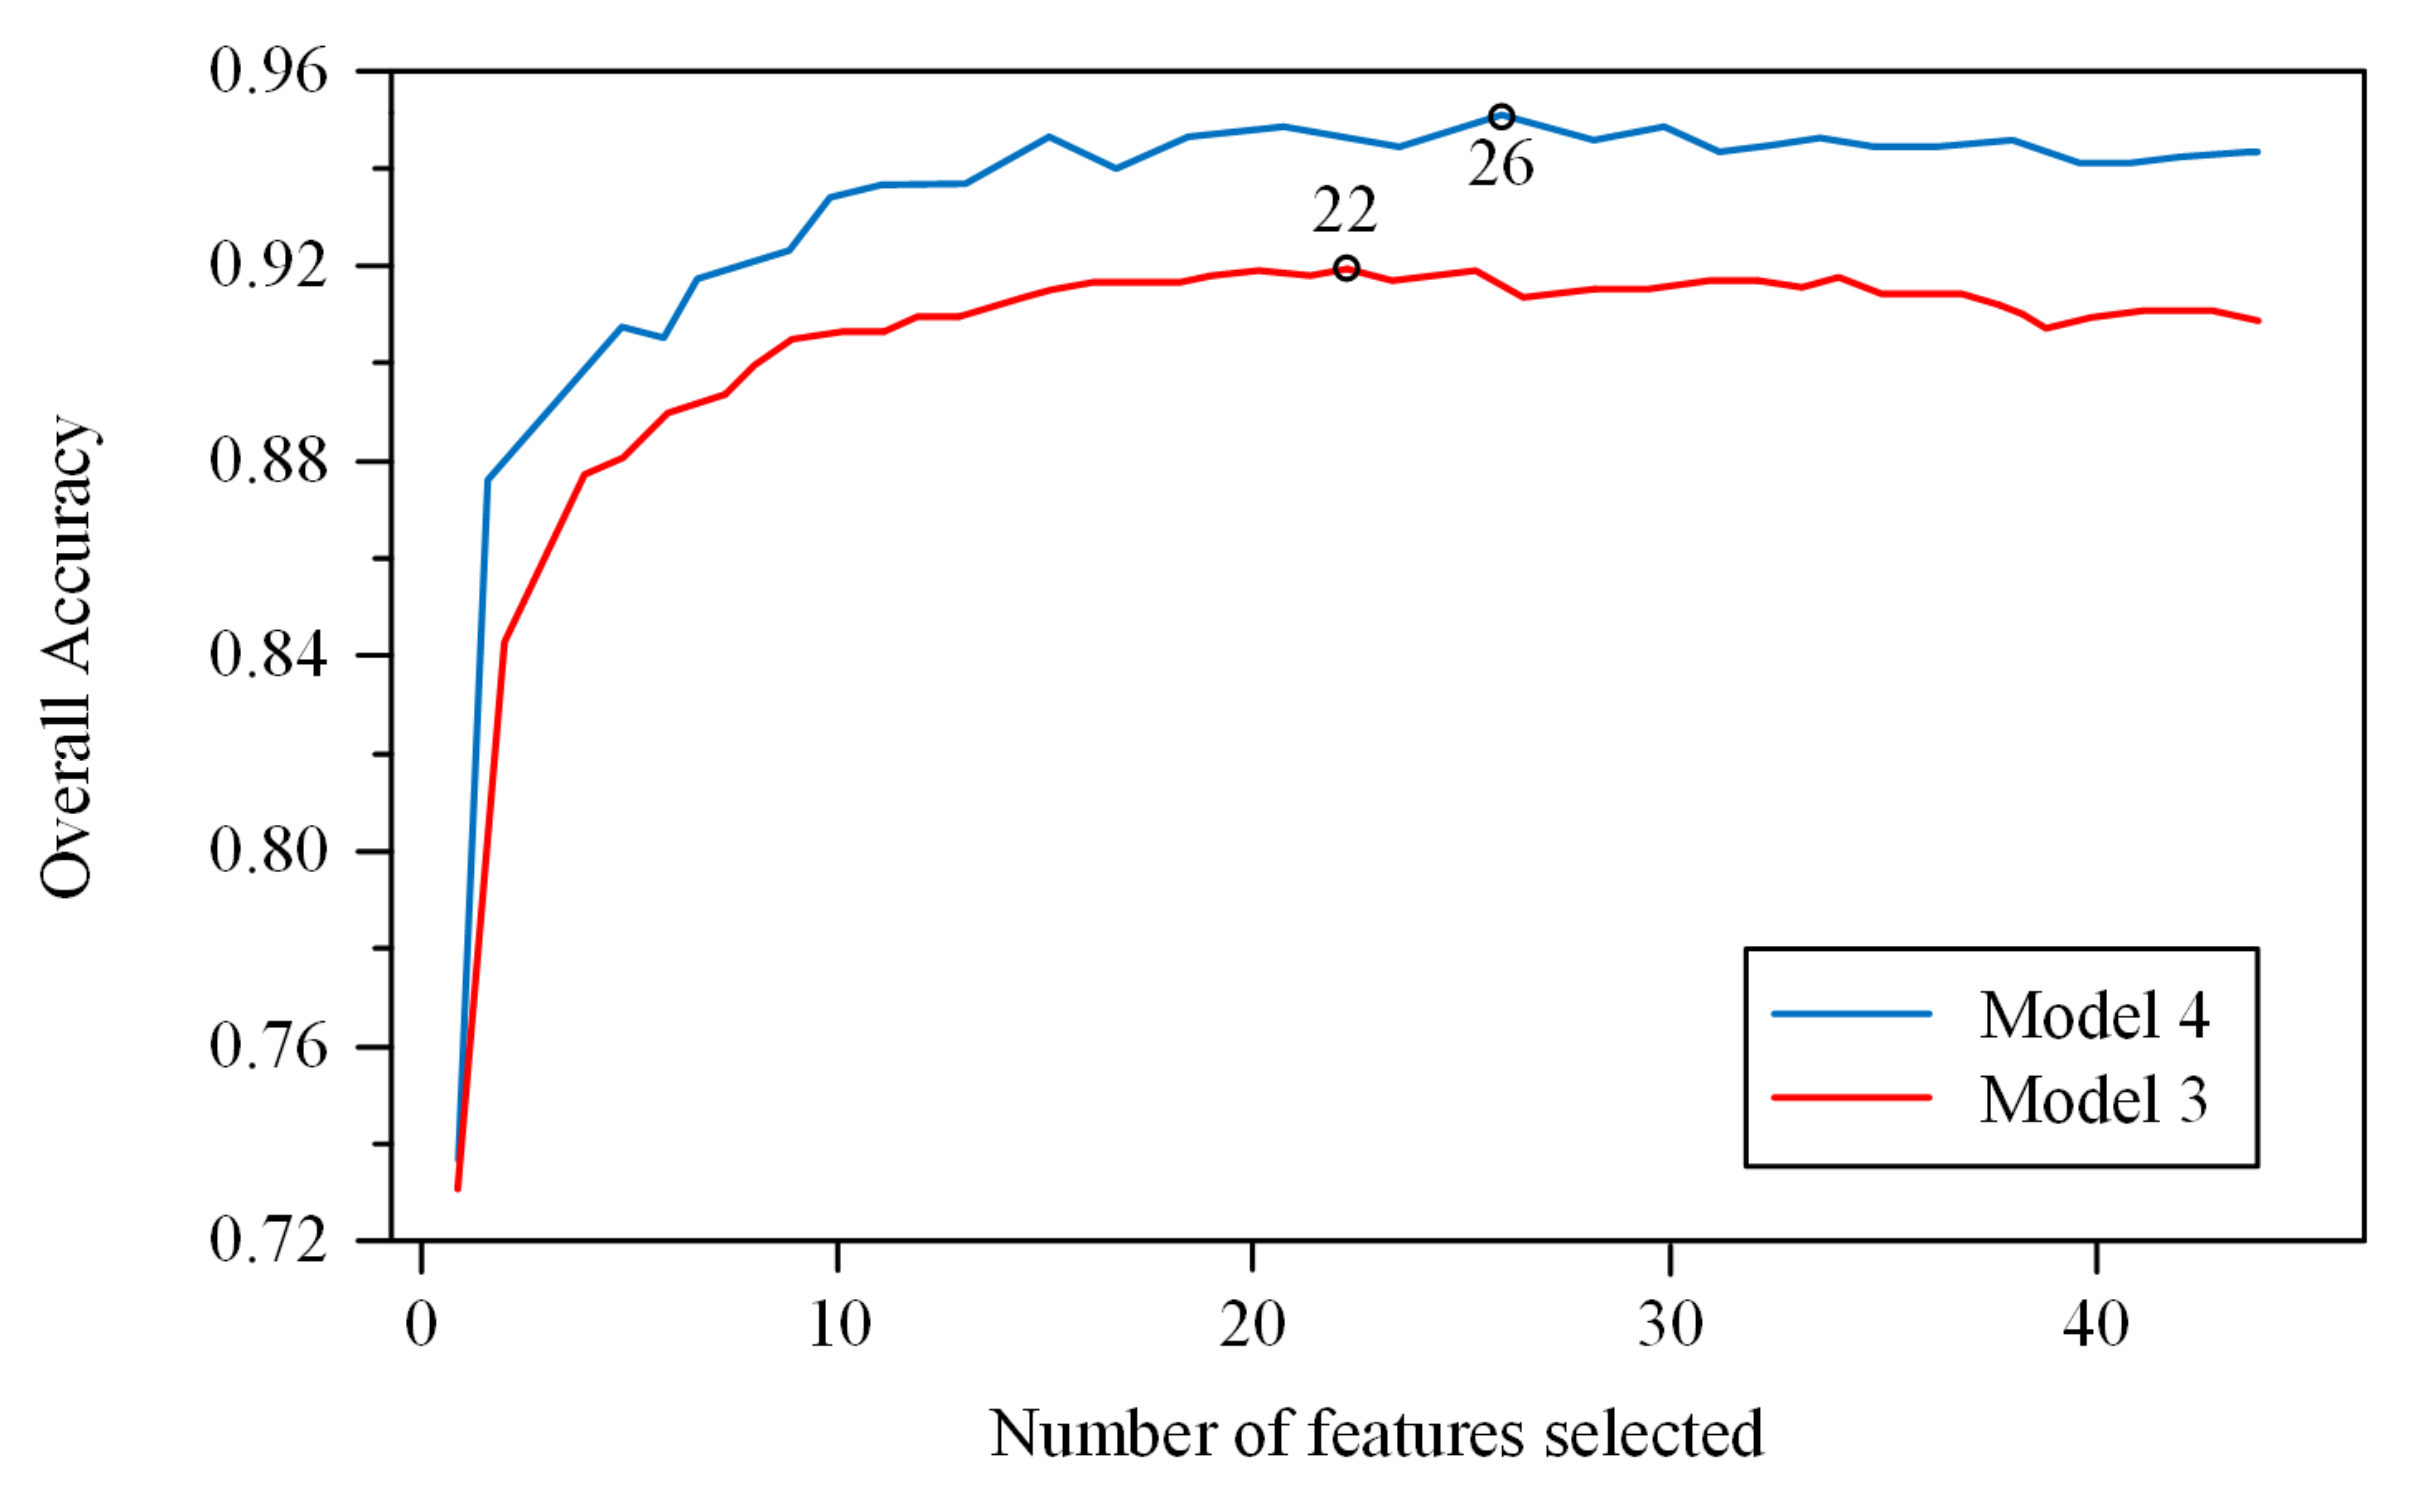
Figure 7 shows the feature selection results. The optimal numbers of features were 22 in Model 3 and 26 in Model 4. Ten features from digital images (red band, green band, blue band, brightness, length/width, shape index, entropy, contrast, homogeneity, and correlation) and 12 features from point clouds (Gap, CC0.2m, H10, H80, H90, H95, H99, HIQ, HAAD, HMean, HSD, and CHM) were selected in Model 3. Ten features from digital images (red band, green band, blue band, brightness, length/width, shape index, entropy, contrast, homogeneity, and correlation) and 16 features from point clouds (D0, D9,
LAI, Gap, CC0.2m, H10, H80, H90, H95, H99, HVAR, HIQ, HAAD, HMean, HSD, and CHM) were selected in Model 4.
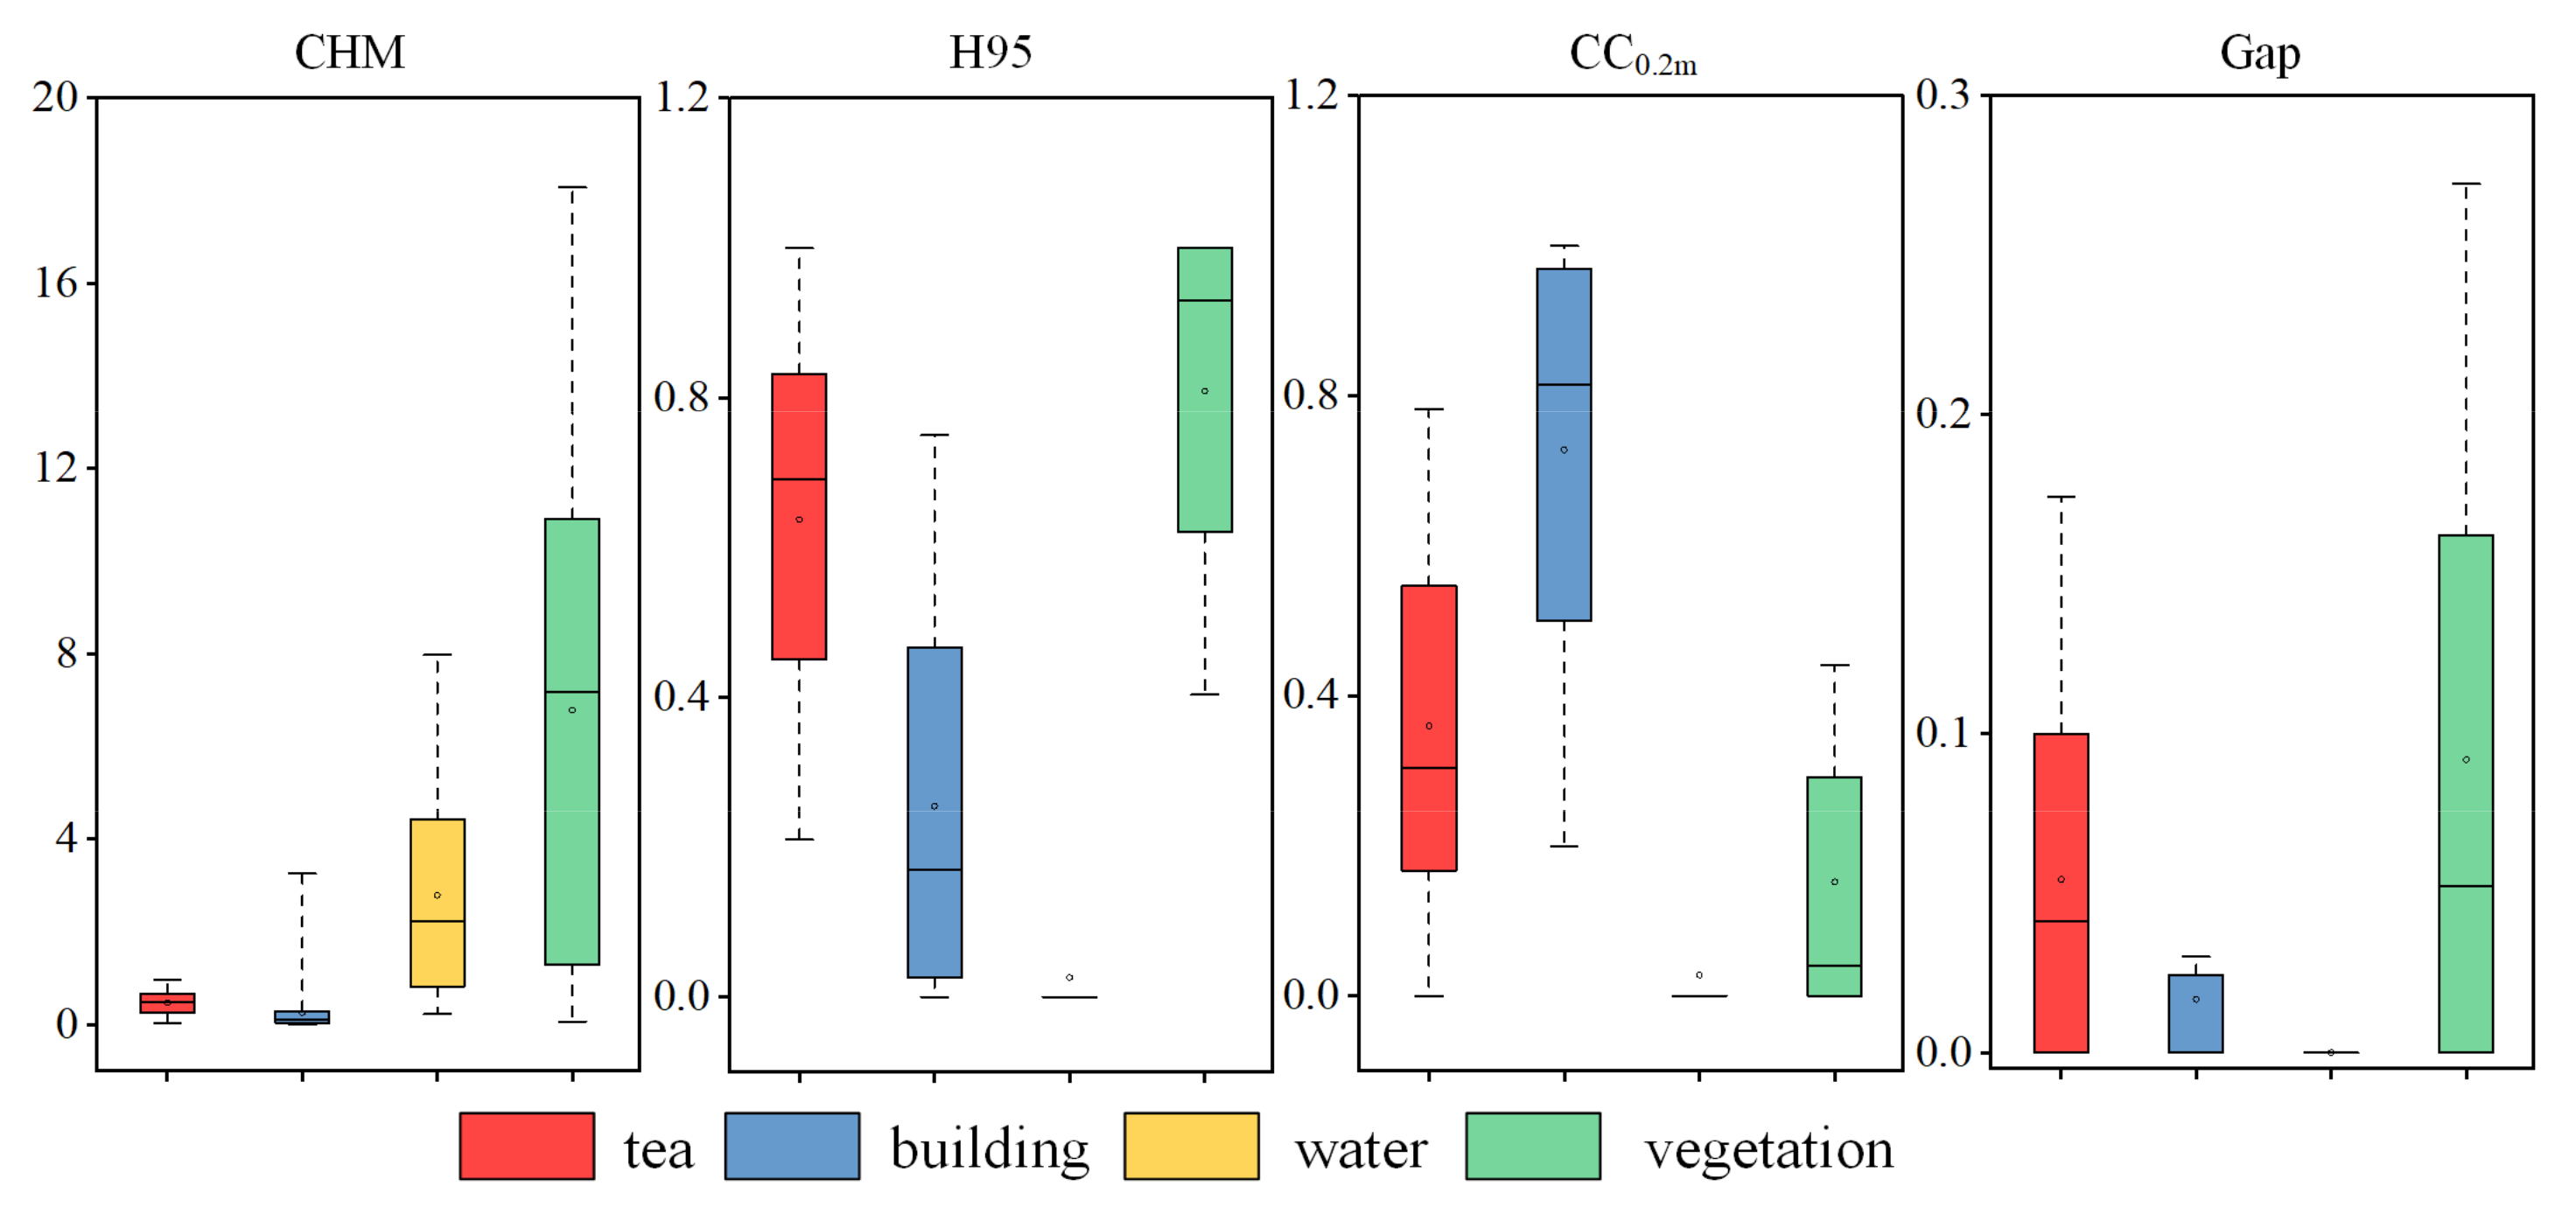
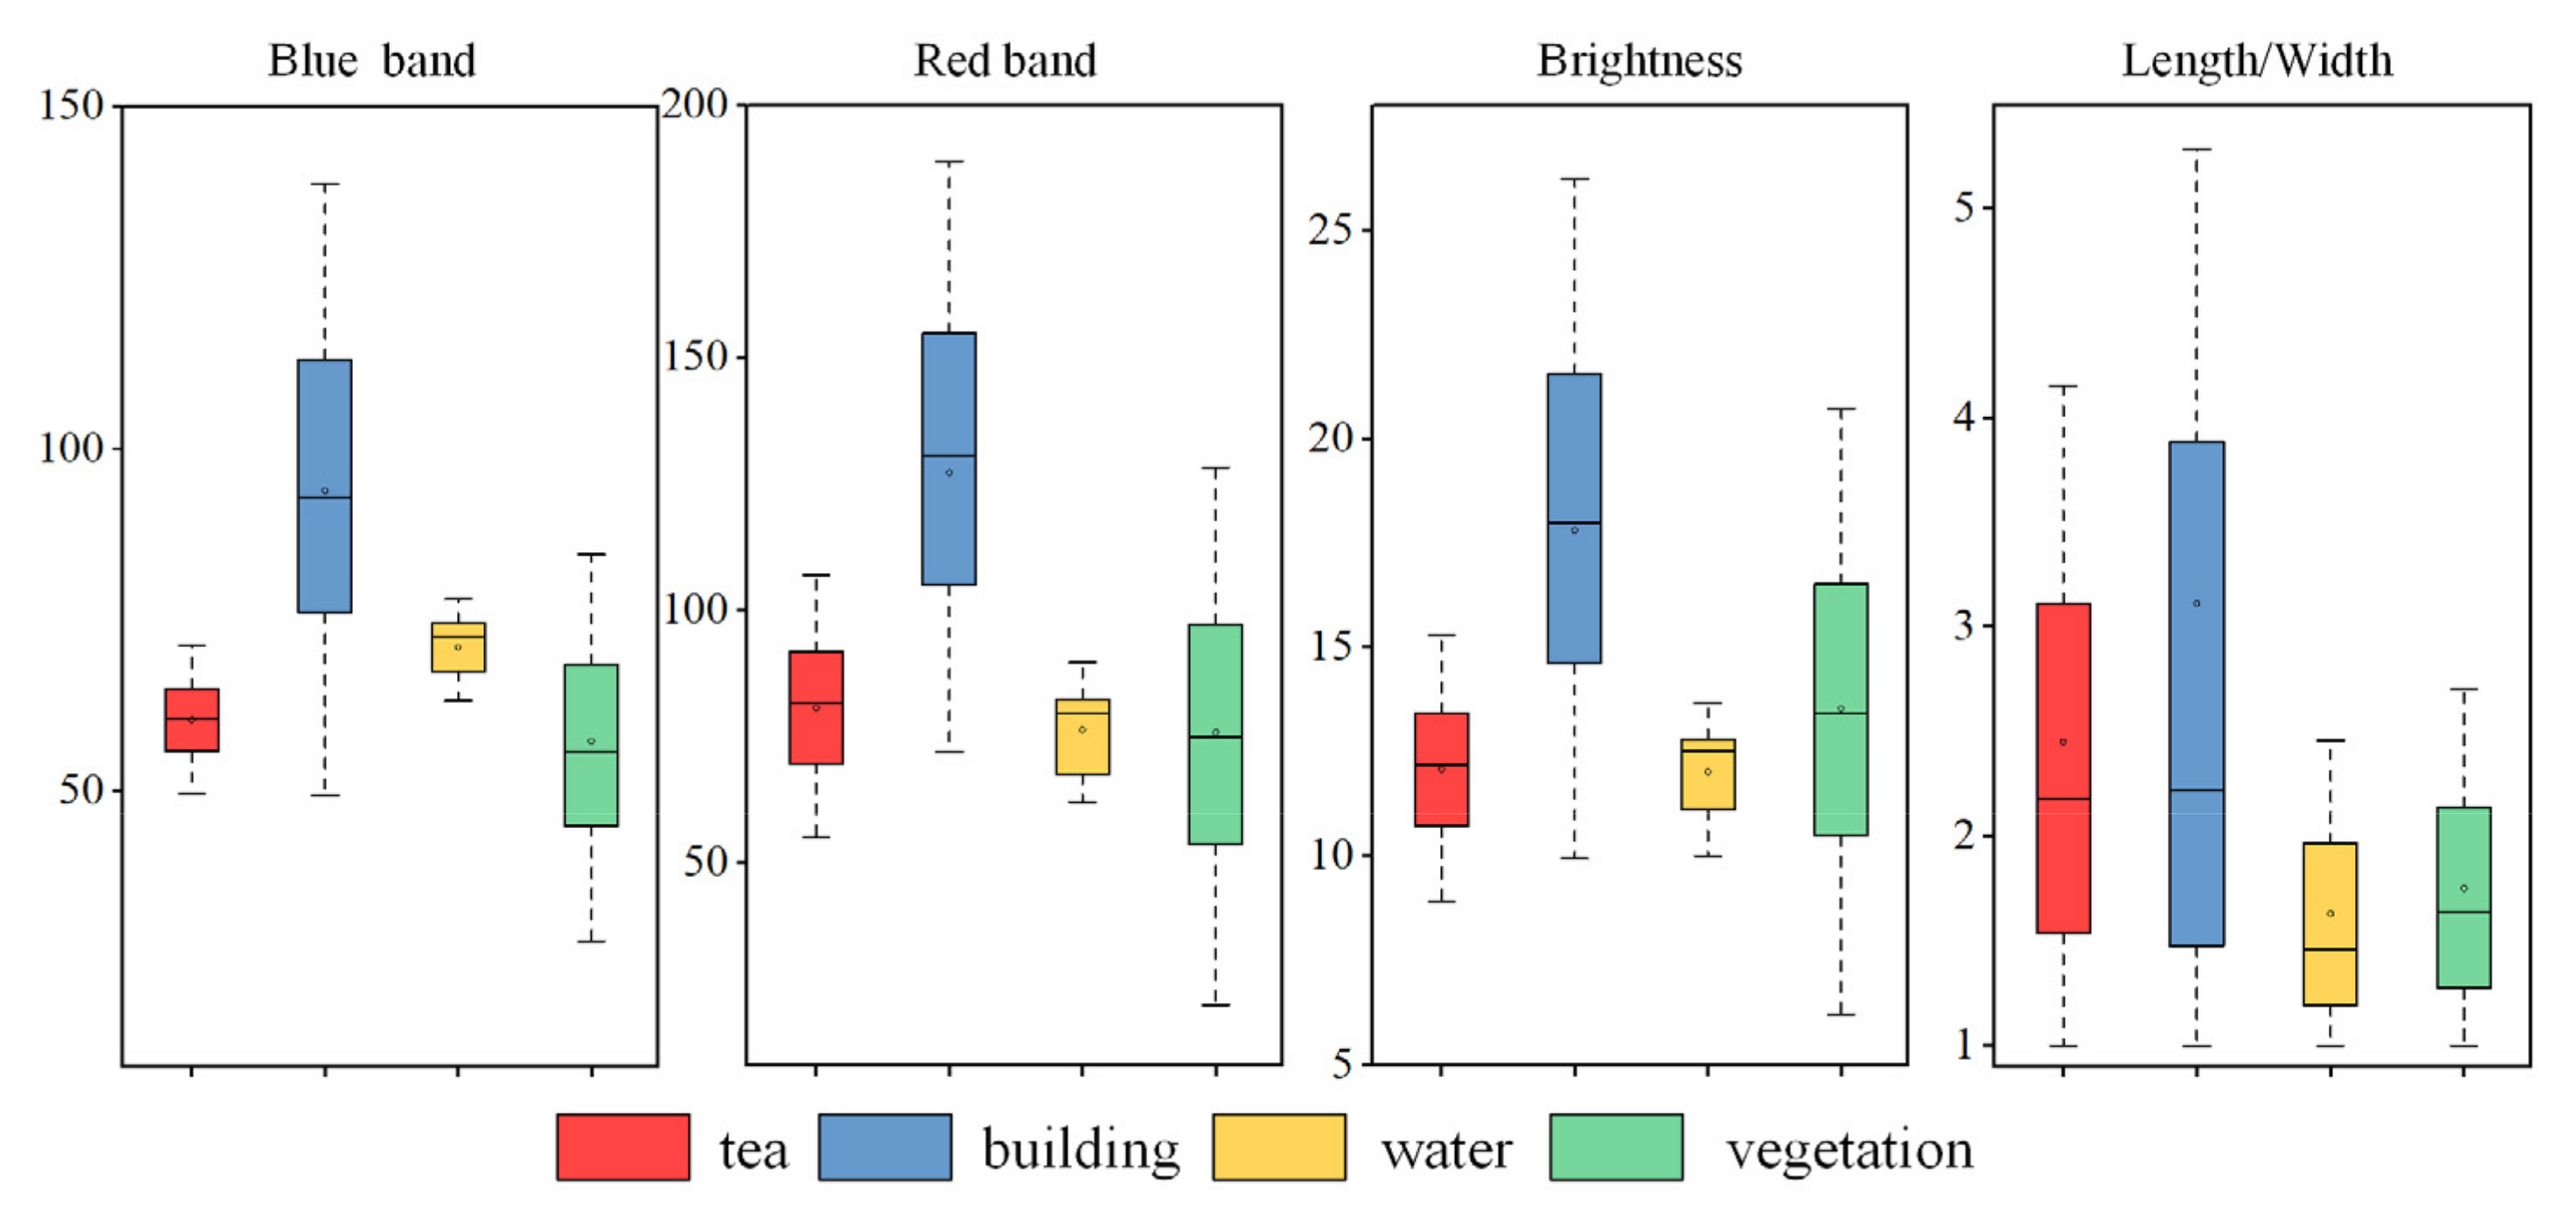
Figure 8 and
Figure 9 portray the differences in the representative lidar and image features among the four classes, respectively. The performance of these features differed significantly among classes. The difference between tea and vegetation was small in the image features, while it was large in the lidar features. The feature selection results showed that lidar features might play important roles in separating tea from vegetation.
3.2. Accuracy Assessment
The classification accuracy results of the four models performed with the RF and SVM algorithms are presented in
Table 4 and
Table 5, respectively.
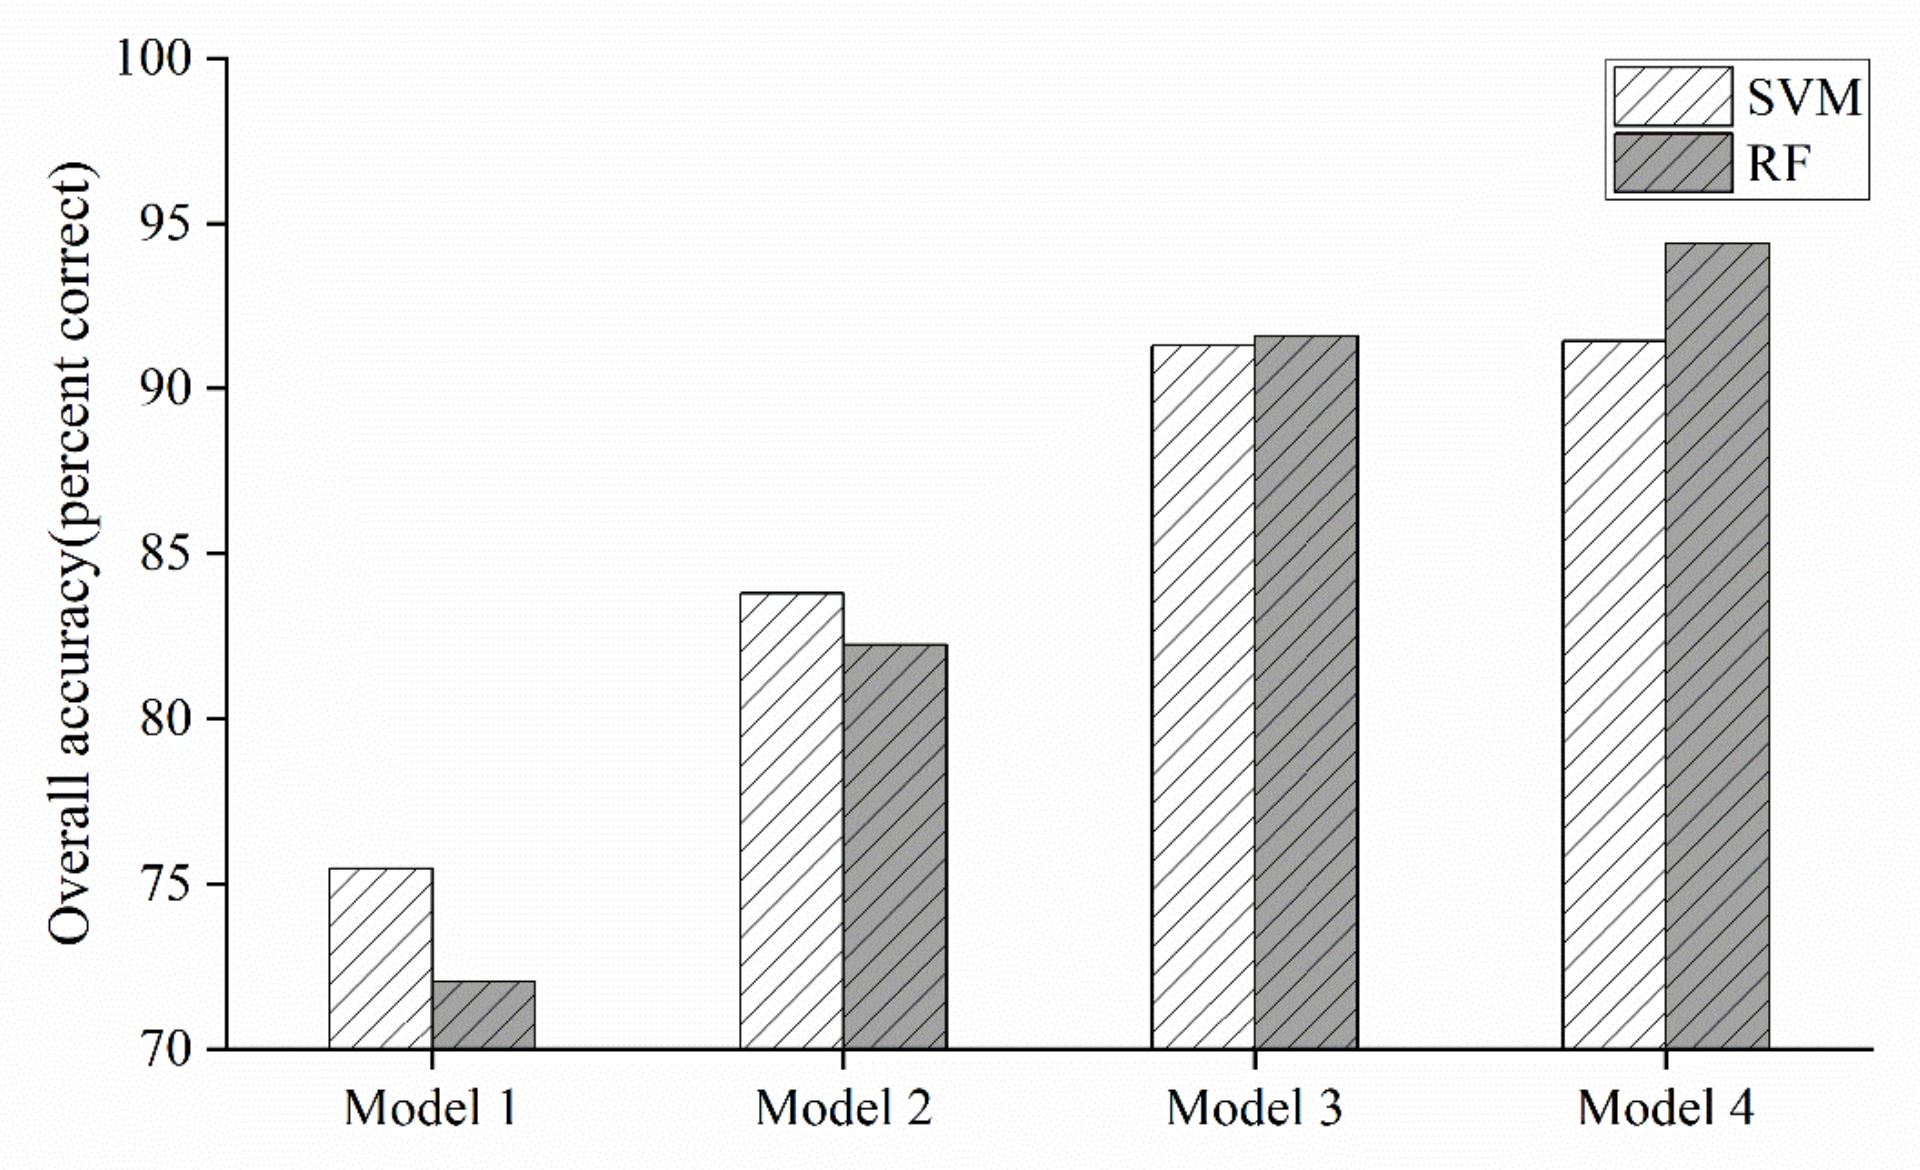
Overall, Model 4 achieved the highest classification accuracy, followed by Model 3, Model 2, and Model 1. The SVM-based and RF-based classifications performed similarly in terms of the overall classification accuracies. The highest accuracy (94.39%) was achieved by Model 4 using the RF algorithm.
Model 1 produced lower user accuracies for tea, vegetation, and water than those produced by the other models. The classification results obtained using only the spectral features (Model 1) showed that SVM and RF produced low overall accuracies (75.47% and 72.04%). In Model 2, with the textural features added, the accuracies of tea and vegetation were improved but did not exceed 85%. In Model 2, RF could better identify buildings, tea, and water than SVM, while SVM outperformed RF in identifying vegetation.
Regarding Model 3, with the photogrammetric point clouds further added, the classification accuracies of all four classes increased, with tea and vegetation showing the most significant accuracy improvement effects. For Model 4, features from the lidar point clouds were used instead of the photogrammetric point clouds used in Model 3. The SVM and RF algorithms produced overall accuracies for Model 4 of 91.43% (kappa: 0.86) and 94.39% (kappa: 0.91), respectively. Model 4 had a slightly higher accuracy than Model 3. The accuracies of Model 4 and Model 3 were similar when the SVM algorithm was used, while the accuracy of Model 4 was 2.81% higher than that of Model 3 when the RF algorithm was used.
Consequently,
Table 4 and
Table 5 indicate that with the gradual addition of features, the PA and UA of each class gradually and significantly improve overall. The PA and UA of tea over 85% were only achieved using the random forest algorithm in Model 3 and Model 4.
Figure 10 shows a comparison of the overall accuracies of the four models as assessed with the two machine learning algorithms. Overall, SVM and RF produced similar results. For Model 1 and Model 2, SVM (OA: 75.47% and 83.80%, respectively) identified slightly better accuracies than RF (OA: 72.04% and 82.25%, respectively); for Model 3 and Model 4, RF (91.58% and 94.39%, respectively) outperformed SVM (91.32% and 91.43%, respectively).
3.3. Visual Assessment
3.3.1. Global Assessment
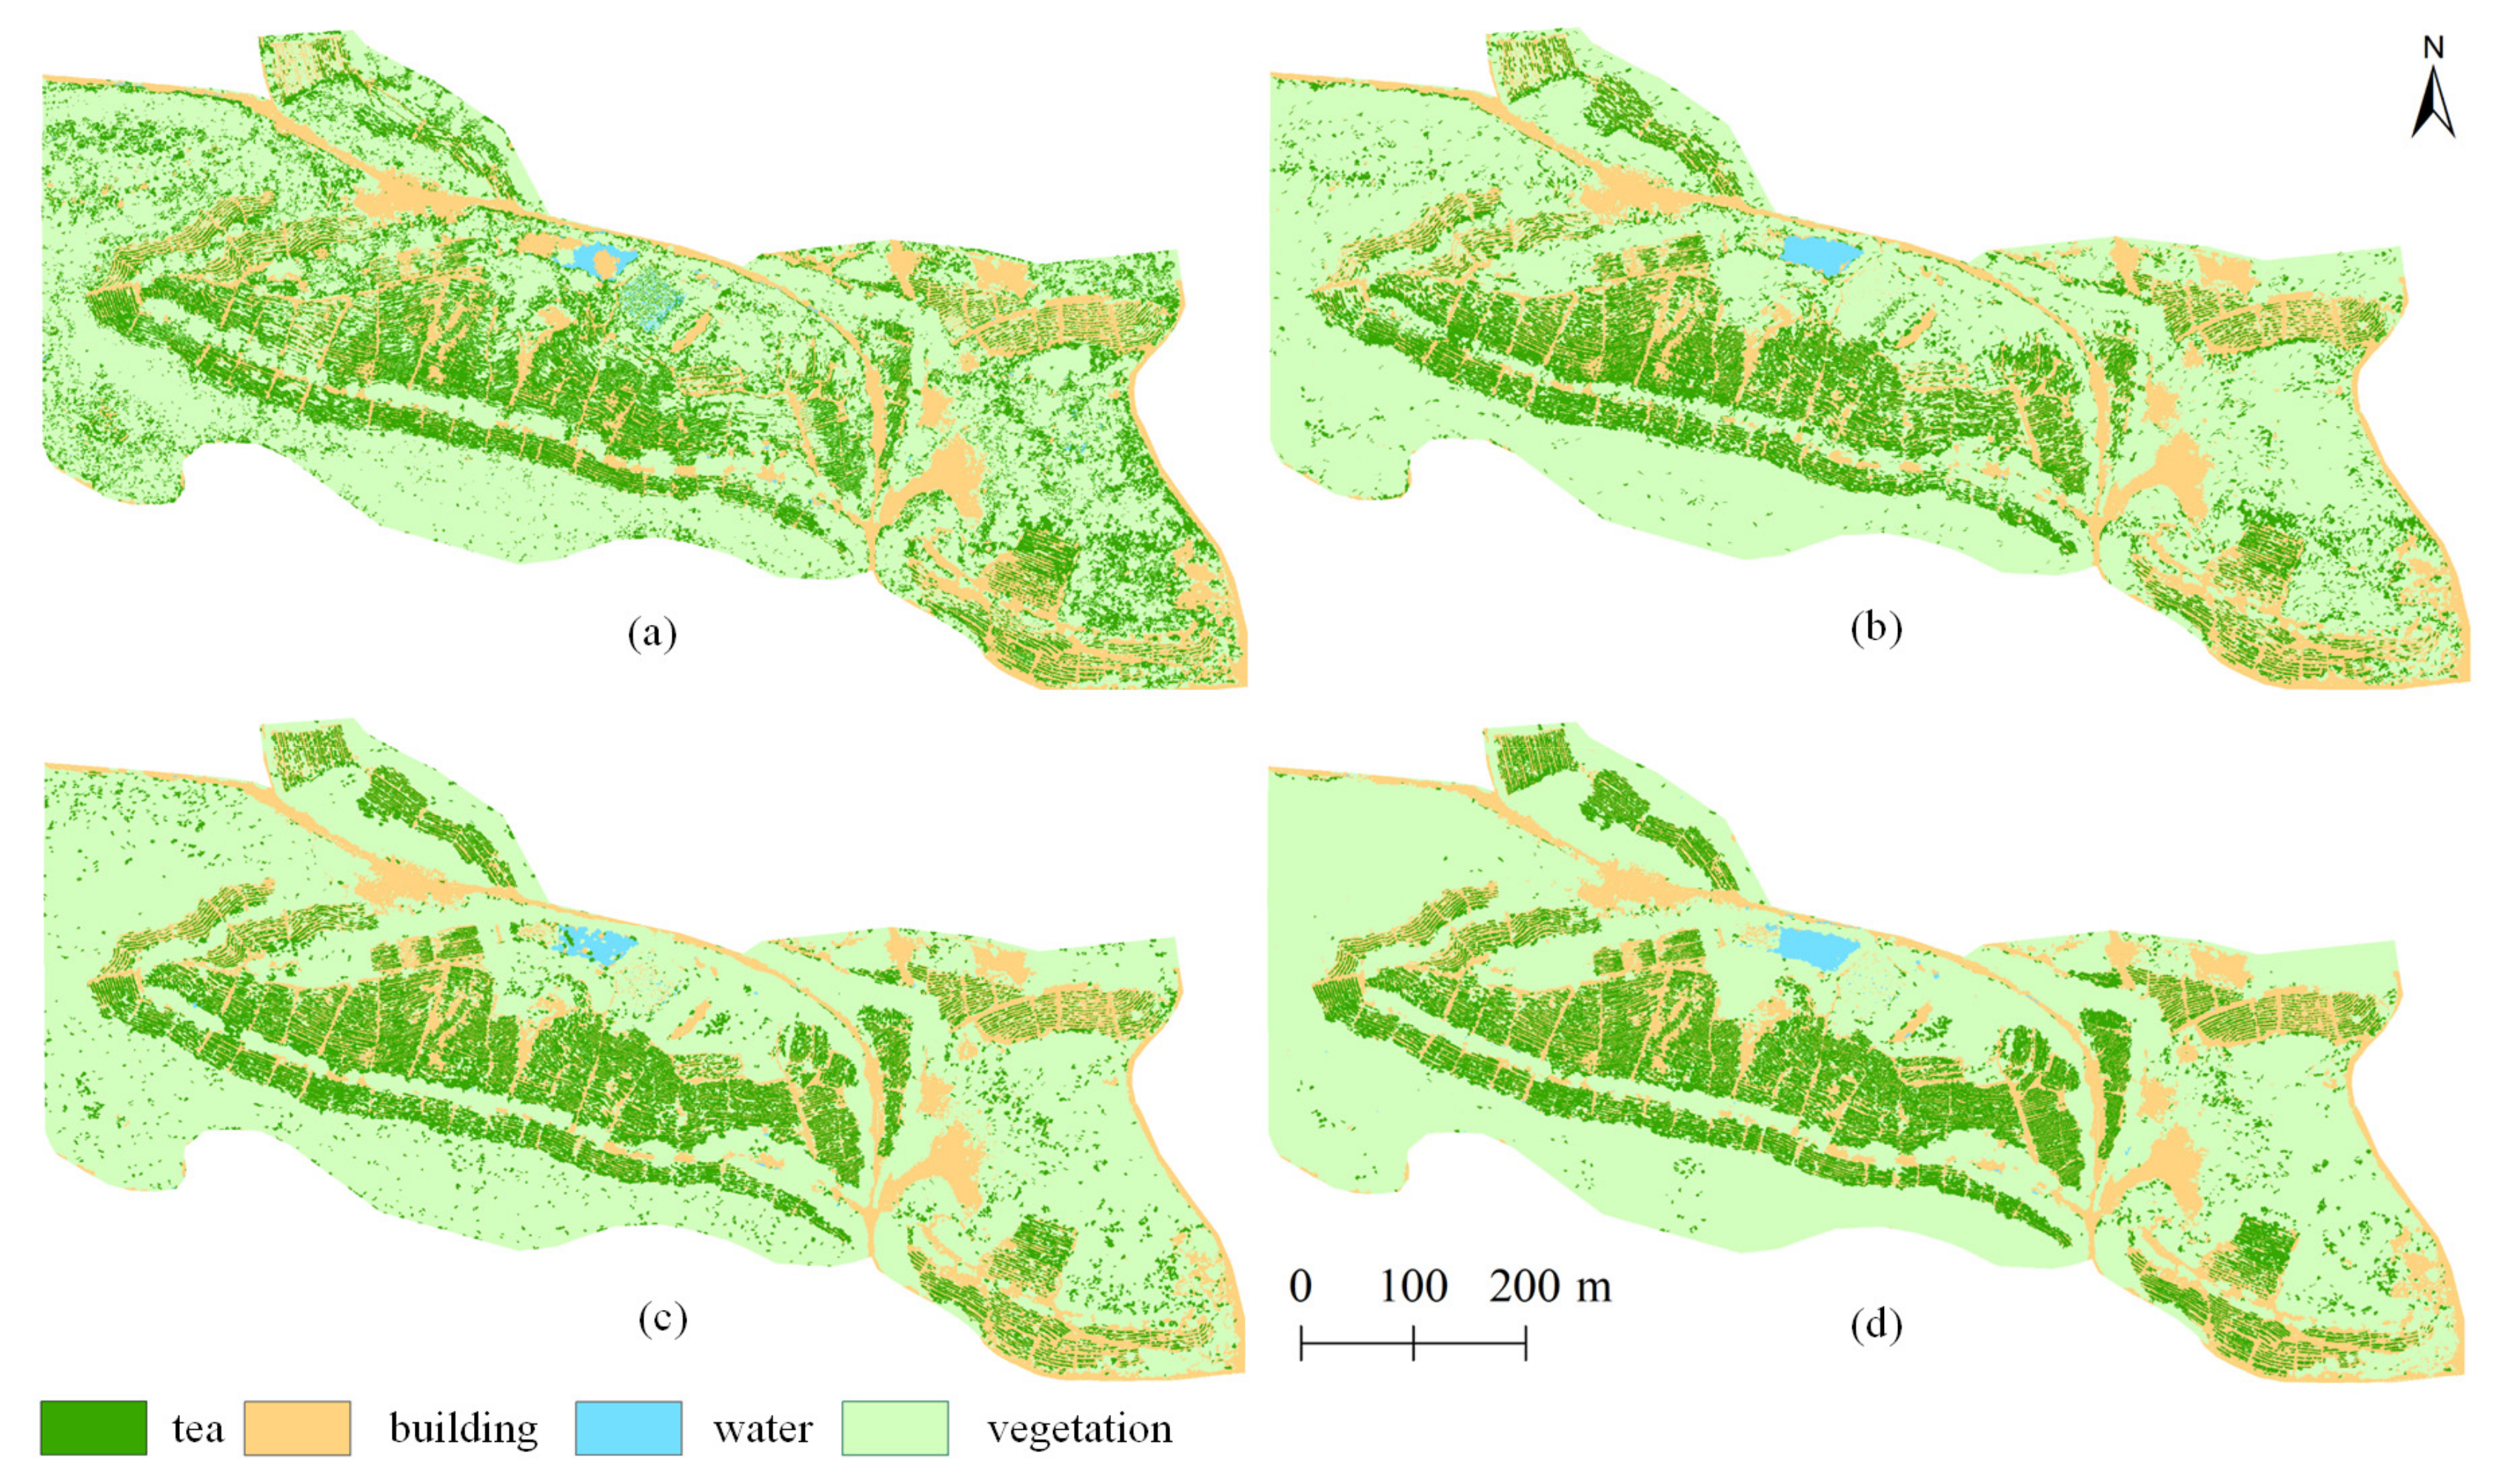
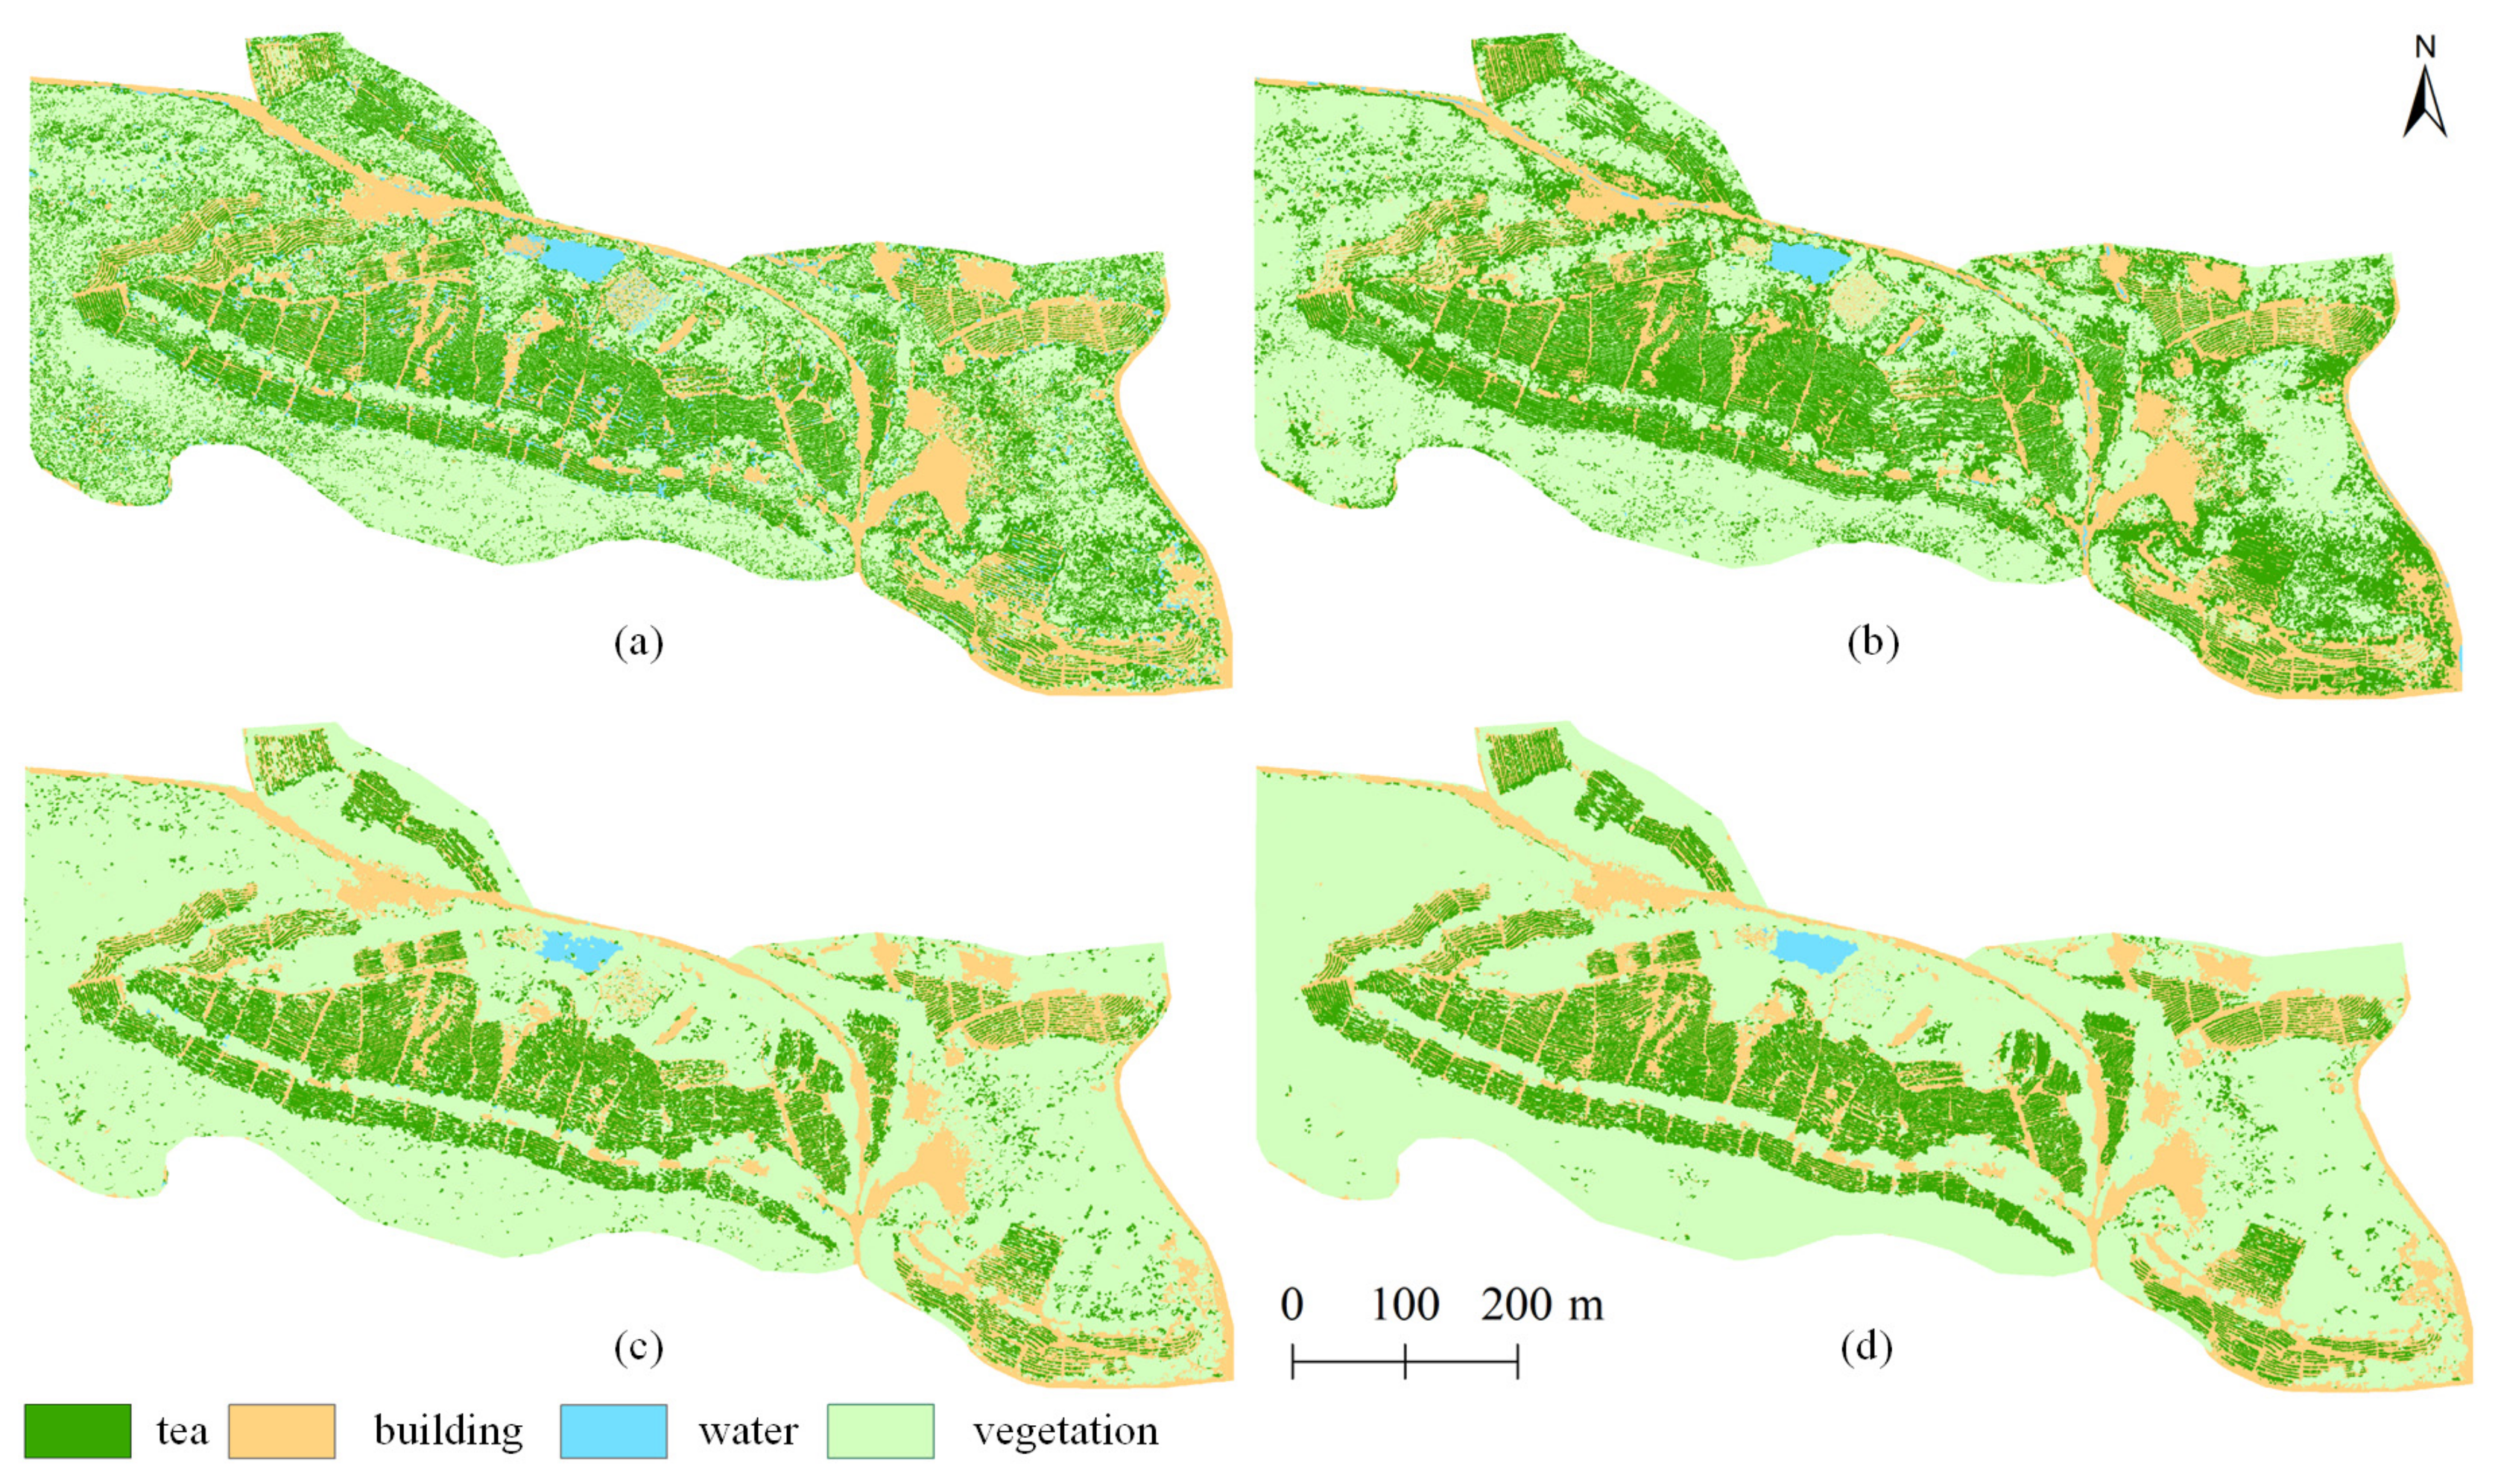
Figure 11 and
Figure 12 portray the classification results of the four models obtained using the SVM and RF algorithms. Model 3 and Model 4 performed better than Model 1 and Model 2. Both Model 3 and Model 4 obtained good classifications of tea and vegetation and output almost no misclassification of water. In contrast, tea and vegetation were roughly distinguished in the results of Model 1 and Model 2, but the two classes were mixed and confused over the whole study area. The use of digital images alone (as in Model 1 and Model 2) is not sufficient to distinguish tea and shrubs, and the addition of combined features from photogrammetric or lidar point clouds can reduce the mix of tea and vegetation. In addition, in Model 1 and Model 2, many nonwater areas were incorrectly identified as water. The main visual differences among the thematic maps generated by the four models lie in the identification of water in the central region of the study area and the identification of vegetation in the northwestern region of the study area. These two areas were further used for local visual comparisons.
3.3.2. Local Assessment
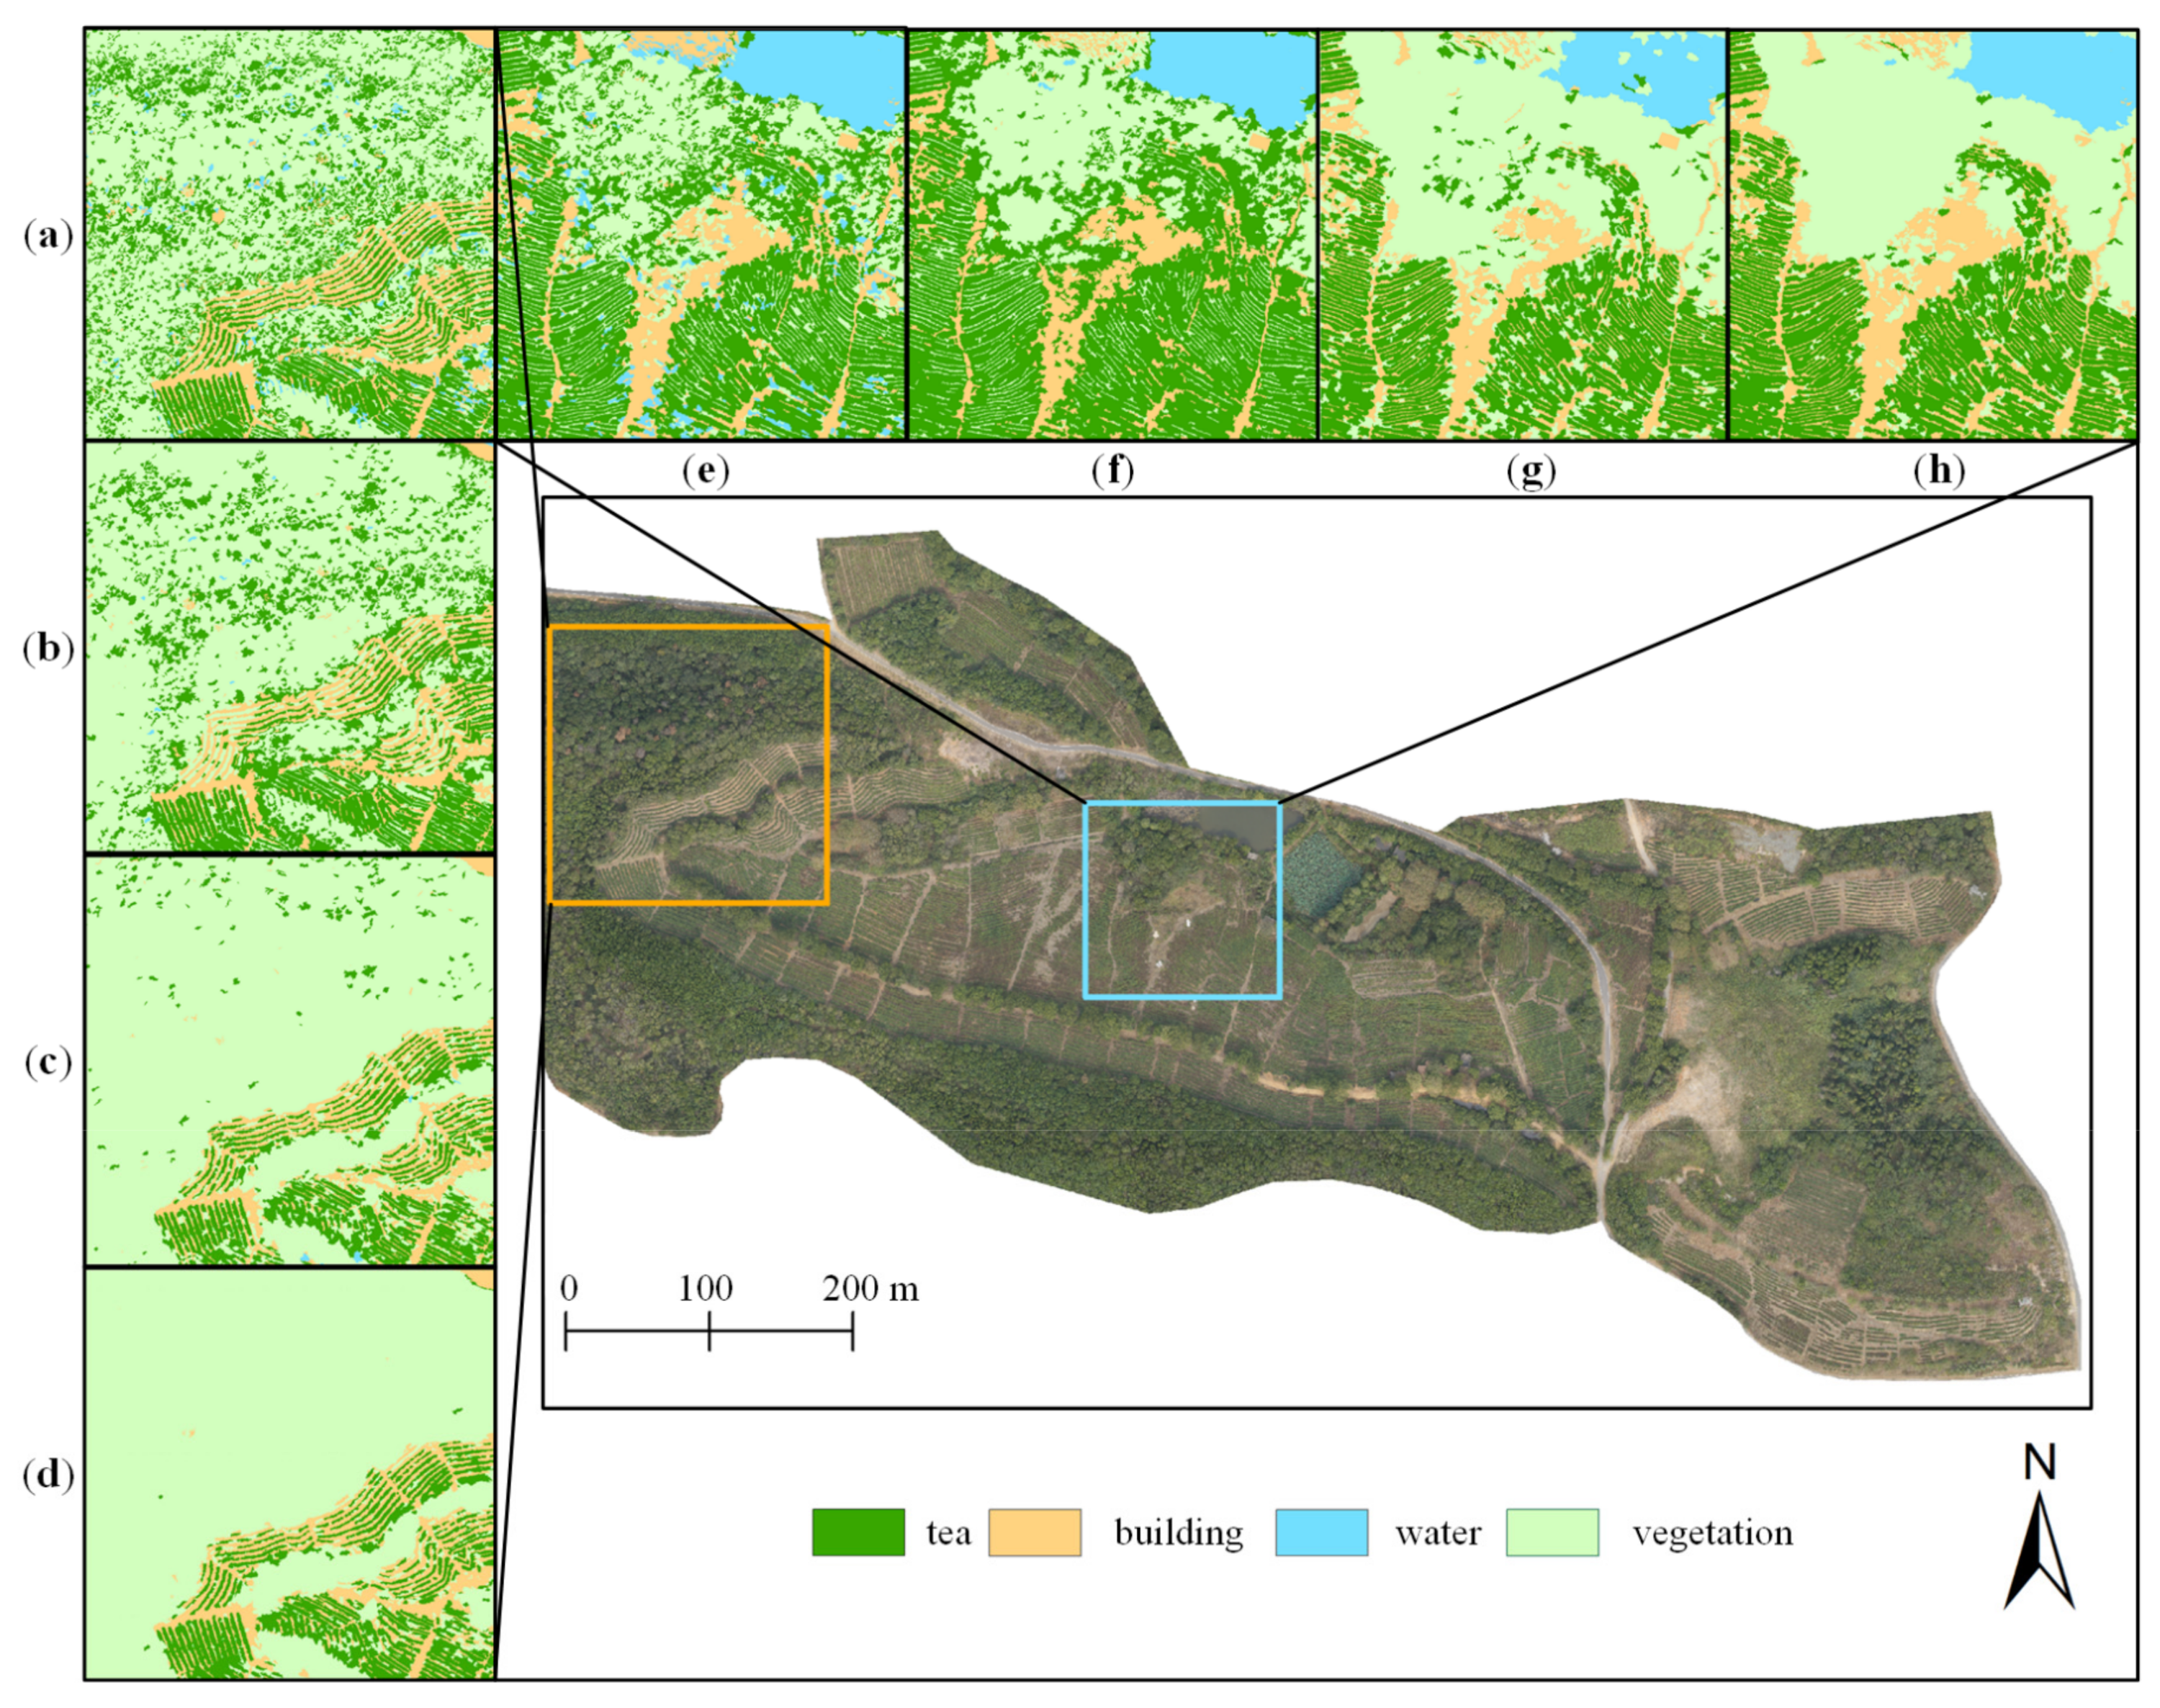
The local visual assessment indicated that the classification maps of Model 4 were more closely aligned with the realistic ground conditions than those of the other models and significantly decreased the possibility of salt-and-pepper noise. After adding the features from point clouds in Model 3 and Model 4, the results showed fewer errors in the classification of complex vegetation in the northwest region of the study area (
Figure 13a–d). Model 1 and Model 2 misclassified shrubs as tea plants in these areas. The results indicated that the combination of features from point clouds provided more discriminative information than digital imagery used alone. When point cloud features were incorporated, the classifications between tea and nontea plants became more accurate. The confusing phenomenon of tea and vegetation observed in the outputs of Model 1 and Model 2 (
Figure 13a,b,e,f) was greatly improved in Model 3 and Model 4 (
Figure 13c,d,g,h). In addition, water was well identified by Model 3 and Model 4. Due to the lack of vertical information, some species were incorrectly identified as water by Model 1 and Model 2. In Model 3 and Model 4, the accuracy of water was enhanced by the incorporation of height metrics. Furthermore, the visual effects of Model 4 were still better than those of Model 3, indicating that photogrammetric point clouds cannot be used as a complete substitute for lidar point clouds, although the accuracy difference was not significant.
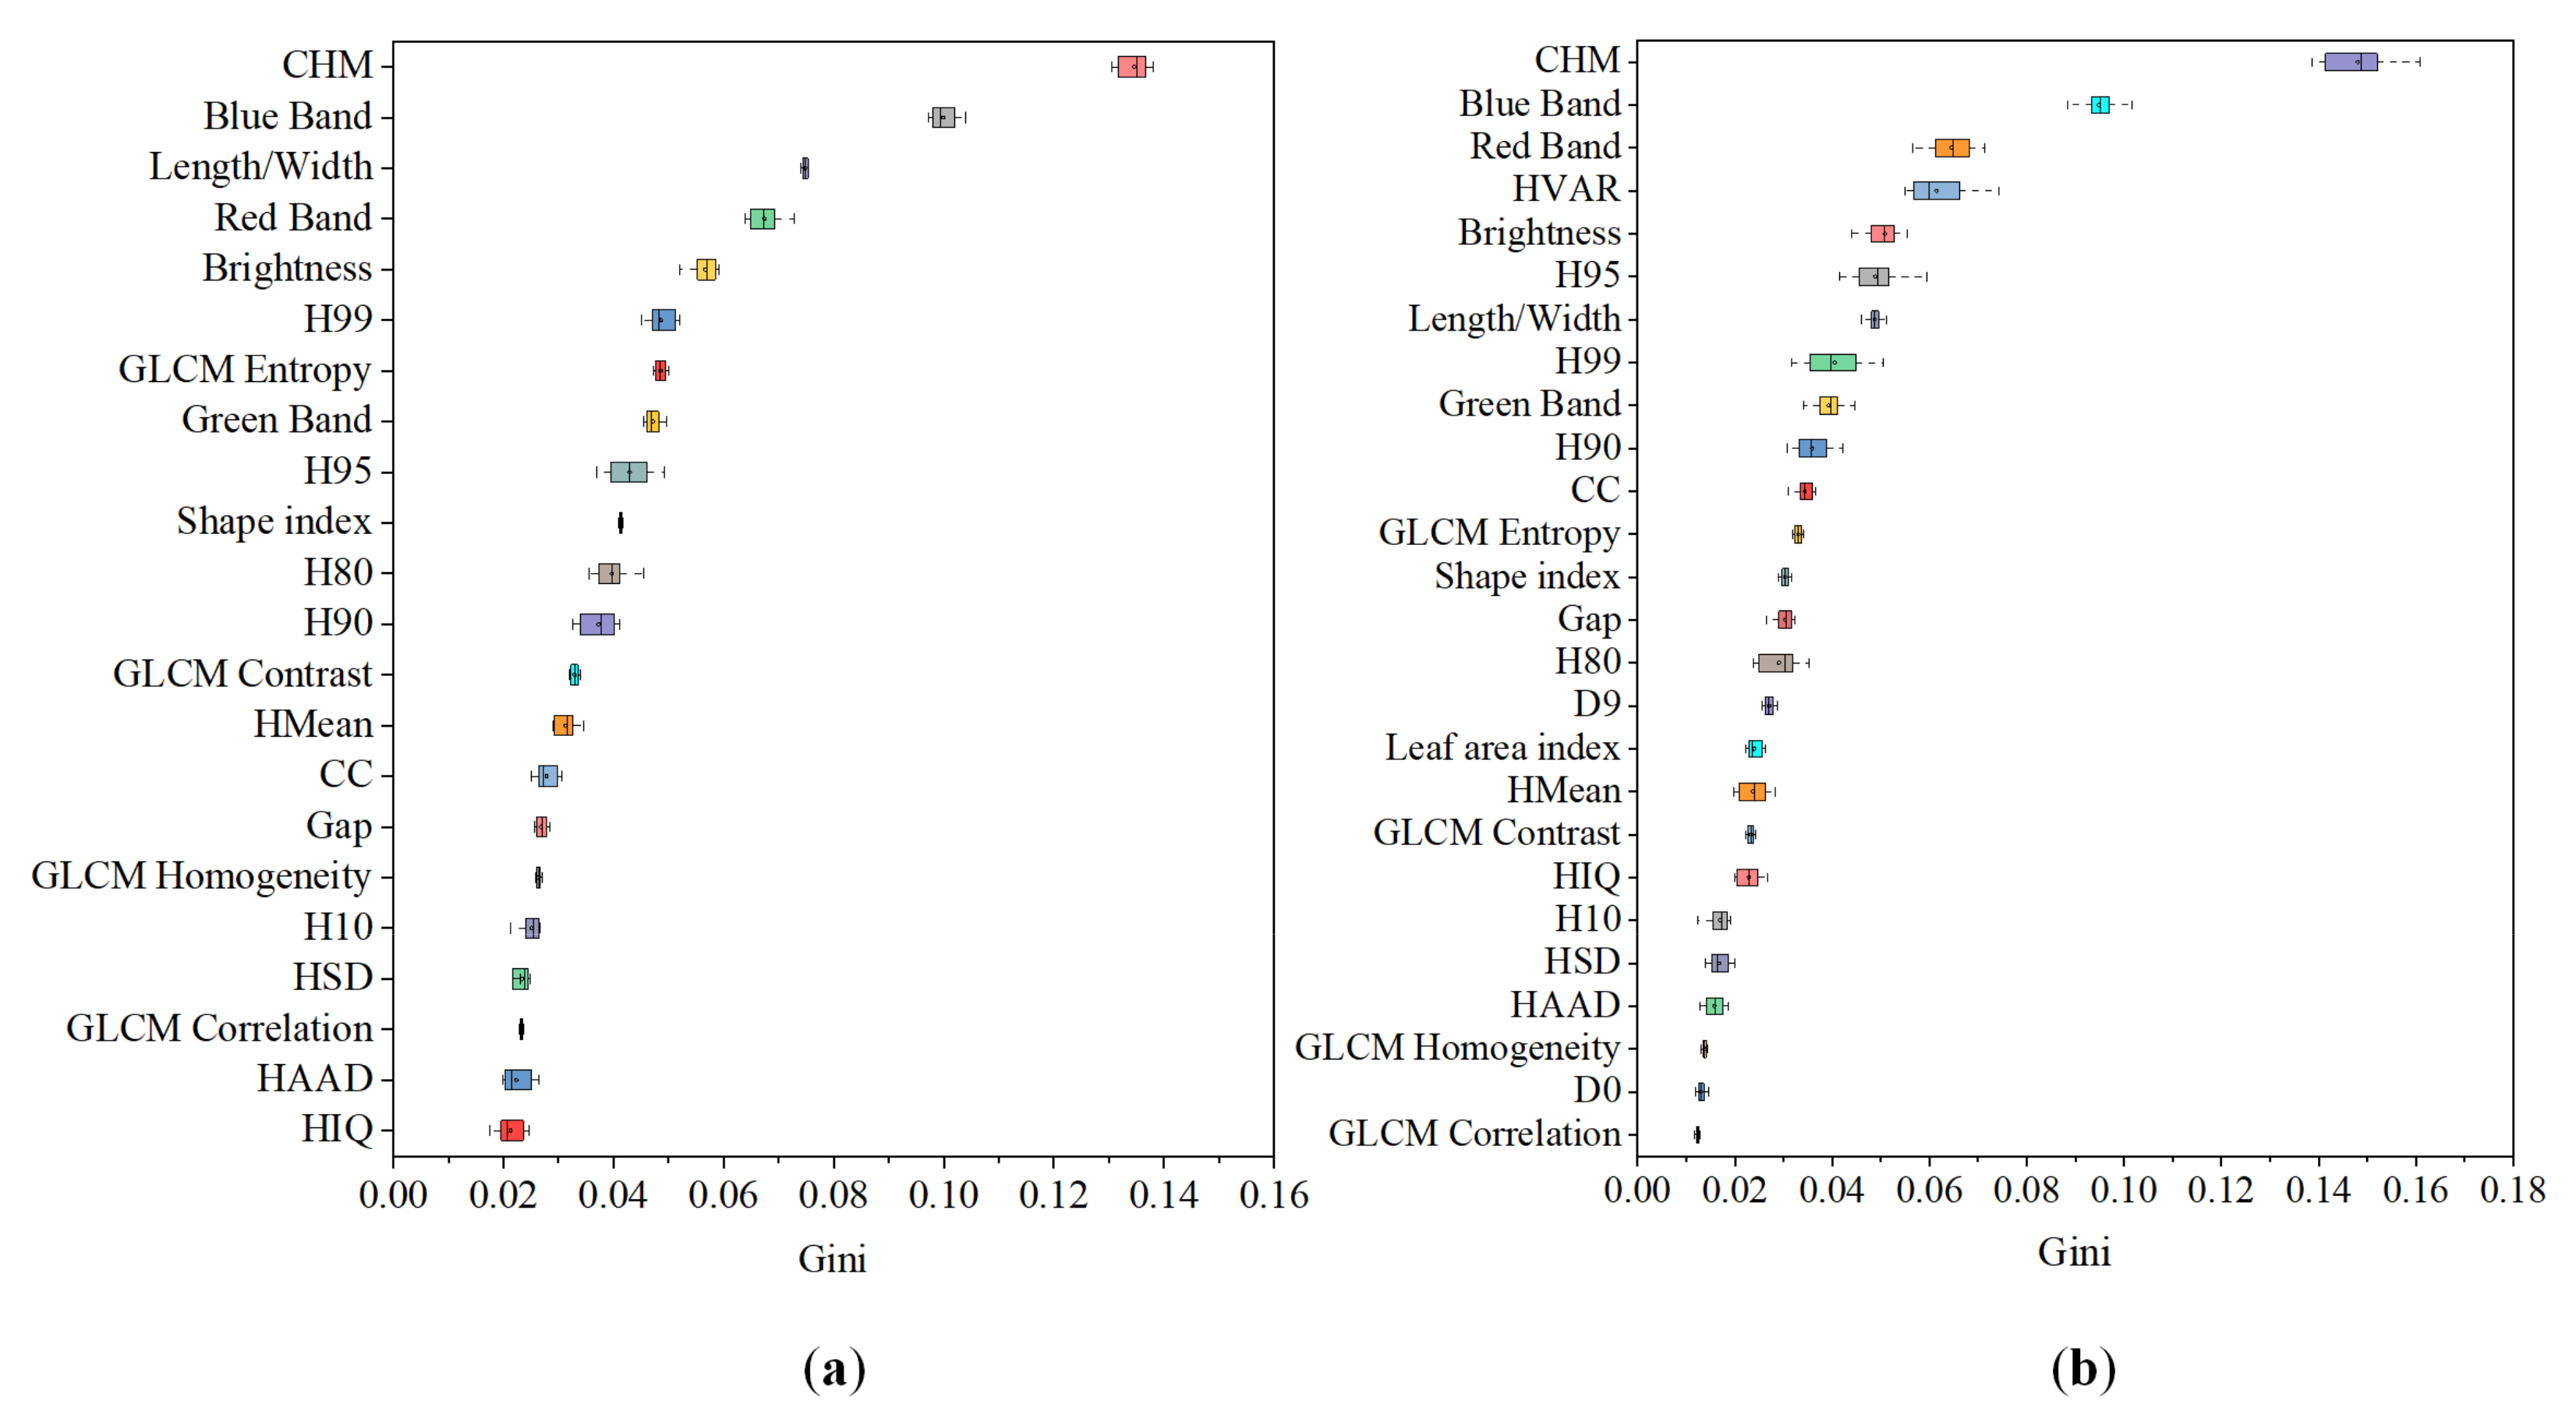
3.4. Feature Importance
The feature importance was assessed in Model 3 and Model 4 using the RF algorithm (
Figure 14). The results were similar between the two models. The canopy height model derived from the point clouds and the blue band were the two most important features for tea plucking area identification in both Model 3 and Model 4. In Model 3, the length/width and the red band were ranked third and fourth, respectively. In Model 4, the red band and HVAR were ranked third and fourth, respectively, followed by the brightness and H95. The textural features and density features derived from the point clouds were of low importance overall.
3.5. Cost–Benefit Analysis
The equipment, time, and costs required to map the plucking area of a 10 km
2 tea plantation four times (such as for monitoring changes over the four seasons) by Model 3, Model 4, and traditional on-ground survey methods are listed in
Table 6. The costs were estimated in USD/km² based on the average salary provided for mapping and surveying fields in China. Overall, the on-ground survey methods cost 61,700 USD/km
2, while the methods using UAV data perform more cost-effectively (14,397 USD/km
2 for UAV images and 35,461 USD/km
2 for the integration of UAV images and lidar). The on-ground survey method is similar to digital mapping and surveying, in which RTK is used to determine the positions of feature points and the boundary of each tea plucking area. The time required for mapping a 10-km² tea plantation four times was 128 person-hours using the UAV image method and 448 person-hours using the method fusing UAV images and lidar. Furthermore, collecting and processing UAV lidar requires more time and higher professional skills compared to UAV images alone. UAV-based methods had higher efficiencies than on-ground measurements (1600 person-hours).
4. Discussion
This study has demonstrated the ability of UAV-derived remote sensing data to identify and map the plucking area of tea plantations. To systematically explore the potential of UAV remote sensing in mapping the plucking area of tea plantations, four classification models were designed based on different UAV remotely sensed data with different features. The results indicated that the integration of UAV-derived digital images and point clouds (photogrammetric point clouds or lidar point clouds) could accurately identify the plucking area of tea plantations with accuracies higher than 90%. This is the first study focusing on mapping the plucking area of tea plantations. Additionally, the costs of different UAV-based methods used to map the plucking area of tea plantations were calculated and discussed.
4.1. Model and Classification Algorithm Analyses
UAVs and digital cameras are currently widely available. However, the drawbacks of digital imagery-based models (Model 1s and 2) were that there were obvious overestimations of tea plantations in the resultant maps with moderate accuracies (70–83%). In addition, tea trees and the surrounding woodlands (such as shrubs and some other woody vegetation types) were easily confused by these models, especially in arbor–shrub–arbor areas where shrubs grow between arbor trees (
Figure 15b). In that case, the vegetation was incorrectly identified as tea because of the interspersed growth of shrubs and arbor trees. Similar spectral features and inconspicuous textural features led to misclassifications in Model 1 and Model 2. As a result, the measured plucking area of tea plantations might differ significantly from the actual situation. However, this phenomenon did not occur in vast stretches of shrublands because of the significant differences in shrublands’ textural and spatial features compared with those of tea plantations. Additionally, the digital imagery did not contain the near-infrared or red-edge bands that serve as essential spectral information in demarcating vegetation [
29]. With the launch of consumer-grade multispectral UAVs, such as the DJI P4 Multispectral UAV (DJ, Shenzhen, China) with red-edge and near-infrared bands, this problem can be solved.
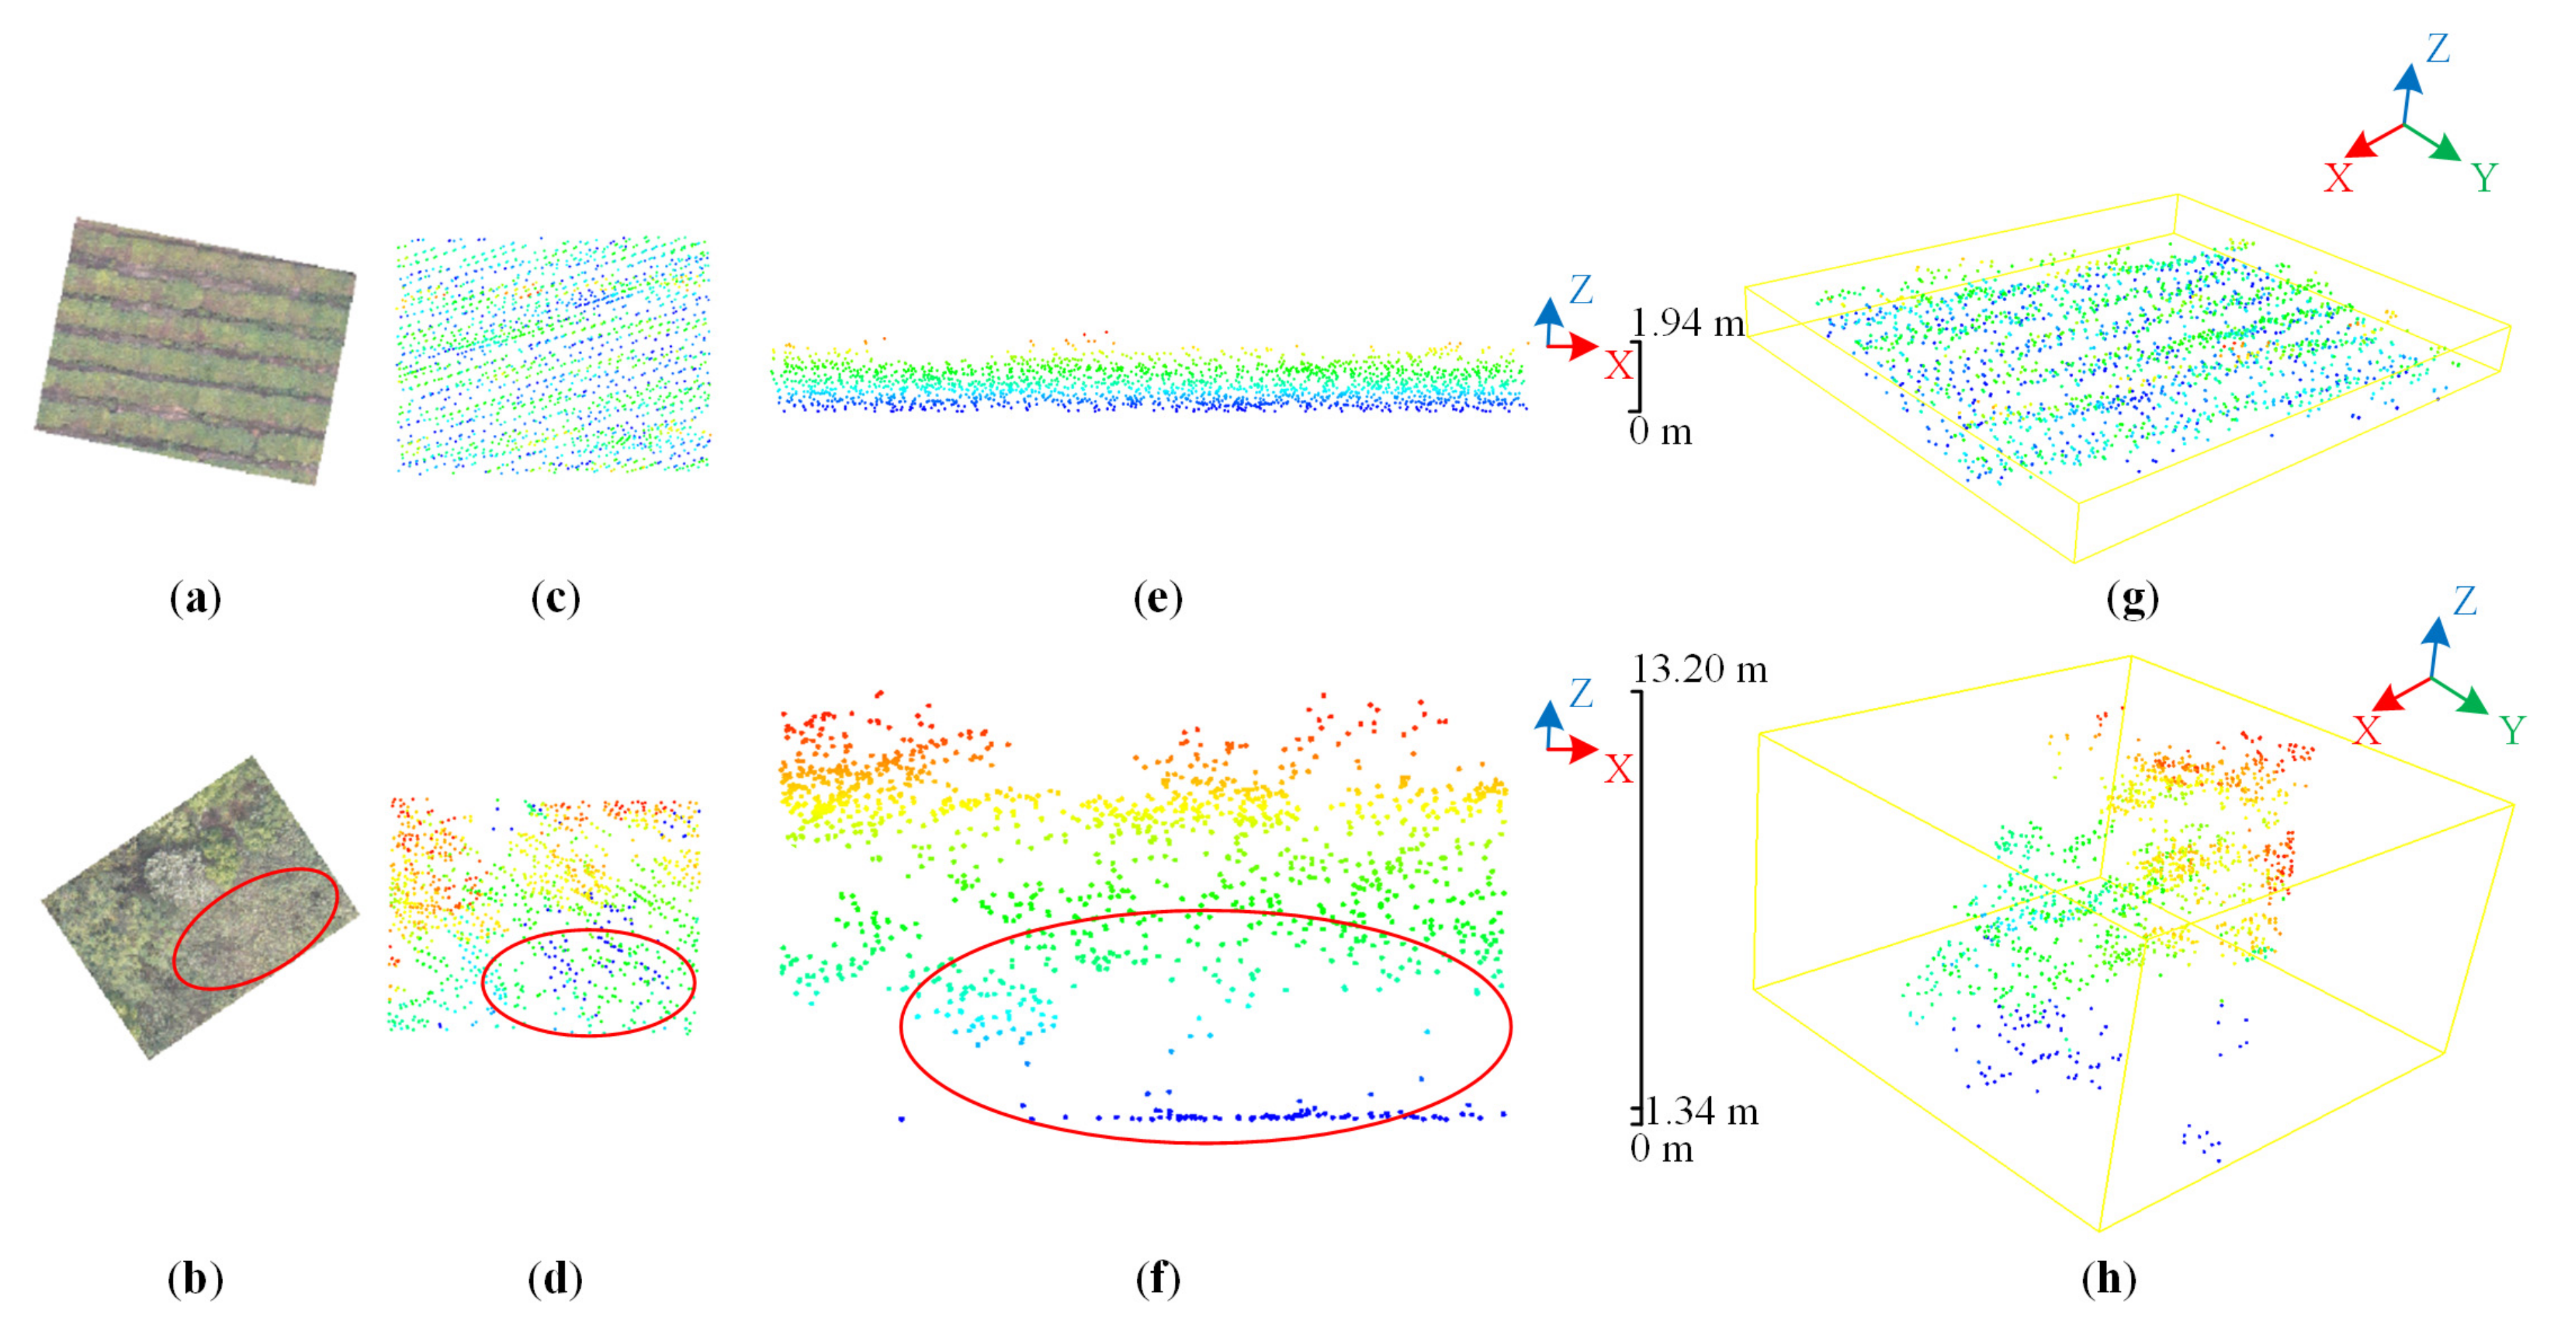
The advantages of point cloud-based models (Models 3 and 4) were that they could accurately demarcate tea plantations from other land cover types due to the point cloud features added that describe forest structural information (
Figure 13). The horizontal and vertical information obtained from the point clouds led to significant improvements in mapping the plucking area of tea plantations (
Figure 11 and
Figure 12). The point clouds of the tea trees appeared to be neatly and densely spaced (
Figure 15c,e), while the point clouds of the shrubs near the arbor trees were relatively scattered and sparse (
Figure 15d,f) even though the heights of tea trees and shrubs are similar. Therefore, Model 3 and Model 4 performed well in identifying tea plantations, and most arbor–shrub–arbor areas were correctly classified as vegetation areas. Consequently, the synergy of optical imagery and point clouds can increase the identification and extraction ability of the tea plucking area. This finding is consistent with the results of previous studies on vegetation or plant species classifications [
41,
42,
43,
44].
Many studies have used lidar or photogrammetric point clouds for vegetation classifications and estimations [
45,
46]. However, no studies have used point clouds acquired by UAVs for tea plantation mapping, and the performances of lidar and photogrammetric point clouds for mapping the plucking area of tea plantations have not been explored and compared. Although both digital aerial photogrammetry and lidar data can provide three-dimensional information on plant structures, some differences exist between the two data types in capturing the vertical distribution of a canopy [
47], resulting in differences in the performances of the datasets such as the classification differences observed between Model 3 and Model 4 in the current study. Therefore, whether using RF or SVM, Model 4 performed better than Model 3. Compared with the photogrammetric point clouds, the lidar point clouds could more precisely describe the horizontal and vertical structural complexities of the canopy due to the stronger penetration ability of laser beams. Additionally, optical imagery is influenced by plant shadows, leading to the necessity of collecting data at a specific time of day. Consequently, photogrammetric point clouds tend to be less accurate than lidar point clouds when mapping the plucking area of tea plantations, but photogrammetric data are cost-saving and could satisfy the requirements of the majority of tea plantation identification projects. The results of this study indicated that low-cost photogrammetric point cloud data could map the plucking area of tea plantations with similar accuracies to those provided by lidar point cloud data.
The importance of including spectral, geometric, and textural features and lidar metrics in tea plantation mapping has rarely been measured or discussed. The canopy height model, blue band, length/width, red band, HVAR, brightness, and H99 were considered the most important features in the tea plantation classifications conducted in this study. Tea plantations have particularities in high-resolution remotely sensed images compared with other crops. Tea trees are mostly planted in rows, displaying interlacing tea trees and bare soils in images, as illustrated in
Figure 1. Therefore, the textural and spatial features of tea trees are useful when performing classifications between tea plantations and vegetation (
Figure 14), which also explains why Model 2 performed better than Model 1. However, tea trees are easily confused with some other low vegetation types that have a similar spectrum to tea crops, causing tea trees to be difficult to distinguish by spectral images alone. The lidar features that contain vertical information can capture subtle morphological differences among these vegetation classes, such as height strata and canopy volume (
Figure 15). Therefore, the features obtained from point clouds played more significant roles than spectral, geometric, or textural features for mapping the plucking area of tea plantations.
Regarding classification algorithms, when using the same data features, the SVM and RF algorithms performed similarly concerning the overall classification accuracies. This phenomenon was also found in a study by Chuang and Shiu [
18], who employed WorldView-2 pan-sharpened imagery to map tea crops and produced similar overall classification accuracies. Since the motivation of this study was to explore the potential of UAV-derived remotely sensed data to map the plucking area of tea plantations and because these data are not limited to a specific type of machine learning algorithm, the RF and SVM algorithms are utilized for the model validations only.
4.2. UAV Remote Sensing for Mapping the Plucking Area of Tea Plantations
The successful application of UAV remotely sensed data for mapping the plucking area of tea plantations conducted in this study represents a significant operational advancement in identifying and monitoring tea crop distribution and growing conditions. In this study, two types of UAV point clouds combined with digital imagery were applied to detect and map the plucking area of tea plantations for the first time. The first tea plantation distribution map was produced for the Huashan Tea Garden and could provide insights into the scientific management of tea plantations. Additionally, this finer-scale map could be used as basic data to estimate tea production in the Huashan Tea Garden.
Previous studies have employed the application of satellite imagery for mapping tea plantations [
17,
18]. Nevertheless, these studies have some limitations, such as relatively coarse scale, no structural information of plants, and spectral contamination by mist. UAV remote sensing technology can solve these problems to a large extent. First, previous studies have all focused on tea lands at large scales and ignored the plucking areas of tea plantations. In the tea plantation industry, the plucking area is one of the most important indicators used to monitor and assess tea plants, and the plucking area is directly related to the tea yield. Digital imagery and lidar point clouds have very high spatial resolutions while still covering large areas and can identify the plucking areas of the tea garden (
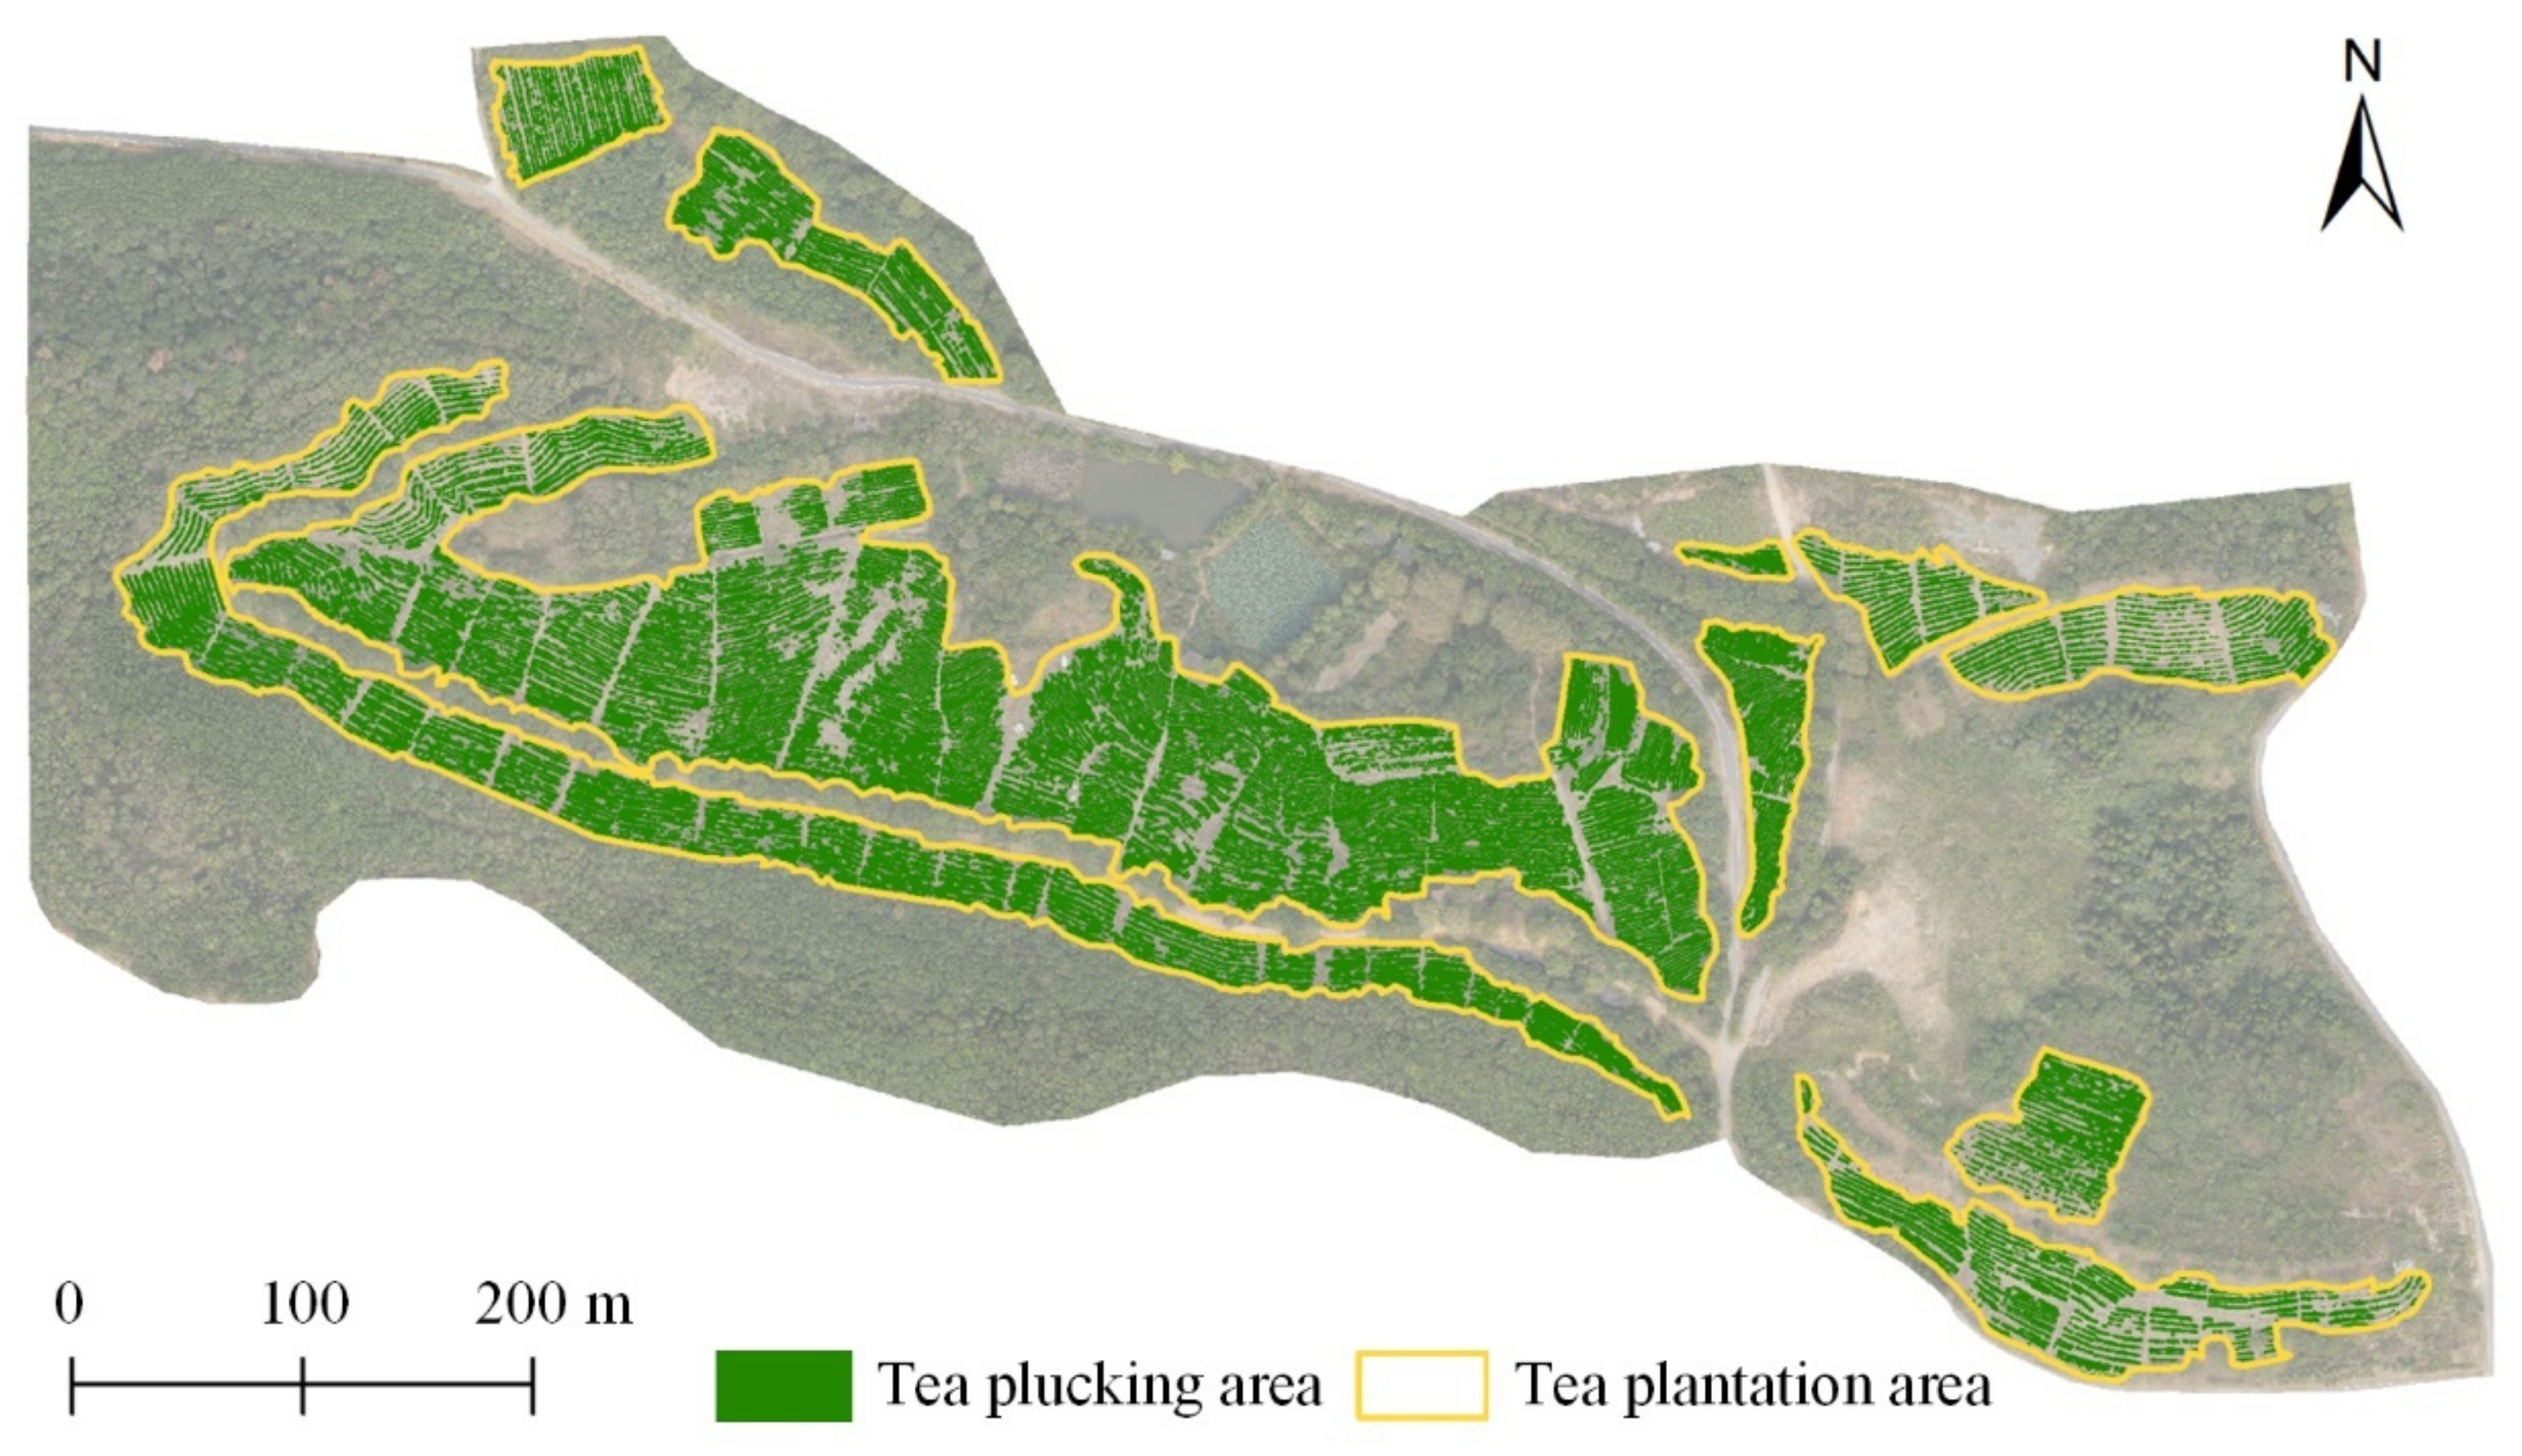
Figure 13). Second, previous research did not involve the use or evaluation of the vertical structural information of vegetation, which is related to the growth status of tea trees. Third, tea trees tend to be planted in hilly or mountainous areas where mist frequently exists and might influence the spectral reflection of tea plantations. Digital images obtained by low-flying UAVs are less affected by thin clouds than satellite images are, while lidar is not affected by thin clouds. Therefore, our study could solve the above-described issues and represent an innovation and advance in finer-scale tea plantation identification. As shown in
Figure 16, the plucking area of tea plantations in the Huashan Tea Garden was accurately measured with a total area of 6.41 ha, which accounted for 57.47% of the tea plantation area (11.15 ha, by manual visual interpretation).
UAVs also have corresponding drawbacks. The main drawback of UAV remote sensing is the limited coverage obtained by a single flight compared to satellite-based imagery; however, UAV remote sensing is adequate for tea plantations if several flight missions are conducted. Additionally, UAV data acquisition and processing require some professional knowledge background and skills, so these methods present some difficulties for nonspecialists.
Tea plantations are mostly located at elevations of approximately 50–800 m, with relative elevation differences less than 500 m and slopes between 15 and 25°, mostly oriented to the southeast (to ensure better light conditions) [
17,
48]. Based on the planting topography of the tea plantation considered in this study, the height of the UAV data acquisition must be set specifically. In this study, lidar point clouds were collected at an altitude of 60 m, and optical imagery was collected at an altitude of 300 m above ground level. If both datasets were collected at an altitude of 300 m, the efficiency of the data collection might have been improved significantly. If both datasets were collected at an altitude of 1000 m, the methods described herein would be suitable for areas with large altitude drop-offs, such as the tea plantation located in Changlong Town, Fujian, named the “tea town above the clouds”, where the highest elevation is 680 m. Under this condition, the VUX-UAV1 lidar scanner (RIGEL, Horn, Lower Austria, Austria) would be considered instead of the Velodyne VLP-16 Puck sensor.
The main cost–benefit advantage of using UAVs over traditional on-ground survey methods for mapping the plucking area of tea plantations is the ability to survey and map larger areas in a short time. It is possible for staff to map a 1 km2 plucking area of a tea plantation within 4 h with the support of UAV equipment, while the staff would spend 10 times longer to complete the same measurements using on-ground survey methods. Additionally, compared with on-ground survey methods, the cost-saving benefits afforded by UAV methods are obvious. The total cost required for mapping the plucking area of a 10 km2 tea plantation four times is USD 47,303 cheaper for the UAV image method than for the on-ground survey method. Even the method in which UAV images and lidar are fused to obtain the highest accuracy is USD 26,239 cheaper than traditional methods. Both the UAV and lidar industries are still developing at high speeds, and the method proposed in this study will become more applicable and less costly in the future. With the development of UAV technology, UAVs will become more cost-effective equipment for tea plantation mapping.
The proposed method in this study might also be suitable for regularly identifying relatively small vegetation and crops with pixels lower than 0.5 m, especially for banded plants. Kulawardhana et al. [
49] proved that the UAV lidar was a potential tool for monitoring short vegetation, such as potato and winter wheat. In this study, point clouds and digital images were combined, and candidate features were selected. Therefore, the proposed method would have greater generalization ability to small vegetation identification.
5. Conclusions
This study developed a new approach for mapping the plucking area of tea plantations using UAV-derived remotely sensed data (optical imagery, digital aerial photogrammetry, and lidar data). Four classification models were designed using different UAV-derived data based on the SVM and RF algorithms. The results showed that Model 4 performed best among the models, achieving accuracies of 94.39% using the RF algorithm and 91.43% using the SVM algorithm. The results showed that the plucking area of tea plantations in Huashan, Wuhan, was 6.41 ha, and the average height of the tea trees was 0.51 m. Important features were selected from the optical imagery and point cloud data using the RFE algorithm. The study found that the features obtained from point clouds are more crucial than the features obtained from digital imagery when identifying tea plantations.
The significance of this study can be reflected in three aspects. First, the excellent performance of UAV remote sensing for mapping the plucking area of tea plantations has been demonstrated, which represents an advancement in remote sensing of tea plantations. Second, photogrammetric point clouds can be used as an alternative to lidar point clouds when lidar scanners are not available. Third, the time and financial costs of using UAV-derived data to map the plucking area of tea plantations are much lower than those required by the traditional on-ground methods.


