Article

Effects of Leaf Loss by Artificial Defoliation on the Growth of Different Poplar and Willow Varieties

by
Christiane E. Helbig
1,*,
Michael G. Müller
1 and
Dirk Landgraf
2
1
Chair of Forest Protection, Institute of Silviculture and Forest Protection, Technische Universität Dresden, Pienner Straße 8, 01737 Tharandt, Germany
2
Forestry and Ecosystem Management, Erfurt University of Applied Sciences, Leipziger Straße 77, 99085 Erfurt, Germany
*
Author to whom correspondence should be addressed.
Forests 2021, 12(9), 1224; https://doi.org/10.3390/f12091224
Submission received: 28 July 2021 / Revised: 24 August 2021 / Accepted: 3 September 2021 / Published: 8 September 2021

Abstract

:
The cultivation of fast-growing tree species in short rotation coppices has gained popularity in Germany in recent years. The resilience of these coppices to phyllophagous pest organisms is crucial for their profitable management, since the loss of a single annual increment can lead to uncompensable economic losses. To study the effects of leaf loss on the growth of poplar and willow varieties that are frequently cultivated under local conditions, three sample short rotation coppices including five poplar (Populus spp.) and three willow (Salix spp.) varieties were established in a randomized block design with four artificial defoliation variants and, on one site, with three different variants regarding the number of defoliation treatments. After up to three defoliation treatments within two growing seasons, the results show negative effects of leaf loss on the height growth and the fresh weight of the aboveground biomass of plants. Our data also suggests a lasting effect of defoliation on plant growth and re-growth after the end of the treatment. In general, defoliation had a greater impact on the growth of poplars than on willows. We conclude that even minor leaf loss can have an impact on plant growth but that the actual effects of defoliation clearly depend on the site, tree species, and variety as well as the extent and number of defoliations, which determine the ability of plants for compensatory growth.

1. Introduction

Several global developments, such as the depletion of fossil fuels, the increasing demand for wood products, and the striving for climate protection, have been the reason for an increasing importance of the cultivation of fast-growing tree species in short rotation coppices on agricultural land in Germany. Short rotation coppices are defined as high-density plantations with rotation times between 2 and 20 years [1,2]. Poplars (Populus spp.) and willows (Salix spp.), which are characterized by a very fast juvenile growth, a great resprouting ability, and an easy propagation, have proven to be particularly suitable and are widely used for this kind of land use [3,4,5,6,7].
As typical monocultures with a high plant density, a low genetic diversity, and a distinctive spatial homogeneity, short rotation coppices generally hold a high risk for the occurrence of plant diseases and the outbreaks of pest organisms [8,9,10,11,12,13]. In addition, poplars and willows are naturally associated with an exceptionally high number of insect species in comparison to other tree species [14,15,16,17]. Accordingly, many studies have reported a large number of pest insects in poplar and willow short rotation coppices with a particular emphasis on phyllophagous species, which find ideal living conditions in these plantations [18,19,20,21,22]. The feeding activities of their larvae and/or adults cause a loss of leaf area but only in rare cases lead to the death of plants [23]. That is, in most cases, no lasting impact of leaf feeding can be directly seen. Several studies have shown, however, that the natural or artificial reduction of the leaf area of plants can already lead to a reduction of biomass yield after a relatively short period of time, and can still be detected after several months or years without this kind of damage [24,25]. Negative consequences of a loss of leaf area by insect feeding have also been documented on several other parameters of plant fitness, such as seed production [26,27,28]. For these reasons, the resilience of plants to biotic pest organisms is one of the most crucial preconditions for a large-scale, reliable, and profitable cultivation of fast-growing tree species on agricultural land, in particular because the loss of a single annual increment can lead to economic losses that may not be compensated within the short rotation times [23]. With regard to the strong economic focus of short rotation coppices, the actual effects of plant damage by insects on the yield of the coppice is a crucial aspect for their cultivation and management, for example when deciding for or against the use of insecticides.
A common procedure to study the effects of leaf area loss on the growth and yield of plants is the simulation of leaf feeding of phyllophagous pest insects by artificial defoliation [24,29,30,31,32]. The main advantage of this procedure is the ability to precisely control and modify the extent, number, and timing of defoliation, whereas the difference in the duration between natural and artificial defoliation as well as the potential lack of herbivore-induced plant volatiles due to a merely mechanical damage are disadvantageous [30,33,34]. Since the reaction of plants to herbivory is a very complex process that is not only determined by the actual leaf loss, studies comparing artificial and natural defoliation often show differences in the reaction of plants to these procedures [30]. Chen et al. (2002), for example, documented a greater reduction in plant height, height increment, and root to shoot ratio by an artificial defoliation of three-year-old Douglas fir seedlings in comparison to a natural defoliation, whereas the natural process had a greater impact on the diameter growth [29]. In contrast, Coyle et al. (2002) reported greater effects of natural feeding by Chrysomela scripta (Coleoptera: Chrysomelidae) on poplars than by artificial defoliation [35]. Nevertheless, many studies came to the conclusion that artificial defoliations are generally suitable to demonstrate the effects of natural defoliations [25,31,36,37,38,39,40,41,42].
The aims of this study were to transfer the approaches of existing studies, which were mainly carried out on potted plants [29,31,32,38,39,40], into the field, where the competition between plants is not excluded, and to examine the short-term and long-term effects of different extents and frequencies of leaf loss under local conditions on those poplar and willow varieties that are mainly planted in Germany.

2. Materials and Methods

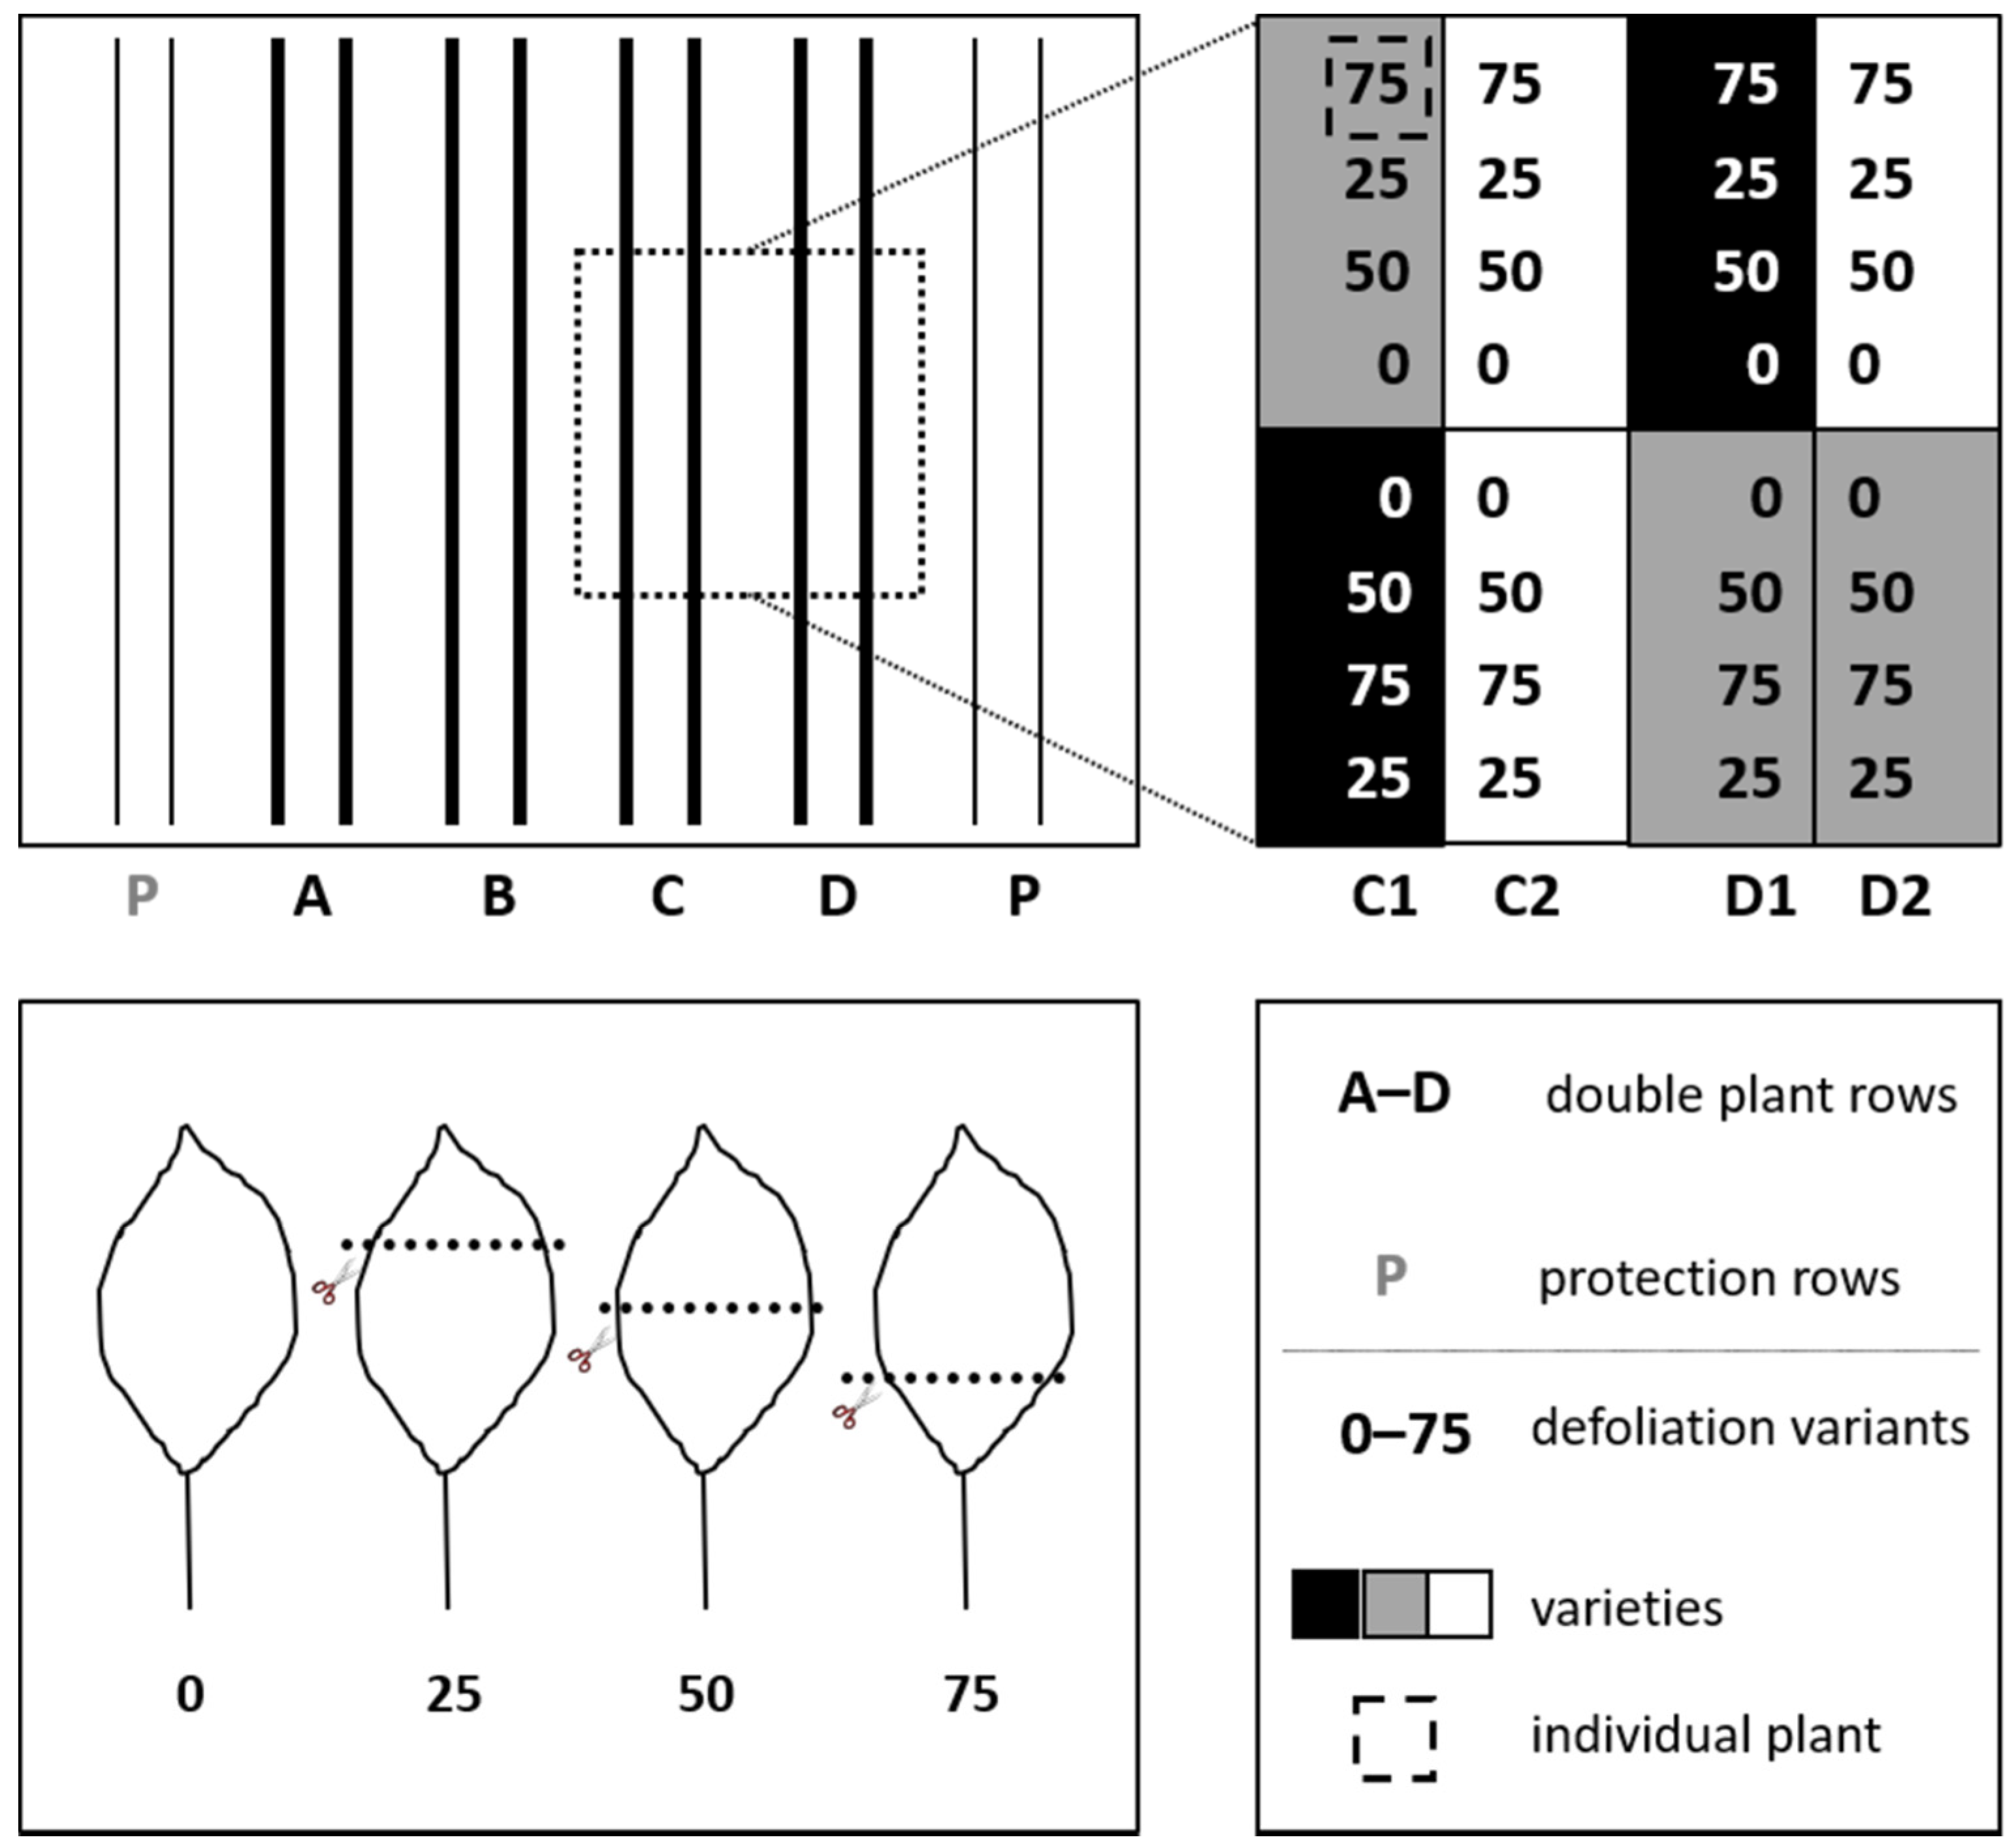
2.1. Sites, Plant Material, and Experimental Design

For the leaf feeding simulation experiment sample short rotation coppices with a size of about 0.2 ha were established on one site in the federal state of Saxony [Obercarsdorf (50°51′35.0″ N 13°39′10.5″ E), 400 m a. s. l., 8.2 °C mean annual temperature, 786 mm average annual precipitation, typical cambisol, former pasture] and two sites in the south of the federal state of Brandenburg [Großthiemig (51°23′34.5″ N 13°40′35.8″ E), 94 m a. s. l., 8.6 °C mean annual temperature, 561 mm average annual precipitation, sandy gleyic cambisol, tree nursery land and Schönheide (51°34′39.4″ N 14°30′17.6″ E), 120 m a. s. l., 9.6 °C mean annual temperature, 568 mm average annual precipitation, slightly-loamy sandy cambisol, former grassland] [43].
Each of the three coppices consisted of a poplar area planted in double rows with a distance of 0.75 m within the double rows, 1.50 m between double rows, and 1.00 m between plants within the rows (8888 plants ha−1), and a willow area planted with the same row spacing and a distance of 0.70 m between plants within rows (12,698 plants ha−1) (Figure 1).
The experiment was set up as randomized block design according to Powers et al. (2006) and Peacock et al. (2002) with five poplar varieties (Androscoggin, Max 1, Max 3, Max 4, Muhle Larsen) and three willow varieties (Sven, Tora, Tordis), respectively [32,44], and four different defoliation treatment variants (0%, 25%, 50%, 75% leaf loss) that were based on Reichenbacker et al. (1996) [41]. The cuttings were obtained from the Research Institute for Post-Mining Landscapes (FIB) in Finsterwalde (Max 1–4), Lantmännen Agroenergi AB (Sven, Tora, Tordis), and P&P Tree Nursery in Großthiemig (Androscoggin, Muhle Larsen) and planted manually. In order to avoid micro-spatial differences among treatments, varieties were planted with four consecutive plants representing the four treatments (Figure 1). Furthermore, the poplar and the willow area of each sample short rotation coppice were bordered with one double row of the other species on each side and two plants of the other species on each beginning and end of rows to reduce potential edge effects. On each of the three locations, the four defoliation treatments were represented with 32 plants per variety, that is, there were 32 plots with four plants each of every variety.
In accordance with Powers et al. (2006), the simulation of leaf feeding was carried out as a reduction of leaf area on every single leaf instead of relating the intended proportion of defoliation to the total plant leaf mass [32]. Leaves were cut with paper scissors across the midvein, similar to Peacock et al. (2002) [44], to simulate the feeding of phyllophagous insects as accurately as possible (Figure 1).

2.2. Experimental Process and Data Recording

The three sample short rotation coppices were established at the end of March (Großthiemig, Schönheide) and beginning of April 2007 (Obercarsdorf) after a standard soil preparation including ploughing, tilling, and, except for the organic farming site in Obercarsdorf, the application of pre-emergent herbicides was carried out by the site owners. The first defoliation treatment took place four months after planting in July (Großthiemig, Schönheide) and August 2007 (Obercarsdorf). The willow varieties in Schönheide were excluded from the first defoliation due to their weak growth. Extensive browsing made it necessary to fence the willow area in Großthiemig in July 2007 and the whole coppice in Schönheide in May 2008. The second defoliation was carried out in June 2008 and the third defoliation in August 2008. During these two treatments, only a part of the plants in Großthiemig were defoliated so that at the end of the experiment the site held plants treated once, twice, or three times.
Data recordings on all three study sites took place directly prior to the first defoliation treatments in July/August 2007 and in December 2007. Recorded parameters were plant height, number of shoots, and plant damage (verbal description of damage and its potential abiotic or biotic causal factor). After a final data recording in Großthiemig in February 2009, the short rotation coppice was harvested manually in March 2009 to determine the fresh and dry weight of the aboveground biomass. Due to organizational reasons, it was not possible to determine the weight of the individual plants. Instead, the total weight of all plants per variety, defoliation variant, and number of defoliations was recorded. Determination of dry weight was only carried out on samples: four plots without plant losses were chosen for all poplars and those willows that were defoliated once, whereas for the willows that were defoliated twice or three times, dry weight was determined for all plants that were defoliated 0% or 75%. To study a potential long-term effect of defoliation on the re-growth of plants, additional data recordings in Großthiemig took place in June 2009, after which the resprouting shoots were reduced to the highest shoot per stool, and in September 2009. The short rotation coppices in Obercarsdorf and Schönheide were not harvested after the end of the defoliation treatments. Their final data recording took place in early April 2009 prior to bud burst. An additional data recording to study the potential long-term effect of defoliation on plant growth was carried out in early April 2010.

2.3. Data Analysis

All analyses were carried out using IBM SPSS Statistics 27.0 [45]. The significance level for all statistical tests was set at α = 0.05. Data were analyzed for normality using the Shapiro–Wilk test and for homogeneity of variances using the Levene test. Based on the results, data was either further analyzed using parametric or non-parametric tests. For parametric tests, the t test (TT) or Welch test was used to compare the mean values of two independent samples or an analysis of variance (ANOVA, AN) with Tukey or Tukey-Kramer post hoc tests in case of multiple samples. For non-parametric tests, the Mann–Whitney U test (MU) or the Kruskall–Wallis test with Dunn-Bonferroni post hoc tests (KW) were used to analyze differences in the central tendencies of bivariate or multivariate datasets. Relevant p values of statistical analyses are either included in the text or in tables. In addition, statistical tests are denoted using the abbreviations stated above. Statistical analyses regarding plant height are based on the main shoot of each plant, which is the highest one. Plants that showed significant damage by browsing, insects, or other biotic and abiotic factors were excluded from analyses.

3. Results

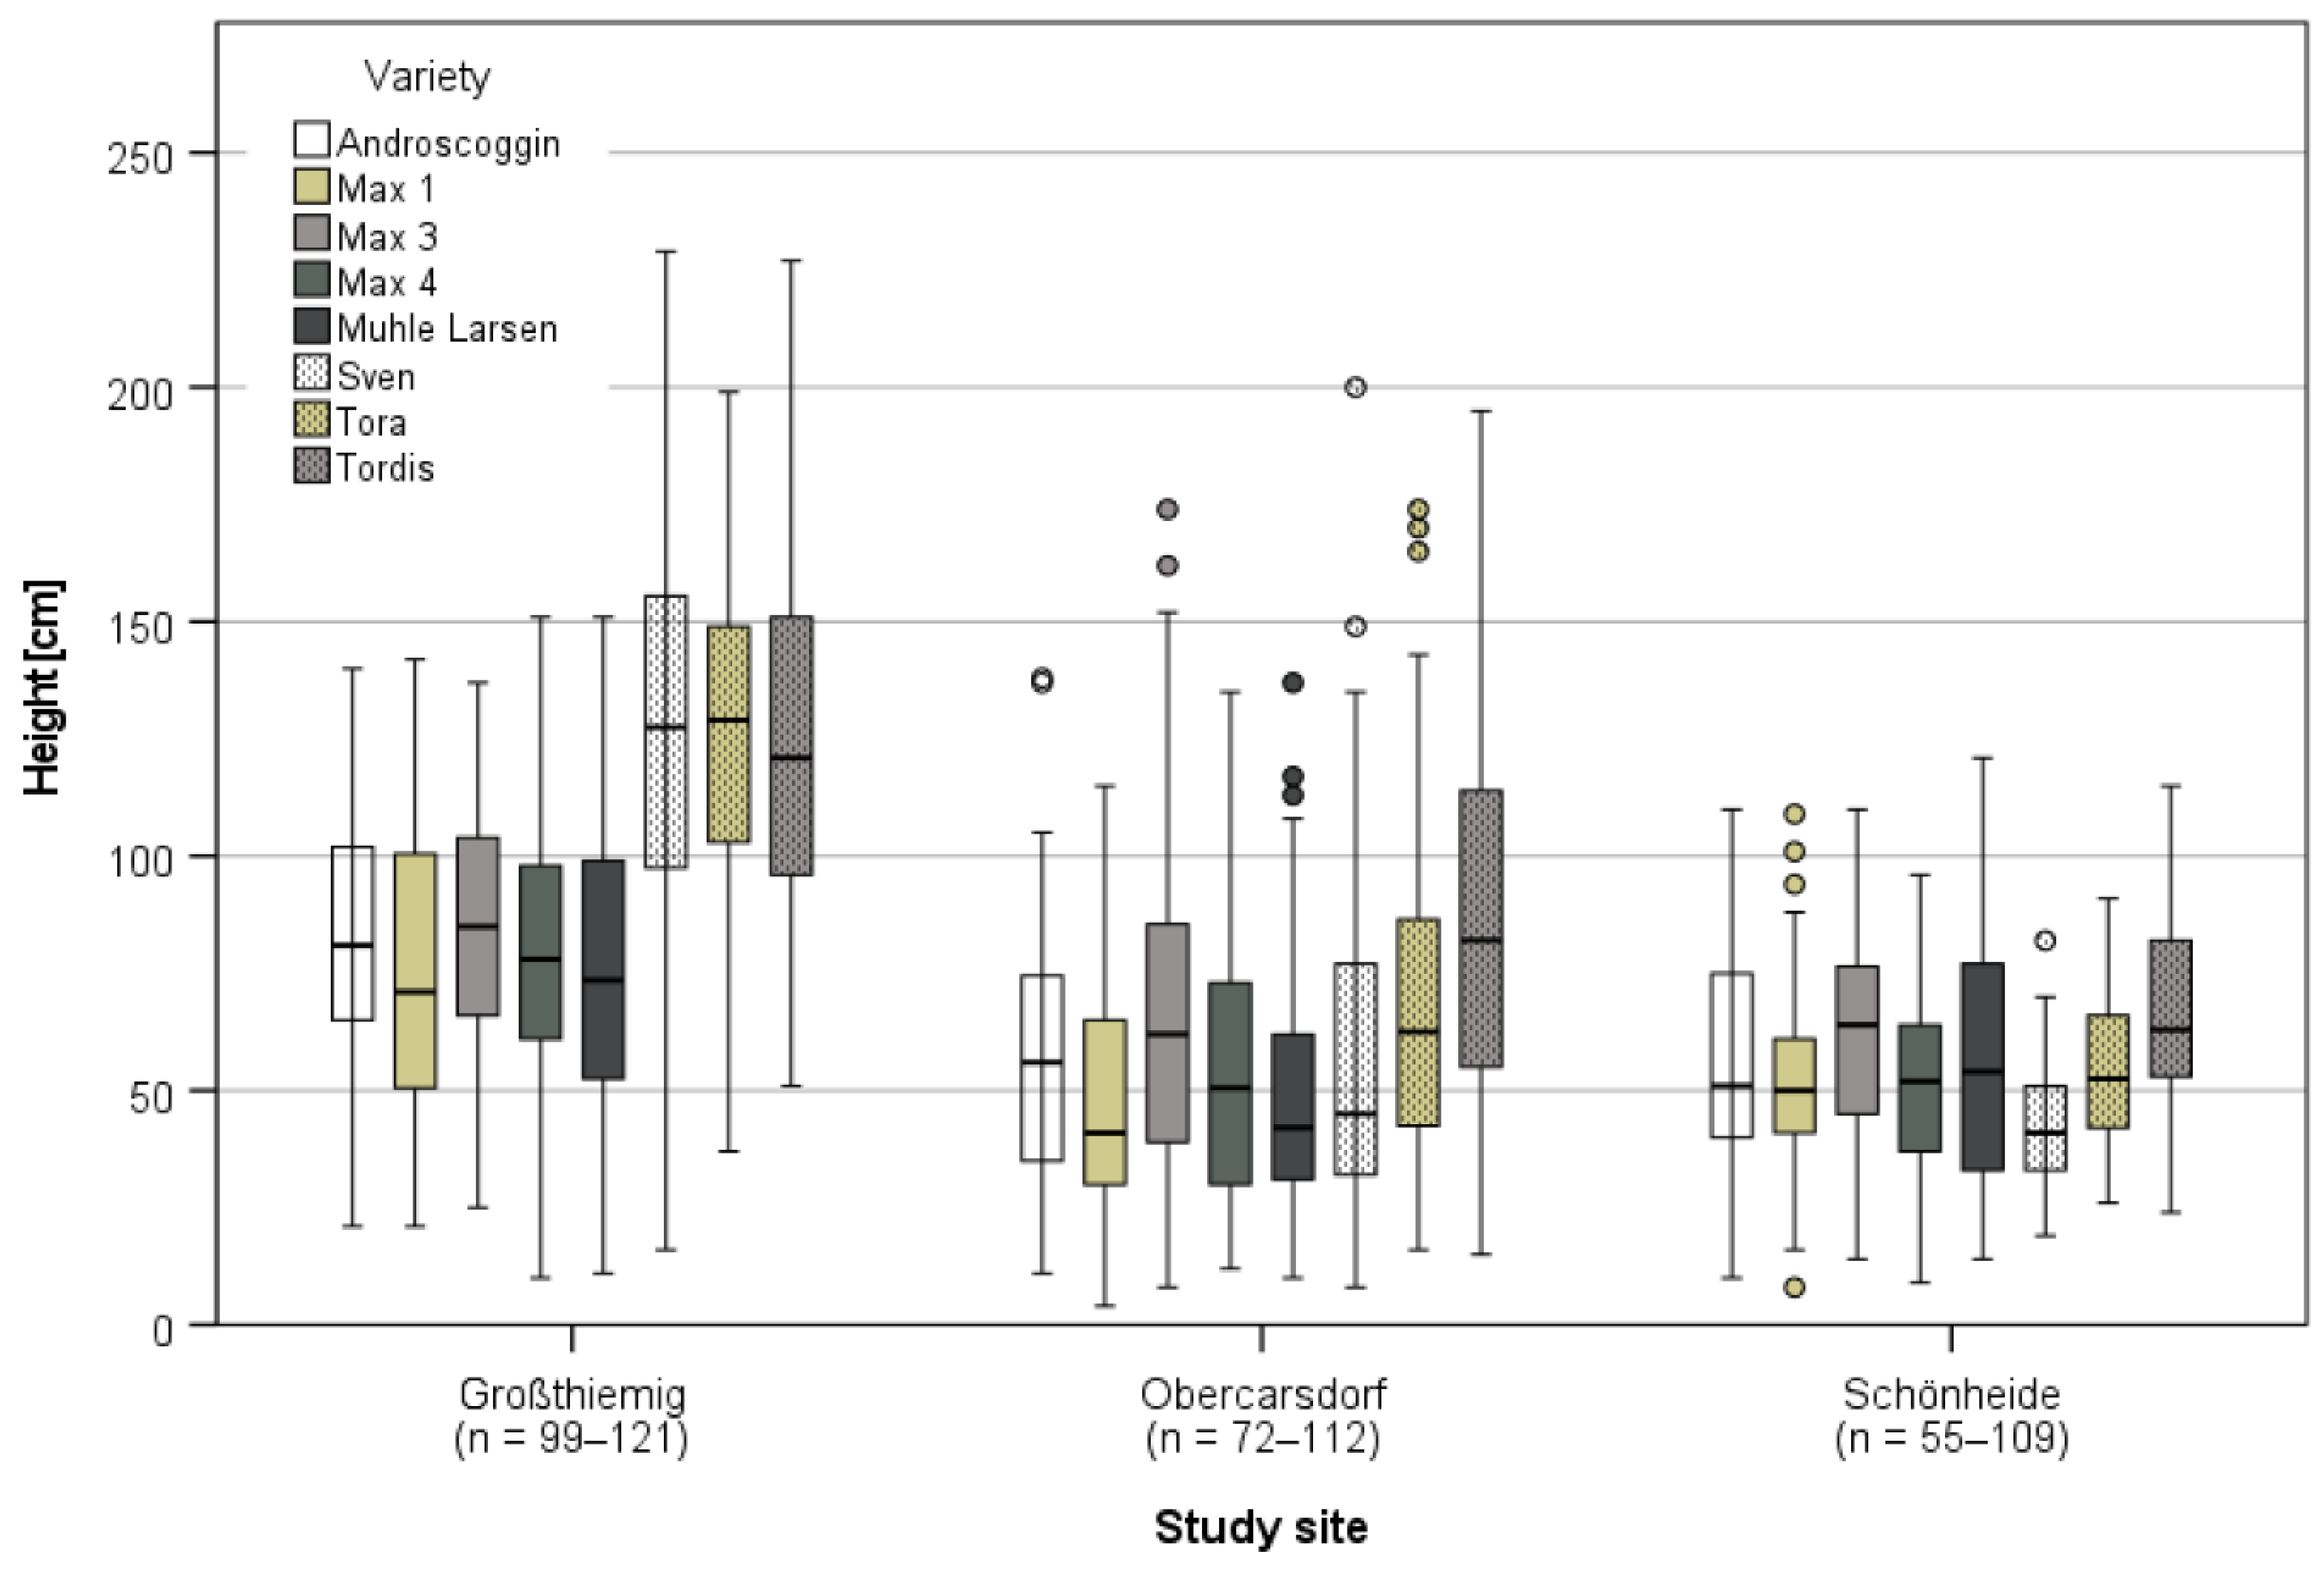
3.1. Plant Growth Directly Prior and after the First Defoliation Treatment

In summer 2007, four months after the establishment of the short rotation coppices and directly prior to the start of the first defoliation treatment, plant losses on the study site in Großthiemig (Ø 5.2%) were considerably lower than on the sites in Obercarsdorf (Ø 17.0%) and Schönheide (Ø 17.3%). Differences in site conditions and management are assumed to be the reason for this difference in plant survival. Optimal mechanical and chemical soil preparation, low ground vegetation cover, and a potentially better nutrient supply on the tree nursery site in Großthiemig facilitated a high plant survival rate and fast growth. In contrast, on the sites in Obercarsdorf and Schönheide, which had previously been used as pasture and grassland, a full ground vegetation cover quickly re-developed despite the mechanical (Obercarsdorf) or mechanical and chemical (Schönheide) soil preparation, leading to greater plant losses in the newly established short rotation coppices on these two sites. In spite of these site-related differences, the trends regarding plant survival on tree genus and variety level were the same on all three study sites (Table A1 in Appendix A). Willows showed a slightly higher number of surviving plants than poplars. Within poplars, an average of 14.2% more plants of the three Max varieties survived in comparison to Androscoggin and Muhle Larsen, whereas within willows, an average of 6.7% more plants of the Tordis variety survived in comparison to Sven and Tora.
Clear differences among the three study sites were also visible with regard to plant heights and reflected the different site conditions similarly to the data on plant survival (Figure A1 in Appendix A). All eight varieties reached a significantly greater height in Großthiemig than in Obercarsdorf and Schönheide (KW: p = 0.000 for all pairwise comparisons). Despite the differences in site conditions, the height growth trends of the individual varieties are very similar on all three study sites and indicate a certain genetic fixation of height growth among varieties.
After the first defoliation treatment in July/August 2007, from which all willows in Schönheide were excluded due to their weak growth, plant heights were recorded again in December 2007 (Figure A2 in Appendix A). In general, data do not show a statistically significant effect of the four defoliation variants, except for Muhle Larsen in Großthiemig (AN: p = 0.032) and Obercarsdorf (p = 0.010). In Großthiemig, post hoc tests reveal significantly greater heights of undefoliated in comparison to 75% defoliated plants (p = 0.046) and in Obercarsdorf significantly greater heights of 25% defoliated in comparison to 50% defoliated plants (p = 0.017).
Although only very few statistically significant differences were detected among the four defoliation variants after the first treatment, the direct comparison of heights between 75% defoliated and undefoliated plants shows height losses for all poplar varieties on all three study sites with the only exception of Max 3 in Obercarsdorf (Table 1). In general, leaf loss had a greater impact on the growth of Androscoggin, Max 3 and Muhle Larsen than on Max 1 and Max 4. In contrast, data on all willow varieties in Großthiemig and on Sven and Tordis in Obercarsdorf indicate a positive effect of defoliation on their height growth. Height reductions due to defoliation were only visible for all willow varieties in Schönheide and for Tora in Obercarsdorf. However, statistical analyses again resulted in very few significant differences in the height between 75% defoliated and undefoliated plants: on the variety level for Muhle Larsen in Großthiemig (TT: p = 0.010) and on the tree genus level for poplars in Großthiemig (TT: p = 0.005) and Schönheide (p = 0.007).

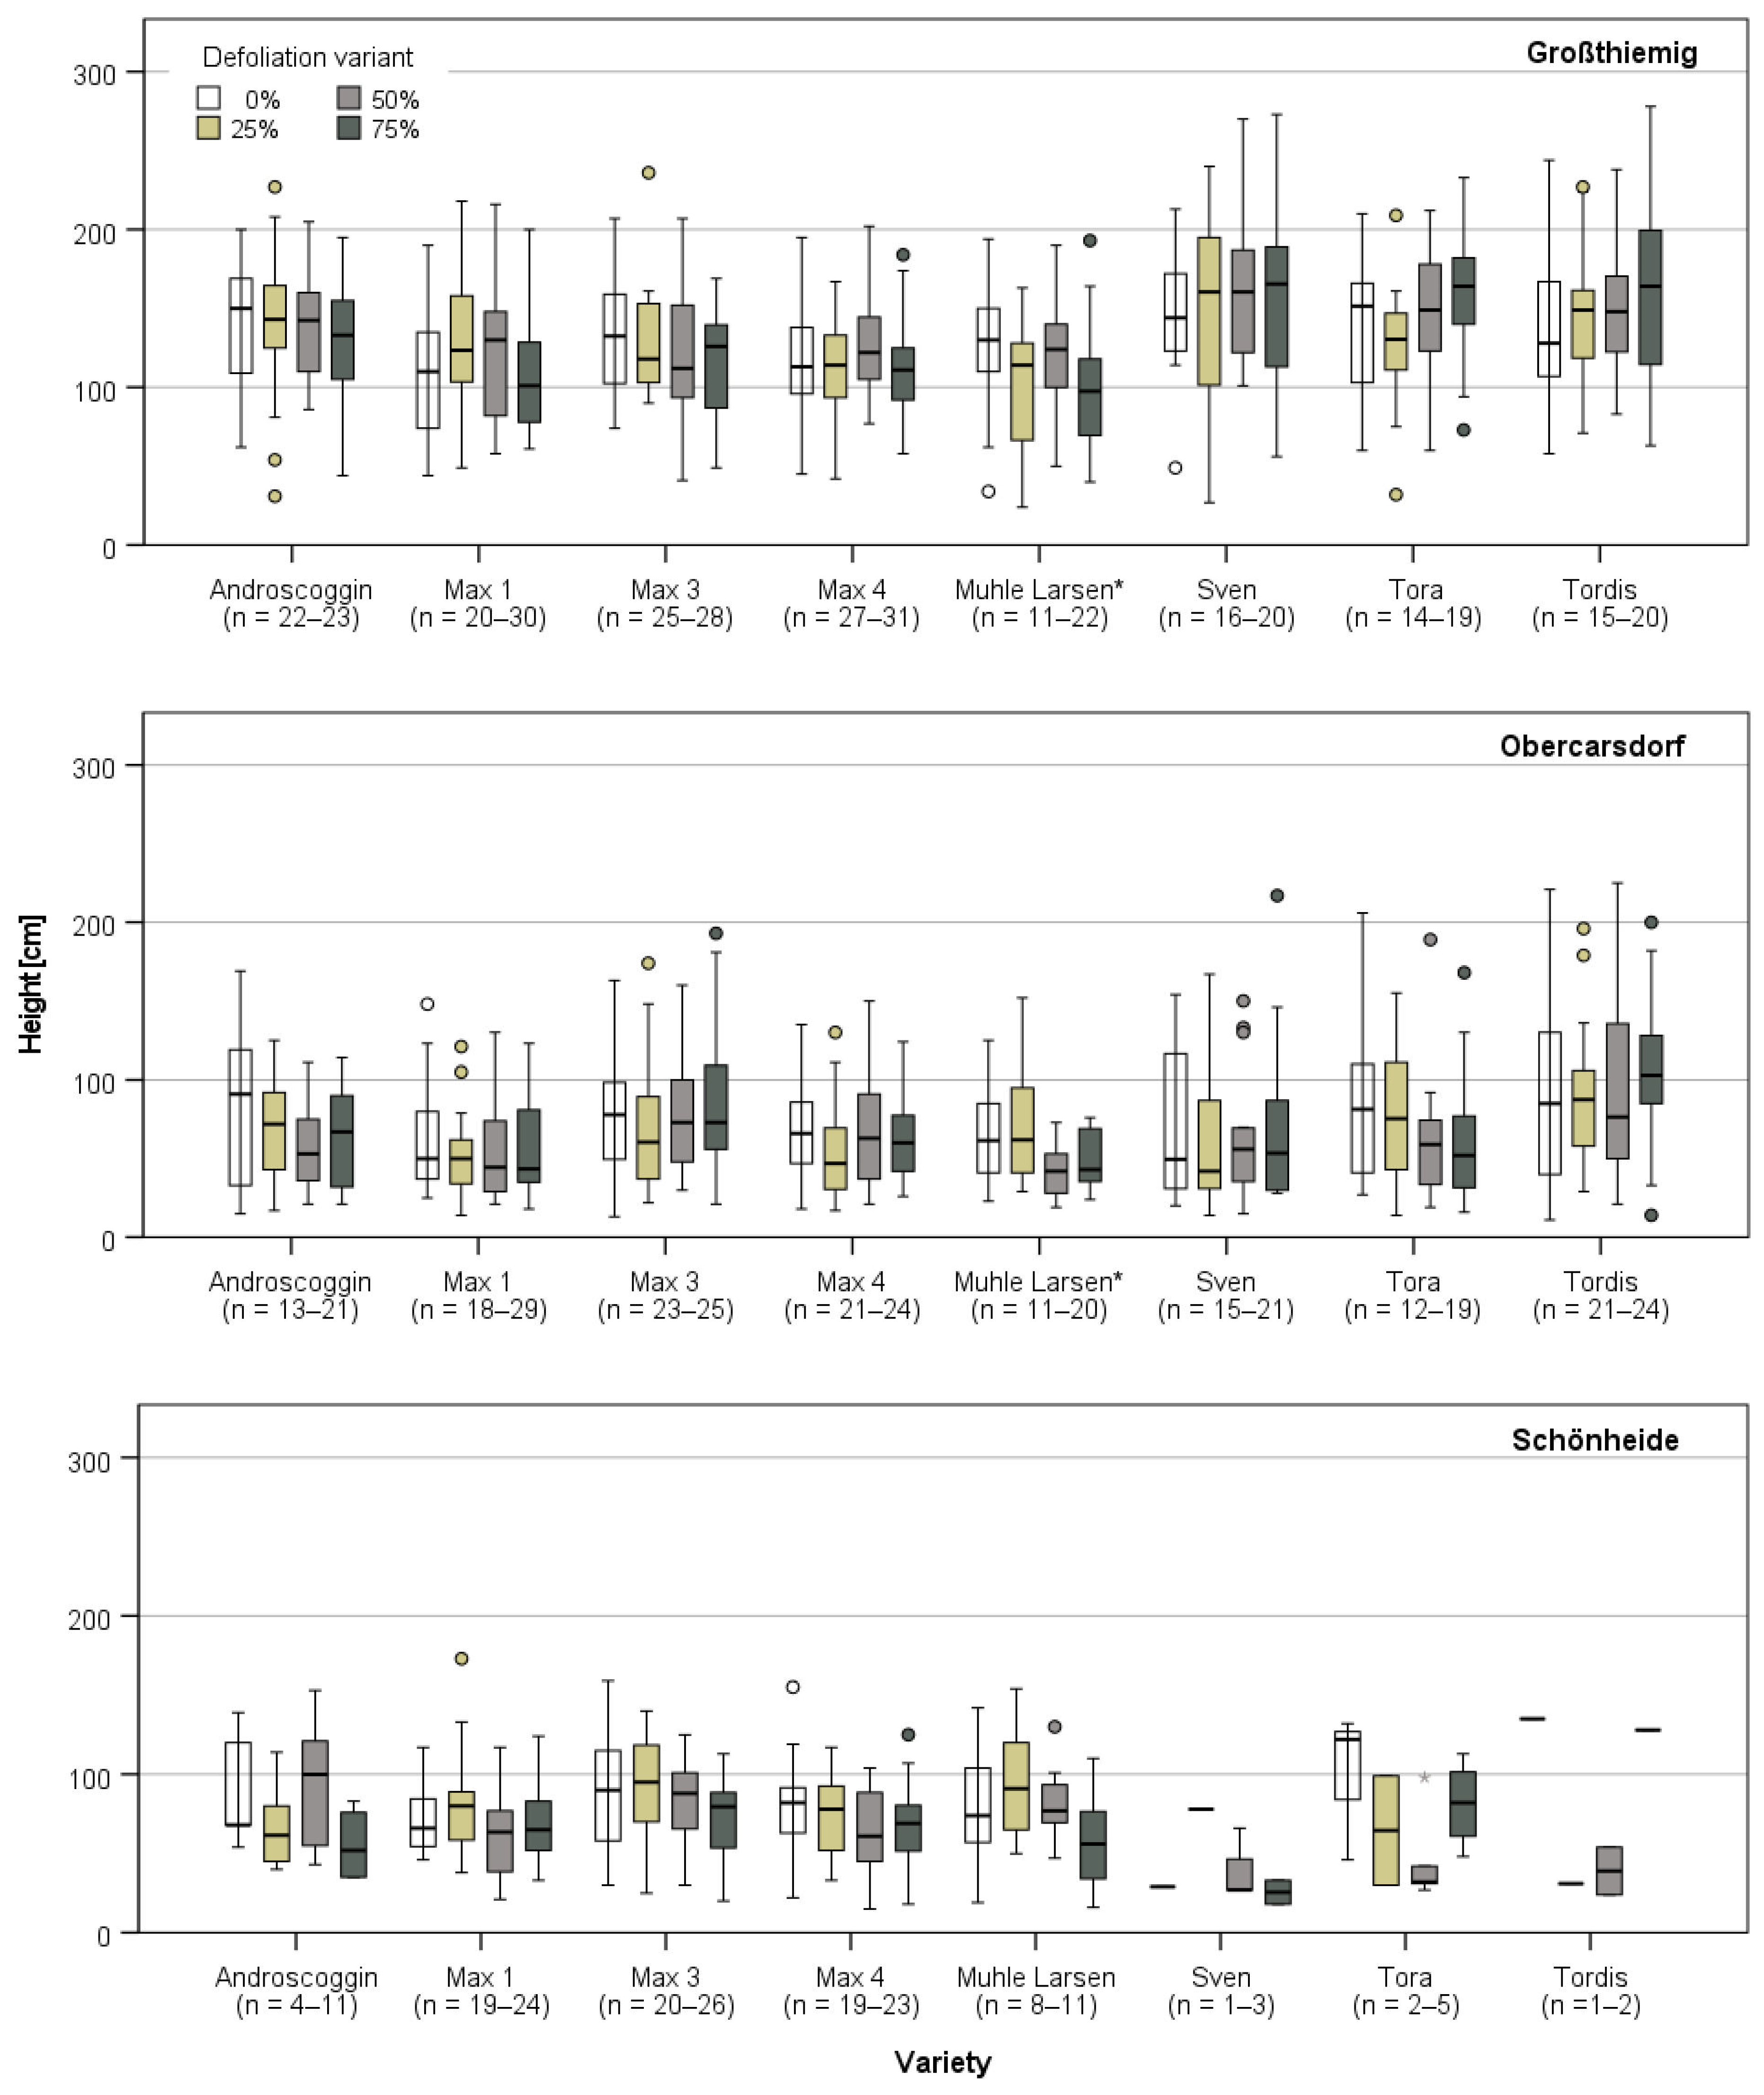
3.2. Plant Growth after the Last Defoliation

After the first defoliation treatment in July/August 2007, two more treatments were carried out in June and in August 2008, and data was recorded again in early spring 2009, prior to the start of the growing season. In Großthiemig, only a part of the plants were defoliated during the treatments in 2008, so that data from this site cannot only be grouped by variety and defoliation variant but also by number of defoliation treatments. With the mere regard to the number of defoliation treatments on the genus level, a different reaction of poplars and willows to the increasing number of defoliation treatments was recorded when considering the average of all defoliation variants. While there is no statistically significant difference in the plant height of poplars defoliated once (Ø 176.6 cm) and twice (Ø 177.9 cm), the poplars treated three times (Ø 164.9 cm) had a significantly reduced plant height in comparison to both, with a mean height reduction of 7%. Willows, in contrast, showed again a promotion of plant growth by defoliation. Plants defoliated twice had a significantly greater height (Ø 277.3 cm) than plants defoliated once (Ø 259.6 cm). However, defoliation carried out three times led to a significant height loss (Ø 239.3 cm) in comparison to plants defoliated once and twice, with a mean height reduction of 11%.
Taking into account not only the number of defoliation treatments but also the variety and defoliation variant, trends show a decreasing height with increasing leaf loss in several cases, in particular for poplar varieties, even though statistically significant differences on the group level only exist in the five cases marked with an asterisk (Figure 2). The p values for the pairwise comparisons of defoliation variants on tree genus level and those comparisons with at least one significant value on the variety level show an increasing number of statistically significant differences with an increasing number of defoliation treatments (Table 2). These especially occur when comparing 75% defoliated and undefoliated plants but also in parts among the three variants that included leaf loss. It can be noted that defoliation particularly led to significant differences in plant height among defoliation variants for the Muhle Larsen and Tora varieties.
Despite the three defoliation treatments, analyses resulted in no statistically significant differences in plant heights among defoliation variants in Obercarsdorf, whereas in Schönheide all poplar varieties did show significant differences in plant heights with decreasing heights at increasing leaf loss (Figure 3). Data on the pairwise comparisons bet-ween defoliation variants generally show a p value decrease with an increasing difference in leaf loss (Table 3).
When only comparing the heights of those plants with the greatest leaf loss, that is 75%, with undefoliated plants, height reductions of up to 42% are visible, with only a few exceptions for willow varieties (Table 4). The data shows again that the effects of defoliation on plant height depend on the site, tree genus, variety, and frequency of defoliation. Generally, height reduction increased with increasing defoliation frequency, and defoliation had a greater impact on poplar than on willow varieties. On average for all three study sites, for poplars, Max 1 had the least height reduction with 11% and Muhle Larsen the greatest with 25%. For willows, Tora was most impacted by defoliation with a height reduction of 18%, whereas Tordis and Sven showed a reduction of 5% on average. Statistically significant differences were detected for all poplar varieties (TT: p = 0.001–0.005) as well as the Tora variety (p = 0.017). On the tree genus level, a statistically significant effect was only existent for poplars (p = 0.000), although the p value for willows (0.051) came very close to a significance.

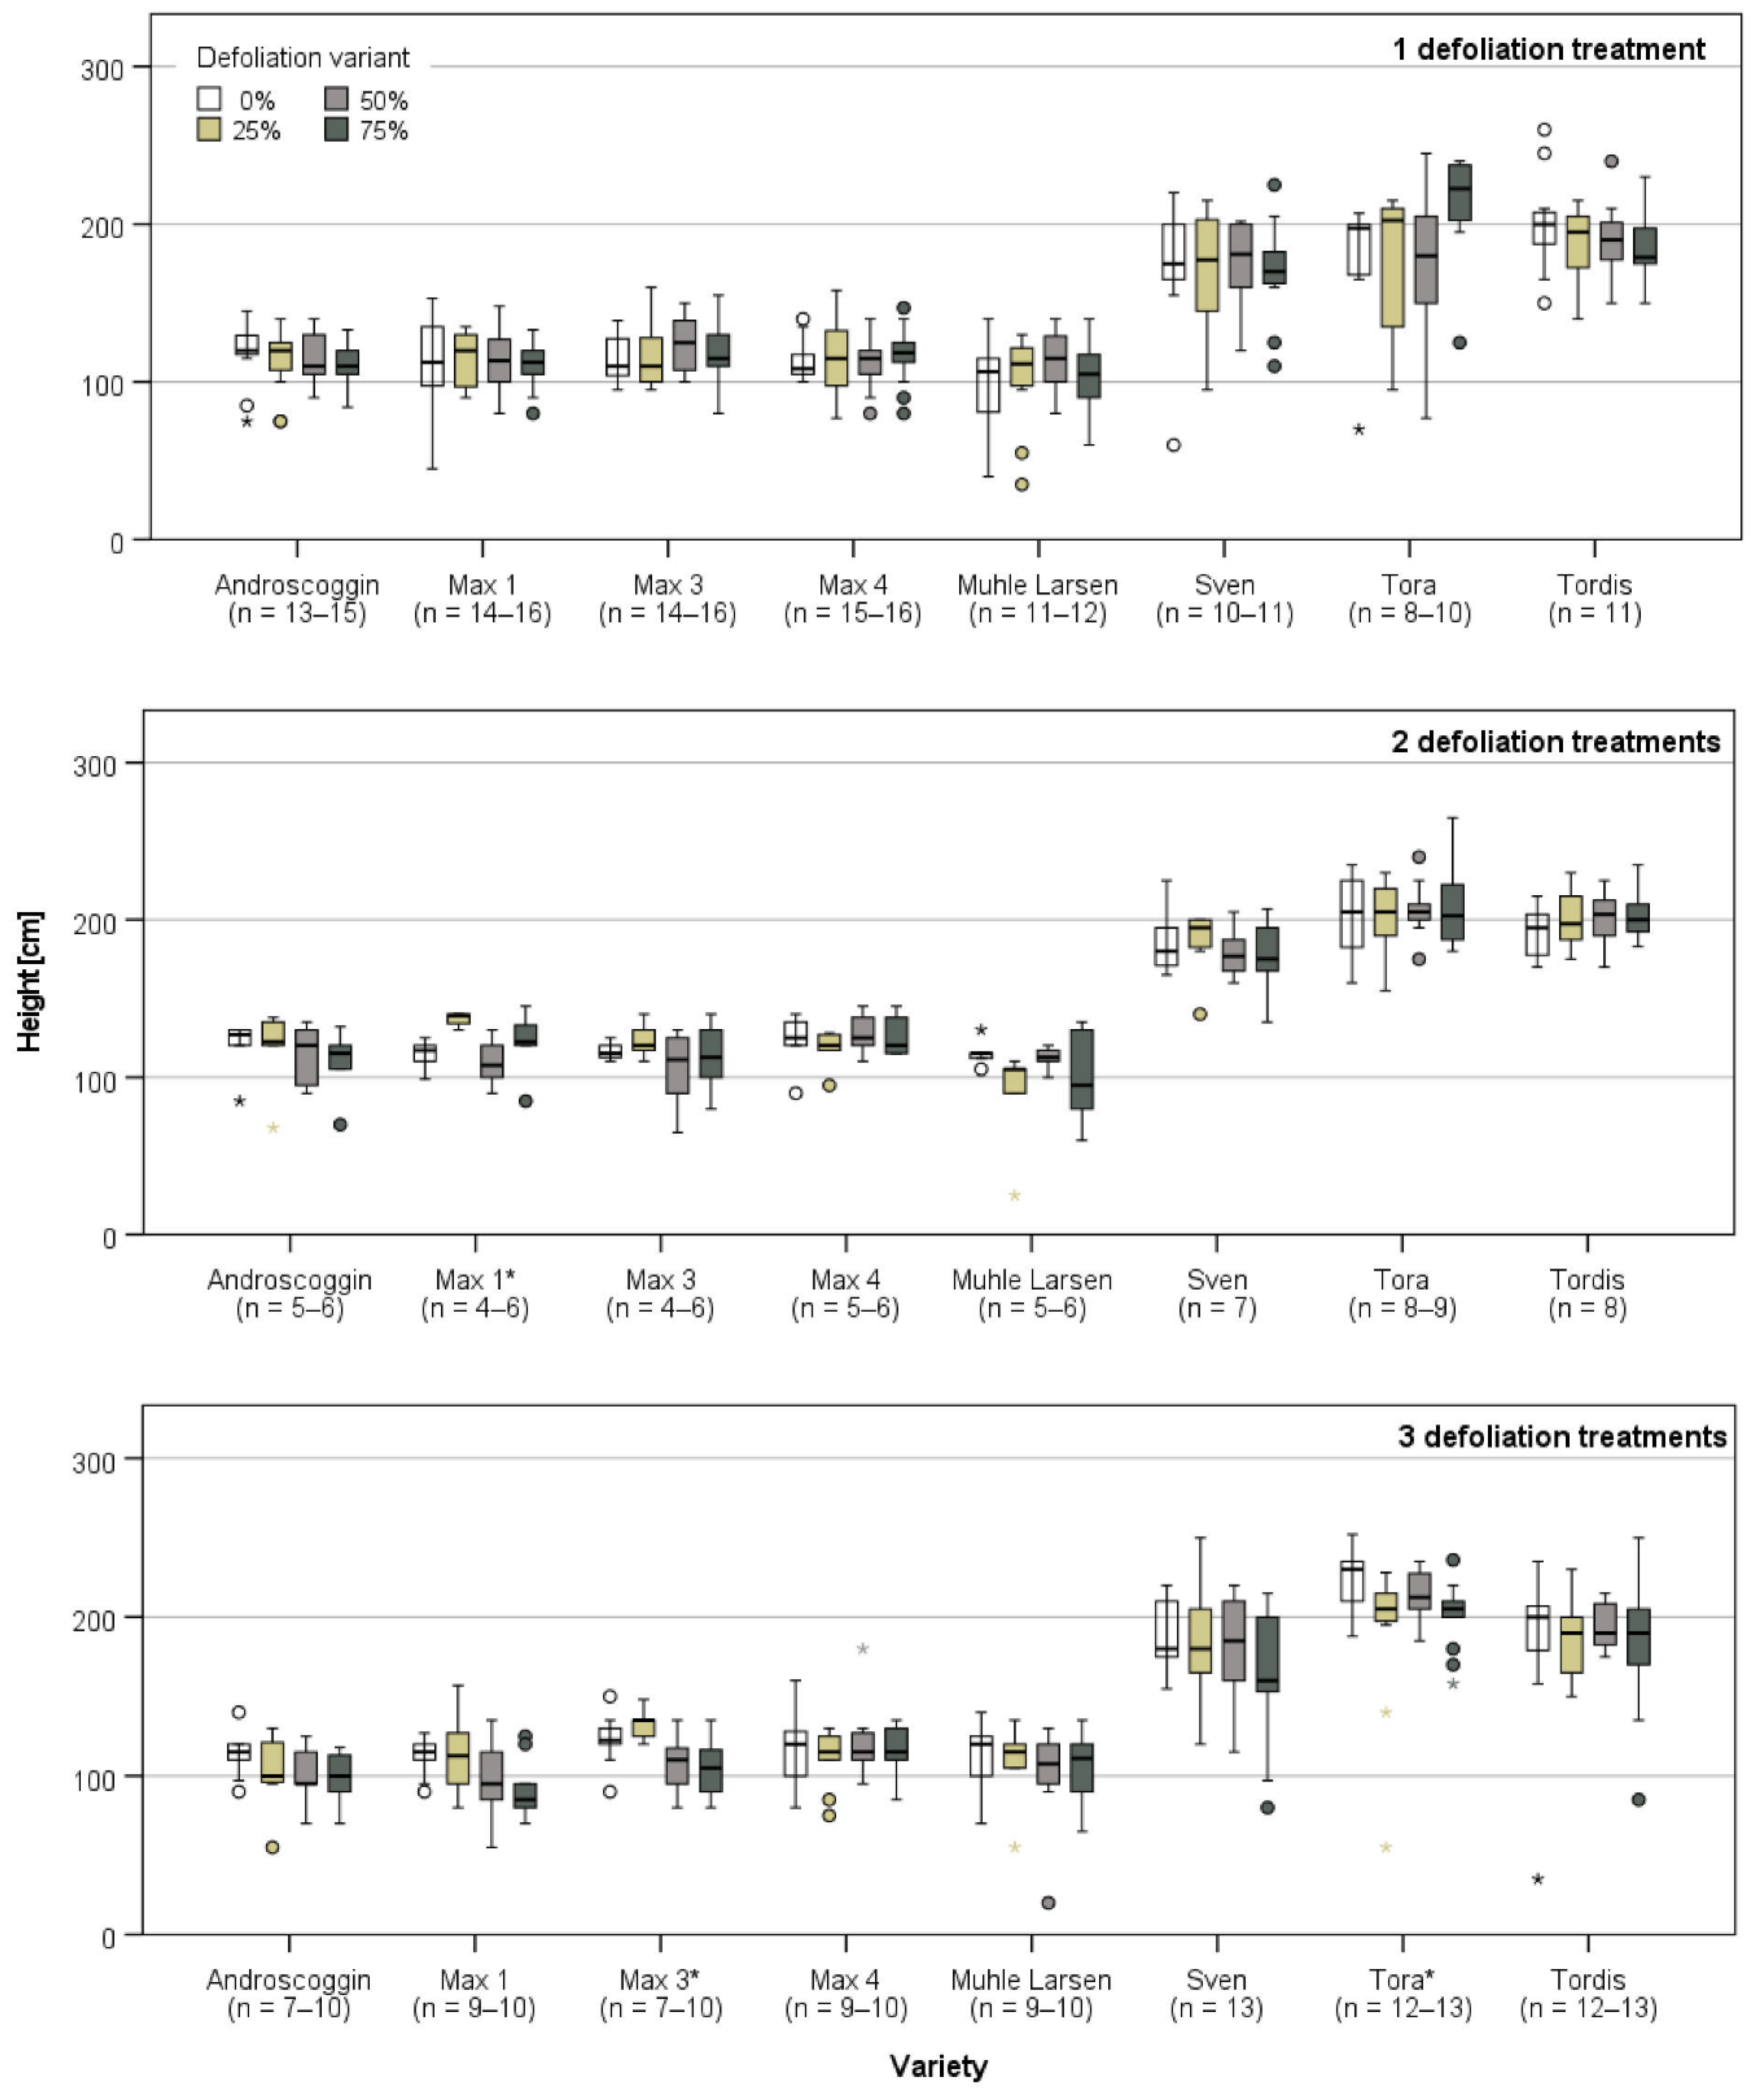
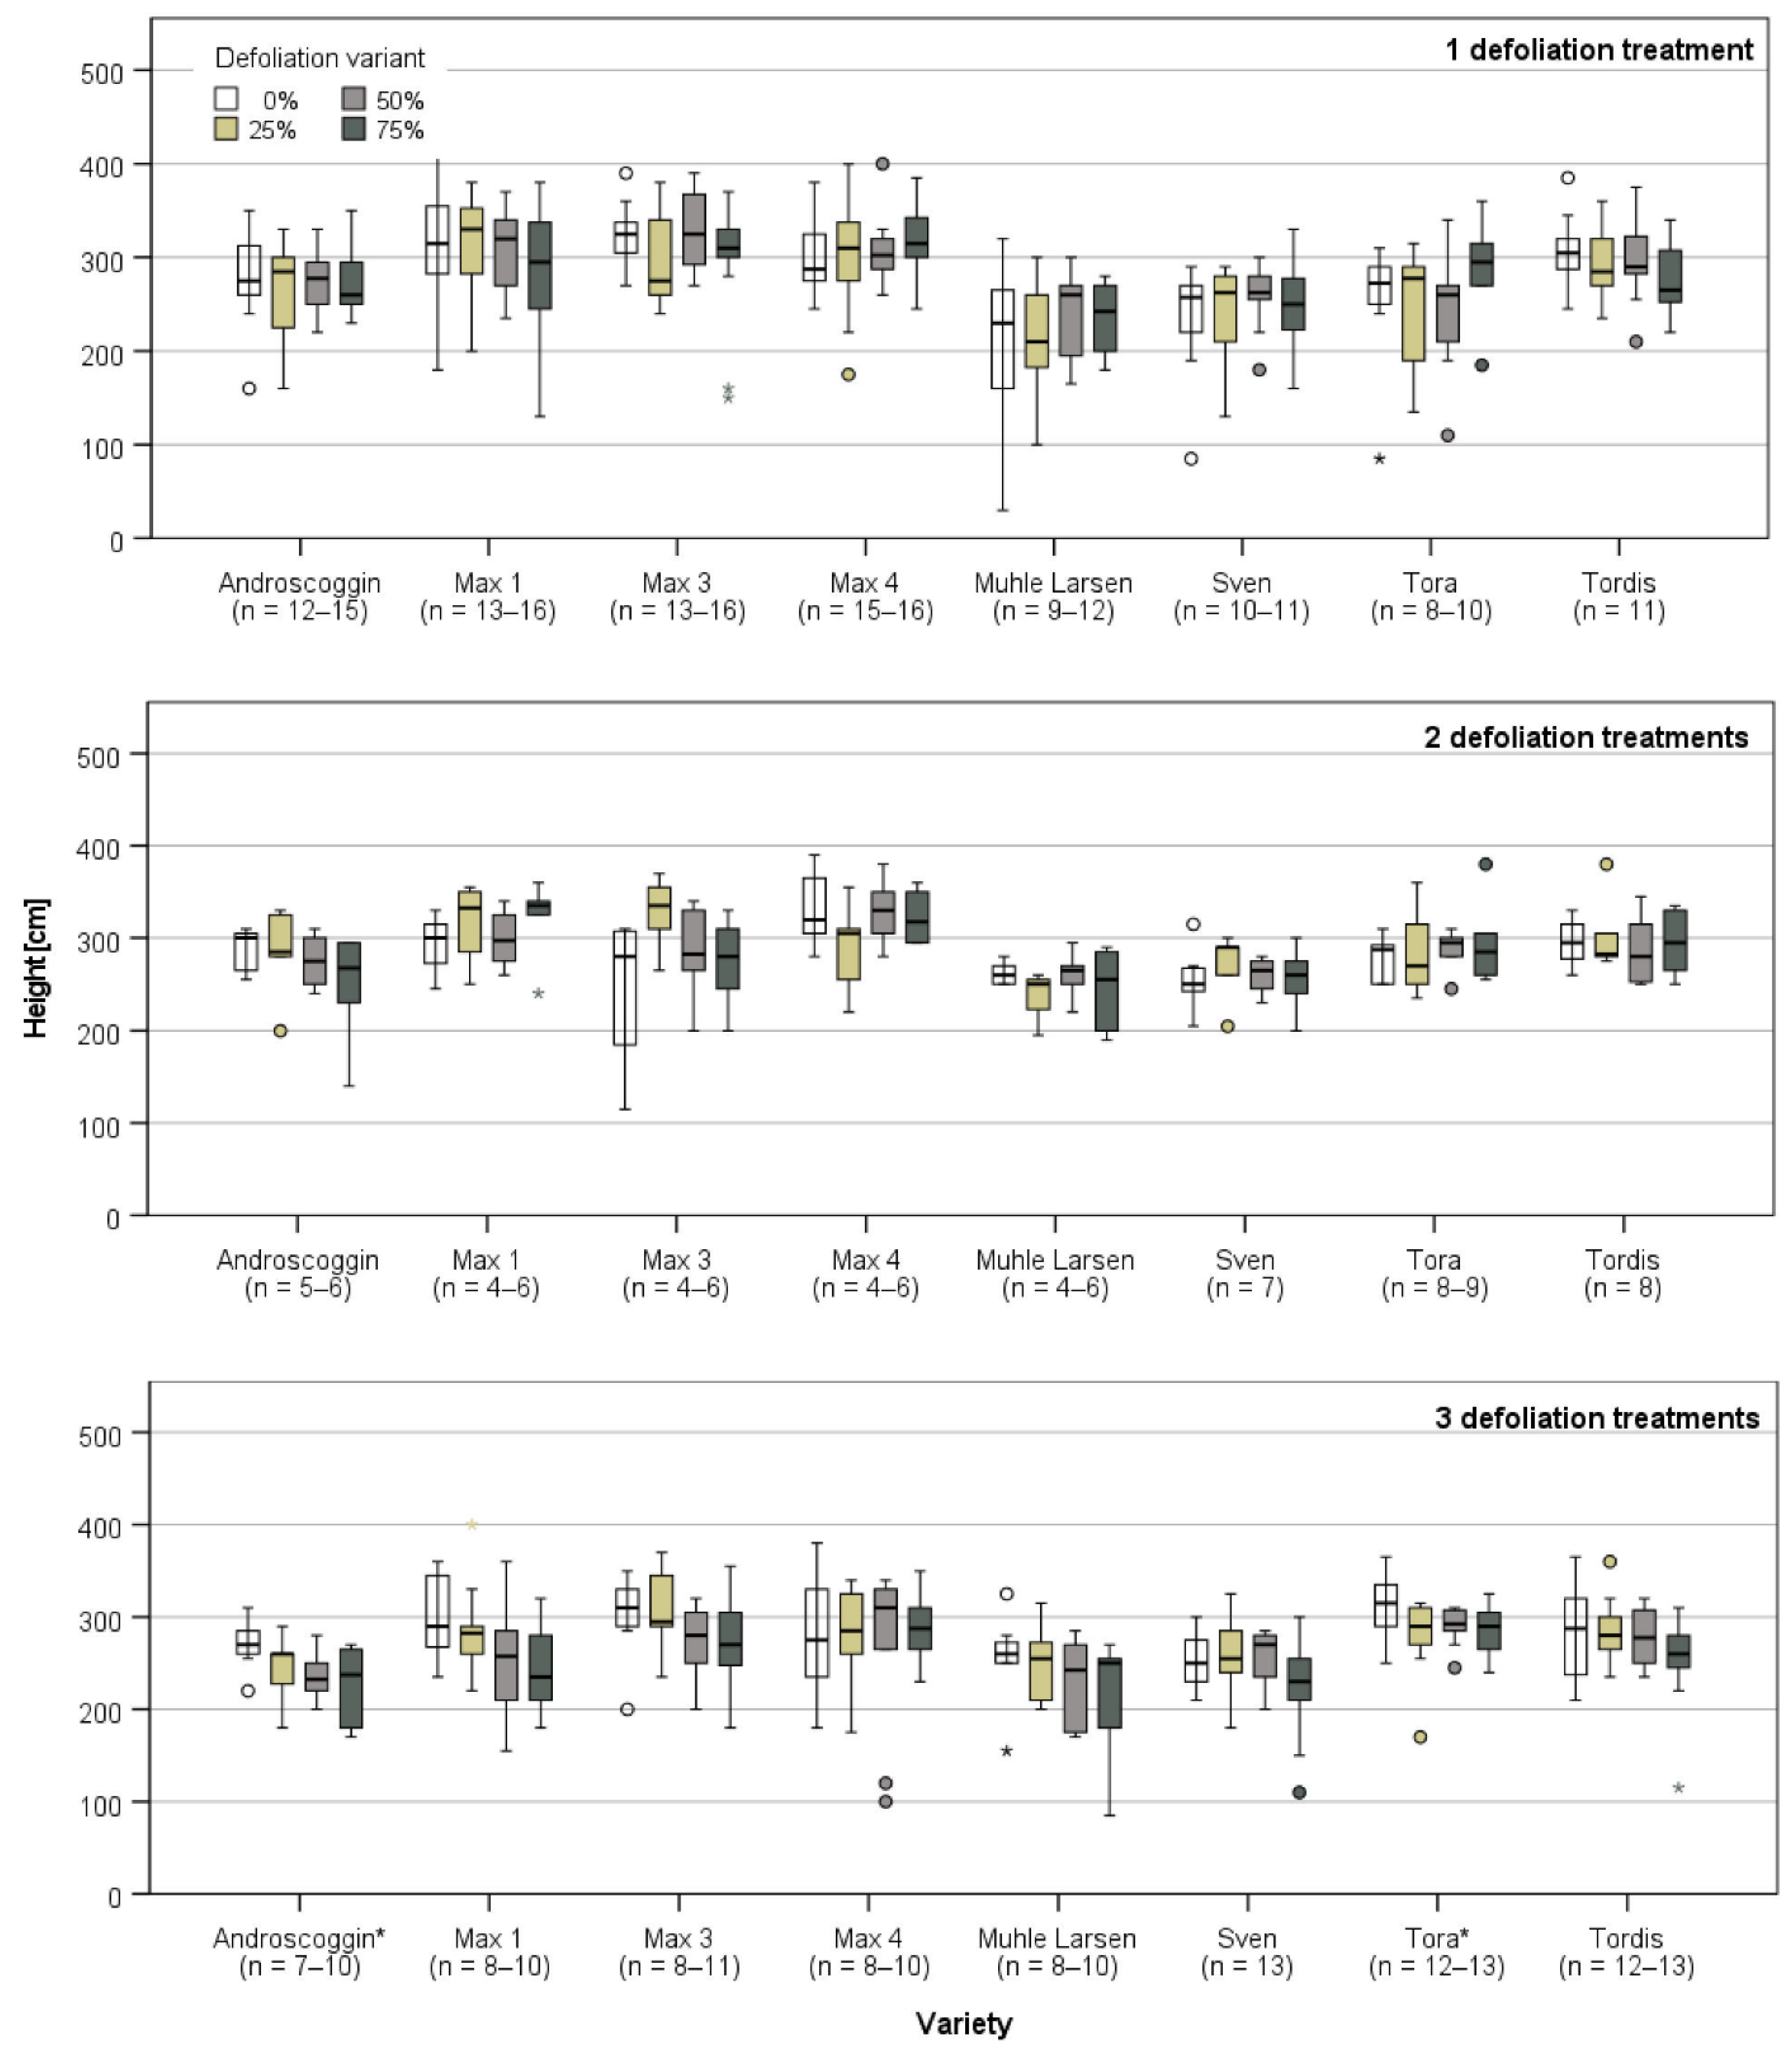
3.3. Plant Growth after the End of the Defoliation Treatments

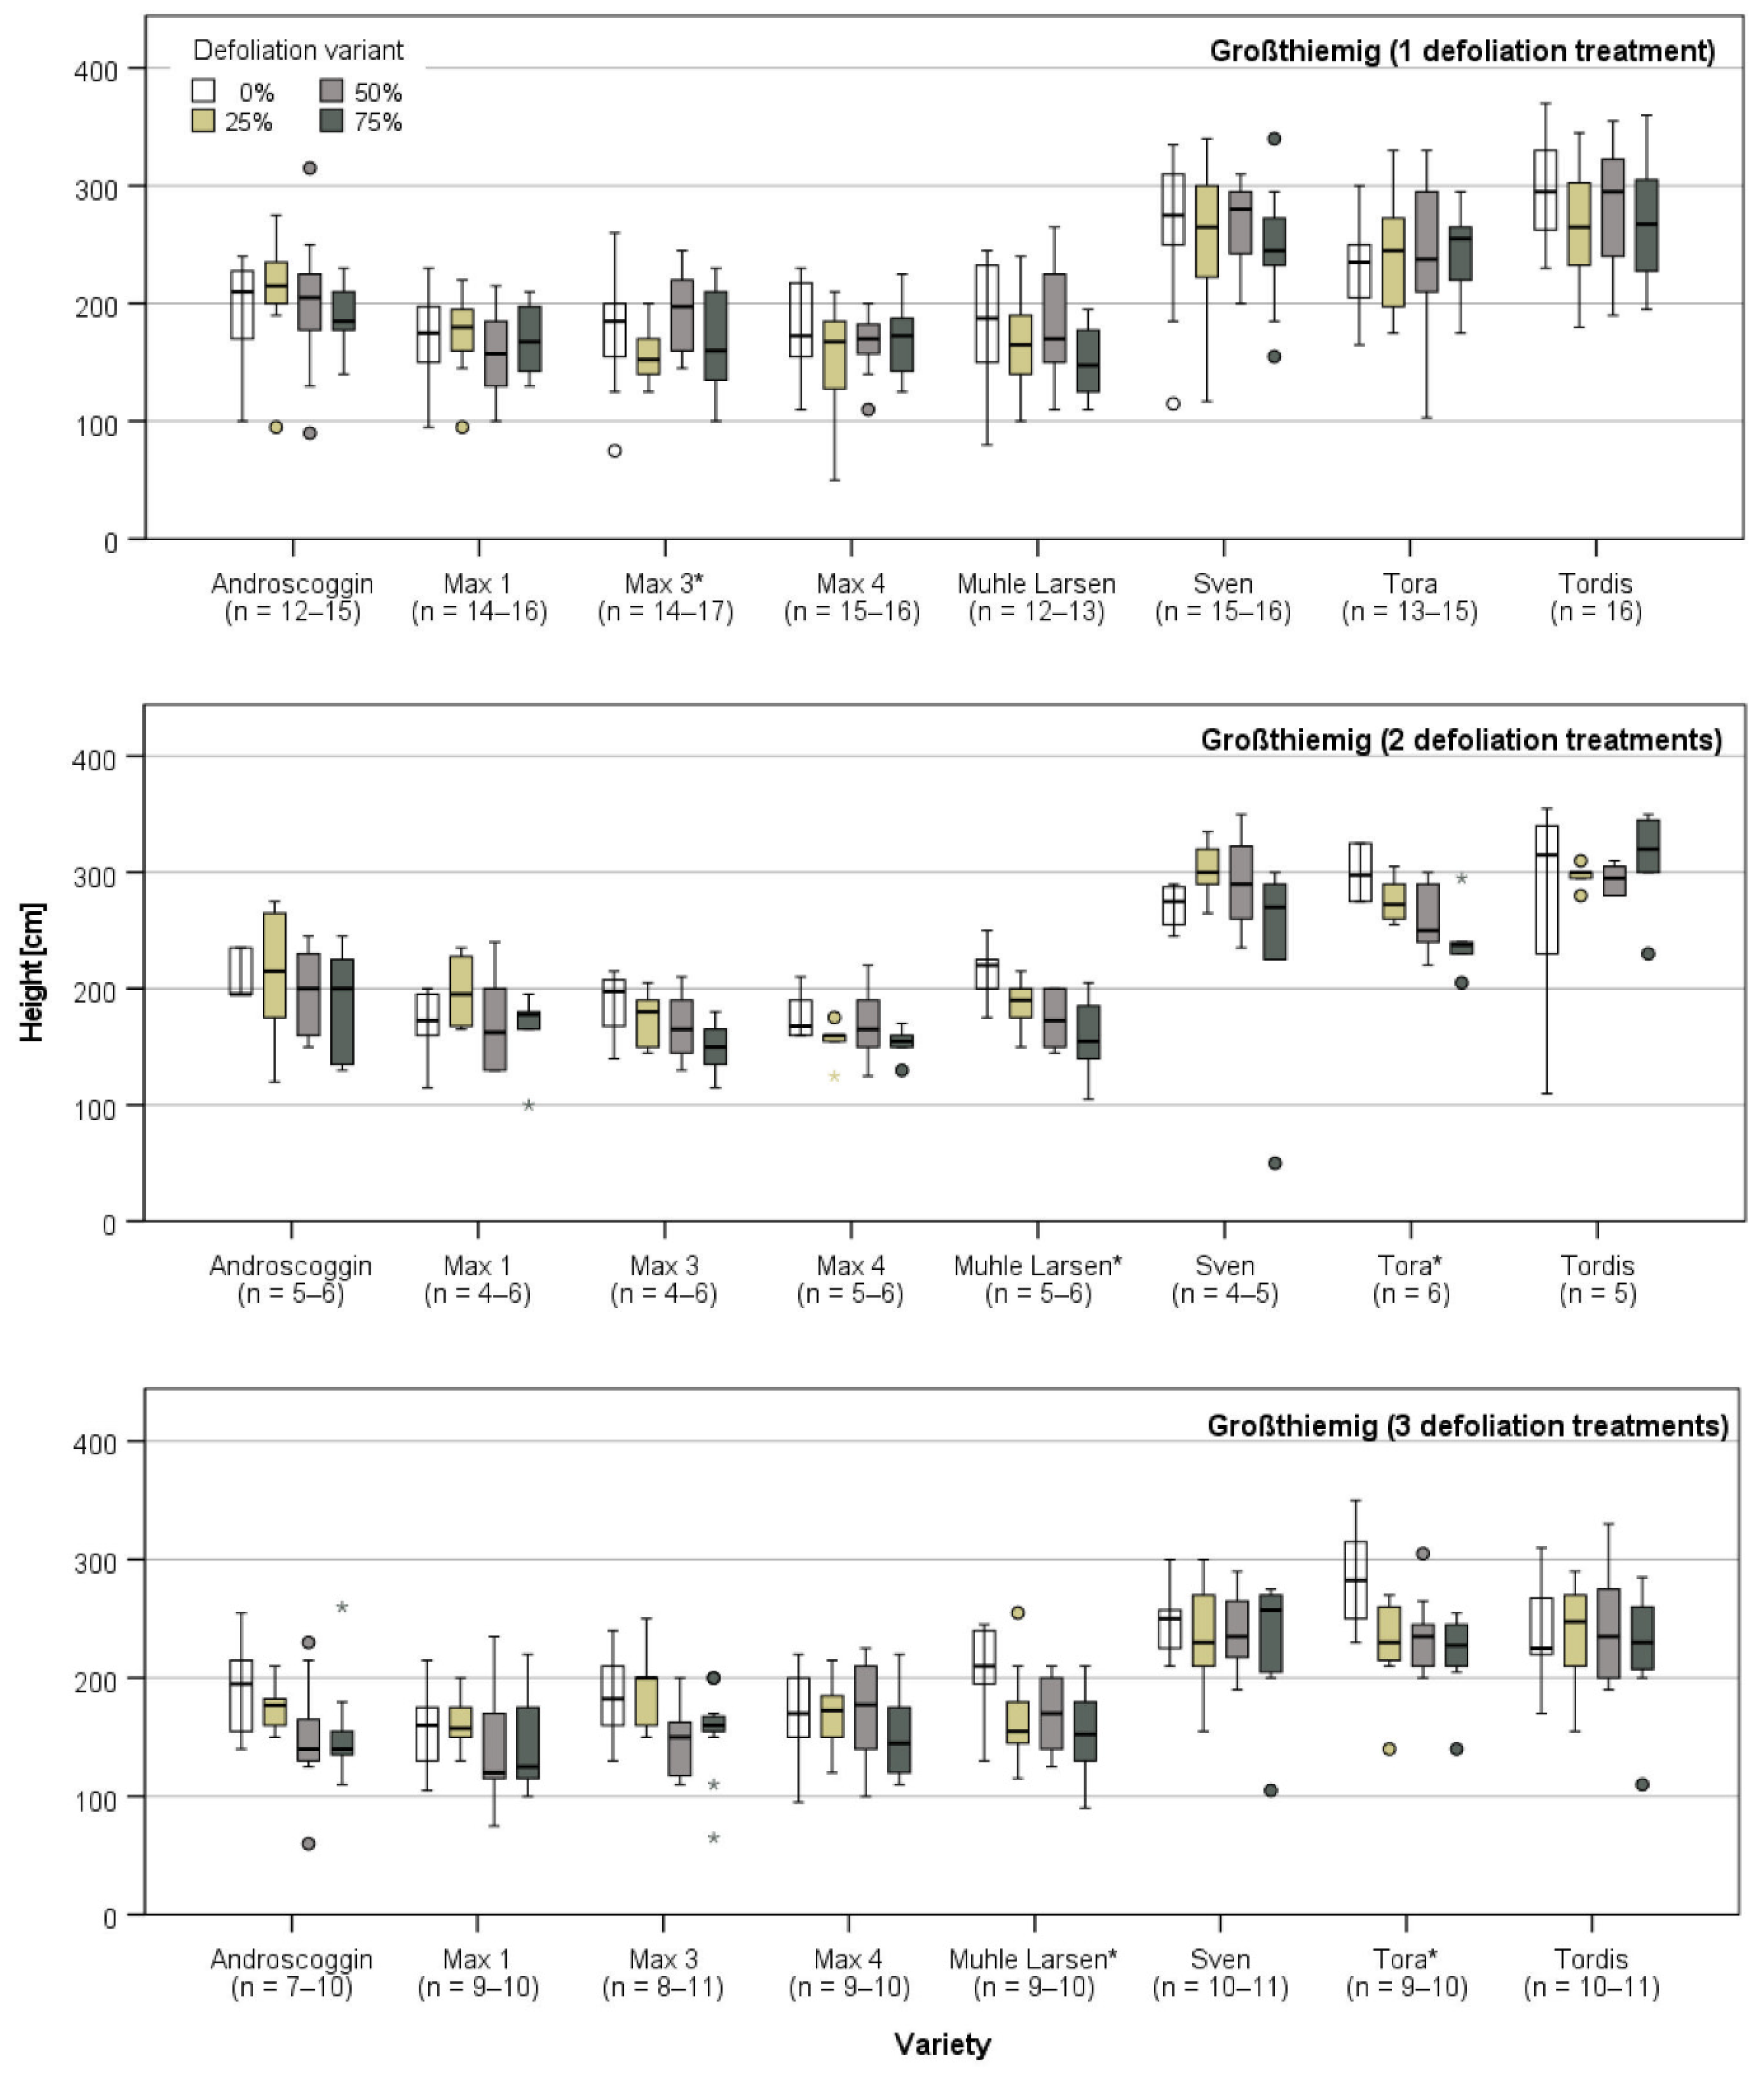
3.3.1. Harvest and Growth in Großthiemig

After the last data recording in February 2009, the short rotation coppice in Großthiemig was completely harvested manually to determine the weight of the aboveground biomass. However, it was not possible to determine the fresh weight of each individual plant. Instead, it was determined as the total weight of plants per variety, defoliation variant, and number of defoliation treatments. The options for statistical analyses are therefore limited and the sample size is very low. Not taking into account the number of defoliation treatments provides a sample size of n = 3, at which no statistically significant differences among defoliation variants are visible on the variety level (AN: p = 0.079–0.996), whereas on the tree genus level, undefoliated poplars had significantly greater fresh weights than 75% defoliated poplars (p = 0.045) (Figure 4). With a p value of 0.052, the comparison between 25% and 75% is very close to a significant difference. Looking merely at the statistical comparison of undefoliated and 75% defoliated plants instead of analyzing the differences among all four defoliation variants, significantly greater weights for undefoliated plants were computed for Muhle Larsen (TT: p = 0.014) as well as for the total of all poplar varieties (p = 0.011).
Despite a relatively low number of statistically significant differences, looking at absolute numbers and not considering the number of defoliation treatments, all plants that experienced leaf loss had lower fresh weights than undefoliated plants (Table 5). Poplars that had 75% of their foliage removed reached a 25% lower fresh weight than undefoliated plants, and poplars that had 50 or 25% of their foliage showed a fresh weight reduction of 9% or 1% in comparison to undefoliated plants. The corresponding values for willows are 5%, 3%, and 5%, meaning defoliation-induced fresh weight reductions were lower than for poplars. Moreover, willows in total had a 65% greater fresh weight than poplars. An effect of the number of defoliation treatments on the fresh weight of poplars (AN: p = 0.001) and willows (p = 0.000) is also visible when looking at the total of all plants. For both tree genera, all pairwise comparisons result in significant differences, with the one exception of poplars defoliated one time compared to those defoliated three times.
A detailed description of the dry weight data is omitted, since in hindsight we cannot completely rule out an error during data recording and analyses. One plausible result of these data is a statistically significant difference of the dry weight between 75% defoliated and undefoliated plants of Muhle Larsen (TT: p = 0.010), which was also computed for its fresh weight.
In June 2009, that is, three months after the harvest of the short rotation coppice in Großthiemig, the height of resprouting shoots and number of shoots per stool were recorded. Statistical analysis on the variety level only resulted in significant differences among defoliation variants for two groups (AN: Muhle Larsen/two defoliation treatments: p = 0.024, Max 3/total: p = 0.025) (Table 6). In contrast, on the tree genus level, significant differences in the number of shoots among the four defoliation variants were detected for poplars that had been defoliated twice (p = 0.007) and three times (p = 0.023), as well as in total (p = 0.002). In all three cases, undefoliated plants had a significantly greater number of shoots than 50% defoliated (p = 0.009–0.047) and 75% defoliated plants (p = 0.004–0.035). No effect of defoliations on the number of resprouting shoots after a harvest were recorded for willows.
Even though poplars on average had an 80 cm lower height than willows in June 2009, they reached a 10 cm greater height in September 2009. A statistical analysis of height data resulted in significant differences for the two-time defoliated plants of Max 1 (AN: p = 0.040) and the three-time defoliated plants of Max 3 (p = 0.002) and Tora (p = 0.026) in June, while in September, significant height differences were computed for the three-time defoliated plants of Androscoggin (p = 0.027) and Tora (p = 0.047) (Figure A3 and Figure A4 in Appendix A). When looking at pairwise comparisons, an effect of the number of defoliation treatments is visible again (Table 7). The more often plants were defoliated, the more often significant effects on plant heights were recorded.
Merely comparing undefoliated plants with plants with the greatest leaf loss, statistically significant differences only exist for plants that had been defoliated three times and when looking at the total of plants (Table 8 and Table 9). In general, height differences increase with an increasing number of defoliation treatments on the tree genus level, whereas this trend is hardly visible on the variety level. It is noticeable that the impact of defoliations on poplars is slightly greater than on willows, and that most of the significant height differences that were recorded in June still persisted in September. Furthermore, looking at the absolute figures of three-time defoliated plants, all varieties in June and all varieties with the exception of Max 4 in September showed reduced heights for 75% defoliated compared to undefoliated plants. Absolute height differences of undefoliated and 75% defoliated plants increased greatly between June and September.

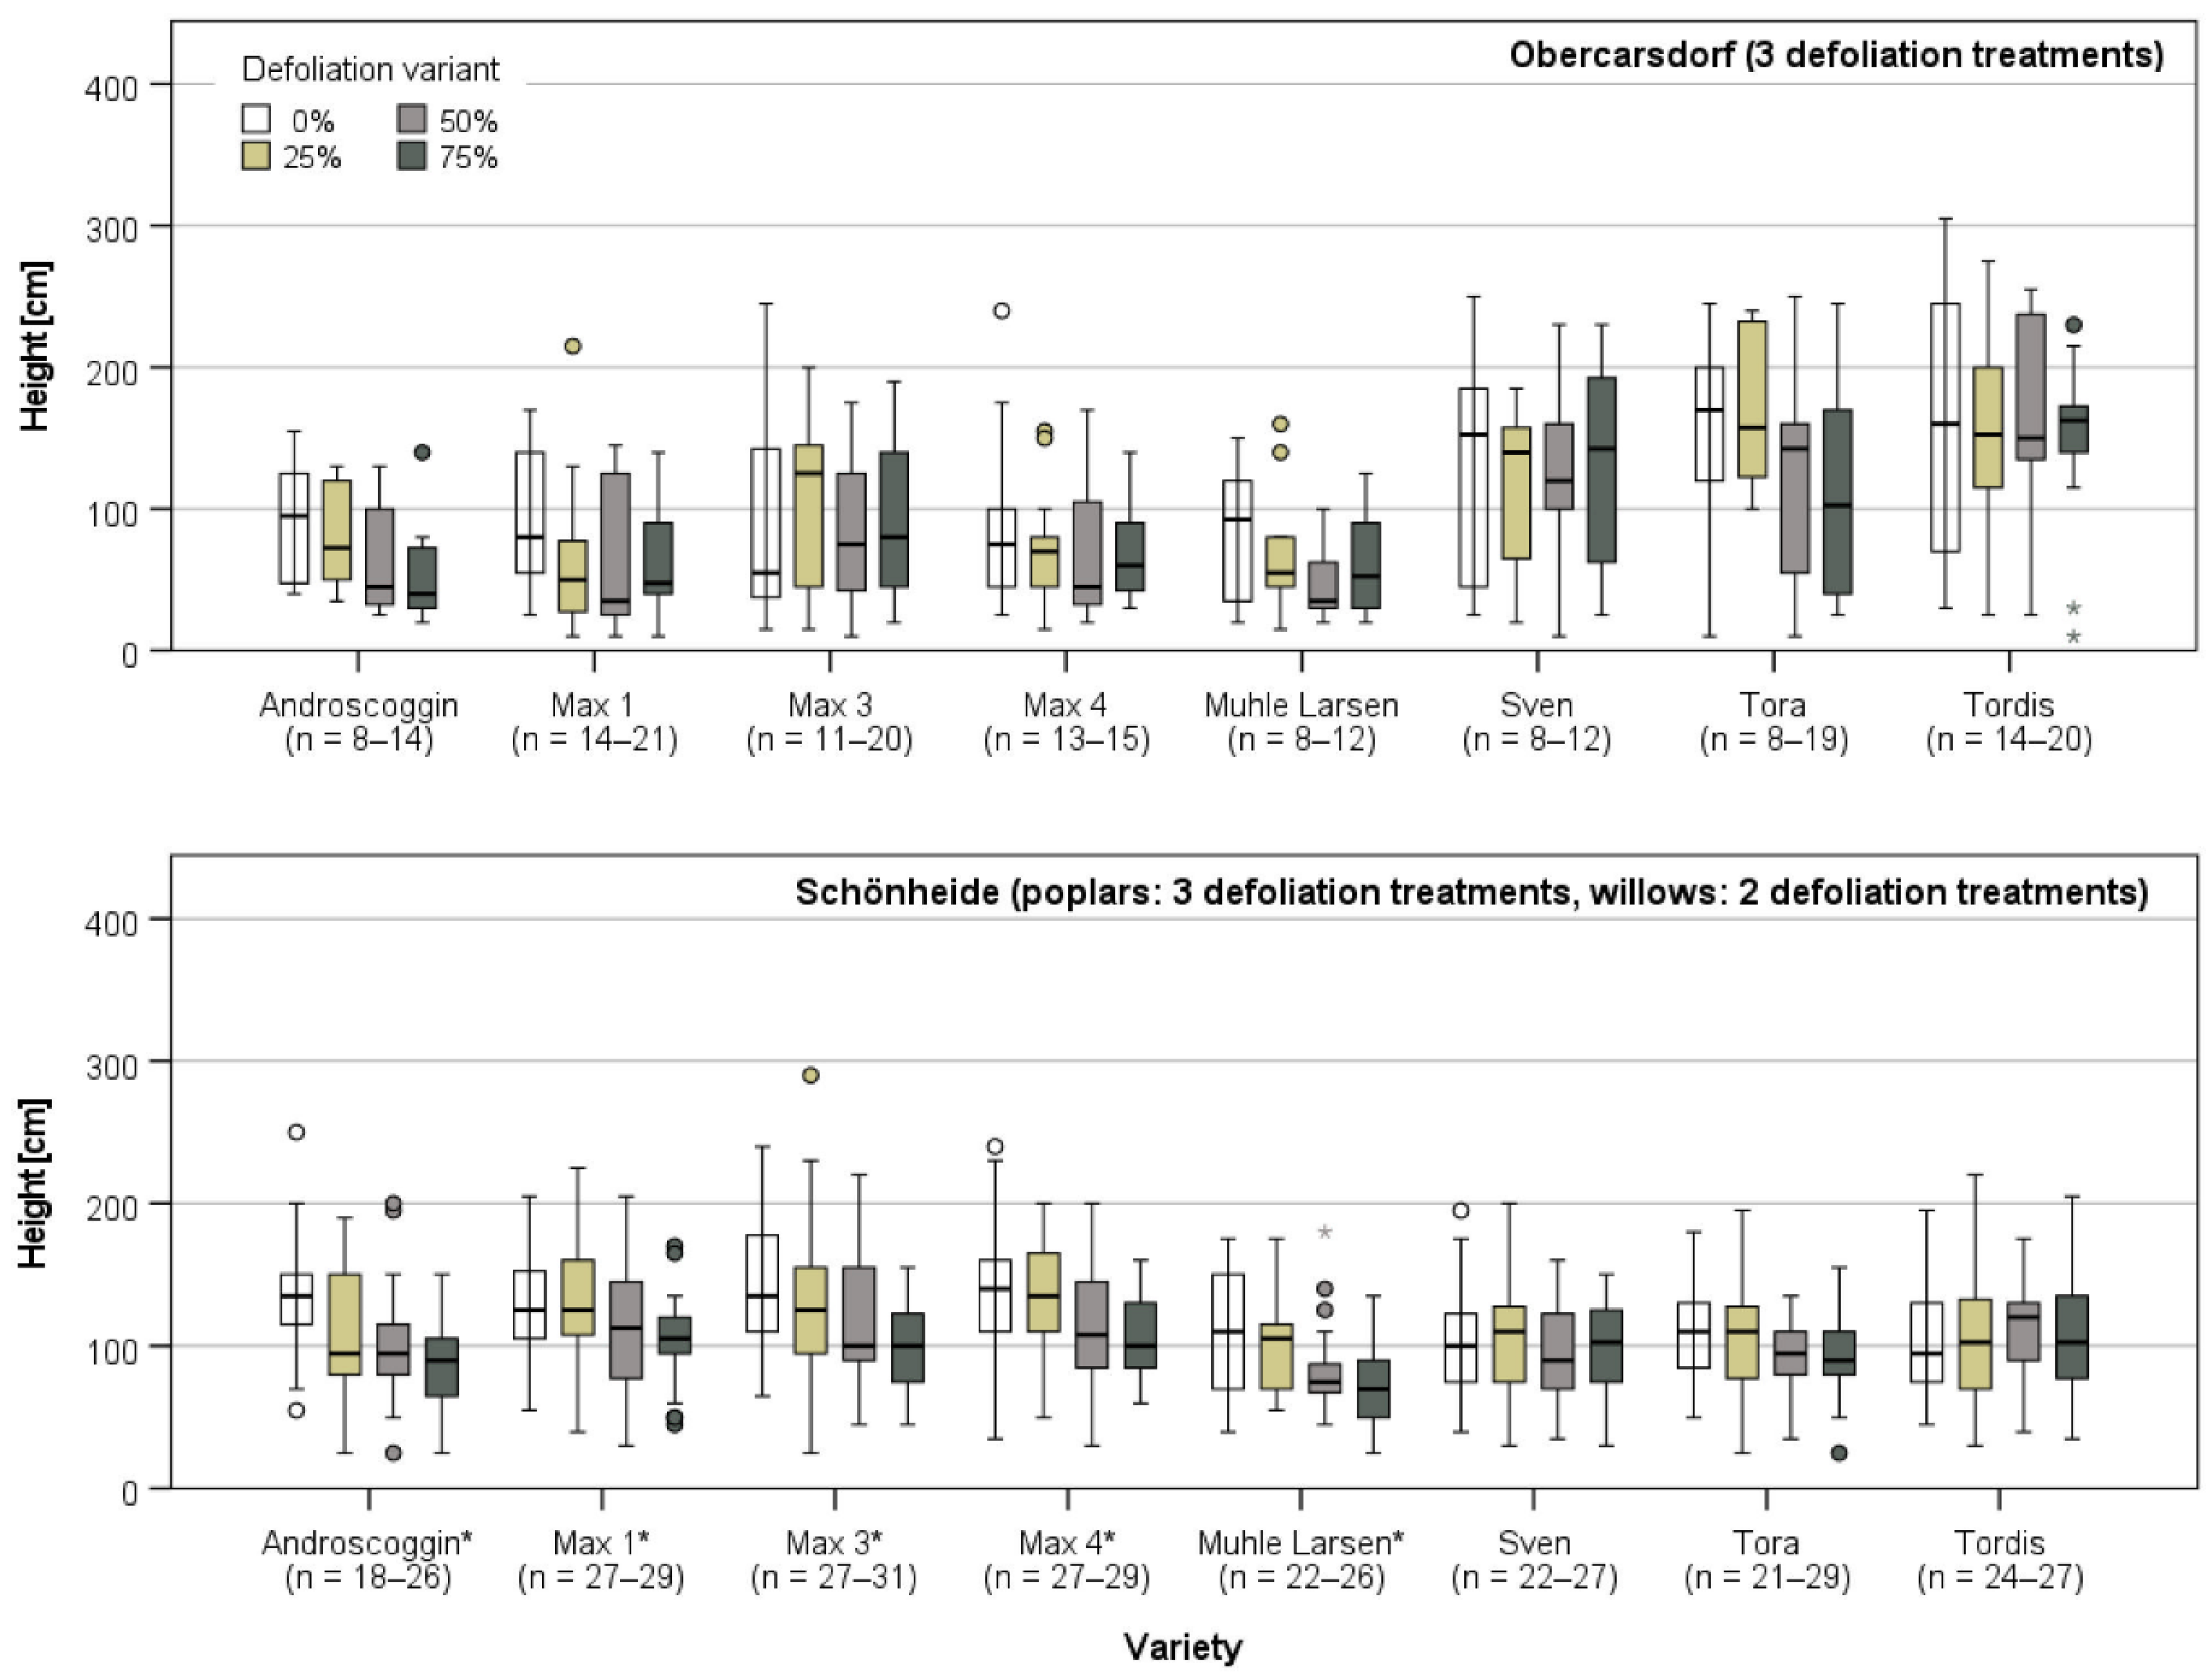
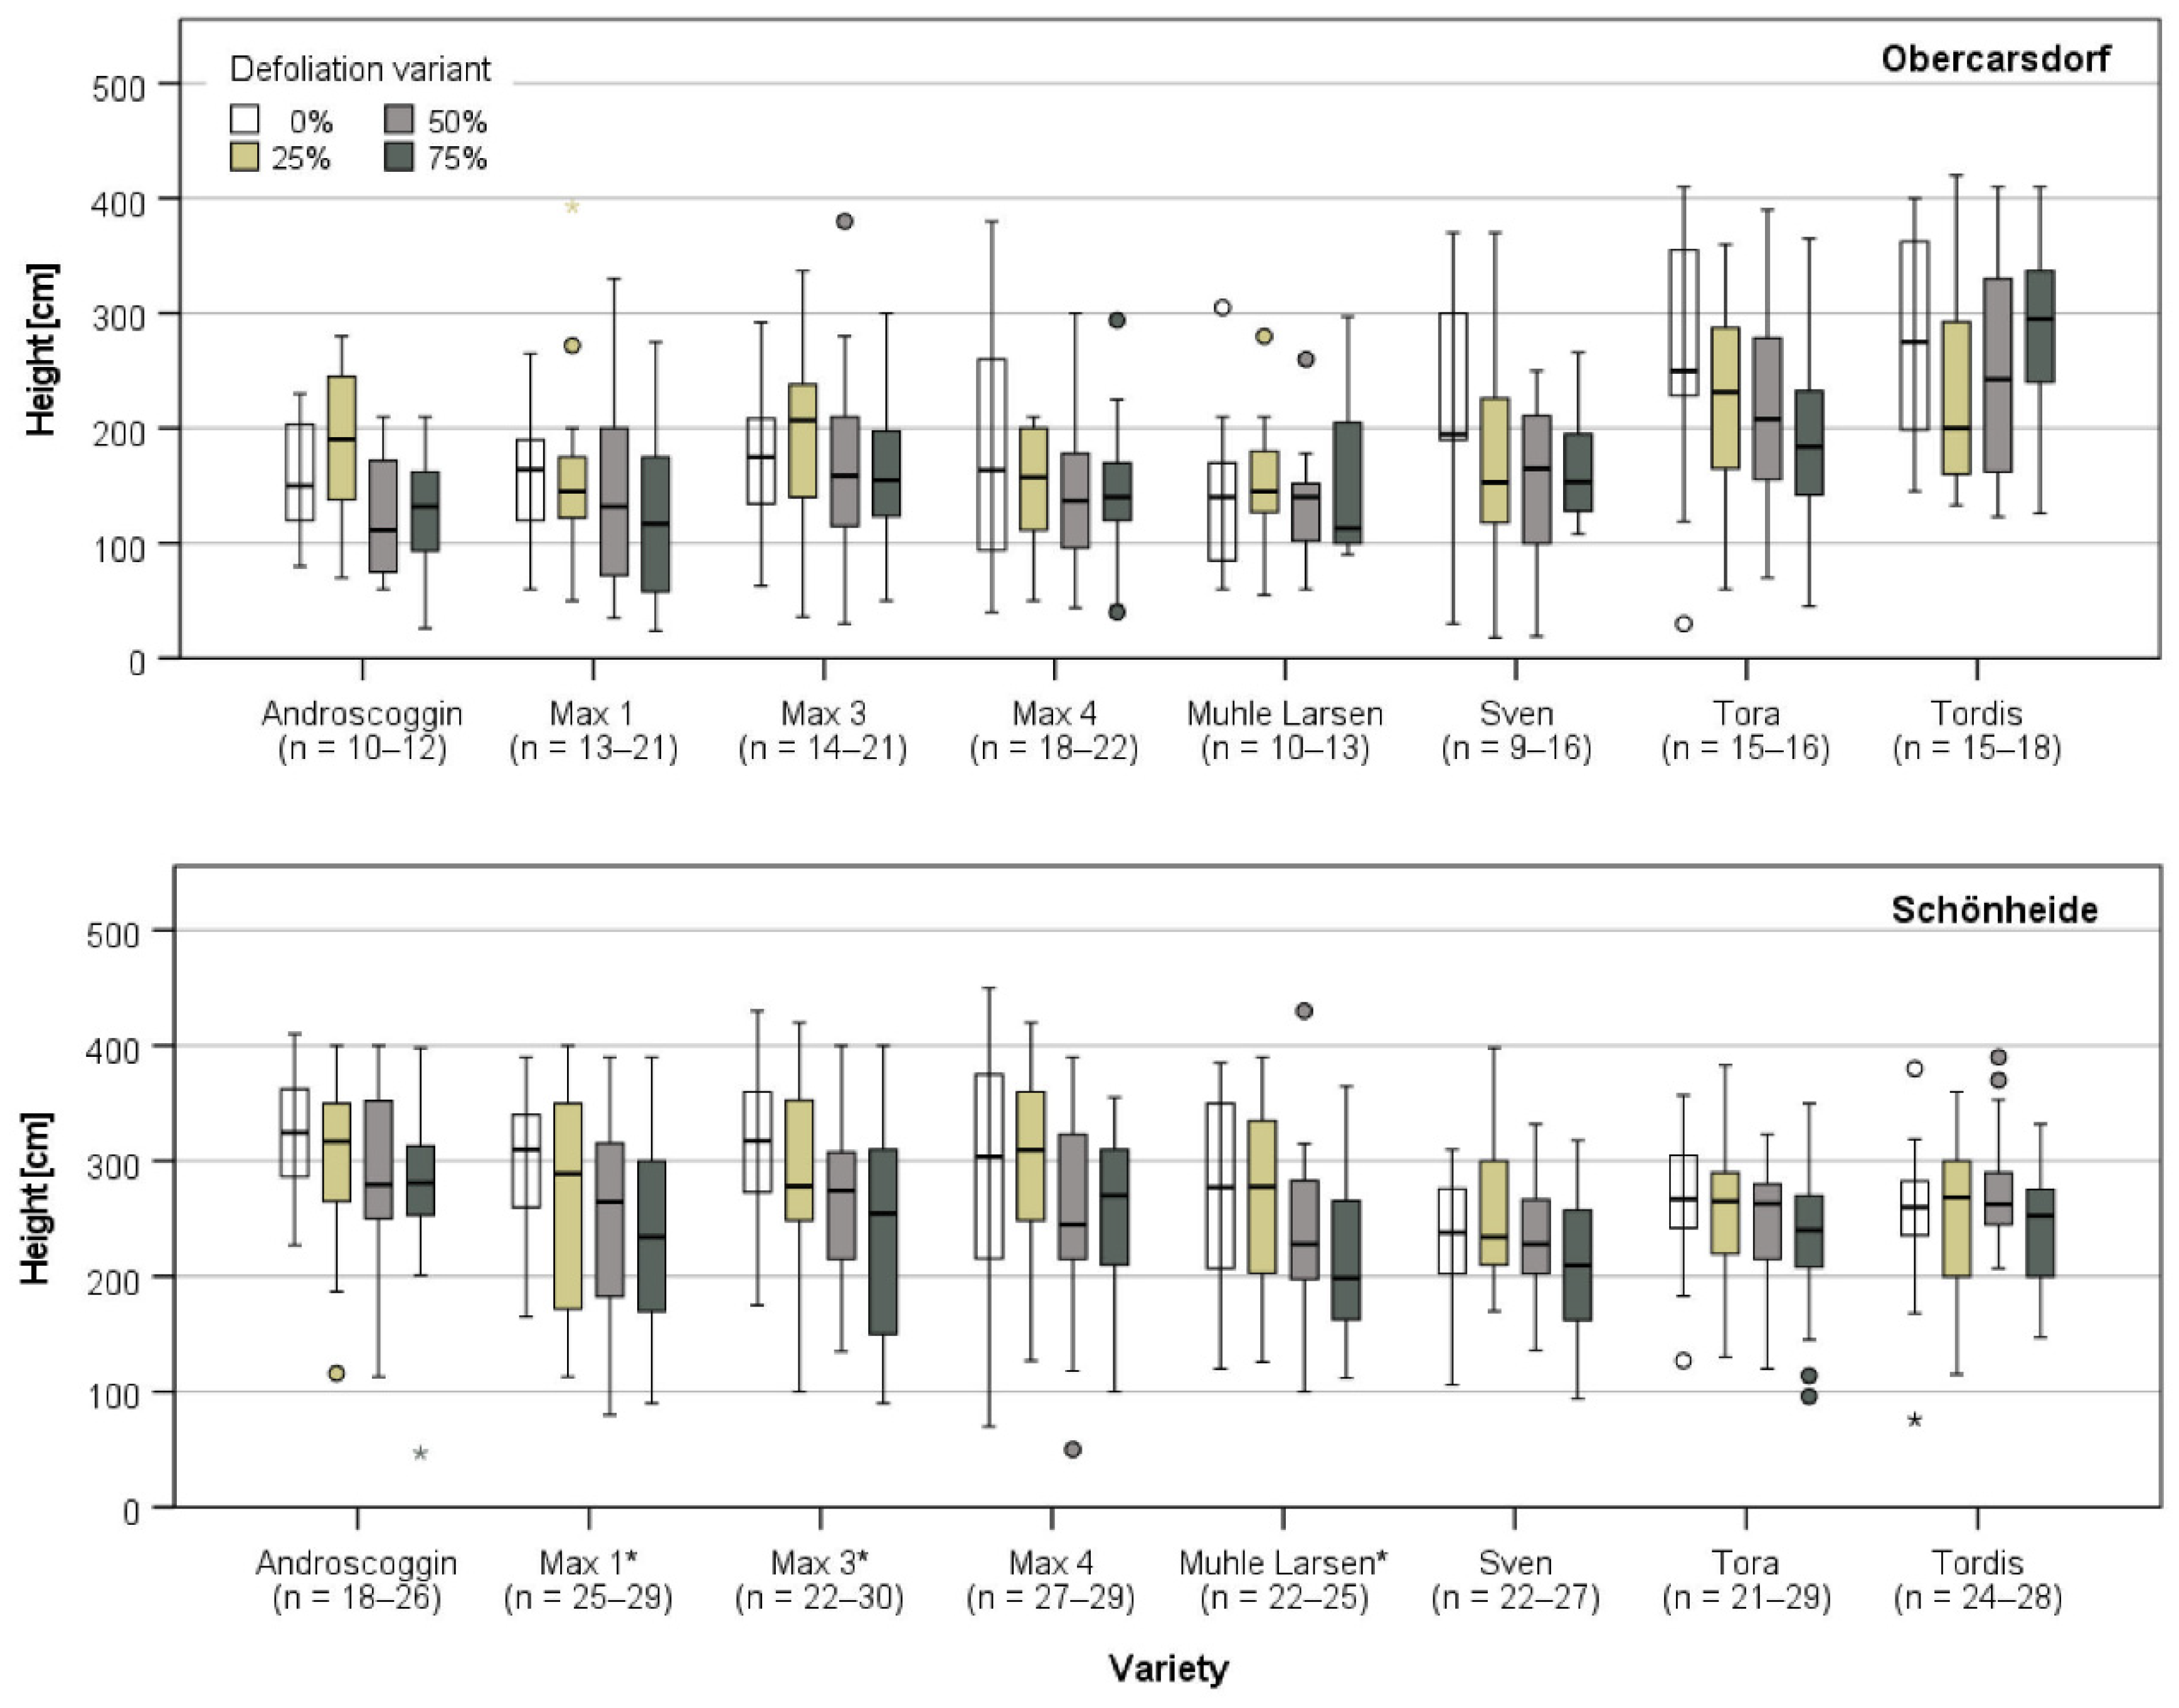
3.3.2. Growth in Obercarsdorf and Schönheide

After the last defoliation treatment in August 2008 and the final recording of height growth in April 2009, plants in the short rotation coppices in Obercarsdorf and Schönheide were measured again in April 2010 to study a potential long-term effect of defoliations. By this time a mechanical ground vegetation removal had led to plant losses and considerably lower plant numbers in Obercarsdorf than in Schönheide. Statistical analysis only resulted in significant height differences among defoliation variants for Max 1 (AN: p = 0.039), Max 3 (p = 0.007), and Muhle Larsen (0.023) in Schönheide (Figure 5). No such differences were computed for the plants in Obercarsdorf. Pairwise comparisons generally still show a decrease of p values with increasing difference in leaf loss (Table 10). Despite the statistically significant result for Muhle Larsen on the study site in Schönheide on the group level, no significant differences were detected with pairwise comparisons. However, comparison of plant heights between undefoliated and 25% defoliated plants with 75% defoliated plants are relatively close to a significant result (p = 0.055/0.056).
Comparing merely undefoliated and 75% defoliated plants results in considerably more significant height differences than analyzing differences among all four defoliation variants (Table 11). Significant differences were now also computed for the short rotation coppice in Obercarsdorf, where plants that had 75% of their foliage removed in 2007 and 2008 reached an almost one-third lower height in spring 2010 than undefoliated plants. Looking at the average of both study sites, a significant effect of previous defoliation treatments on plant height was still visible after a year without such a treatment for the poplar varieties Max 3 and Max 4 as well as the willow varieties Sven and Tora. While the height reduction percentages of the five poplar varieties are relatively close to each other with 14 to 22%, the very low reduction of about 1% for Tordis in comparison to a reduction of about 17% for Sven and Tora is noticeable for the three willow varieties.

4. Discussion

The results of this four-year study clearly show negative effects of defoliation on the height, fresh weight, and number of resprouting shoots of poplar and willow varieties, and that these effects explicitly depend on the site, tree species, and variety as well as the extent and number of defoliations. Several other studies on poplars and willows have also provided evidence for a plant growth reduction caused by defoliation and, in accordance with this study, for an increasing reduction of different growth parameters with an increasing extent of defoliation [25,41,44]. However, studies differ with regard to the minimum extent of leaf loss from which a significant effect on plant growth has to be expected. While some studies have already detected significant effects at 10–25% leaf loss [32,39,42], others have not recorded notable effects at defoliation levels of 40 and 50% but only starting from 75% [37,46]. In this study, significant effects were mainly detected at a defoliation level of 75% as well, but in several cases also at a level of 50%, in particular with plants that had been defoliated three times within two growing seasons. Only rarely did we record significant effects on plant height at a defoliation level of 25%. These exclusively occurred with the Tora variety, even though Bell et al. (2006) found the least effects of defoliation on this variety [24]. Anttonen et al. (2002) concluded that there is no consistently valid threshold value for negative effects of defoliation on plant growth but that instead it varies depending on the particular growth parameter [36].
When comparing the results of this study with literature, it has to be taken into account that other studies were often based on a different number of defoliation treatments per growing season and on different overall experiment durations. The maximum of three defoliation treatments within two growing seasons in this study lies below the number of treatments in many other studies that included two treatments within one growing season [24,42,44,47]. Moreover, Kendall et al. (1998) conclude that even two defoliation treatments within one growing season is not enough to simulate the natural defoliation by leaf beetles, which lasts for a longer period of time within the growing season [48]. This is why the defoliation treatment in some studies with poplars and willows was carried out four or five times within one growing season [25,32,41]. Therefore, we assume that a higher number of defoliation treatments in this study, for example two times instead of one time in the first growing season, would have led to a better reproduction of the natural defoliation on these sites and would have resulted in even greater effects on the plant growth parameters and a higher number of statistically significant differences between defoliation variants. This conclusion is also confirmed by comparing the growth parameters of the plants in Großthiemig defoliated once, twice, or three times among each another. However, we deliberately refrained from a second defoliation treatment in the first growing season to ensure the survival of plants despite the partly unfavorable site and climatic conditions, and guarantee the general feasibility of this study. An extension of the defoliation treatments to a third growing season was not possible, amongst others due to the great heights and leaf masses of plants.
Nevertheless, the data from this study in Saxony and Brandenburg are well in line with the results of similar studies. On the three study sites, the mean height reduction of poplars that had been defoliated three times to an extent of 75% was between 17 and 28%, and the maximum height reduction between 27 and 42%, in comparison to the plants that had not been defoliated, whereas the same defoliation treatment had a lower effect on willows and resulted in an average reduction of about 10%, with maximum values ranging from 22–26%. Correspondingly, Gao et al. (1985), Tucker et al. (2004), and Bassman et al. (1982) recorded height reductions between 20 and 31% for poplars with a defoliation level of 75% [37,42,46], and Kendall et al. (1998) determined a 15% height reduction for willows with a defoliation level of 70% [48]. With regard to the aboveground biomass, Reichenbacker et al. (1996) documented a reduction of 33% for poplars with a defoliation level of 75% in comparison to the zero variant [41], and Bell et al. (2006) and Kendall et al. (1998) a reduction of 31% and 36–72% for willows with a defoliation level of 70 and 75%, respectively [24,48]. The biomass reduction between 32 and 39% caused by severe defoliation by the leaf beetle Phratora vulgatissima on Salix viminalis lies in a similar range [49]. In comparison, the results of the fresh weight determination in this study on the plants at Großthiemig show considerably lower reduction values, at least partially. A reduction of 25% was recorded for all poplars, and 21% when merely considering the poplars that had been defoliated three times, whereas the corresponding values for willows are 5 and 18%. Reasons for these differences to other studies may be the lower age and heights of the plants in this study, which are associated with lower diameters so that height differences have a less pronounced effect on the biomass yield.
Our data further shows that the actual effects of defoliation on plants depend on numerous factors. The reaction of plants to herbivory varies according to the prevailing conditions, which can result in different growth losses at similar defoliation levels [49,50]. Since the total size of the photosynthetically active leaf area determines the yield production of plants [51], it is generally assumed that the reduction of leaf area by phyllophagous insects or leaf-infecting fungi reduces plant growth due to a reduction of the photosynthetic capacity [52,53,54]. However, under certain circumstances, leaf losses can be adjusted by compensatory growth, but the ability for it depends on several abiotic and biotic factors. Regarding abiotic factors, site conditions, such as the availability of soil water, the soil nutrient, and heavy metal content, play an important role [47,49,50]. Each deviation from the site optimum causes stress [55], which negatively affects the compensatory growth of plants [47]. The effect of site conditions is also well reflected in the results of this study. In particular with regard to the poplars, which have somewhat higher nutrient requirements compared to willows [56], a greater height reduction was recorded on the two study sites with rather unfavorable conditions, Obercarsdorf and Schönheide, in comparison to the site at Großthiemig, where conditions were more favorable for plant growth. Correspondingly, only the fertilized three-year-old birch plants in a study were able to fully compensate a 25% defoliation, whereas this defoliation resulted in a significant biomass yield reduction of unfertilized plants [36]. In another study, no effect of a medium-level defoliation of poplars by Clostera inclusa (Lepidopotera: Notodontidae) was only detected on the one study site with excellent conditions [57]. Besides the general growth conditions, the time of defoliation also influences its effects on plant growth. The earlier a defoliation takes place, the better plants are able to recover, that is, an early defoliation promotes the chances for compensatory growth [39,50,58]. The greatest impact on plant growth was recorded when poplars were defoliated during the most productive growth period between the beginning and the middle of summer [25]. The time of defoliation was no target parameter of this study, but the first and last defoliation treatment in July 2007 and August 2008 lay within the period mentioned by Larsson (1983) [25]. Only the defoliation treatment carried out between the beginning and middle of June 2008 was prior to this period and may have been balanced out more easily by compensatory growth.
Regarding biotic factors that have an influence on the compensatory growth of plants and therefore the effects of defoliation, tree species and variety play an especially important role. In a study with 11 willow varieties, significant differences in the reduction of plant height and biomass production caused by defoliation were documented [44]. On a few varieties, growth was not reduced but instead increased in comparison to the undefoliated plants, similar to the findings of another study on willows [38]. In contrast, the study by Bell et al. (2006) showed a negative reaction to simulated defoliation for all five willow varieties included, yet to a different extent [24]. In this study too, noticeable differences in the reaction to defoliation were recorded among varieties. While trends were relatively similar on all three study sites after the first defoliation treatment, there was no longer a consistent reaction of the individual varieties among sites after the third and last treatment. We noticed, however, that overall defoliation had a greater impact on the growth of poplar than on willow varieties. Comparing the heights of 75% defoliated plants to that of undefoliated ones, the promotion of plant growth by defoliation described by the two studies mentioned above [38,44] almost exclusively occurred with willow varieties, and on all three willow varieties included in this study. In particular with regard to the data recorded after the first defoliation treatment, an influence of the site conditions is visible as well. While 75% defoliated plants of all three willow varieties had a greater height as the undefoliated plants on the site with the most favorable conditions, those at the site with the least favorable conditions showed a reduced height growth. One reason for the generally better ability of willows for compensatory growth in comparison to poplars may be their superior regeneration capacity [5,59], which does not only apply after harvests but apparently also after defoliations. In contrast, only a single case of an increased growth of 75% defoliated plants compared to undefoliated plants occurred with poplars, namely with the Max 3 variety at the site in Obercarsdorf after the first defoliation treatment. Overall, the statement that faster growing poplar varieties suffer from greater height reductions by defoliations than slower growing varieties [46] was not confirmed by the data of this study. For example, plants of the Muhle Larsen variety often had significantly lower heights than other varieties but nevertheless showed rather great defoliation-induced height reductions.
The data of this study also suggests a lasting effect of defoliation events on the height growth of poplars and willows, and even on the number and height of resprouting shoots of plants that were harvested after those events. Accordingly, yield losses caused by artificial defoliation of willows during the first three-year growth period still persisted after the second three-year growth period without defoliation treatments [24]. Defoliation-induced reductions of root growth and drought tolerance are assumed to be some of the reasons for these long-term effects [41,60].

5. Conclusions

The results of this study confirm the literature stating that even minor leaf loss can have an impact on plant growth in short rotation coppices, which may also last. However, the actual effects of defoliation on a plant depend on numerous external and internal factors, which determine the ability of the plant for compensatory growth. In some cases, leaf loss can be fully compensated or, in single cases, even overcompensated. According to the results from Saxony and Brandenburg, this particularly applies to willow varieties.
Due to the illustrated complexity of the reaction of plants to leaf loss, an exact quantification of potential growth losses with regard to the extent of leaf loss as well as a specification of threshold values that, for example, indicate when control measures against phyllophagous pest insects in short rotation coppices are advisable, are hardly possible. In general, our data indicates that poplars are more susceptible to defoliation than willows, meaning control measures need to be applied earlier, and that defoliation levels above 50% often lead to significant growth reductions. Willows seem to be more resilient, which makes the need for interventions in these coppices less probable. However, the fact that the susceptibility to defoliation increases with decreasing site quality and with an increasing number of defoliation events applies to both tree genera. Ultimately, only the regular survey of plant growth and damage on site and their comparison to coppices on similar sites can help to assess the effects of existing leaf loss on the growth of the plants and the ability of the coppice for compensatory growth. In some cases, it can be profitable to already initiate countermeasures at moderate leaf loss. This particularly applies to situations when the survival of plants in newly established plantations is at risk due to leaf loss. If available, we also recommend considering the predictions of prognosis models on the weather-dependent population growth of the main insect pests during the decision process for or against control measures.

Author Contributions

Conceptualization, M.G.M., C.E.H. and D.L.; methodology, C.E.H.; software, C.E.H.; validation, M.G.M., C.E.H. and D.L.; formal analysis, C.E.H.; investigation, C.E.H.; resources, M.G.M. and C.E.H.; data curation, C.E.H.; writing—original draft preparation, C.E.H.; writing—review and editing, C.E.H. and D.L.; visualization, C.E.H. and D.L.; supervision, M.G.M.; project administration, M.G.M. and C.E.H.; funding acquisition, M.G.M. All authors have read and agreed to the published version of the manuscript.

Funding

This research was carried out within the AGROWOOD project funded by the German Federal Ministry of Education and Research (BMBF) (grant number 0330710 A).

Acknowledgments

We sincerely thank the Research Institute for Post-Mining Landscapes in Finsterwalde and the P&P Tree Nursery in Großthiemig for providing poplar cuttings at no charge, and the LTS GmbH in Groß Luja, the organic farm Biohof Böhme in Obercarsdorf and the P&P Tree Nursery in Großthiemig for providing the sites and the soil preparation for our sample coppices at no charge.

Conflicts of Interest

The authors declare no conflict of interest. The funders had no role in the design of the study; in the collection, analyses, or interpretation of data; in the writing of the manuscript, or in the decision to publish the results.

Appendix A

Table A1. Mean percentage of surviving plants on the three study sites in July/August 2007 four months after the establishment of the short rotation coppices (bold values indicate mean values of all varieties of a tree genus, different capital letters indicate statistically significant differences between tree genera, different small letters indicate statistically significant differences between varieties within tree genera).
Study Site
Genus/VarietyGroßthiemigObercarsdorfSchönheide
Poplars93.3A82.0A81.4A
Androscoggin89.8a65.6a70.3a
Max 196.1ab87.5bc85.9bc
Max 394.5ab93.7c89.1c
Max 498.4b87.5bc88.3c
Muhle Larsen87.5a75.8ab73.4ab
Willows96.4B84.1A84.1A
Sven94.5a82.0a83.6a
Tora96.1a76.6a82.8a
Tordis98.4a93.7b85.9a
Figure A1. Height of poplar and willow varieties on the three study sites in summer 2007 prior to the start of the defoliation treatments (n = range of number of plants per variety).
Forests 12 01224 g0a1
Figure A2. Height of poplar and willow varieties on the three study sites in December 2007 after the first defoliation treatment in July/August 2007, with the exception of the willow varieties in Schönheide (n = range of number of plants per defoliation variant, * statistically significant difference according to ANOVA).
Forests 12 01224 g0a2
Figure A3. Height of poplar and willow varieties on the study site in Großthiemig in June 2009 after a harvest of the short rotation coppice in March 2009 with regard to the number of defoliation treatments and the defoliation treatment variant in 2007 and 2008 (n = range of number of plants per defoliation variant, * statistically significant difference according to ANOVA).
Forests 12 01224 g0a3
Figure A4. Height of poplar and willow varieties on the study site in Großthiemig in September 2009 after a harvest of the short rotation coppice in March 2009 with regard to the number of defoliation treatments and the defoliation treatment variant in 2007 and 2008 (n = range of number of plants per defoliation variant, * statistically significant difference according to ANOVA).
Forests 12 01224 g0a4

References

  1. Landgraf, D.; Carl, C.; Neupert, M. Biomass yield of 37 different SRC poplar varieties grown on a typical site in north eastern Germany. Forests 2020, 11, 1048. [Google Scholar] [CrossRef]
  2. Bielefeldt, J.; Bolte, A.; Busch, G.; Dohrenbusch, A.; Kroiher, F.; Lamersdorf, N.; Schulz, U.; Stoll, B. Energieholzproduktion in der Landwirtschaft—Chancen und Risiken aus Sicht des Natur—und Umweltschutzes; Naturschutzbund Deutschland, e.V.: Berlin, Germany, 2008. [Google Scholar]
  3. Ball, J.P.; Carle, J.; del Lungo, A. Contribution of poplars and willows to sustainable forestry and rural development. Unasylva Engl. 2005, 56, 3–9. [Google Scholar]
  4. Dimitriou, I.; Aronsson, P. Willows for energy and phytoremediation in Sweden. Unasylva Engl. 2005, 56, 47–50. [Google Scholar]
  5. Hofmann, M. Energieholzproduktion in der Landwirtschaft; Fachagentur Nachwachsende Rohstoffe e.V.: Gülzow, Germany, 2010.
  6. Isebrands, J.G.; Richardson, J. (Eds.) Poplars and Willows: Trees for Society and the Environment; CABI: Wallingford, UK, 2014. Available online: http://www.fao.org/3/i2670e/i2670e.pdf (accessed on 23 August 2021).
  7. Wolf, H.; Schildbach, M.; Hartmann, K.-U. Plantagenbaumarten und deren Züchtung. In AGROWOOD: Kurzumtriebsplantagen in Deutschland und Europäische Perspektiven; Bemmann, A., Knust, C., Eds.; Weißensee-Verlag: Berlin, Germany, 2010; pp. 30–43. [Google Scholar]
  8. Schwerdtfeger, F. Pappelkrankheiten und Pappelschutz. In Das Pappelbuch; Hesmer, H., Ed.; Verlag des Deutschen Pappelvereins: Bonn, Germany, 1951; pp. 155–186. [Google Scholar]
  9. Prien, S.; Sann, H. Probleme des Forstschutzes in forstlichen Plantagen. In Probleme und Methodische Fragen der Plantagenwirtschaft mit Forstlichen Baumarten; Walter, F., Ed.; Agrarwissenschaftliche Gesellschaft der Deutschen Demokratischen Republik: Dresden, Germany, 1981; pp. 51–57. [Google Scholar]
  10. Andow, D.A. Vegetational Diversity and Arthropod Population Response. Annu. Rev. Entomol. 1991, 36, 561–586. [Google Scholar] [CrossRef]
  11. Führer, E.; Bacher, H. Biotische Schadrisiken in Energieholzplantagen. Anz. Schädlingskunde 1991, 64, 1–8. [Google Scholar] [CrossRef]
  12. Coyle, D.R.; Nebeker, T.E.; Hart, E.R.; Mattson, W.J. Biology and management of insect pests in North American intensively managed hardwood forest systems. Annu. Rev. Entomol. 2005, 50, 1–29. [Google Scholar] [CrossRef] [Green Version]
  13. Splechtna, B.; Glatzel, G. Optionen der Bereitstellung von Biomasse aus Wäldern und Energieholzplantagen für die Energetische Nutzung: Szenarien, ökologische Auswirkungen, Forschungbedarf. In Materialien der Interdisziplinären Arbeitsgruppe Zukunftsorientierte Nutzung Länderlicher Räume—LandInnovation Nr. 1; Berlin-Brandenburgische Akademie der Wissenschaften: Berlin, Germany, 2005. [Google Scholar]
  14. Brändle, M.; Brandl, R. Species richness of insects and mites on trees: Expanding Southwood. J. Anim. Ecol. 2001, 70, 491–504. [Google Scholar] [CrossRef]
  15. Bußler, H. Schmetterlinge und Käfer an der Schwarzpappel. LWF Wissen 2006, 52, 35–38. [Google Scholar]
  16. Hacker, H. Die Insektenwelt der Weiden. LWF Wissen 2000, 24, 26–29. [Google Scholar]
  17. Kennedy, C.E.J.; Southwood, T.R.E. The number of species of insects associated with British trees: A reanalysis. J. Anim. Ecol. 1984, 53, 455–478. [Google Scholar] [CrossRef]
  18. Delplanque, A. Les Insectes Associés aux Peupliers; Editions Memor: Bruxelles, Belgium, 1998. [Google Scholar]
  19. Richter, D. Insektenschäden in Weidenkulturen und Maßnahmen zu Ihrer Verhütung; Merkblatt 30; Institut für Forstwissenschaften Eberswalde, Abteilung Forstschutz Gegen Tierische Schädlinge: Eberswalde, Germany, 1959.
  20. Helbig, C.; Müller, M.; Landgraf, D. Insect pests in short rotation coppice in Germany—An overview of their effects, risk potential and control measures. In Short Rotation Forestry and Agroforestry: An Exchange of Experience between CDM Countries and Europe; Benwood Project Consortium: Barolo, Italy, 2011; pp. 46–56. [Google Scholar]
  21. Jaskiewicz, B.; Gorska Drabik, E.; Golan, K. Szkodniki zagrazajace uprawom wierzby wiciowej [Salix viminalis]. Ochr. Rosl. 2004, 48, 24–25. [Google Scholar]
  22. Georgi, R.; Müller, M. Biotic risk factors in short rotation coppice in Germany: Current situation, new findings and future prospects. In Bioenergy from Dendromass for the Sustainable Development of Rural Areas; Butler Manning, D., Bemmann, A., Bredemier, M., Lamersdorf, N., Ammer, C., Eds.; Wiley-VCH: Weinheim, Germany, 2015; pp. 199–216. [Google Scholar]
  23. Helbig, C.; Müller, M. Naturale Risiken und Grundzüge des Schadensmanagements in Kurzumtriebsplantagen. In AGROWOOD: Kurzumtriebsplantagen in Deutschland und Europäische Perspektiven; Bemmann, A., Knust, C., Eds.; Weißensee-Verlag: Berlin, Germany, 2010; pp. 74–87. [Google Scholar]
  24. Bell, A.C.; Clawson, S.; Watson, S. The long-term effect of partial defoliation on the yield of short-rotation coppice willow. Ann. Appl. Biol. 2006, 148, 97–104. [Google Scholar] [CrossRef]
  25. Larsson, S. Effects of artificial defoliation on stem growth in Salix smithiana grown under intensive culture. Oecologica Appl. 1983, 4, 343–349. [Google Scholar]
  26. Crawley, M.J. Reduction of oak fecundity by low-density herbivore populations. Nature 1985, 314, 163–164. [Google Scholar] [CrossRef]
  27. Kosola, K.R.; Dickmann, D.I.; Paul, E.A.; Parry, D. Repeated insect defoliation effects on growth, nitrogen acquisition, carbohydrates, and root demography of poplars. Oecologia 2001, 129, 65–74. [Google Scholar] [CrossRef] [PubMed]
  28. Gieger, T.; Thomas, F.M. Effects of defoliation and drought stress on biomass partitioning and water relations of Quercus robur and Quercus petraea. Basic Appl. Ecol. 2002, 3, 171–181. [Google Scholar] [CrossRef]
  29. Chen, Z.; Kolb, T.E.; Clancy, K.M. Effects of artificial and western spruce budworm (Lepidoptera: Tortricidae) defoliation on growth and biomass allocation of Douglas-fir seedlings. J. Econ. Entomol. 2002, 95, 587–594. [Google Scholar] [CrossRef]
  30. Baldwin, I.T. Herbivory simulations in ecological research. Trends Ecol. Evol. 1990, 5, 91–93. [Google Scholar] [CrossRef]
  31. Wright, S.L.; Hall, R.W.; Peacock, J.W. Effect of simulated insect damage on growth and survival of northern red oak (Quercus rubra L.) seedlings. Environ. Entomol. 1989, 18, 235–239. [Google Scholar] [CrossRef]
  32. Powers, S.J.; Peacock, L.; Yap, M.L.; Brain, P. Simulated beetle defoliation on willow genotypes in mixture and monotype plantations. Ann. Appl. Biol. 2006, 148, 27–38. [Google Scholar] [CrossRef]
  33. Paré, P.W.; Tumlinson, J.H. Plant volatiles as a defense against insect herbivores. Plant Physiol. 1999, 121, 325–331. [Google Scholar] [CrossRef] [PubMed] [Green Version]
  34. Picard, S.; Chenault, J.; Augustin, S. Short time induction defense of a leuce poplar clone (P. tremula x P. tremuloides) against Chrysomela tremulae-propagation and evolution. Acta Hortic. 1994, 381, 540–543. [Google Scholar] [CrossRef]
  35. Coyle, D.R.; McMillin, J.D.; Hall, R.B.; Hart, E.R. Cottonwood leaf beetle (Coleoptera: Chrysomelidae) defoliation impact on Populus growth and above-ground volume in a short-rotation woody crop plantation. Agric. For. Entomol. 2002, 4, 293–300. [Google Scholar] [CrossRef] [Green Version]
  36. Anttonen, S.; Piispanen, R.; Ovaska, J.; Mutikainen, P.; Saranpaa, P.; Vapaavuori, E. Effects of defoliation on growth, biomass allocation, and wood properties of Betula pendula clones grown at different nutrient levels. Can. J. For. Res. 2002, 32, 498–508. [Google Scholar] [CrossRef]
  37. Gao, R.T.; Qin, X.X.; Li, J.Z.; Hao, W.Q.; Wang, X.Z. A preliminary study on the relationship between artificial defoliation of poplar trees and their growth. Sci. Silvae Sin. 1985, 21, 199–205. [Google Scholar]
  38. Houle, G.; Simard, G. Additive effects of genotype, nutrient availability and type of tissue damage on the compensatory response of Salix planifolia ssp. planifolia to simulated herbivory. Oecologia 1996, 107, 373–378. [Google Scholar] [CrossRef]
  39. Kendall, D.A. Phenology and Population Dynamics of Willow Beetles (Coleoptera: Chrysomelidae) in Short-Rotation Coppiced Willows at Long Ashton; ETSU B/M4/00487/14/REP; Energy Technology Support Unit: Harwell, UK, 1996. [Google Scholar]
  40. Osier, T.L.; Lindroth, R.L. Long-term effects of defoliation on quaking aspen in relation to genotype and nutrient availability: Plant growth, phytochemistry and insect performance. Oecologia 2004, 139, 55–65. [Google Scholar] [CrossRef]
  41. Reichenbacker, R.R.; Schultz, R.C.; Hart, E.R. Artificial defoliation effect on Populus growth, biomass production, and total nonstructural carbohydrate concentration. Environ. Entomol. 1996, 25, 632–642. [Google Scholar] [CrossRef]
  42. Tucker, S.A.; Nebeker, T.E.; Warriner, M.D.; Jones, W.D.; Beatty, T.K. Effects of artificial defoliation on the growth of cottonwood: Simulation of cottonwood leaf beetle defoliation. In Proceedings of the 12th Biennial Southern Silvicultural Research Conference; Biloxi, MS, USA, 24–28 February 2003, General Technical Report Southern Research Station, USDA Forest Service, SRS-71; USDA Forest Service: Asheville, NC, USA, 2004; pp. 169–171. [Google Scholar]
  43. Deutscher Wetterdienst. Klimadaten zum Direkten Download. Vieljährige Mittelwerte für den Zeitraum 1981–2021. Available online: https://www.dwd.de/DE/leistungen/cdc/cdc_ueberblick-klimadaten.html?nn=17626&lsbId=344084 (accessed on 23 August 2021).
  44. Peacock, L.; Herrick, S.; Harris, J. Interactions between the willow beetle Phratora vulgatissima and different genotypes of Salix viminalis. Agric. For. Entomol. 2002, 4, 71–79. [Google Scholar] [CrossRef]
  45. IBM SPSS Statistics for Windows; Version 26.0.; IBM SPSS: Armonk, NY, USA, 2019.
  46. Bassman, J.; Myers, W.; Dickmann, D.; Wilson, L. Effects of simulated insect damage on early growth of nursery-grown hybrid poplars in northern Wisconsin. Can. J. For. Res. 1982, 12, 1–9. [Google Scholar] [CrossRef]
  47. Zvereva, E.L.; Kozlov, M.V. Effects of pollution-induced habitat disturbance on the response of willows to simulated herbivory. J. Ecol. 2001, 89, 21–30. [Google Scholar] [CrossRef]
  48. Kendall, D.A.; Wiltshire, C.W.; Royle, D.J.; Paul, L.; Holdenrieder, O. Life-cycles and ecology of willow beetles on Salix viminalis in England. Eur. J. For. Pathol. 1998, 28, 281–288. [Google Scholar] [CrossRef]
  49. Björkman, C.; Hoglund, S.; Eklund, K.; Larsson, S. Effects of leaf beetle damage on stem wood production in coppicing willow. Agric. For. Entomol. 2000, 2, 131–139. [Google Scholar] [CrossRef]
  50. Maschinski, J.; Whitham, T.G. The continuum of plant responses to herbivory: The influence of plant association, nutrient availability, and timing. Am. Nat. 1989, 134, 1–19. [Google Scholar] [CrossRef]
  51. Boelcke, B. Schnellwachsende Baumarten auf Landwirtschaftlichen Flächen; Ministeriums für Ernährung, Landwirtschaft, Forsten und Fischerei. 2006. Available online: https://docplayer.org/52963448-Schnellwachsende-baumarten-auf-landwirtschaftlichen-flaechen-leitfaden-zur-erzeugung-von-energieholz.html (accessed on 23 August 2021).
  52. Begon, M.; Mortimer, M.; Thompson, D.J.; Müller, J. Populationsökologie; Spektrum-Lehrbuch; Spektrum Akademischer Verlag: Heidelberg, Germany, 1997. [Google Scholar]
  53. Christersson, L.; Ramstedt, M.; Forsberg, J. Pests, diseases and injuries in intensive short-rotation forestry. In Ecophysiology of Short Rotation Forest Crops; Mitchell, C.P., Ed.; Elsevier Science Publisher: London, UK, 1992; pp. 185–215. [Google Scholar]
  54. Jug, A. Ernährungs-und standortskundliche Untersuchungen. In Modellvorhaben “Schnellwachsende Baumarten”: Zusammenfassender Abschlussbericht; Schriftenreihe Nachwachsende Rohstoffe; Hofmann, M., Ed.; Landwirtschaftsverlag: Münster, Germany, 1999; Volume 13, pp. 369–396. [Google Scholar]
  55. Albrecht, J.; Böden, E. Zur Krankheitsanfälligkeit von zugelassenen Pappelklonen der Sektionen Aigeiros und Tacamahaca. Holzzucht 1988, 42, 25–29. [Google Scholar]
  56. Schildbach, M.; Grünewald, H.; Wolf, H.; Schneider, B.-U. Begründung von Kurzumtriebsplantagen: Baumartenwahl und Anlageverfahren. In Anbau und Nutzung von Bäumen auf Landwirtschaftlichen Flächen; Reeg, T., Bemmann, A., Konold, W., Murach, D., Spieker, H., Eds.; Wiley-VCH: Weinheim, Germany, 2009; pp. 57–71. [Google Scholar]
  57. Solomon, J.D.; Oliveria, F.L. Evaluation of Poplar Tentmaker Defoliation on Growth and Survival of Older Cottonwood Plantations; Research NoteSO-271; U.S. Department of Agriculture, Forest Service, Southern Forest Experiment Station: Asheville, NC, USA, 1993.
  58. Bogacheva, I.A. Compensation of foliage losses in willow in the forest-tundra during an outbreak of leaf-eating insects. Lesovedenie 1994, 6, 62–69. [Google Scholar]
  59. Boelcke, B. Ertragspotenzial und Ertragsaufbau von Weiden spec. in Kurzumtriebsplantagen. In Anbau und Nutzung von Bäumen auf Landwirtschaftlichen Flächen: 1. Fachtagung; Technische Universität Dresden: Tharandt, Germany, 2006; pp. 51–56. [Google Scholar]
  60. Bach, C.E. Effects of herbivory and genotype on growth and survivorship of sand-dune willow (Salix cordata). Ecol. Entomol. 1994, 19, 303–309. [Google Scholar] [CrossRef]
Figure 1. Planting design of the sample short rotation coppices (above) and design of leaf clipping of the different defoliation treatments (below).
Forests 12 01224 g001
Figure 2. Height of poplar and willow varieties on the study site in Großthiemig with regard to the number of defoliation treatments prior to the start of the growing season in 2009 (n = range of number of plants per defoliation variant, * statistically significant difference according to ANOVA).
Forests 12 01224 g002
Figure 3. Height of poplar and willow varieties on the study sites in Obercarsdorf and Schönheide after two and/or three defoliation treatments prior to the start of the growing season in 2009 (n = range of number of plants per defoliation variant, * statistically significant difference according to ANOVA).
Forests 12 01224 g003
Figure 4. Fresh weight of aboveground biomass of plants on the study site in Großthiemig in February 2009 (n per variety and defoliation variant = 3 by not taking into account the number of defoliations).
Forests 12 01224 g004
Figure 5. Height of poplar and willow varieties on the study sites in Obercarsdorf and Schönheide prior to the start of the growing season in April 2010 with regard to the defoliation variant in 2007 and 2008 (n = range of number of plants per defoliation variant, * statistically significant difference according to ANOVA).
Forests 12 01224 g005
Table 1. Height differences of 75% defoliated and undefoliated plants (Δ 75-0) in December 2007 after the first defoliation treatment (bold values indicate mean values of all varieties of a tree genus, * statistically significant difference according to t test).
Study Site
GroßthiemigObercarsdorfSchönheide
Genus/VarietyΔ 75-0
[cm]
Δ 75-0
[%]
Δ 75-0
[cm]
Δ 75-0
[%]
Δ 75-0
[cm]
Δ 75-0
[%]
Poplars−13.4 *−10.7−5.8−8.3−13.0 *−16.0
Androscoggin−14.6−10.3−20.7−24.8−34.3−38.2
Max 1−1.2−1.1−7.0−10.8−0.8−1.2
Max 3−15.9−12.310.313.9−17.1−19.1
Max 4−11.2−9.1−6.4−9.4−9.8−12.5
Muhle Larsen−30.8 *−24.2−15.2−23.6−23.3−28.9
Willows16.511.7−1.4−1.7−20.8−22.4
Sven6.24.25.07.5−3.5−12.1
Tora16.711.8−26.5−30.1−18.8−18.8
Tordis26.519.814.315.2−7.0−5.2
Table 2. p values of pairwise comparisons of plant heights among defoliation variants (DVs) for both tree genera (green) as well as for all varieties with at least one significant value (orange) on the study site in Großthiemig with regard to the number of defoliation treatments prior to the start of the growing season in 2009 via Tukey HSD test (bold values indicate statistically significant differences).
Genus LevelVariety Level
Großthiemig (1 defoliation treatment)
Willows
DV0%25%50%75% DV0%25%50%75%
Poplars0%0.6750.9970.604Max 30%
25%0.5070.8000.99925%0.290
50%1.0000.5130.73650%0.5740.024
75%0.3050.9870.31575%0.8760.7740.229
Großthiemig (2 defoliation treatments)
Willows Tora
DV0%25%50%75% DV0%25%50%75%
Poplars0%0.9640.9980.547Muhle Larsen0%0.4400.0640.005
25%0.9170.9190.26825%0.4300.6660.134
50%0.3990.7950.65150%0.1230.8830.666
75%0.0240.1150.51575%0.0200.3780.773
Großthiemig (3 defoliation treatments)
Willows Tora
DV0%25%50%75% DV0%25%50%75%
Poplars0%0.1230.2900.027Muhle Larsen0%0.0130.0350.004
25%0.5920.9690.94325%0.1070.9810.978
50%0.0120.2760.73350%0.1950.9820.857
75%0.0010.0620.89375%0.0180.8920.683
Table 3. p values of pairwise comparisons of plant heights among defoliation variants (DVs) for both tree genera (green) as well as for all varieties with at least one significant value (orange) on the study sites in Obercarsdorf and Schönheide with regard to the number of defoliation treatments prior to the start of the growing season in 2009 via Tukey HSD test (bold values indicate statistically significant differences).
Genus/Variety LevelVariety Level
Obercarsdorf (3 defoliation treatments)
Willows
DV0%25%50%75%
Poplars0%0.9950.9050.752 no case of pairwise comparisons among defoliation variants with at least one significant value
25%0.8270.9810.914
50%0.0430.2610.992
75%0.0570.3170.999
Schönheide (poplars: 3 defoliation treatments, willows: 2 defoliation treatments)
Willows
DV0%25%50%75% DV0%25%50%75%
Poplars0%0.9890.7470.644Andros-coggin0%
25%0.2610.9050.83225%0.154
50%0.0000.0130.99850%0.0290.930
75%0.0000.0000.10075%0.0040.4570.769
Max 3 Muhle Larsen
DV0%25%50%75% DV0%25%50%75%
Max 10%0.8050.1330.004Max 40%0.9600.0840.004
25%0.9790.5860.06025%0.9410.2620.026
50%0.2410.4510.57150%0.1250.3520.761
75%0.0280.0770.78075%0.0110.0500.773
Table 4. Height differences between 75% defoliated and undefoliated plants (Δ 75-0) prior to the start of the growing season in 2009 after a one-time, two-time, or three-time defoliation treatment (* statistically significant difference according to t or Welch test).
Study Site (Number of Defoliation Treatments)
Großthiemig
(1 Defoliation
Treatment)
Großthiemig
(2 Defoliation
Treatments)
Großthiemig
(3 Defoliation
Treatments)
Obercarsdorf
(3 Defoliation
Treatments)
Schönheide
(3/2 Defoliation
Treatments)
Total
Genus/VarietyΔ 75-0
[cm]
Δ 75-0
[%]
Δ 75-0
[cm]
Δ 75-0
[%]
Δ 75-0
[cm]
Δ 75-0
[%]
Δ 75-0
[cm]
Δ 75-0
[%]
Δ 75-0
[cm]
Δ 75-0
[%]
Δ 75-0
[cm]
Δ 75-0
[%]
Poplars−11.4−6.3−26.9 *−14.2−30.1 *−16.6−21.5 *−24.0−37.3 *−28.3−26.7 *−18.3
Androscoggin−7.3−3.7−21.8−10.3−36.1−19.0−38.3 *−42.0−46.0 *−34.2−33.3 *−20.9
Max 1−2.2−1.3−3.3−2.0−13.2−8.4−28.6−31.0−30.0 *−22.6−15.2−11.2
Max 3−9.9−5.5−38.3−20.4−31.0−16.7−3.0−3.3−41.1 *−28.7−29.5 *−19.4
Max 4−9.4−5.3−22.8−13.0−15.0−9.0−20.1−23.1−35.2 *−25.2−24.1 *−16.7
Muhle Larsen−33.8−18.3−56.5 *−26.4−54.7 *−26.5−26.3−31.2−34.5 *−32.1−34.9 *−24.9
Willows−13.1−4.9−24.2−8.6−29.6−11.5−15.3−10.2−7.2−6.7−16.6−8.9
Sven−20.2−7.5−44.3−16.3−15.6−6.35.24.1−4.4−4.2−10.2−5.6
Tora12.05.2−58.3 *−19.5−62.0 *−21.9−39.5−25.7−18.5−16.4−33.0 *−17.6
Tordis−28.8−9.739.014.4−13.6−5.6−10.4−6.51.61.5−6.7−3.5
Table 5. Mean fresh weight [g] of aboveground biomass of plants on the study site in Großthiemig with regard to the number of defoliation treatments in February 2009 (DV = defoliation variant, different letters indicate statistically significant differences).
PoplarsWillows
Number of Defoliation TreatmentsNumber of Defoliation Treatments
DV123Total123Total
0%344.5438.7298.7360.6 (a)790.0516.7379.5562.1 (a)
25%323.0424.7328.1358.6 (ab)714.5520.3370.9535.3 (a)
50%319.1380.0283.0327.4 (ab)800.8414.0414.1543.0 (a)
75%265.3313.3235.5271.4 (b)805.3483.9312.8534.0 (a)
Total313.0 (a)389.2 (b)286.3 (a)329.5777.7 (a)483.7 (b)369.3 (c)543.6
Table 6. Mean number of resprouting shoots per stool on the study site in Großthiemig with regard to the number of defoliation treatments in June 2009 after the harvest in March 2009 with regard to the defoliation variant in 2007 and 2008.
Number of Defoliation Treatments
123Total
Defoliation Variant [%]
Genus/Variety0255075025507502550750255075
Poplars88871176776558776
Androscoggin78771677677649766
Max 18687976556458666
Max 3111010713979986711987
Max 46878665776657767
Muhle Larsen6766874455556655
Willows19161516171717181616171517171617
Sven22181617181820181718201919181918
Tora16151219151614191715151216151417
Tordis18161613161815181616151417161615
Table 7. p values of pairwise comparisons of plant heights among former defoliation variants (DVs) for both tree genera (green) as well as for all varieties with at least one significant value (orange) on the study site in Großthiemig in June and in September 2009 after a harvest in March 2009 with regard to the number of defoliation treatments in 2007 and 2008 via Tukey HSD test (bold values indicate statistically significant differences).
June 2009September 2009
Großthiemig (1 defoliation treatment)
Willows Willows
DV0%25%50%75% DV0%25%50%75%
Poplars0%0.9310.9920.991Poplars0%0.9881.0000.996
25%1.0000.9890.81025%0.6700.9720.945
50%0.7870.7940.94050%0.9830.4590.999
75%1.0001.0000.78475%0.9480.9370.808
Großthiemig (2 defoliation treatments)
Willows Willows
DV0%25%50%75% DV0%25%50%75%
Poplars0%0.9790.9730.960Poplars0%0.8540.9950.960
25%0.9921.0001.00025%0.9530.9420.990
50%0.8900.9721.00050%0.9980.9850.994
75%0.8650.9601.00075%0.9590.7170.894
DV0%25%50%75%
Max 10% no case of pairwise comparisons among defoliation variants with at least one significant value
25%0.100
50%0.9040.030
75%0.8430.3380.457
Großthiemig (3 defoliation treatments)
Willows Willows
DV0%25%50%75% DV0%25%50%75%
Poplars0%0.5180.9560.147Poplars0%0.7460.7940.014
25%0.9980.8320.87825%0.9461.0000.179
50%0.0920.1490.38550%0.0400.1560.156
75%0.0180.0340.93075%0.0130.0640.983
Tora Tora
DV0%25%50%75% DV0%25%50%75%
Max 30%0.0230.7980.179Andros-coggin in0%0.0570.3150.083
25%0.5070.1940.77725%0.3510.8310.997
50%0.2230.0140.68350%0.0990.9550.913
75%0.0770.0030.98475%0.0190.6420.882
Table 8. Height differences of 75% defoliated and undefoliated plants (Δ 75-0) on the study site in Großthiemig in June 2009 after a harvest in March 2009 with regard to the number of defoliation treatments in 2007 and 2008 (* statistically significant difference according to the t test).
Number of Defoliation Treatments
123Total
Genus/VarietyΔ 75-0
[cm]
Δ 75-0
[%]
Δ 75-0
[cm]
Δ 75-0
[%]
Δ 75-0
[cm]
Δ 75-0
[%]
Δ 75-0
[cm]
Δ 75-0
[%]
Poplars−0.1−0.1−4.2−3.6−12.5*−10.8−4.9*−4.3
Androscoggin−10.5−8.8−8.9−7.5−13.5−11.9−11.4*−9.7
Max 1−2.5−2.26.75.8−20.1*−17.9−6.3−5.6
Max 35.64.8−3.8−3.2−17.7*−14.4−4.5−3.8
Max 43.32.94.13.3−1.1−1.01.91.6
Muhle Larsen6.06.1−16.2−14.1−8.3−7.4−3.4−3.1
Willows2.71.53.31.7−16.9−8.5−5.4−2.8
Sven−2.2−1.3−8.6−4.6−23.8−12.7−13.0−7.2
Tora33.118.56.33.1−23.5*−10.42.11.0
Tordis−14.4−7.110.85.6−3.5−1.9−3.7−1.9
Table 9. Height differences of 75% defoliated and undefoliated plants (Δ 75-0) on the study site in Großthiemig in September 2009 after a harvest in March 2009 with regard to the number of defoliation treatments (* statistically significant difference according to the t test).
Number of Defoliation Treatments
123Total
Genus/VarietyΔ 75-0 [cm]Δ 75-0 [%]Δ 75-0 [cm]Δ 75-0 [%]Δ 75-0 [cm]Δ 75-0 [%]Δ 75-0 [cm]Δ 75-0 [%]
Poplars−5.3−1.8−6.9−2.4−33.6*−11.9−15.3 *−5.3
Androscoggin−7.1−2.6−37.8−13.2−45.6*−16.8−26.1 *−9.4
Max 1−24.1−7.628.89.8−57.0*−19.0−25.8−8.4
Max 3−24.5−7.627.911.3−28.7−9.5−21.1−6.9
Max 415.65.2−7.5−2.35.11.88.42.8
Muhle Larsen34.617.0−16.2−6.2−35.6−13.9−2.8−1.2
Willows3.21.25.01.8−28.9*−10.2−9.8−3.5
Sven14.66.20.00.0−26.5−10.5−6.4−2.6
Tora34.113.414.45.2−30.0*−9.62.10.7
Tordis−30.0−9.80.00.0−30.2−10.7−23.0*−7.8
Table 10. p values of pairwise comparisons of plant heights among former defoliation variants (DVs) for both tree genera (green) as well as for all varieties with at least one significant value (orange) on the study sites in Obercarsdorf and Schönheide prior to the start of the growing season in April 2010 via Tukey HSD test (bold values indicate statistically significant differences).
Genus LevelVariety Level
Obercarsdorf
Willows
DV0%25%50%75%
Poplars0%0.1240.0320.165 no case of pairwise comparisons among defoliation variants with at least one significant value
25%1.0000.9700.997
50%0.3350.2820.909
75%0.1550.1230.978
Schönheide
Willows Max 3
DV0%25%50%75% DV0%25%50%75%
Poplars0%0.9880.9990.088Max 10%0.7250.1140.006
25%0.6320.9670.04125%0.4960.6140.097
50%0.0000.0260.11650%0.1530.9000.683
75%0.0000.0000.37675%0.0280.5010.890
Table 11. Height differences between 75% defoliated and undefoliated plants (Δ 75-0) on the study sites in Obercarsdorf and Schönheide prior to the start of the growing season in April 2010 (* significant difference according to the t test or Welch test).
Study Site
ObercarsdorfSchönheideTotal
Genus/VarietyΔ 75-0
[cm]
Δ 75-0
[%]
Δ 75-0
[cm]
Δ 75-0
[%]
Δ 75-0
[cm]
Δ 75-0
[%]
Poplars−23.0 *−13.9−55.2 *−18.5−41.8 *−17.0
Androscoggin−33.8−21.1−42.9 *−13.4−43.3−16.5
Max 1−33.4−21.4−63.7 *−21.2−33.2−14.2
Max 3−17.4−9.9−71.6 *−23.0−56.7 *−21.9
Max 4−40.0−21.7−36.2−12.3−43.3 *−17.3
Muhle Larsen7.35.2−55.9 *−20.5−31.0−13.6
Willows−41.2 *−15.7−22.3 *−8.8−29.3 *−11.5
Sven−65.4 *−28.1−28.4−12.0−40.7 *−17.3
Tora−81.3 *−30.4−27.6−10.5−46.2 *−17.4
Tordis4.91.7−12.5−4.9−3.5−1.3
Publisher’s Note: MDPI stays neutral with regard to jurisdictional claims in published maps and institutional affiliations.

