Article

Predictive Models to Estimate Carbon Stocks in Agroforestry Systems

by
Maria Fernanda Magioni Marçal
1,†,
Zigomar Menezes de Souza
1,
Rose Luiza Moraes Tavares
2,*,
Camila Viana Vieira Farhate
1,3,
Stanley Robson Medeiros Oliveira
1,4 and
Fernando Shintate Galindo
1,5
1
School of Agricultural Engineering (Feagri), University of Campinas (Unicamp), Campinas 13083-970, Brazil
2
School of Agronomy, University of Rio Verde (UniRV), Rio Verde 75901-970, Brazil
3
School of Agricultural and Veterinarian Sciences, University State of São Paulo (Unesp), Jaboticabal 14884-900, Brazil
4
Brazilian Agricultural Research Corporation (Embrapa), Campinas 13083-970, Brazil
5
School of Agronomy, University State of São Paulo (Unesp), Ilha Solteira 15385-000, Brazil
*
Author to whom correspondence should be addressed.
This manuscript is part of the Master thesis of the first author, available online at http://repositorio.unicamp.br/jspui/handle/REPOSIP/344442 (accessed on 15 August 2021).
Forests 2021, 12(9), 1240; https://doi.org/10.3390/f12091240
Submission received: 3 August 2021 / Revised: 11 August 2021 / Accepted: 20 August 2021 / Published: 14 September 2021
(This article belongs to the Special Issue Spatial Decision Support for Forest Management)

Abstract

:
This study aims to assess the carbon stock in a pasture area and fragment of forest in natural regeneration, given the importance of agroforestry systems in mitigating gas emissions which contribute to the greenhouse effect, as well as promoting the maintenance of agricultural productivity. Our other goal was to predict the carbon stock, according to different land use systems, from physical and chemical soil variables using the Random Forest algorithm. We carried out our study at an Entisols Quartzipsamments area with a completely randomized experimental design: four treatments and six replites. The treatments consisted of the following: (i) an agroforestry system developed for livestock, (ii) an agroforestry system developed for fruit culture, (iii) a conventional pasture, and (iv) a forest fragment. Deformed and undeformed soil samples were collected in order to analyze their physical and chemical properties across two consecutive agricultural years. The response variable, carbon stock, was subjected to a boxplot analysis and all the databases were used for a predictive modeling which in turn used the Random Forest algorithm. Results led to the conclusion that the agroforestry systems developed both for fruit culture and livestock, are more efficient at stocking carbon in the soil than the pasture area and forest fragment undergoing natural regeneration. Nitrogen stock and land use systems are the most important variables to estimate carbon stock from the physical and chemical variables of soil using the Random Forest algorithm. The predictive models generated from the physical and chemical variables of soil, as well as the Random Forest algorithm, presented a high potential for predicting soil carbon stock and are sensitive to different land use systems.

1. Introduction

The use of agroforestry systems to achieve optimum agronomic benefits through the efficient use of resources (nutrients, light, water collection, and utilization) has received great attention for its contribution to mitigating climate change through organic carbon sequestration [1]. In this context, understanding the dynamics and storage of soil carbon, especially in agroforestry systems, is essential for informing public policies focused on disseminating these agricultural practices [2].
Soil can function both as a carbon source or a carbon sink in the atmosphere [3]. Overall, approximately 38.4 Gt (1 gigatons = 1 billion tons) of carbon are stored in the soil, making it the largest terrestrial carbon reservoir [4]. However, small changes in land management or edaphoclimatic conditions may lead to significant losses of carbon in the form of CO2, resulting in the spatial and temporal variability of soil carbon stocks.
In general, organic carbon in soil is extremely dynamic as an energy source to all microorganisms, as well as other organisms belonging to the soil biota. This type of carbon is highly susceptible to erosion since it is preferentially removed for having a low density and located near the soil surface [5]. Thus, the carbon stock of the soil is dynamically balanced with its environment. In addition, its magnitude and changing rate depend on the balance between carbon gains and losses [5,6]. If carbon inlets are higher than outlets (through mineralization or erosion) soil carbon stock increases [7].
In addition to the environmental issue, carbon sequestration contributes to an increase in organic matter in soil, which plays an important role in maintaining agricultural productivity. It promotes improvements in physical, chemical, and biological attributes allowing for the increased productivity and reduced costs of irrigation, fertilizers, soil conditioners, and other agricultural inputs [2]. Therefore, carbon sequestration can partially compensate for emissions caused by fossil fuels and other human activities, while improving soil quality and agronomic productivity [8].
According to [9], mathematical models are promising tools to assess carbon loss and gain processes; however, the high complexity of these systems, combined with a lack of information to parameterize and test these models, prevents the development of comprehensive and generic models for such a purpose. An alternative approach is the use of data-mining techniques to predict the soil carbon stock in agroforestry systems, whose objective is to extract predictive knowledge hidden in large databases [10]. The Random Forest algorithm is considered to be one of the most precise prediction methods for classification and regression, due to its capacity to model complex interactions between input variables and its robustness in the presence of outliers [11]. In addition, the advantages of this algorithm include an ability to investigate nonlinear and hierarchical relations between predictor variables and response variables (in this case, the soil carbon stock) by using a joint learning approach [12].
Given this context, despite the scientific advances in agroforestry systems in recent years, some key questions remain unanswered: What is the potential of agroforestry systems to increase soil carbon stocks? Are data mining techniques capable of predicting soil carbon stocks using only one subset of variables? Two hypotheses were raised: (i) agroforestry systems provide higher soil carbon accumulation than a pasture area, similar to a natural forest; and (ii) the physical and chemical variables of soil have a high capacity to predict carbon stocks and can be used to generate predictive models through the Random Forest algorithm for different land use systems.
Our objective was to assess the carbon stocks in agroforestry systems in a pasture area and a forest fragment undergoing natural regeneration (used as references) in addition to predicting the carbon stocks for different land use systems with the physical and chemical variables of soil using the Random Forest algorithm.

2. Materials and Methods

2.1. Description of the Study Area and History of the Areas

We conducted our study at an experimental area in the premises of the Fazenda da Toca, located in the municipality of Itirapina, São Paulo, Brazil, with geographical coordinates of 22°12′ south and 47°44′ west, at an altitude of approximately 800 m above sea level (Figure 1). The region climate was classified as a humid subtropical climate with rain in the summer and drought during the winter (Cwa), according to the Köeppen classification [13].
Four land use systems were assessed: (i) agroforestry system developed for livestock (AFS1), (ii) the agroforestry system developed for fruit culture (AFS2), (iii) area used as pasture (Pasture), and (iv) forest fragment undergoing natural regeneration process (Forest). All land use systems were comprised under the same type of soil—classified as Neossolo Quartzarênico according to the Brazilian Soil Classification System [14]—with a sandy texture corresponding to the Entisols Quartzipsamments according to the Soil Taxonomy [15]. Table 1 presents the granulometry performed in June 2016 to characterize the soil texture areas.
Land use systems were implanted in areas which were occupied by crops until 2011, except for the forest fragment (tree species), which had been undergoing a natural process of regeneration for more than 35 years. This area was used as a reference of the natural recovery strategy in this transitional region between the Atlantic and Cerrado forest biomes.
The management systems adopted to implement the AFS1 and AFS2 areas were similar to each other and effectively followed the subsequent order of events. (1st) Grasses (Brachiaria sp.) and pigeon pea (Cajanus cajan) were planted to decompress the soil and produce biomass. (2nd) After 2 years, the area was cleared, preserving the grass stems for regrowth, after which tracks for soil tillage were opened using a rotary hoe (machinery to remove biomass and allow soil tillage for planting in windrows). (3rd) Preparation of planting windrows was carried out (1.2 m wide tracks at a distance of 5 m from each other) with rotary tillers and fertilizing with rock dust (500 g linear meter−1). (4th) Hoed material was laid on the tracks prepared for planting using the same machinery (rotary hoe) to form a thick layer of mulch and to control the growth of grass in the windrows, nutrient cycling, and accumulation of organic matter to the soil of this region. (5th) Species of interest were introduced according to the productive focus of each system.
The implantation of AFS1 occurred in June 2015 in total area of 15 ha, focused on producing livestock and wood (Eucalyptus pellita) by preparing 1.2 m wide rows spaced 5 m from each other to plant eucalyptus. The inter-rows were occupied with Marandu grass (Urochloa brizantha cv. Marandu) to supply organic residue to cover the soil of the planting tracks. Considering the need for a greater spacing of the pasture, this model included 12 m-wide tracks of Marandu grass for every three rows of planted eucalyptus. In turn, AFS2 was planted in June 2014 in a total area of 5.2 ha, and focused on fruit production (bananas, citrus, and mango) and wood (Acacia mangium and Eucalyptus sp.) following the same pattern as the previous model (AFS1) where 1.2 wide windrows spaced 5 m from each other were used. The inter-rows were also occupied with Marandu grass.
In addition to the use of rock dust during the system’s implantation, biofertilizer (principal active compound of this material is fresh cattle manure), organic compound, or castor oil meal were applied sporadically in the planting windrows. After hoeing the inter-rows, Azospirillum was applied to the grass.
The pasture area was used in this study as a reference that demonstrated the common trend of agricultural occupation of the region. Planting was carried out in 2012, using grass (Urochloa brizantha cv. Marandu). The farm functioned until April 2016, when it ceased activities in the dairy and the area was abandoned. Therefore, the soil sampling was taken from the 4-year-old grasses.

2.2. Experimental Design, Soil Collection and Analyzed Physical and Chemical Properties

We used a completely randomized experimental design with six repetitions and four land use systems: AFS1, AFS2, pasture, and forest.
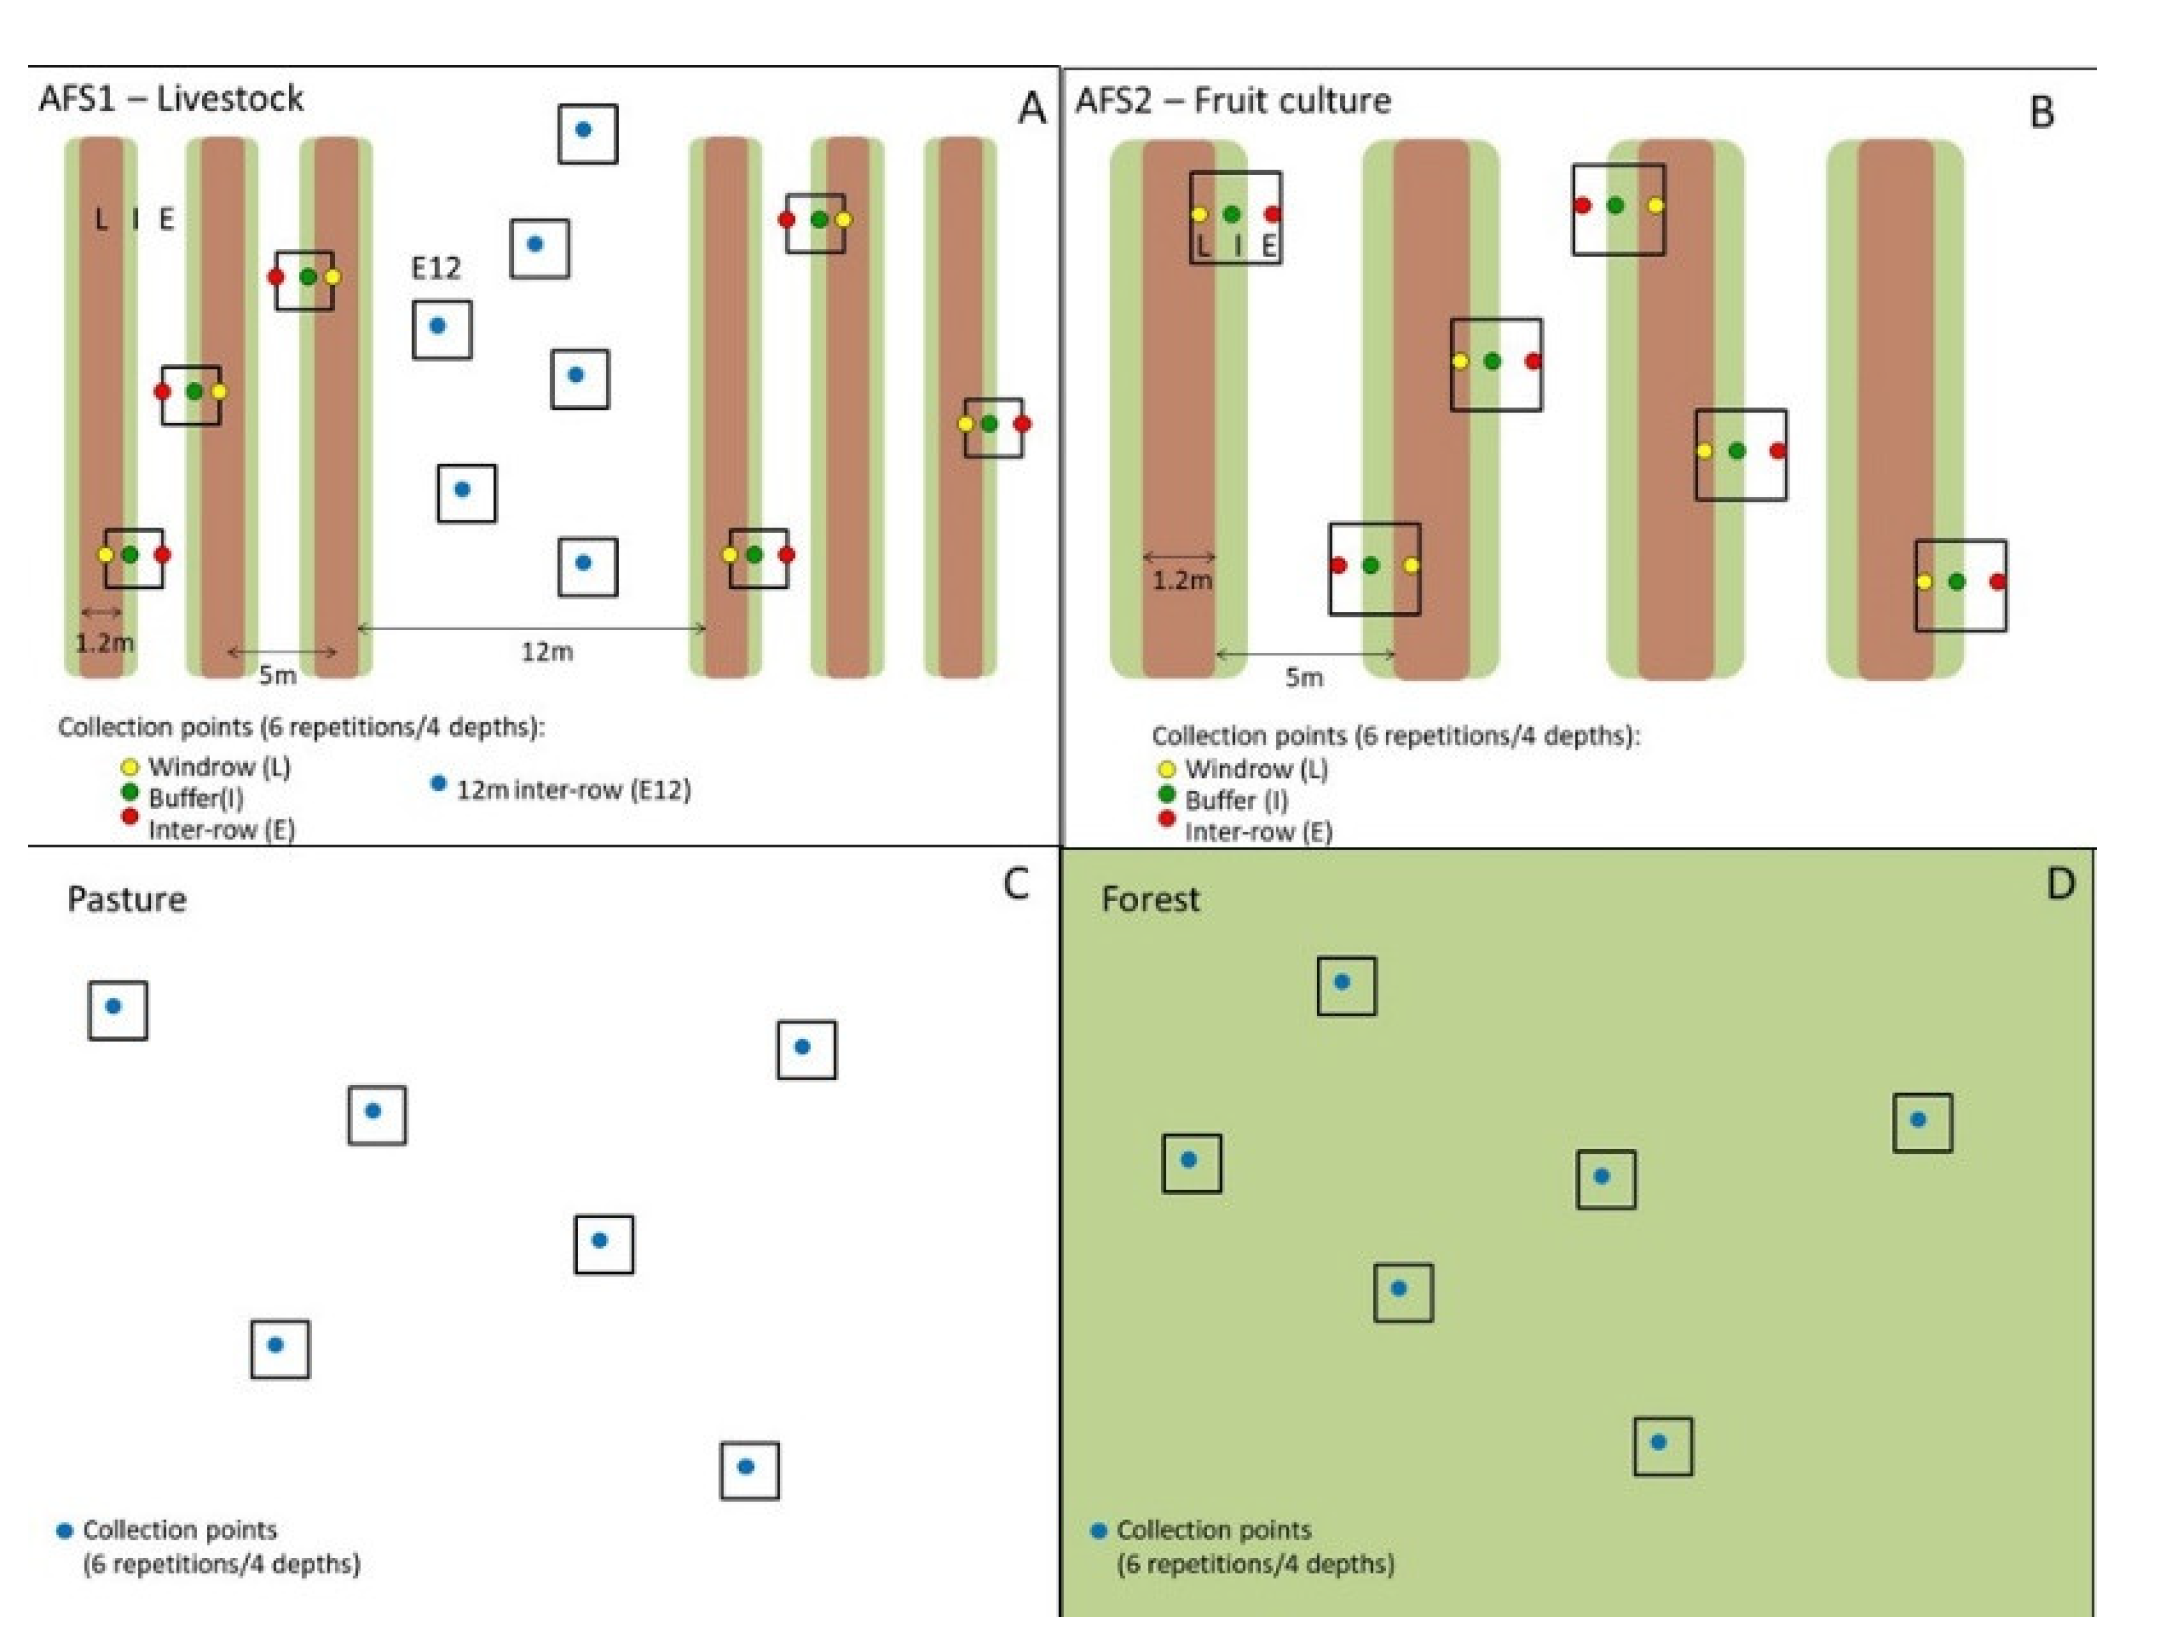
Soil samples were collected to analyze the physical and chemical variables during two agricultural years—the first collection in the second quarter of 2016 and the second collection in the second quarter of 2017. The soil collections were performed at the depths of 0.00–0.05, 0.05–0.10, 0.10–0.20, and 0.20–0.40 m. The sampling for AFS1 and AFS2 were performed at three sampling regions: (i) planting windrows (L), (ii) windrow buffers (I), and (iii) inter-rows (E). However, in AFS1, an additional collection was performed in the 12 m inter-rows designed for animal pasture (E12). Because of their homogeneity, both the pasture and forest areas were not subdivided in sampling regions, and the soil sampling was performed in six repetitions at each depth, randomly distributed throughout the areas (Figure 2).
Bulk density (Ds), macroporosity (Macro), and microporosity (Micro) were determined according to the methodologies of the Brazilian Agricultural Research Corporation [16]. Furthermore, we determined the soil pH (CaCl2 0.01 mol L−1), exchangeable cations (Ca2+, Mg2+ and K+), organic soil matter (carbon content obtained through wet oxidation), and acidity potential; and calculated the sum of bases, cation exchange capacity, and bases of saturation according to methodology proposed by [17]. Micronutrients copper (Cu), iron (Fe), manganese (Mn), and zinc (Zn) were extracted using diethylenetriaminepentaacetic acid solution (DTPA) at 7.3 pH, as described by [18].
Organic C and total N contents were determined from samples of air-dried fine earth (ADFE) crushed in mortar and filtered in a 100-mesh sieve (0.149 mm), before determining the total C and N content through dry combustion using an elemental analyzer (Leco CHN-600 instrument) [19].
C and N stocks were calculated (in Mg ha−1) according to each sampled soil layer by multiplying the concentration of each element (%) by Ds (g cm−3) and layer thickness (cm). As the samples were always collected in fixed layers, the values of carbon stock found were corrected based on their equivalent mass—a methodology proposed in [20]—by using the equivalent soil mass found in the forest area as reference.

2.3. Predictive Modeling

The complete database was composed of 21 variables, of which 20 were predictive variables and 1 was a goal-variable or response-variable, which referred to the carbon stock in the soil (Table 2). For the purpose of inducing the model, the complete database was subdivided in four data subsets, one for each sampling depth: 0.00–0.05, 0.05–0.10, 0.10–0.20, and 0.20–0.40 m.
The response variable (soil carbon stock) was initially submitted to descriptive analysis through boxplot graphs in which the following measures were identified: lower limit, first quartile, median, third quartile, and upper limit.
Afterwards, in order to select only the variables which contributed to the model, a correlation matrix was used to eliminate variables with null variance or variable which were highly correlated between each other. In the case of two highly correlated variables, one was randomly maintained and the other was eliminated for not adding any practical information to the model. In contrast, a procedure to eliminate null variables was performed to ensure that no variable had null variance.
Following this, we modeled the soil carbon stock through the Random Forest algorithm implemented on the R program [21]. Specifically for the Random Forest algorithm, at each division in each tree, an improvement in the divided criterium was an important measure attributed to the division variable and was accumulated over all trees in the forest for each variable. Thus, to access the importance of the selected variables, each tree was trained in a bootstrap sample, and the optimum variables in each division were identified from a random subset of all variables. Different selection criteria were applied for classification and regression problems: the former used the Gini coefficient and the latter employed variance reduction [22].
Model validation was performed using the hold-out method, in which 70% of the data were used for training and 30% for testing. Later, the results were graphically expressed through a regression in which the final result was the mean of all regression tree results forming the Random Forest algorithm [23]. The model performance was assessed through the coefficient of determination (R2), Pearson correlation coefficient (r), and root-mean-square error (RSME) obtained from the analysis between the values observed and predicted through the models generated.

3. Results

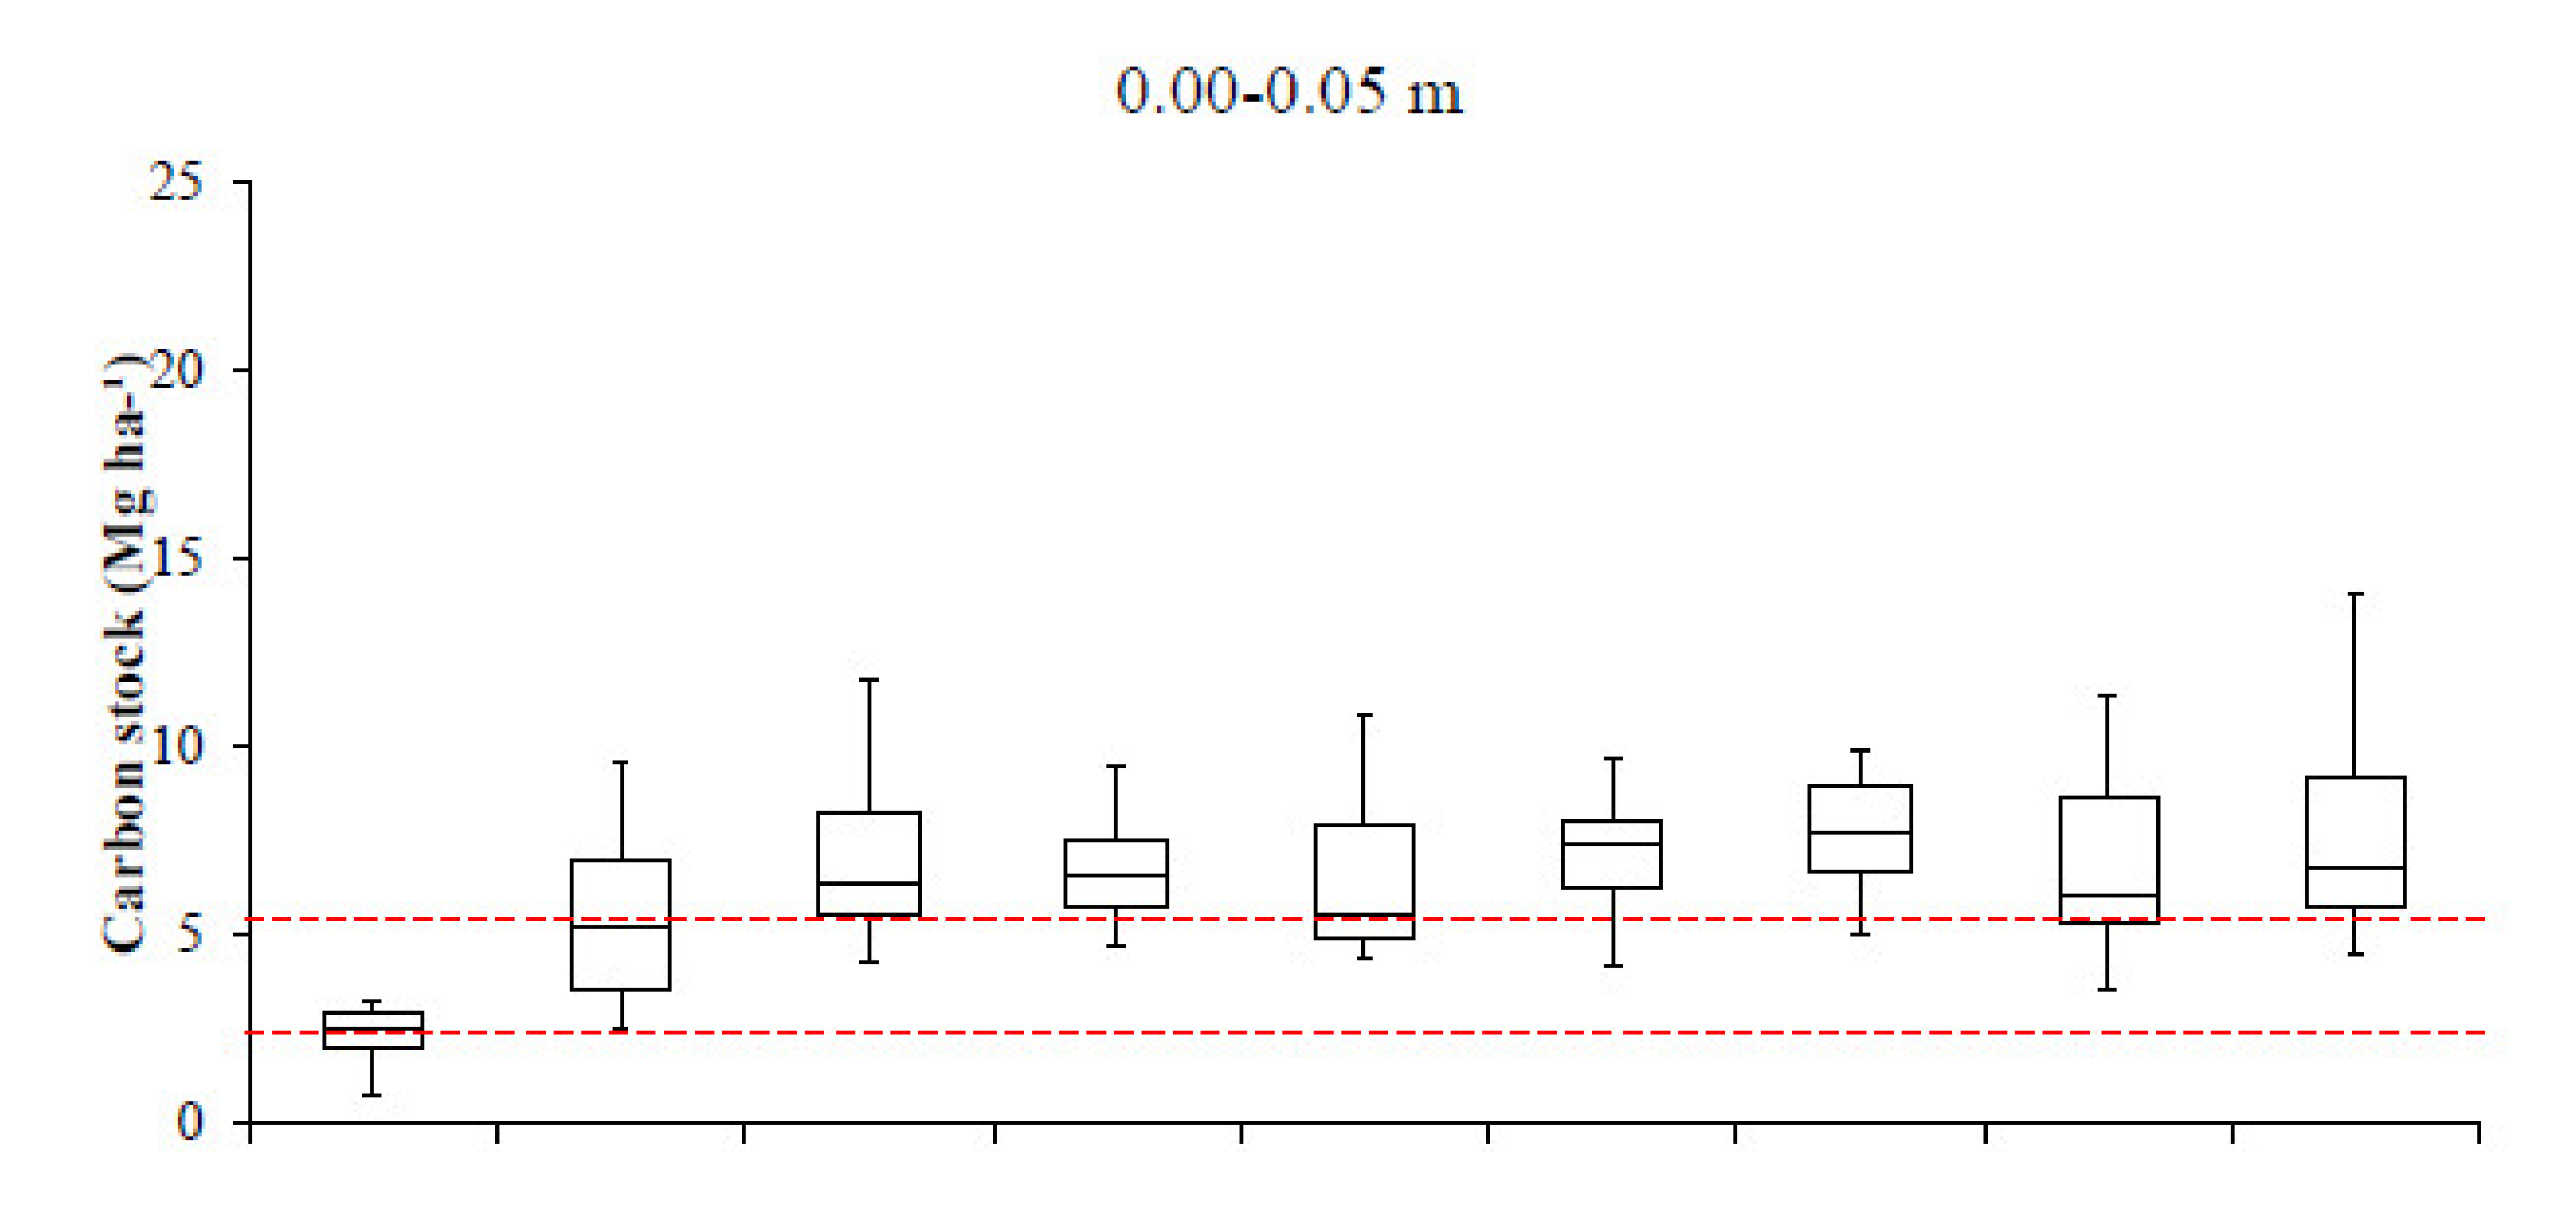
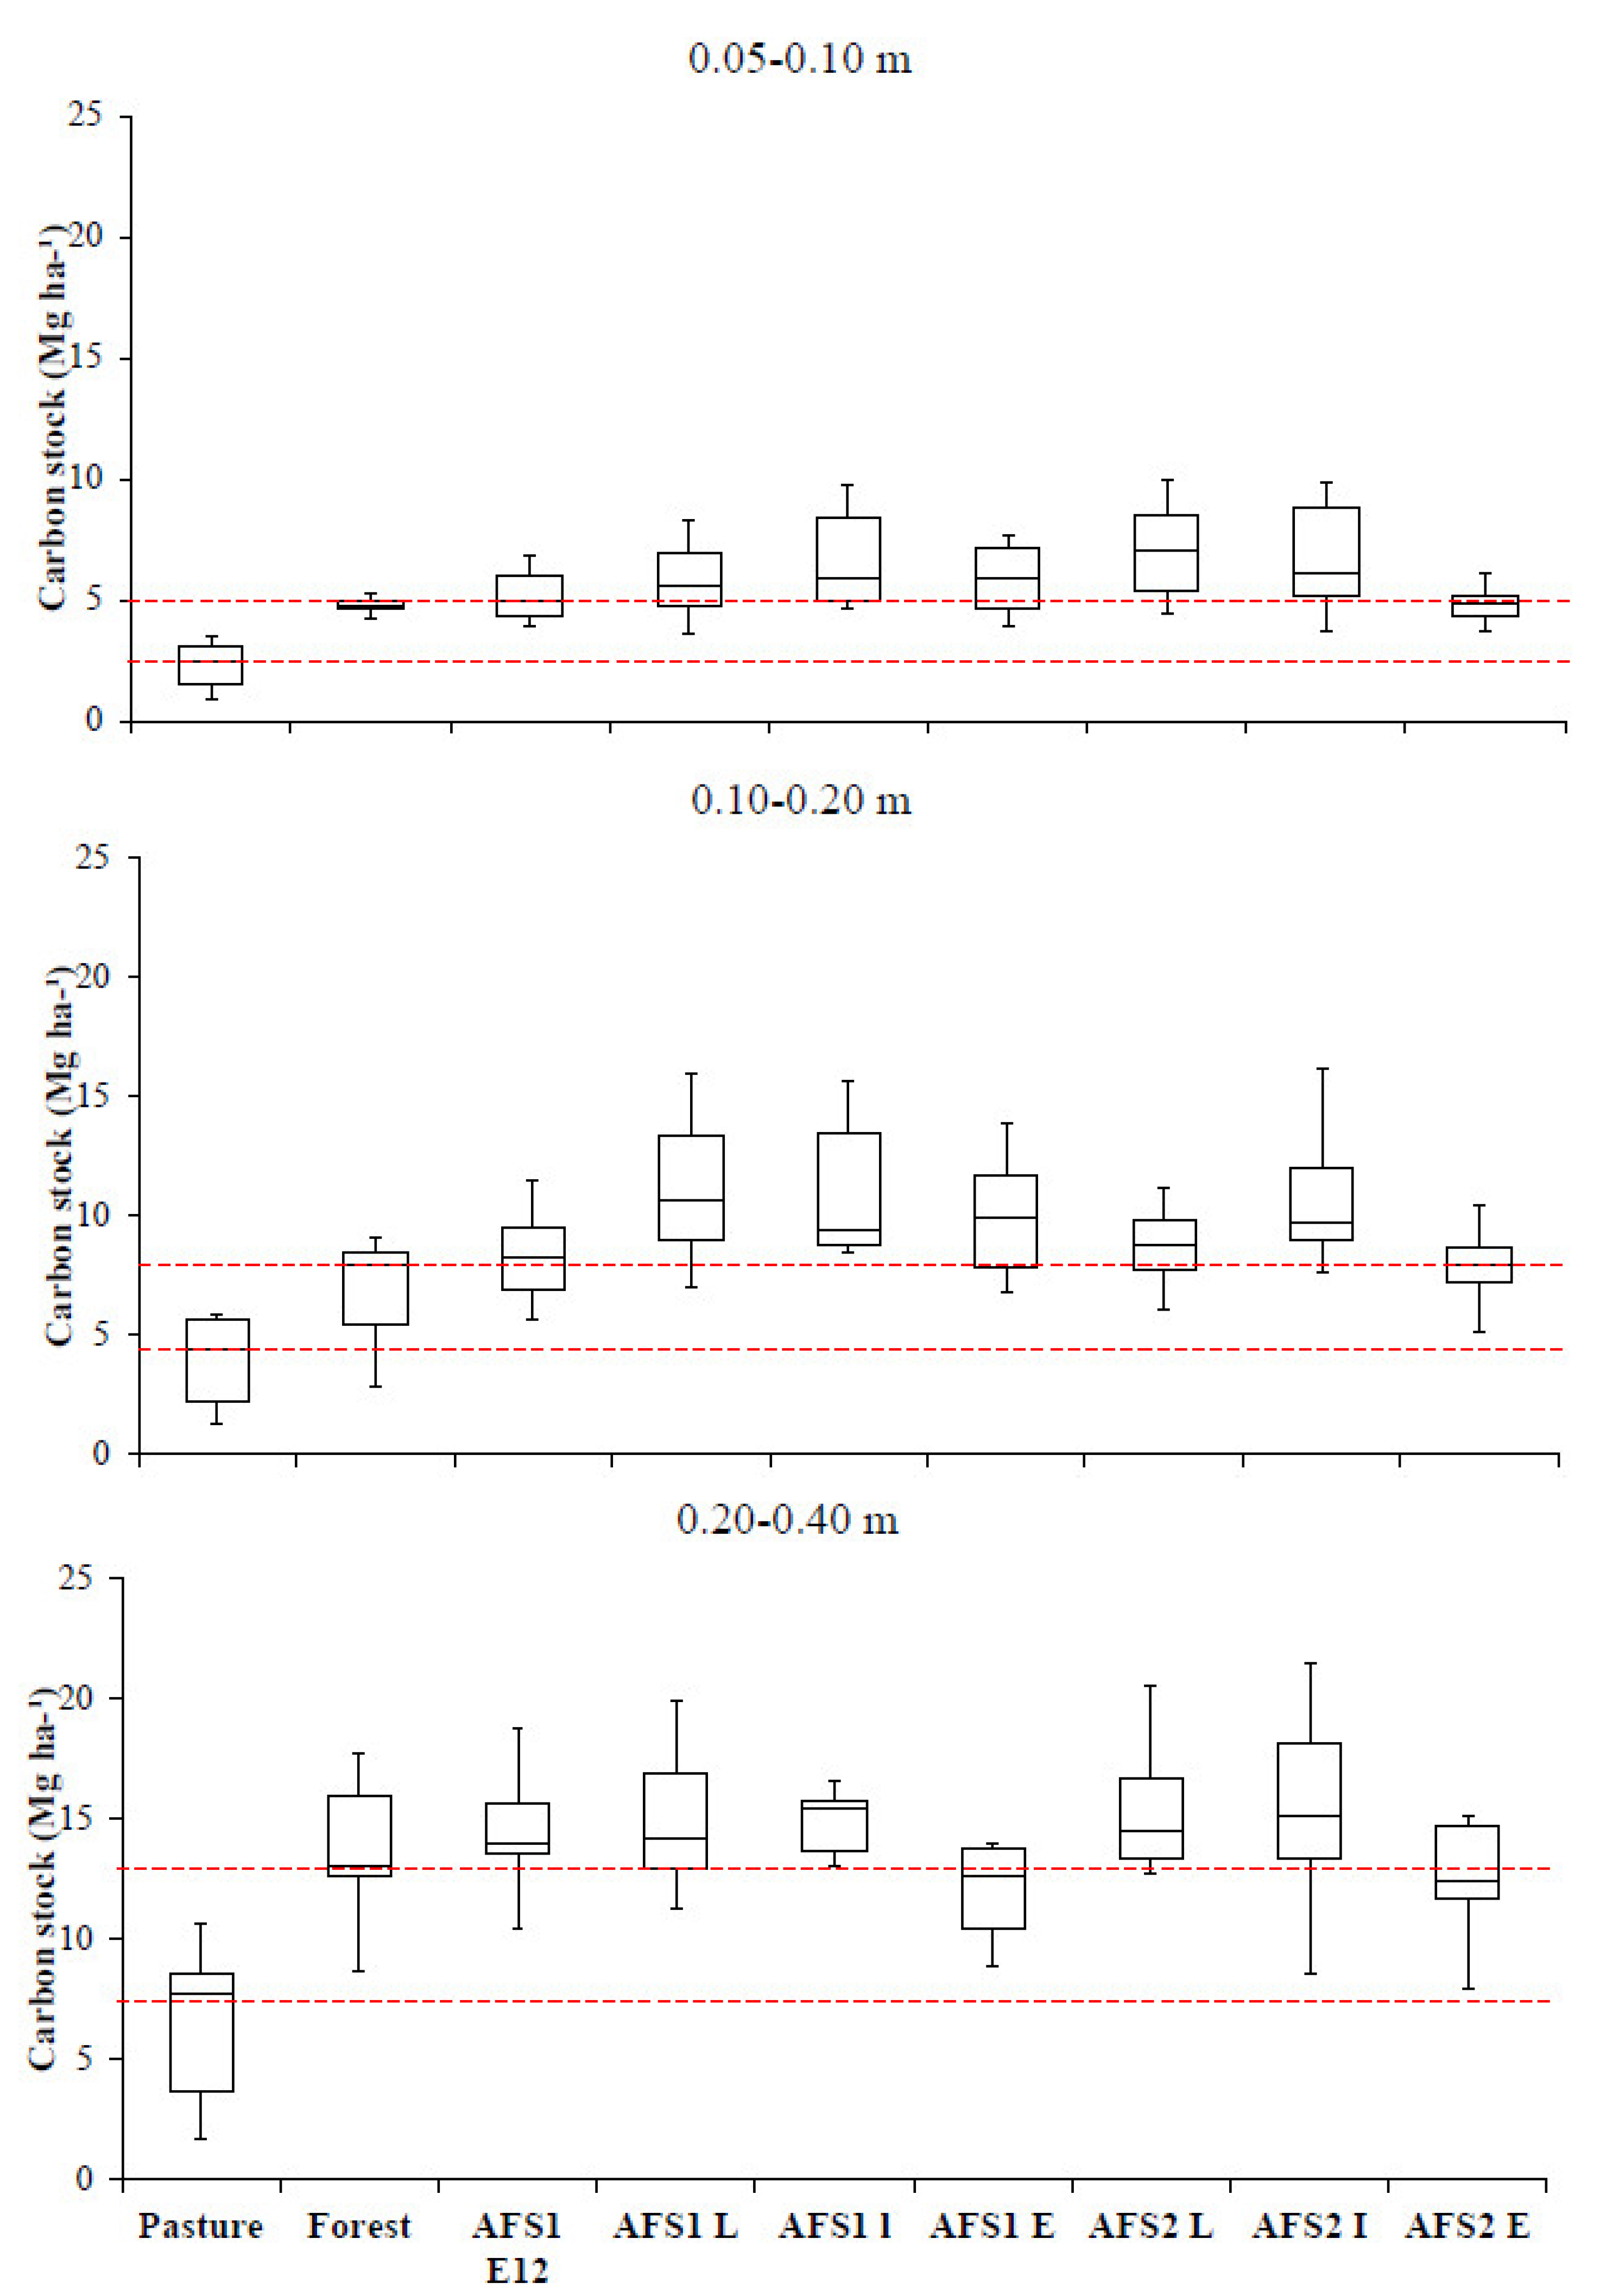
Firstly, a descriptive analysis was conducted using boxplot graphs to understand the soil carbon stock behavior (response variables) for each land use system assessed (Figure 3).
In general, the area cultivated in the pasture had the lowest carbon stock in relation to the remaining land use systems, followed by forest area (Figure 3). In addition, the AFS2 was significant in relation to other land use systems for showing higher mean values for soil carbon stock in the superficial layers; values of 7.73 and 7.09 Mg ha−1 were observed at the layers of 0.00–0.05 and 0.05–0.10 m, respectively. In contrast, for deeper layers, the AFS1 was significant with a carbon stock of 10.66 Mg ha−1 for the layer 0.10–0.20 in AFS1 L and 15.40 for layer 0.20–0.40 m in AFS1 l.
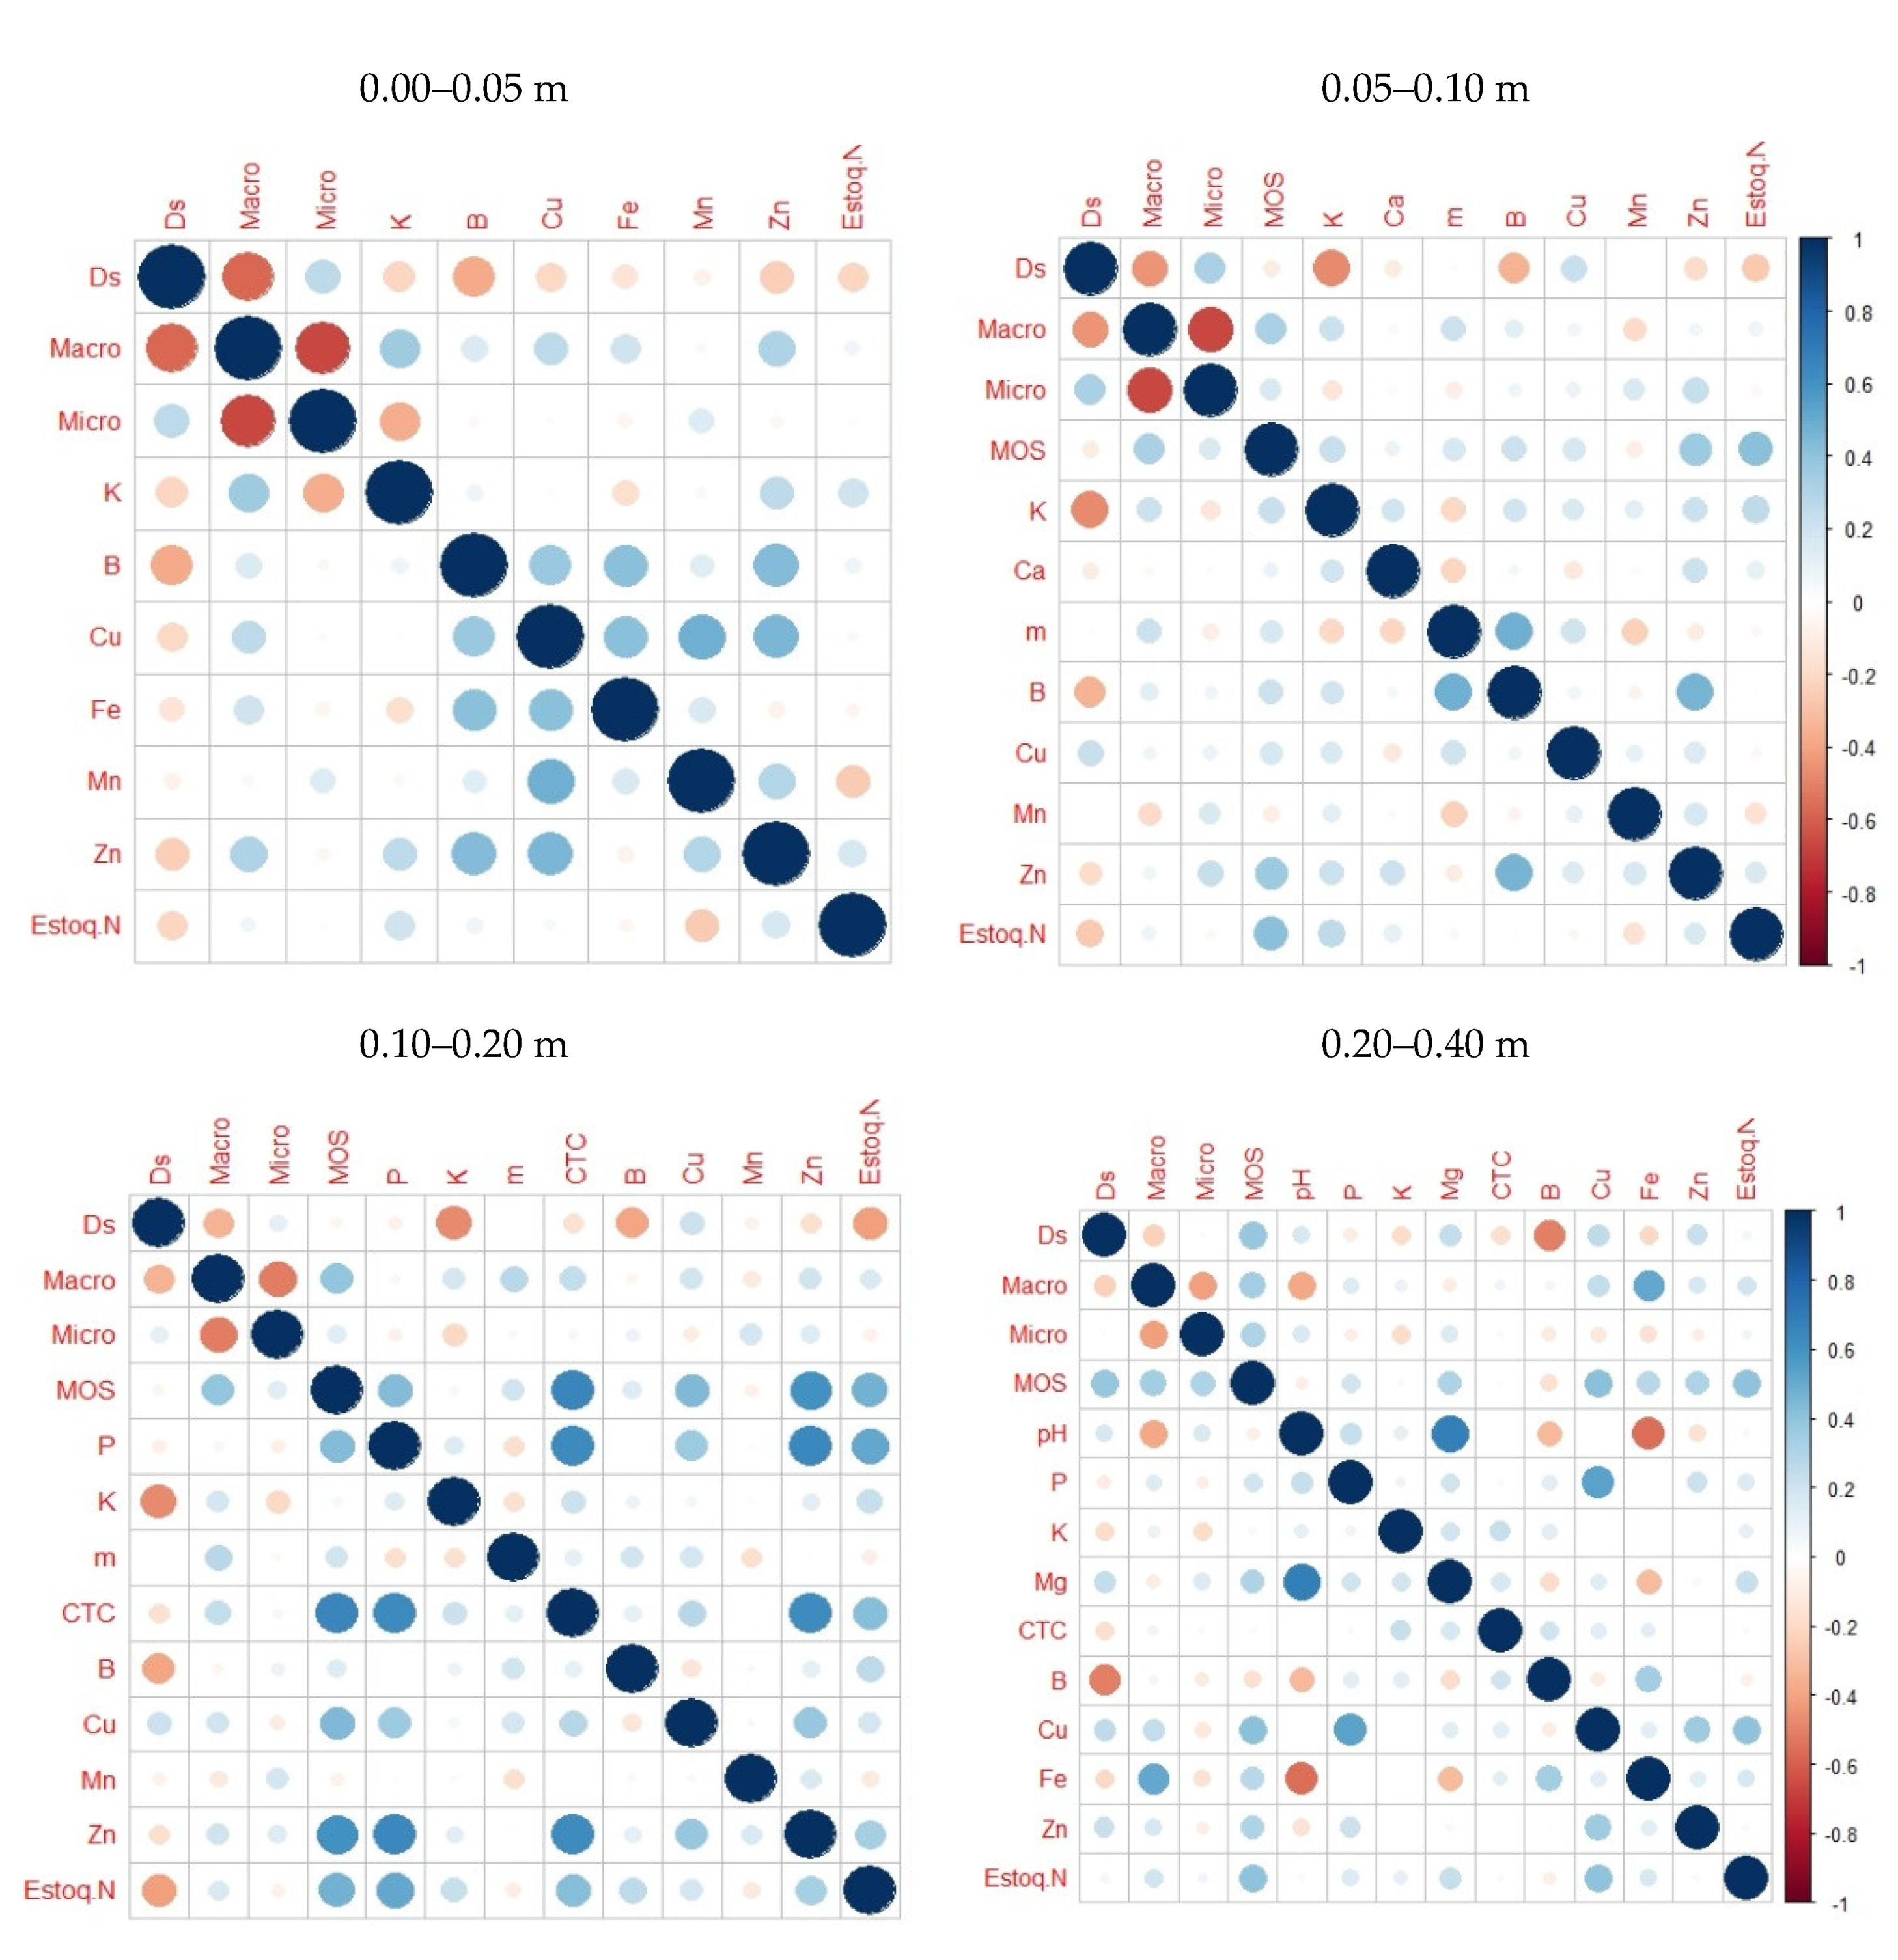
Subsequently, we generated a correlation matrix to select variables to identify null variance or high correlation (Figure 4). We found that variables such as SB, CEC and V were highly correlated among themselves and with the exchangeable bases Ca, Mg and K, as well as with pH and m.
These variables were eliminated because of their high correlation degree; Figure 5 illustrates the variables selected to build the model. Different amounts of variables were selected for each layer and 10 variables were maintained for layer 0.00–0.05 m, 12 for layer 0.05–0.10 m, 13 for 0.10–0.20 m, and 14 for layer 0.20–0.40 m. The layer 0.00–0.05 m presented the highest number of interactions between the variables analyzed, which makes it the only layer to have the lowest number of variables selected to build the model. Furthermore, with the increase in depth, the interactions between the variables became less intense and a larger number of variables was selected for model construction.
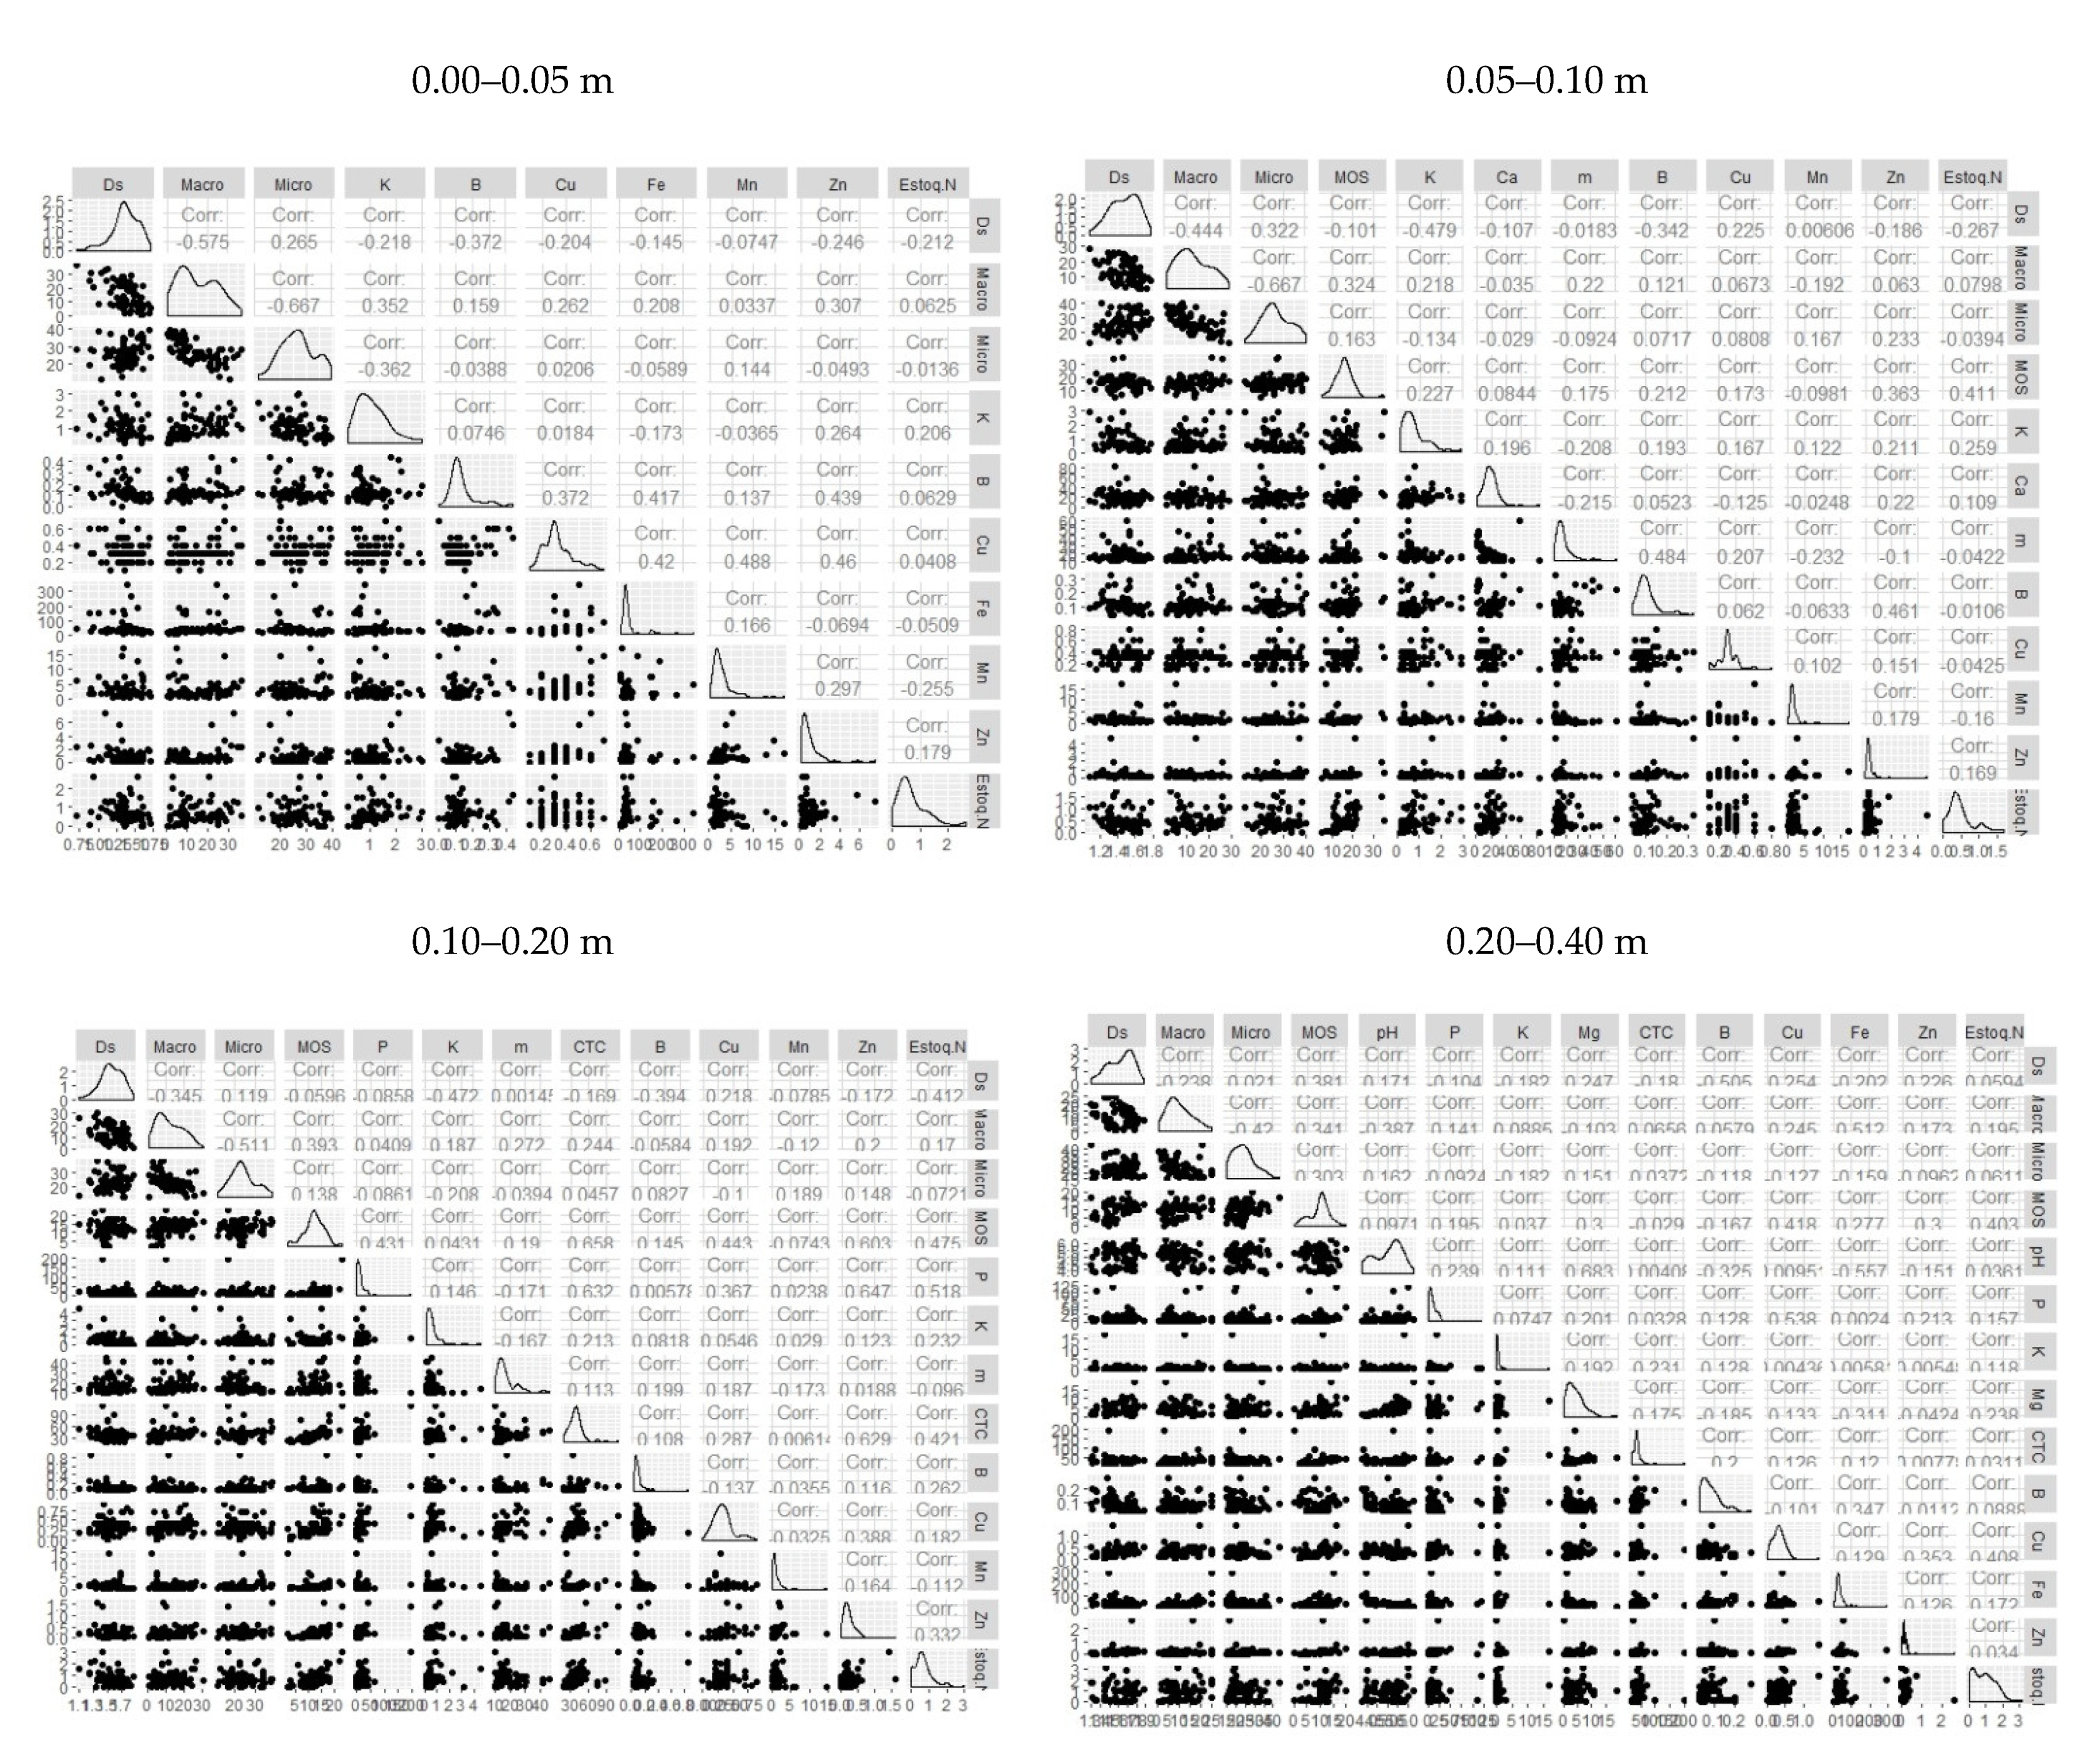
The database was tested for data dispersion, frequency distribution, and Pearson correlation coefficient (Figure 6) to prove the absence of correlations in the database after the variable selection process. The results confirmed that variables with null variance and a high correlation were completely eliminated from the database, and only those with a correlation coefficient below 70% were used.
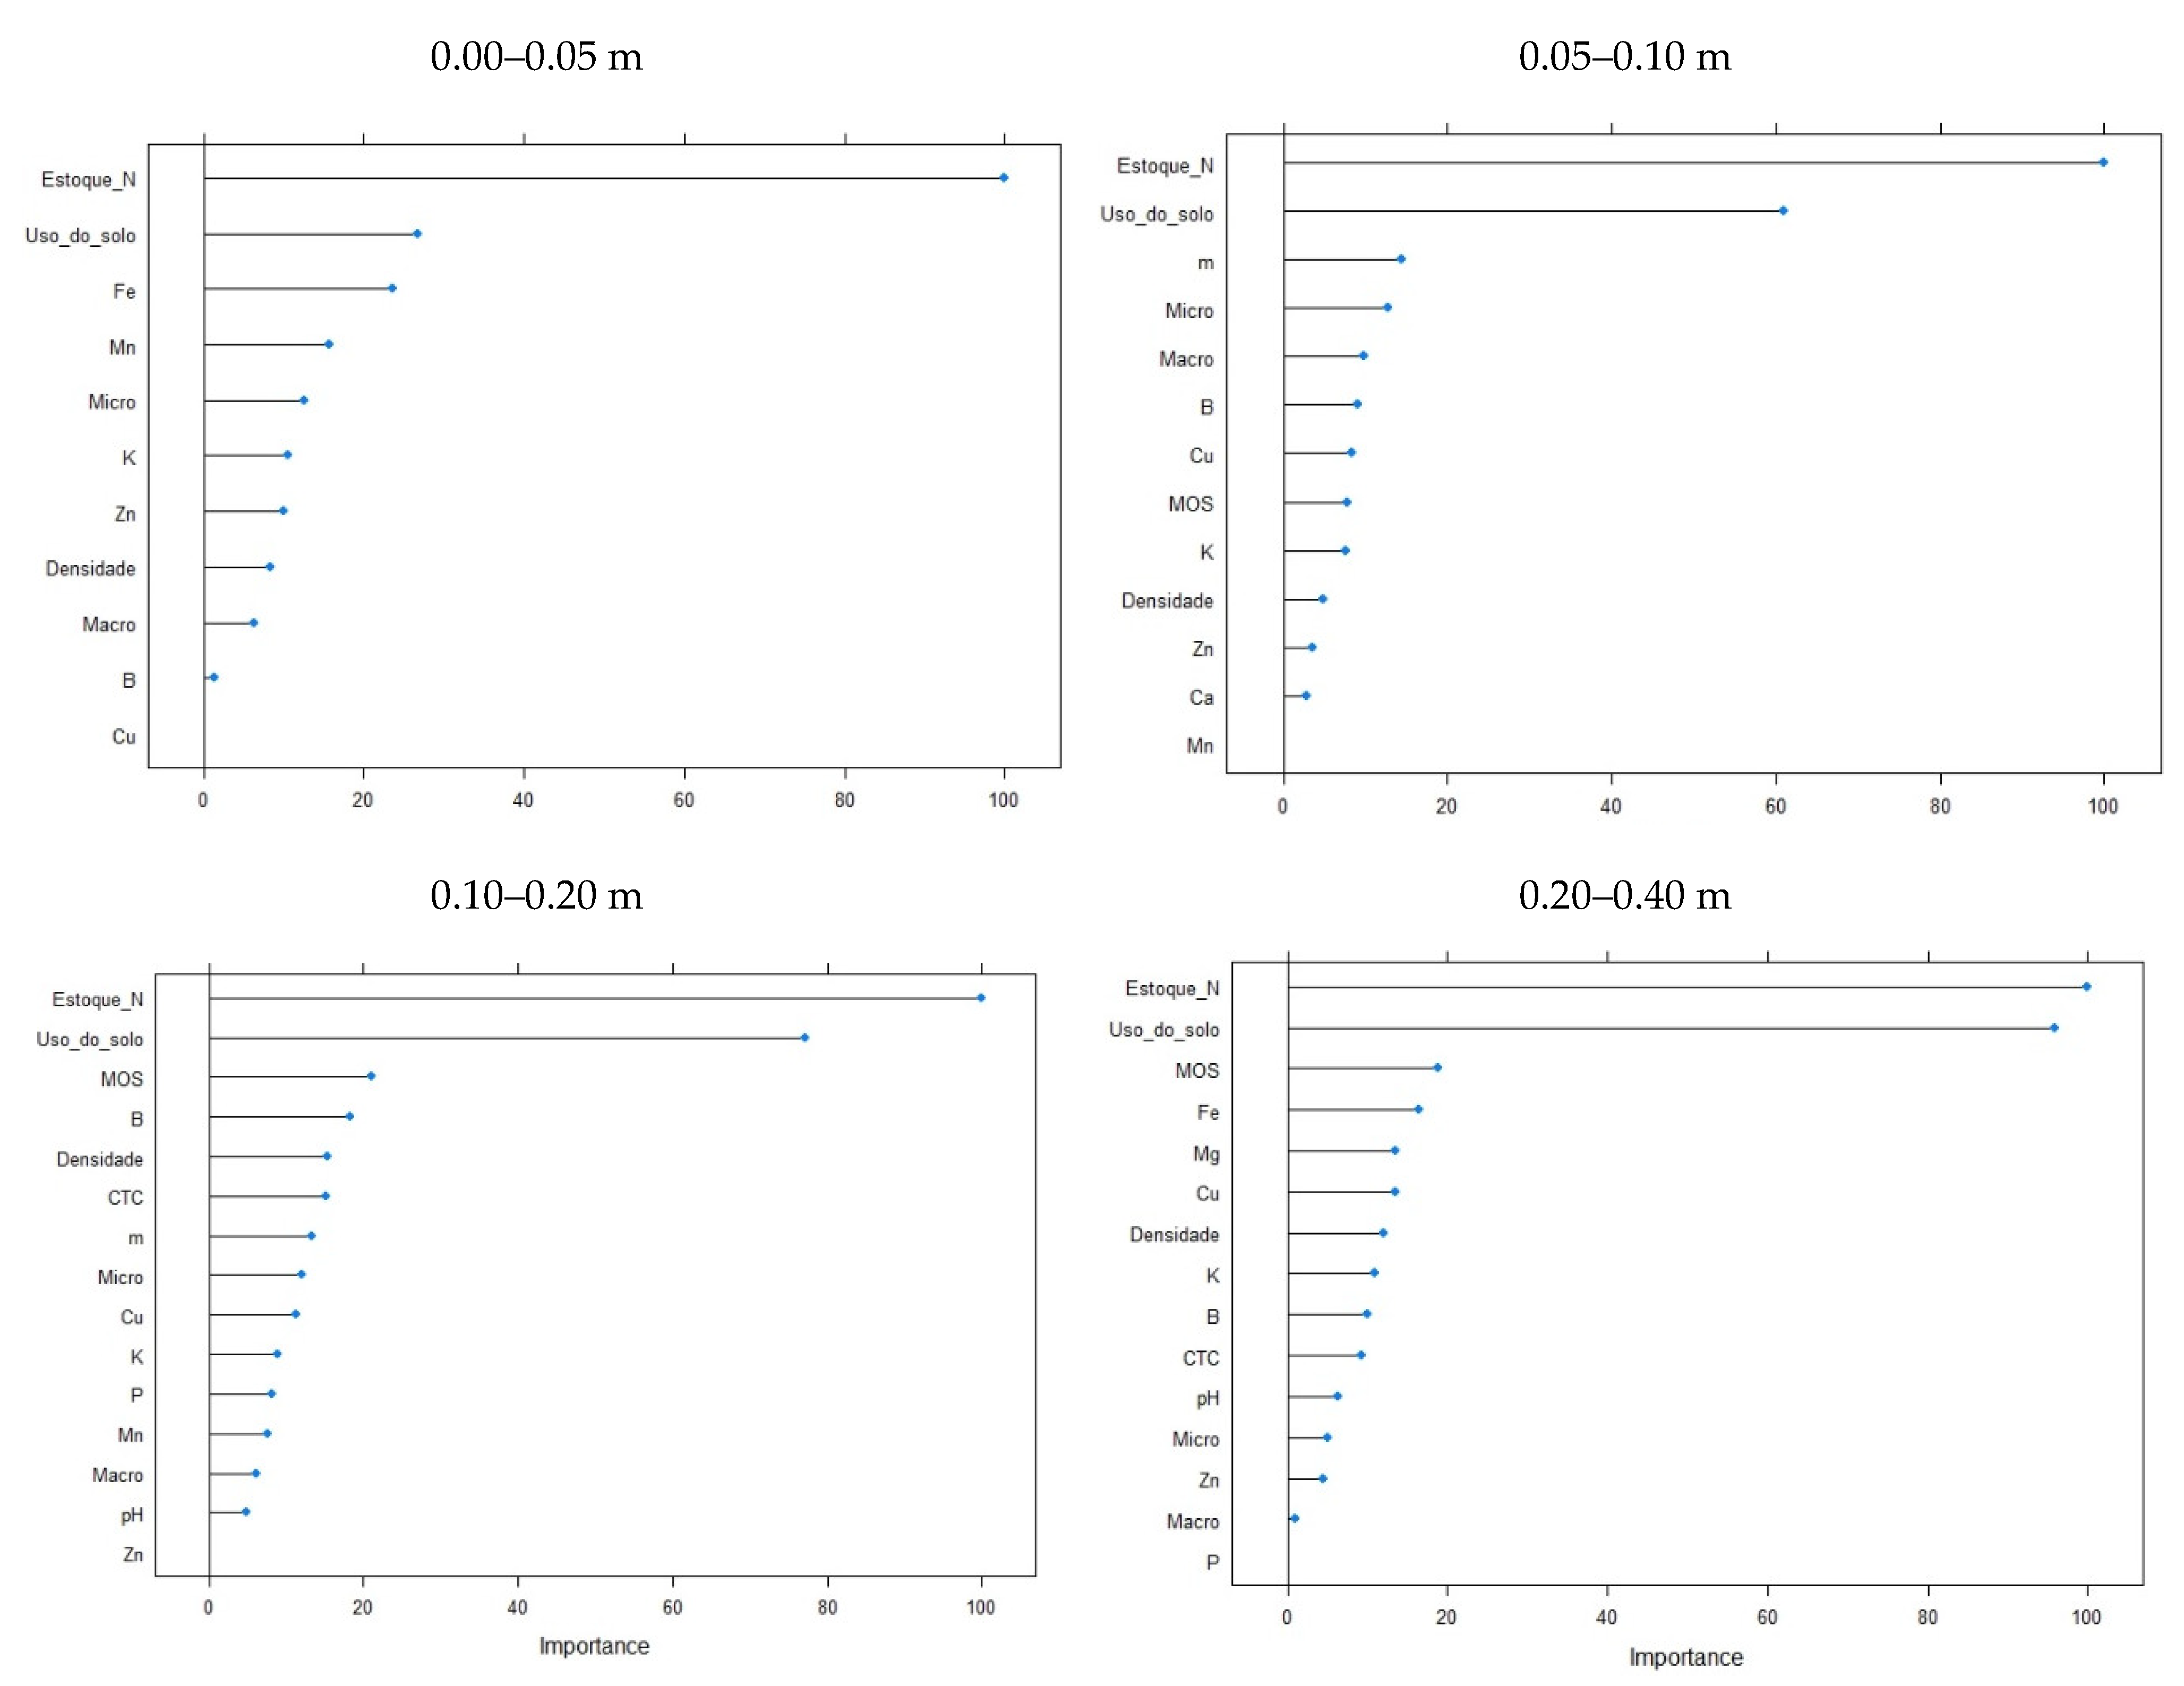
According to Figure 7, nitrogen stock was the most important variable in predicting soil carbon stock, followed by land use system, a behavior verified in all the soil layers available. However, from the third most important variable onward, the variable selected starts to show a differentiation according to the soil layer, revealing Fe and m as the most important variables for the layers 0.00–0.05 and 0.05–0.10 m, respectively, as well as the SOM for layers 0.10–0.20 and 0.20–0.40 m.
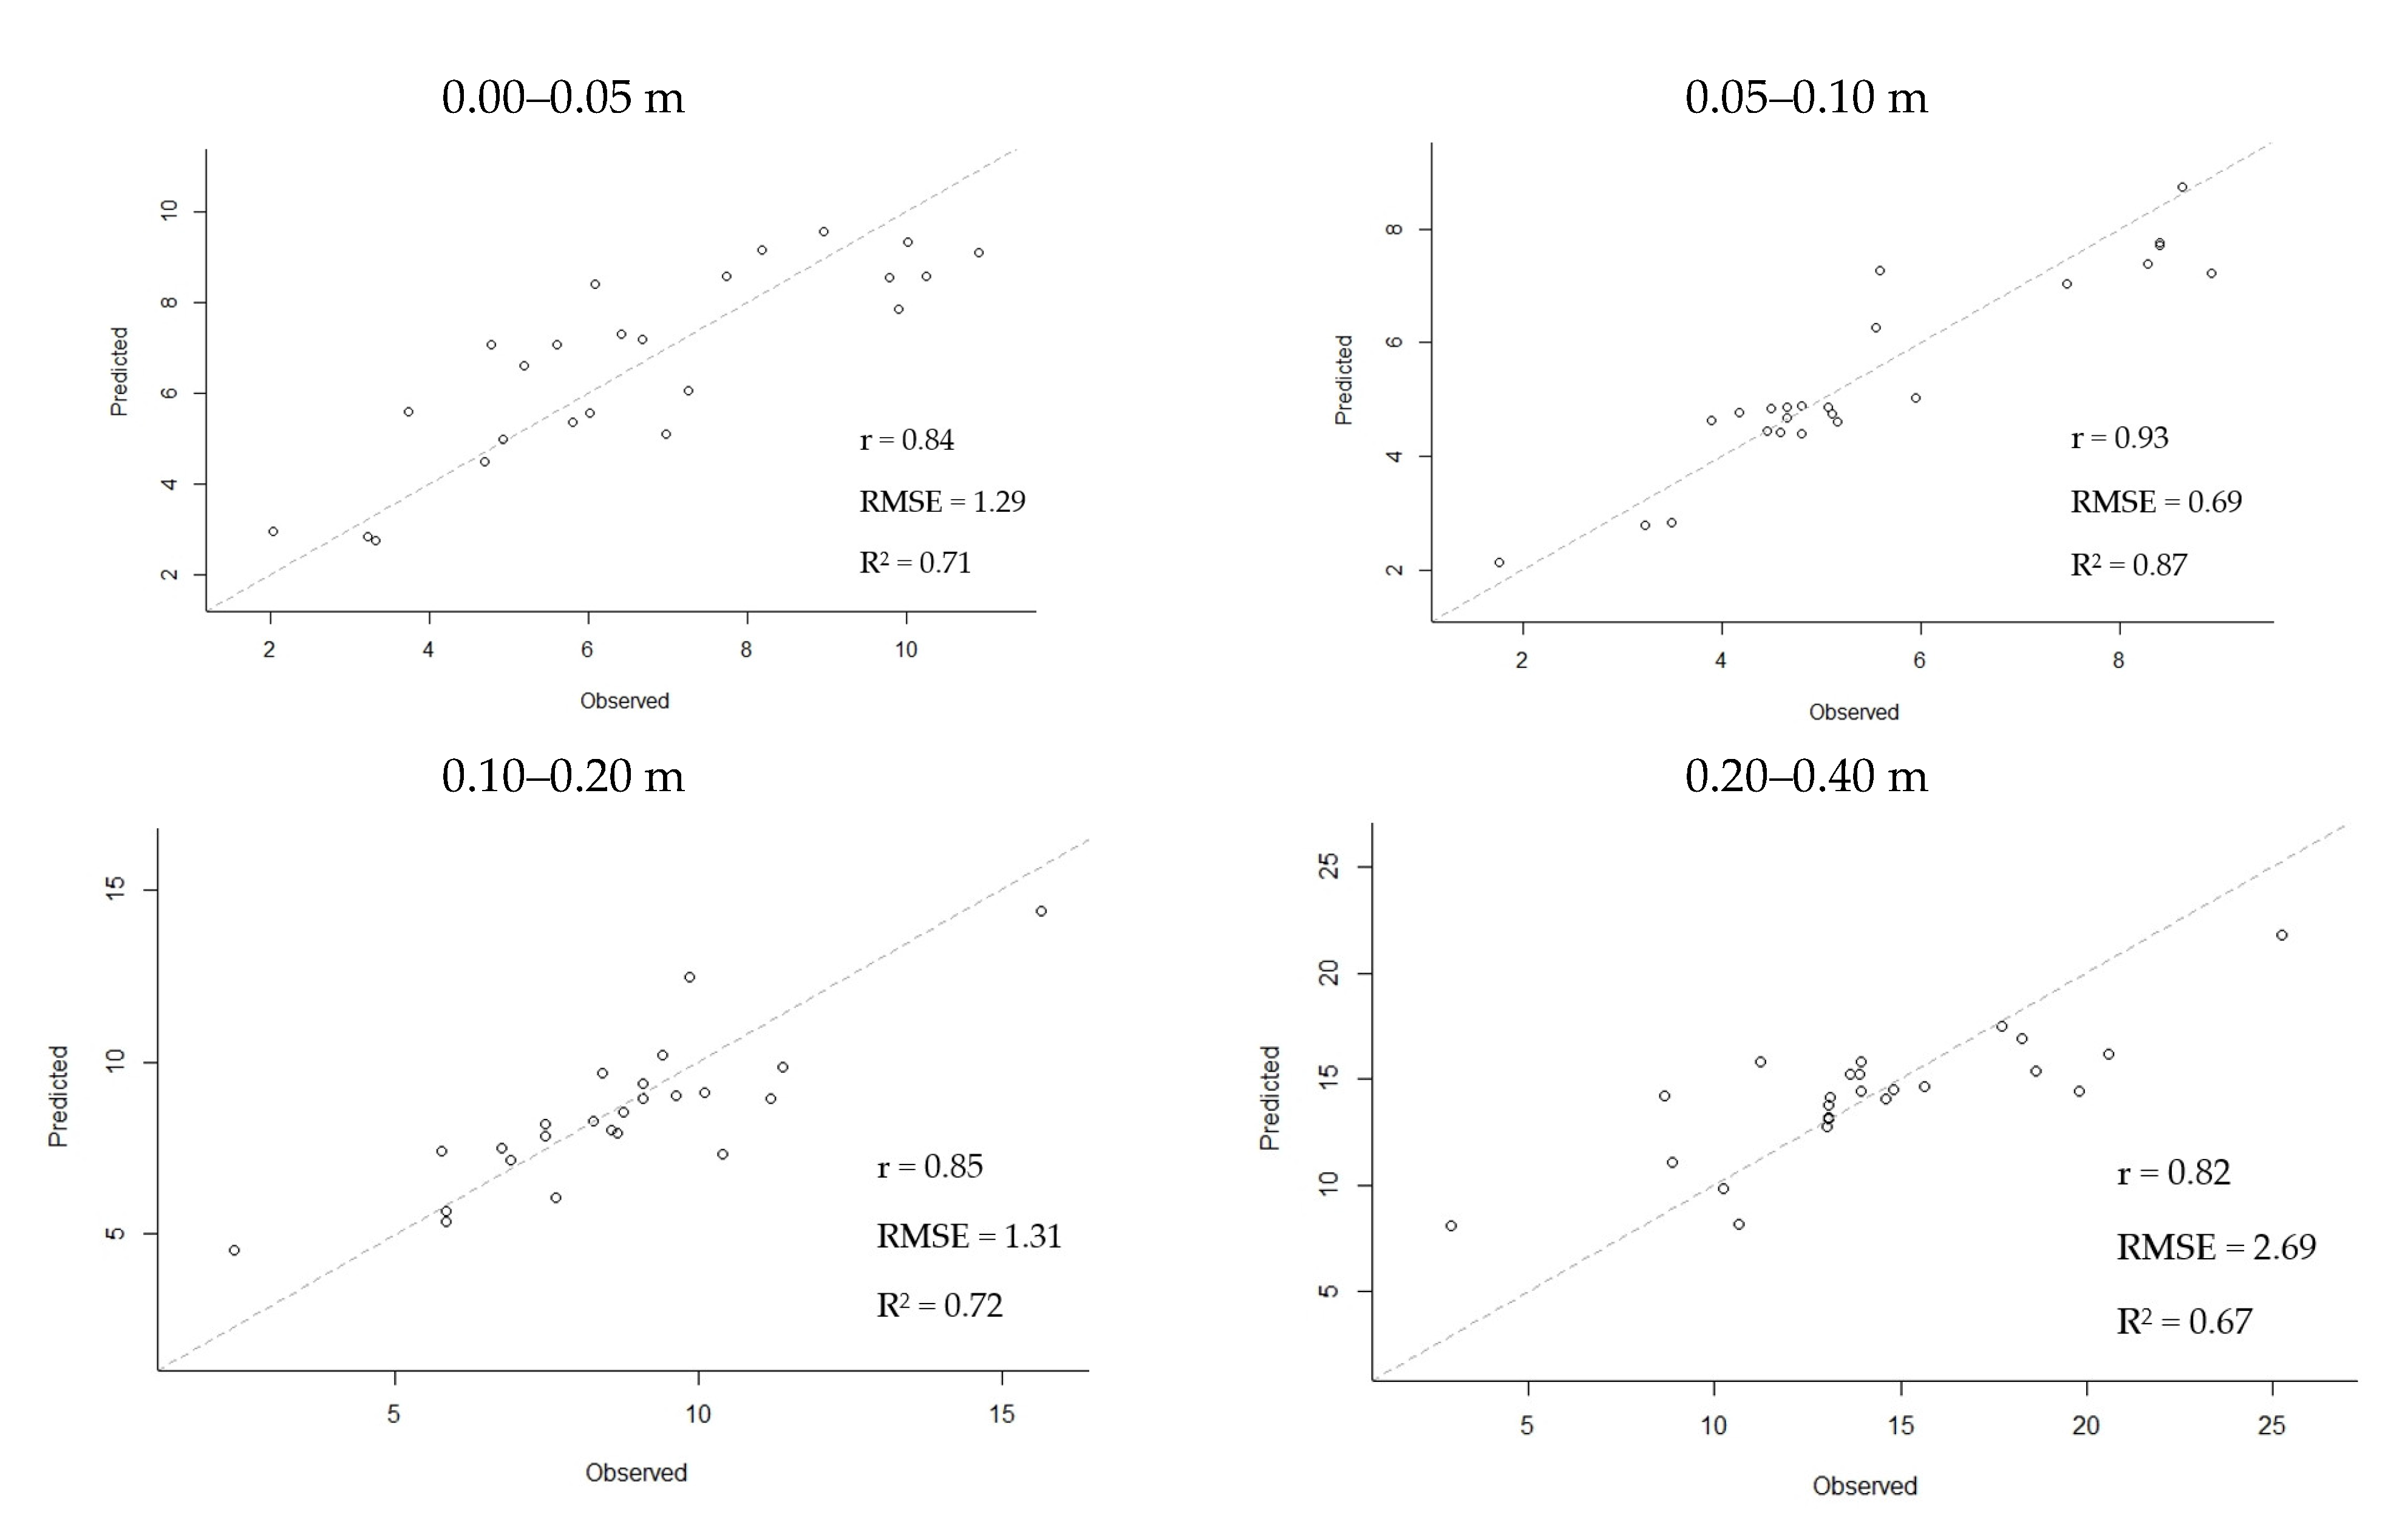
Figure 8 illustrates the predictive models of soil carbon stock for each layer assessed. A high correlation was found between the values predicted and verified in the models generated, in which the values obtained remained above 0.80 in all layers. In addition, the models generated for the layers 0.00–0.05 m, 0.05–0.10 m, and 0.10–0.20 m had determination coefficient values above 0.70, reaching values of 0.71, 0.87, and 0.72 for such soil layers, respectively. The layer 0.20–0.40 m used the largest number of variables and showed the smallest values of correlation coefficients (0.82), determination (0.67), and root—mean—square error (2.69).

4. Discussion

Nitrogen stock was the most important variable for predicting soil carbon stock in different land use systems, a result similar to the findings by [24] where several approaches involving predictive modeling were used; the variable of total nitrogen concentration contributed the most to explaining the spatial patterns of soil carbon stocks. Nitrogen availability could act in two opposite ways to maintain soil carbon stock: The first contributed to increased soil C stock by enhancing primary production and consequently raising the amount of biomass above the ground. The second contributed to decreased soil carbon stock since higher N availability could also accelerate the SOM mineralization rate [7].
Land use was the variable with the second strongest influence on predicting carbon stock. Science has indicated that land use and changing land use are the most important factors in determining carbon stocks and sequestration in the short term, since soil carbon stocks could take anywhere from decades to centuries to accumulate, but carbon losses resulting from changes in land use could occur rapidly in few years and were extremely difficult to reverse [25]. Therefore, considering the importance of land use to predict carbon stocks, along with the possibility of performing land use mapping through satellite images, it was possible to quantify the impact on the soil carbon stock associated with future changes in land use [26]. This result was quite relevant for allowing the development of public policies focused on a rational land use; to prioritize land use systems to promote increased carbon sequestration and enhanced soil carbon stocks.
Another important result pointed out that models generated from the physical and chemical variables of soil and the Random Forest algorithm had a high potential to predict carbon stock, and the models generated were sensitive to different land use systems. However, a study conducted by [24] using a support vector regression (SVR), an artificial neural network (ANN), and the Random Forest to predict and map soil carbon stocks revealed that the Random Forest algorithm achieved the worst result, having generated a model with a determination coefficient of only 0.53. Nevertheless, the authors justified that the development of the Random Forest algorithm may have been compromised due to different extensions of the study areas, topography, sampling density, or quantity and quality of the auxiliary data used.
In the 0–40 cm layer of soil, AFS1 and AFS2 areas had higher carbon stocks than the the pasture and forest areas. These results agree with [27], who demonstrated the high potential of agroforestry systems to increase carbon stocks, both in soil and in the biomass of trees in different pedoclimatic conditions in France. However, these findings contrast with the indications found by [28] and [2]: agroforestry systems had a soil carbon stock similar to a natural forest.
Even though the forest fragment used as a reference in this study had been undergoing a natural regeneration process for over 35 years, the carbon storage process tended to be slow as it was located in a soil classified as Quartzarenic Neosol, which tended to show few mechanisms to stabilize soil carbon. Soils with limited capacity to protect organic carbon, either chemically, biochemically or through aggregation, leave the carbon in an unprotected form and vulnerable to decomposition [29].
The profile of the carbon stock analysis along revealed that the AFS2 planting windrows were more efficient at stocking carbon in the topsoil layers. In contrast, the AFS1 demonstrated a better ability to stock carbon in deeper layers (0.10–0.20 and 0.20–0.40 m), both for planting windrows and windrow buffers. According to [27], soil carbon stocks were larger particularly in rows of trees from AFSs and mainly at the upper 0.30 m of the soil. It was also possible to increase carbon stocks at deeper layers in some silvicultural systems.
The intensive application of vegetable residues from hoeing the inter-rows combined with a pruning system management favored the formation of a thick layer of vegetable residues in the planting windrows in AFS2. This likely contributed to the results found for a larger soil carbon stock, especially for the most superficial layers in the system. In addition, the AFS2 was characterized by a high diversity of plants and high biomass production, therefore showing more potential to contribute to vegetable residues in planting windrows.
By contrast, the AFS2 had a lower plant diversity biomass accumulation on the soil surface, but had an important carbon source in depth, which is connected to the root biomass. A study conducted by [30] demonstrated that 26-year-old agroforestry systems have significantly increased the total organic carbon content in the soil as well as carbon storage through two a two-way carbon input, rhizodeposition, and deposition of residues above the ground. However, according to [31], the contributions of roots under the carbon stocks are smaller in depth (below 0.30 m) compared to the most superficial layers of the soil, such as the effect of residues on wooded areas restricted to the superficial layer.

5. Conclusions

Agroforestry systems developed both for fruit culture and livestock were more efficient at stocking carbon in the soil than a pasture area and a forest fragment in natural regeneration, due to the greater addition of crop residues on topsoil superficies and the management of organic fertilizer in agroforestry systems. Nitrogen stock and the land use system represent the most important variables used to estimate carbon stock from the physical and chemical variables of soil using the Random Forest algorithm. The predictive models generated from the physical and chemical variables of soil through the Random Forest algorithm had a high potential to predict soil carbon stocks and could be applied in different land use systems.

Author Contributions

Conceptualization, Z.M.d.S.; methodology, M.F.M.M. and C.V.V.F.; software, S.R.M.O. and C.V.V.F.; validation, S.R.M.O., Z.M.d.S. and R.L.M.T.; formal analysis, M.F.M.M., C.V.V.F. and F.S.G.; writing—original draft preparation, M.F.M.M.; writing—review and editing, C.V.V.F., Z.M.d.S. and R.L.M.T.; funding acquisition, Z.M.d.S. All authors have read and agreed to the published version of the manuscript.

Funding

This research received no external funding.

Acknowledgments

We thank Conselho Nacional de Desenvolvimento Científico e Tecnológico (CNPq), Brazil for providing Master’s scholarships to Marçal, M.F.M., and thank the owners of TOCA farm for providing the experimental areas and financial support to our research.

Conflicts of Interest

The authors declare no conflict of interest.

References

  1. Lorenz, K.; Lal, R. Soil organic carbon sequestration in agroforestry systems. A review. Agron. Sustain. Dev. 2014, 34, 443–454. [Google Scholar] [CrossRef] [Green Version]
  2. Da Conceição, M.C.G.; Matos, E.S.; Bidone, E.D.; Rodrigues, R.D.A.R.; Cordeiro, R.C. Changes in Soil Carbon Stocks under Integrated Crop-Livestock-Forest System in the Brazilian Amazon Region. Agric. Sci. 2017, 8, 904–913. [Google Scholar] [CrossRef] [Green Version]
  3. Bayer, C.; Amado, T.J.C.; Tornquist, C.G.; Cerri, C.E.C.; Dieckow, J.; Zanatta, J.A.Z.; Nicoloso, R.S. Estabilização do carbono no solo e mitigação das emissões de gases de efeito estufa na agricultura conservacionista. In Tópicos em Ciência do Solo, 1st ed.; Klauberg Filho, O., Mafra, A.L., Gatiboni, L.C., Eds.; Sociedade Brasileira de Ciência do Solo: Viçosa, Brazil, 2011; Volume 7, pp. 55–118. [Google Scholar]
  4. Stockmann, U.; Adams, M.; Crawford, J.; Field, D.; Henakaarchchi, N.; Jenkins, M.; Minasny, B.; McBratney, A.; Courcelles, V.D.R.D.; Singh, K.; et al. The knowns, known unknowns and unknowns of sequestration of soil organic carbon. Agric. Ecosyst. Environ. 2013, 164, 80–99. [Google Scholar] [CrossRef]
  5. Lal, R.; Negassa, W.; Lorenz, K. Carbon sequestration in soil. Curr. Opin. Environ. Sustain. 2015, 15, 79–86. [Google Scholar] [CrossRef]
  6. Paustian, L.; Babcock, B.; Hatfield, J.L.; Lal, R.; Mccarl, B.A.; Mclaughlin, S.; Mosier, A.; Rice, C.; Robertson, G.P.; Rosenberg, N.J.; et al. Agricultural mitigation of greenhouse gases: Science and policy options. In Proceedings of the Anais Conference Proceedings, First National Conference on Carbon Sequestration, Washington, DC, USA, 14–17 May 2001. [Google Scholar]
  7. Chenu, C.; Angers, D.A.; Barre, P.; Derrien, D.; Arrouays, D.; Balesdent, J. Increasing organic stocks in agricultural soils: Knowledge gaps and potential innovations. Soil Tillage Res. 2019, 188, 41–52. [Google Scholar] [CrossRef]
  8. Srinivasarao, C.; Lal, R.; Kundu, S.; Thakur, P.B. Conservation Agriculture and Soil Carbon Sequestration. In Conservation Agriculture; Springer: Cham, Switzerland, 2014; pp. 479–524. [Google Scholar]
  9. Kim, D.-G.; Kirschbaum, M.U.; Beedy, T.L. Carbon sequestration and net emissions of CH4 and N2O under agroforestry: Synthesizing available data and suggestions for future studies. Agric. Ecosyst. Environ. 2016, 226, 65–78. [Google Scholar] [CrossRef]
  10. Behrens, T.; Scholten, T. Chapter 25 A Comparison of Data-Mining Techniques in Predictive Soil Mapping. Vital Soil Funct. Value Prop. 2006, 31, 353–617. [Google Scholar] [CrossRef]
  11. Wang, L.; Zhou, X.; Zhu, X.; Dong, Z.; Guo, W. Estimation of biomass in wheat using random forest regression algorithm and remote sensing data. Crop J. 2016, 4, 212–219. [Google Scholar] [CrossRef] [Green Version]
  12. Everingham, Y.; Sexton, J.; Skocaj, D.; Inman-Bamber, G. Accurate prediction of sugarcane yield using a random forest algorithm. Agron. Sustain. Dev. 2016, 36, 27. [Google Scholar] [CrossRef] [Green Version]
  13. Alvares, C.A.; Stape, J.L.; Sentelhas, P.C.; De Moraes Gonçalves, J.L.; Sparovek, G. Köppen’s climate classification map for Brazil. Meteorol. Z. 2013, 22, 711–728. [Google Scholar] [CrossRef]
  14. Santos, H.G.; Jacomine, P.K.T.; Anjos, L.H.C.; Oliveira, V.A.; Lumbreras, J.F.; Coelho, M.R.; Almeida, J.A.; Araujo Filho, J.C.; Oliveira, J.B.; Cunha, T.J.F. Sistema Brasileiro de Classificação de Solos, 5th ed.; Embrapa: Brasília, Brazil, 2018; p. 353. [Google Scholar]
  15. Soil Survey Staff. Keys to Soil Taxonomy, 12th ed.; United States Department of Agriculture, Natural Resources Conservation Service: Washington, DC, USA, 2014. [Google Scholar]
  16. Teixeira, P.C.; Donagemma, G.K.; Fontana, A.; Teixeira, W.G. Manual de Métodos de Análise de Solos, 3rd ed.; Revista e Ampliada; Embrapa: Brasília, Brazil, 2017; p. 573. [Google Scholar]
  17. Raij, B.V.; Andrade, J.C.; Cantarella, H.; Quaggio, J.A. Análise Química Para Avaliação da Fertilidade de Solos Tropicais; Instituto Agronômico: Campinas, Brazil, 2001. [Google Scholar]
  18. Lindsay, W.L.; Norvell, W.A. Development of a DTPA soil test for zinc, iron, manganese, and copper. Soil Sci. Soc. Am. J. 1978, 42, 421–428. [Google Scholar] [CrossRef]
  19. Nelson, D.W.; Sommers, L.E. Total carbon, organic carbon, and organic matter. In Methods of Soil Analysis, Part 3; Black, C.A., Ed.; Soil Science of America/American Society of Agronomy: Madison, WI, USA, 1996; pp. 961–1010. [Google Scholar]
  20. Ellert, B.H.; Bettany, J.R. Calculation of organic matter and nutrients stored in soils under contrasting management regimes. Can. J. Soil Sci. 1995, 75, 529–538. [Google Scholar] [CrossRef] [Green Version]
  21. R Core Team. R: A Language and Environment for Statistical Computing; R Foundation for Statistical Computing: Vienna, Austria, 2018; Available online: https://www.R-project.org/ (accessed on 18 July 2020).
  22. Hastie, T.; Tibshirani, R.; Friedman, J. The Elements of Statistical Learning: Data Mining, Inference and Prediction, 2nd ed.; Springer: Cham, Switzerland, 2009. [Google Scholar]
  23. Breiman, L. Random Forests. Mach. Learn. 2001, 45, 5–32. [Google Scholar] [CrossRef] [Green Version]
  24. Were, K.; Bui, D.T.; Dick, Ø.B.; Singh, B.R. A comparative assessment of support vector regression, artificial neural networks, and random forests for predicting and mapping soil organic carbon stocks across an Afromontane landscape. Ecol. Indic. 2015, 52, 394–403. [Google Scholar] [CrossRef]
  25. Ostle, N.; Levy, P.; Evans, C.; Smith, P. UK land use and soil carbon sequestration. Land Use Policy 2009, 26, S274–S283. [Google Scholar] [CrossRef]
  26. Scott, N.; Tate, K.; Giltrap, D.; Smith, C.T.; Wilde, H.; Newsome, P.; Davis, M. Monitoring land-use change effects on soil carbon in New Zealand: Quantifying baseline soil carbon stocks. Environ. Pollut. 2002, 116, S167–S186. [Google Scholar] [CrossRef]
  27. Cardinael, R.; Chevallier, T.; Cambou, A.; Béral, C.; Barthès, B.G.; Dupraz, C.; Durand, C.; Kouakoua, E.; Chenu, C. Increased soil organic carbon stocks under agroforestry: A survey of six different sites in France. Agric. Ecosyst. Environ. 2017, 236, 243–255. [Google Scholar] [CrossRef] [Green Version]
  28. Monroe, P.; Gama-Rodrigues, E.F.; Gama-Rodrigues, A.; Marques, J.R.B. Soil carbon stocks and origin under different cacao agroforestry systems in Southern Bahia, Brazil. Agric. Ecosyst. Environ. 2016, 221, 99–108. [Google Scholar] [CrossRef]
  29. Six, J.; Conant, R.; Paul, E.A.; Paustian, K. Stabilization mechanisms of soil organic matter: Implications for C-saturation of soils. Plant Soil 2002, 241, 155–176. [Google Scholar] [CrossRef]
  30. Ramesh, T.; Manjaiah, K.M.; Mohopatra, K.P.; Rajasekar, K.; Ngachan, S.V. Assessment of soil organic carbon stocks and fractions under different agroforestry systems in subtropical hill agroecosystems of north-east India. Agrofor. Syst. 2015, 89, 677–690. [Google Scholar] [CrossRef]
  31. Lim, S.-S.; Baah-Acheamfour, M.; Choi, W.-J.; Arshad, M.A.; Fatemi, F.; Banerjee, S.; Carlyle, C.; Bork, E.W.; Park, H.-J.; Chang, S.X. Soil organic carbon stocks in three Canadian agroforestry systems: From surface organic to deeper mineral soils. For. Ecol. Manag. 2018, 417, 103–109. [Google Scholar] [CrossRef]
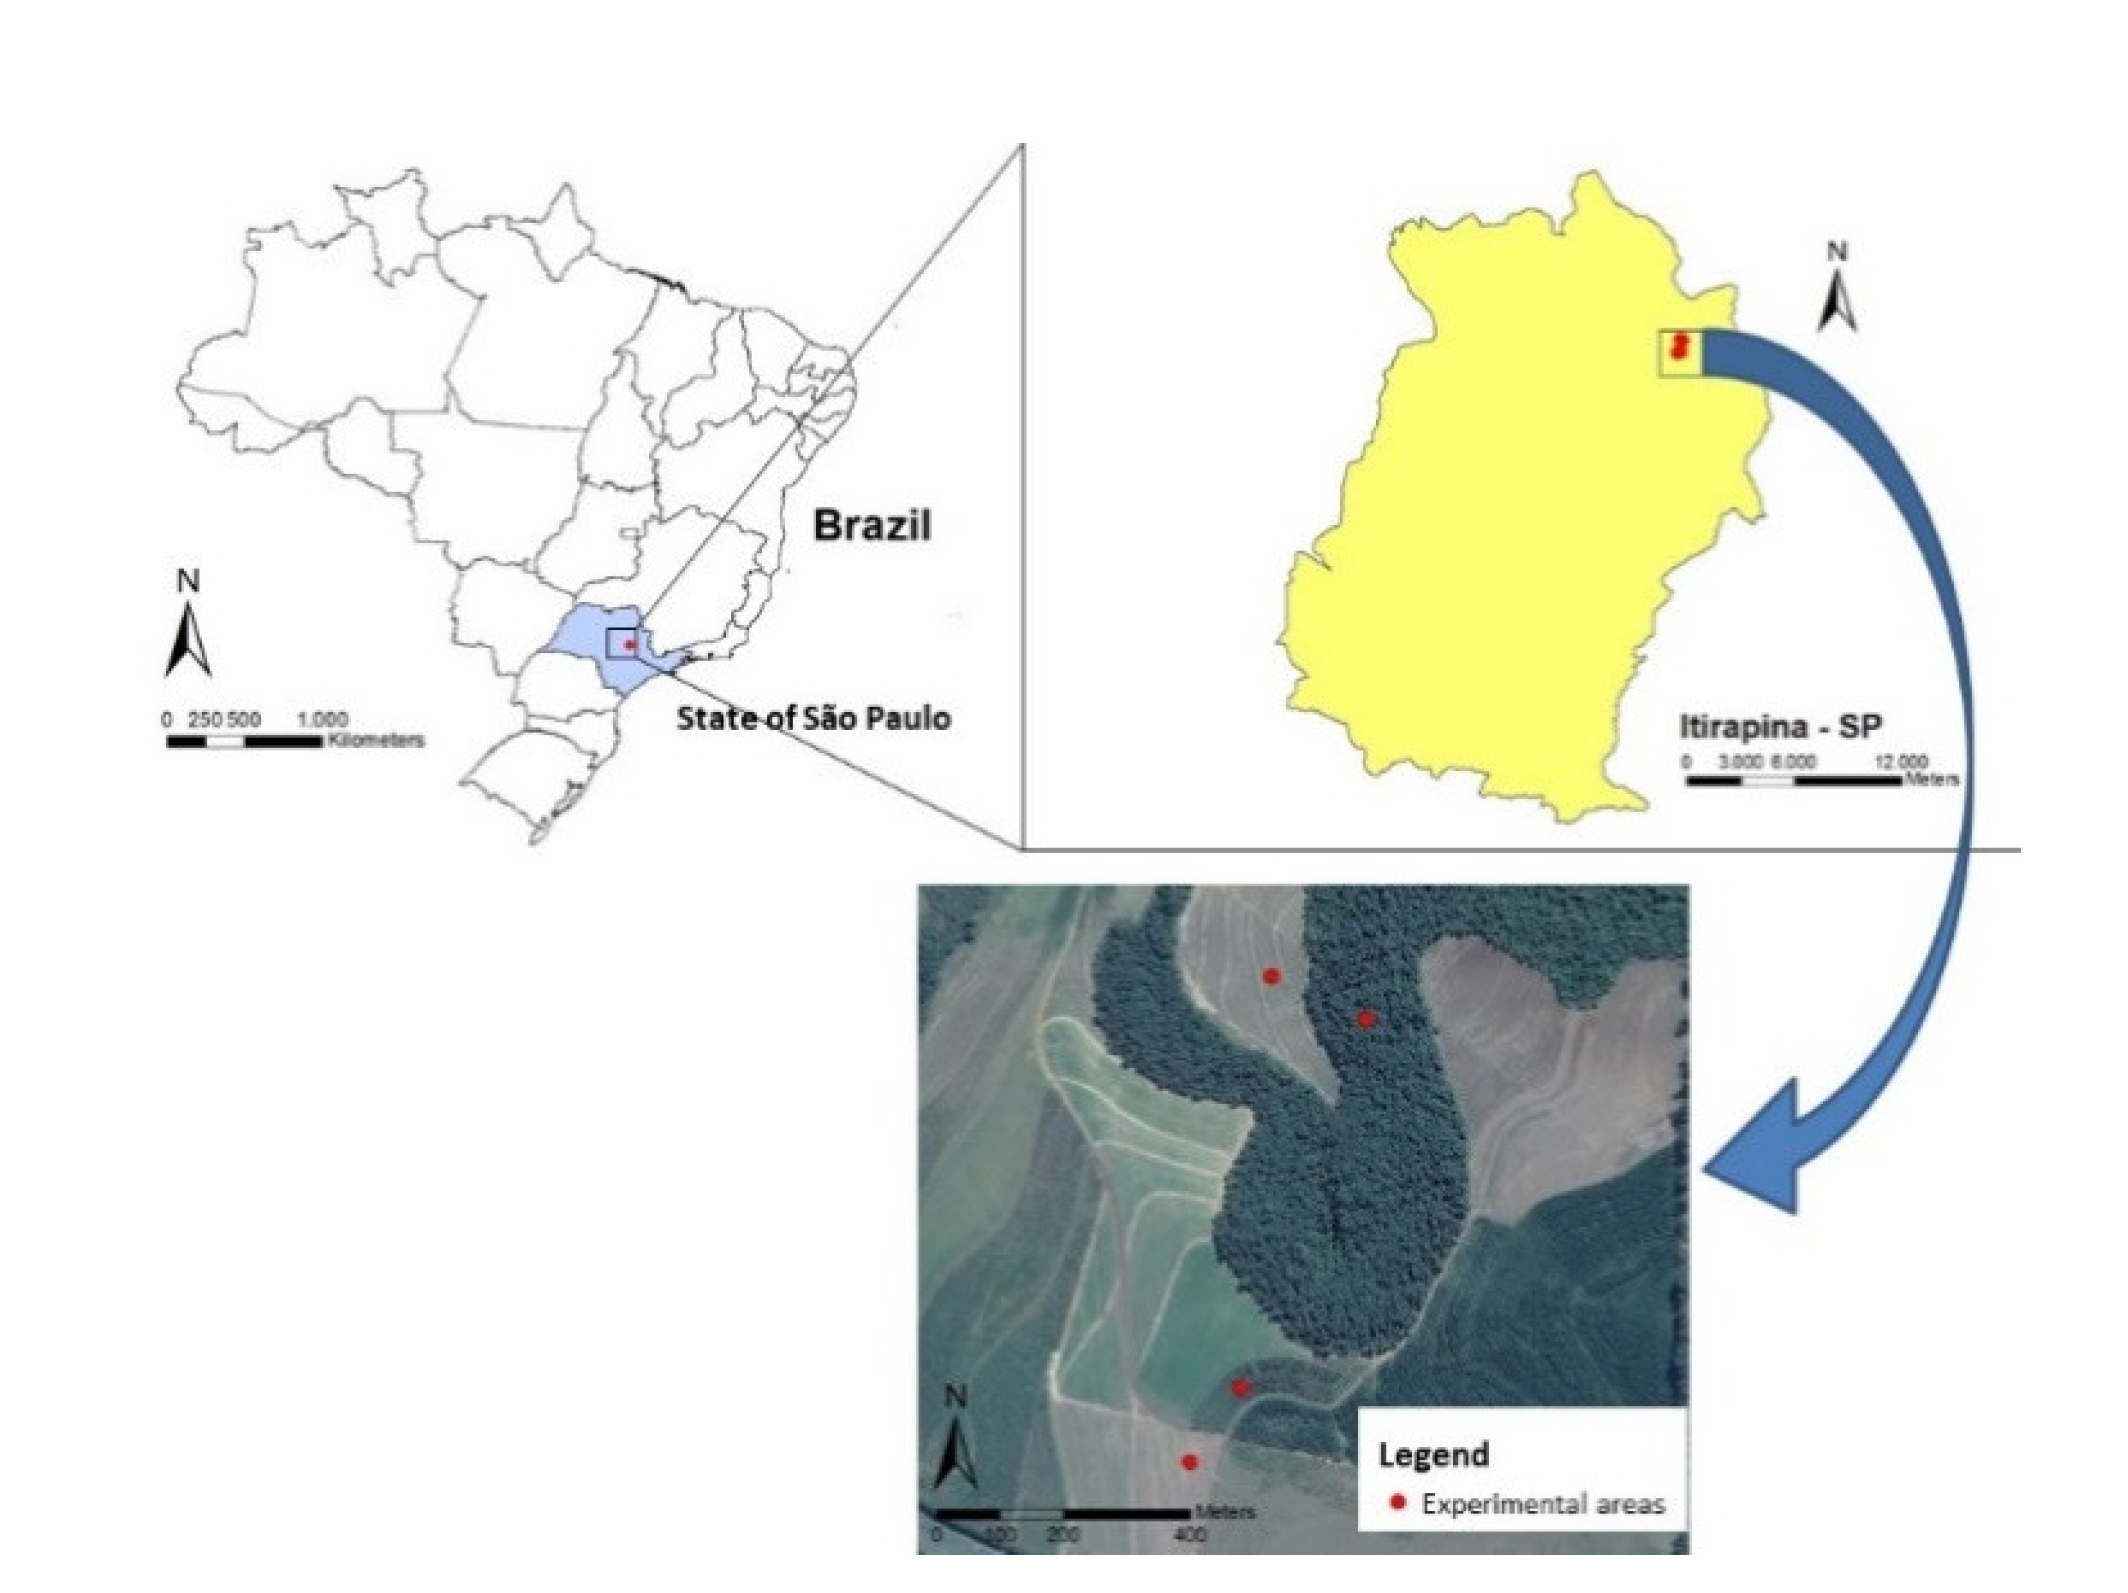
Figure 1. Location of experimental areas in the municipality of Itirapina, São Paulo, Brazil.
Forests 12 01240 g001
Figure 2. Representative scheme of soil collection performed for different land use systems with emphasis on sampling regions. (A) AFS1—agroforestry system developed for livestock, (B) AFS2—agroforestry system developed for fruit culture, (C) Pasture—pasture system, and (D) Forest—forest fragment in natural regeneration.
Forests 12 01240 g002
Figure 3. Boxplot graphs to the response variable, soil carbon stock (Mg ha−1), in different land use systems. AFS1—agroforestry system developed for livestock, AFS2—agroforestry system developed for fruit culture, Pasture—pasture system, Forest—forest fragment in natural regeneration, L—planting windrows, l—tracks of windrow influence, E—inter-rows, and E12—inter-row of 12 m developed for animal pasture.
Forests 12 01240 g003aForests 12 01240 g003b
Figure 4. Pearson correlation matrix used to select the variables to be used in the Random Forest model to predict the soil carbon stock in different land use systems. Bd-bulk density (kg dm−3), Macro-macroporosity (m3 m−3), Micro—microporosity (m3 m−3), SOM—soil organic matter (g dm−3), pH—potential hydrogen, P—available phosphorus content (mg dm−3), K—potassium content (mmolc dm−3), Ca—calcium content (mmolc dm−3), Mg—magnesium content (mmolc dm−3), m—saturation by aluminum (mmolc dm−3), SB—sum of bases (mmolc dm−3), CEC—cation-exchange capacity (mmolc dm−3), V—bases saturation (%), B—Boron content (mg dm−3), Cu—copper content (mg dm−3), Fe—iron content (mg dm−3), Mn—manganese content (mg dm−3), Zn—zinc content (mg dm−33), and N Stock—nitrogen stock (Mg ha−1).
Forests 12 01240 g004
Figure 5. Variables selected at each depth to be used in the Random Forest model to predict soil carbon stock for different land use systems. Bd—bulk density (kg dm−3, Macro—macroporosity (m3 m−3), Micro—microporosity (m3 m−3), SOM—soil organic matter (g dm−3), pH—potential hydrogen, P—available phosphorus content (mg dm−3), K—potassium content (mmolc dm−3), Ca—calcium content (mmolc dm−3), Mg—magnesium content (mmolc dm−3), m—saturation by aluminum (mmolc dm−3), CEC—cation-exchange capacity (mmolc dm−3), B—Boron content (mg dm−3), Cu—copper content (mg dm−3), Fe—iron content (mg dm−3), Mn—manganese content (mg dm−3), Zn—zinc content (mg dm−3), and N Stock—Nitrogen stock (mg dm−3).
Forests 12 01240 g005
Figure 6. Data dispersion, frequency distribution, and Pearson correlation coefficient of variables selected at each depth to be used in the Random Forest predictive model to predict soil carbon stock for different land use systems. Bd—bulk density (kg dm−3, Macro—macroporosity (m3 m−3), Micro—microporosity (m3 m−3), SOM—soil organic matter (g dm−3), pH—potential hydrogen, P—available phosphorus content (mg dm−3), K—potassium content (mmolc dm−3), Ca—calcium content (mmolc dm−3), Mg—magnesium content (mmolc dm−3), m—saturation by aluminum (mmolc dm−3), CEC—cation-exchange capacity (mmolc dm−3), B—Boron content (mg dm−3), Cu—copper content (mg dm−3), Fe—iron content (mg dm−3), Mn—manganese content (mg dm−3), Zn—zinc content (mg dm−3), and N Stock—Nitrogen stock (mg dm−3).
Forests 12 01240 g006
Figure 7. Relative importance of soil physical and chemical variables used to predict soil carbon stock using the Random Forest model: Bd—bulk density (kg dm−3, Macro—macroporosity (m3 m−3), Micro—microporosity (m3 m−3), SOM—soil organic matter (g dm−3), pH—potential hydrogen, P—available phosphorus content (mg dm−3), K—potassium content (mmolc dm−3), Ca—calcium content (mmolc dm−3), Mg—magnesium content (mmolc dm−3), m—saturation by aluminum (mmolc dm−3), CEC—cation-exchange capacity (mmolc dm−3), B—Boron content (mg dm−3), Cu—copper content (mg dm−3), Fe—iron content (mg dm−3), Mn—manganese content (mg dm−3), Zn—zinc content (mg dm−3), and N Stock—Nitrogen stock (mg dm−3).
Forests 12 01240 g007
Figure 8. Validation of the Random Forest model to predict soil carbon stock for different land use systems: r—correlation coefficient, RMSE—root-mean-square error, and R2—determination coefficient.
Forests 12 01240 g008
Table 1. Granulometric composition of experimental areas under different land use systems located in the municipality of Itirapina, São Paulo, Brazil.
Land Use SystemsSandClaySilt
g kg−1
AFS18977528
AFS28888527
Pasture9533710
Forest9375013
AFS1—agroforestry system developed for livestock, AFS2—agroforestry system developed for fruit culture, Pasture—pasture system, Forest—forest fragment in natural regeneration.
Table 2. Physical and chemical variables in soil used to compose the database to predict soil carbon stock.
VariableDescriptionAbbreviationUnitType
Land useAFS1, AFS2, Pasture and ForestPredictive
PhysicalBulk densityBdkg dm−3Predictive
MacroporosityMacrom3 m−3Predictive
MicroporosityMicrom3 m−3Predictive
ChemicalpHPredictive
PhosphorusPmg dm−3Predictive
PotassiumKmmolc dm−3Predictive
CalciumCammolc dm−3Predictive
MagnesiumMgmmolc dm−3Predictive
Saturation by aluminummmmolc dm−3Predictive
Sum of basesSBmmolc dm−3Predictive
Cation-exchange capacityCECmmolc dm−3Predictive
Bases saturationV%Predictive
BoronBmg dm−3Predictive
CopperCumg dm−3Predictive
IronFemg dm−3Predictive
ManganeseMnmg dm−3Predictive
ZincZnmg dm−3Predictive
Soil organic matterSOMg dm−3Predictive
Soil nitrogen stockN stockMg ha−1Predictive
Soil carbon stockC stockMg ha−1Response
AFS1—agroforestry system developed for livestock, AFS2—agroforestry system developed for fruit culture, Pasture—pasture system, Forest—forest fragment in natural regeneration.
Publisher’s Note: MDPI stays neutral with regard to jurisdictional claims in published maps and institutional affiliations.