Article

Study on Spatiotemporal Characteristic and Mechanism of Forest Loss in Urban Agglomeration in the Middle Reaches of the Yangtze River

1
Department of Environmental Design, Fine Arts Academy, Hunan Normal University, No. 36 Lushan Road, Yuelu District, Changsha 410081, China
2
College of Geographic Science, Hunan Normal University, No. 36 Lushan Road, Yuelu District, Changsha 410081, China
*
Author to whom correspondence should be addressed.
Forests 2021, 12(9), 1242; https://doi.org/10.3390/f12091242
Submission received: 12 August 2021 / Revised: 12 September 2021 / Accepted: 13 September 2021 / Published: 14 September 2021
(This article belongs to the Section Urban Forestry)

Abstract

:
Under the backdrop of achieving carbon neutrality and accelerating urbanization, China’s forests face unprecedented pressures. This study explored the spatiotemporal characteristics of forest loss in the urban agglomeration in the middle reaches of the Yangtze River (UAMRYR). The dynamic mechanism of forest loss caused by fire, logging, construction, and pollution was also analyzed using spatial database development, polygon superposition analysis, grid system construction, and coordinate system calculation. The results show that the forest loss in the UAMRYR experienced three stages: continuous acceleration (1990–2010), peak (2010–2015), and slight decline (2015–2020). Rapid urban expansion is the primary cause of forest loss, and the three metropolitan areas had the fastest urban expansion and the most severe forest loss. Due to the success of afforestation efforts, the forest loss caused by fire, logging, and pollution was restored by 80%, while most of the forest losses caused by construction are permanent. Given the current forest loss trends, large expanses of forests in the UAMRYR are at risk of being destroyed and causing serious damage to the region’s ecological environment. Forest losses can be significantly reduced by guiding the rational expansion of cities, supporting afforestation for urban construction projects, strengthening forest fire risk investigation, and implementing ecological reconstruction of polluted areas.

1. Introduction

From 1990 to 2020, the global net forest loss reached 1,780,000 km2, with the current rate of deforestation at about 40,000 km2 per year [1,2]. To reverse the global trend of environmental degradation, various countries have pledged to adopt policies and implement strategies that aim to promote environmentalism and sustainable development. At the 2020UN General Assembly, China declared that it would strive to reach peak carbon dioxide emissions before 2030 and achieve carbon neutrality before 2060 [3]. This puts increased pressure on China to further strengthen forest protection and implement environmental policies as the country continues to industrialize and develop. Although China has been exemplary in its forest protection and afforestation efforts, it faces constant threats of forest loss, mainly due to pressures from urbanization [4]. This is why analyzing the processes and characteristics of China’s current forest loss is extremely useful, particularly using a spatiotemporal perspective, in formulating practical and effective forest protection countermeasures [5,6].
Since the 1990s, numerous studies have been conducted characterizing and evaluating the mechanisms of forest loss. In the current literature, forest loss is divided into three types: temporary loss, semi-permanent loss, and permanent loss [7]. Temporary losses are caused mainly by planned forest cutting, which can then be shortly restored by afforestation. Semi-permanent losses are mostly caused by disasters (e.g., fire, wind) and inundated logging and require longer recovery times. Permanent losses are mostly due to urban construction and environmental pollution, and result in lands that are hard to recover [8].
In terms of origin, Schleeweis [9] identified six main causes of forest loss: fire, windstorm, logging, deforestation and reclamation, pollution, and construction occupation. In many countries in Asia, North America, Europe and Africa, fire is the primary cause of forest loss. A large-scale fire can destroy thousands of square kilometers of forests in a few months, leaving burn scars that take decades to recover [10,11]. On many coastal forest ecosystems, windstorms can have particularly destructive widespread effects [12]. In many developing countries in South America and Southeast Asia, logging, deforestation, and reclamation are the main culprits for forest loss. Unplanned logging, deforestation, and reclamation are particularly problematic, causing permanent forest loss with significant persistence and spatial randomness [13,14,15,16]. Additionally, while planned logging (e.g., transforming natural forests into oil palm forests or timber forests) may stop significant net forest loss, it diminishes the forest’s ecological value and degrades many of its ecosystem services [17,18,19,20]. Among regions with extensive and highly developed heavy industries and mining activities, environmental pollution (e.g., soil and water pollution) can lead to significant permanent forest loss [21,22]. For many developing countries, urban construction is the main cause of forest loss. Every year, significant swaths of forests are lost and converted into urban spaces to support the creation and expansion of cities and promote economic activities. Because the lands are converted into infrastructure and urban areas, such forest losses are extremely difficult to recover [23,24,25].
These factors are also the primary causes of forest loss in China [26]. In the last ten years, China experienced between 2000 and 8000 forest fires each year, which account for about 10% of the country’s total net forest losses, far less than the world average [27]. The main reason is that China has a very effective forest fire prevention and fighting system, extinguishing many outbreaks before they spread. Forest loss caused by windstorms mainly occurs in China’s southeast coastal areas, accounting for about 2% of the national forest loss [28]. Given China’s annual afforestation of about 67,000 km2, most forest losses from fire and windstorms have been restored shortly [29]. Since 2000, due to strict legal and policy constraints, China’s forest loss caused by logging, deforestation, and reclamation has decreased, with most harvested forests recovering and being reforested and tended over time. Forest loss caused by industrial and mining pollution has been largely limited, primarily due to China’s strict supervision policy of environmental protection [30]. While comparatively small, polluted areas have difficulty recovering and constitute a huge portion of permanent and semi-permanent forest loss [31]. Urban construction accounts for the highest proportion of China’s forest loss. In urban agglomerations characterized by centralized urbanization, the construction and expansion of cities encroaches into surrounding forests, replacing tree cover with mostly urban built-up areas and some artificial green spaces [32]. The spatial distribution of forest loss caused by urban construction directly corresponds to the direction and speed of urban expansion. Once converted, forest loss is permanent, which is why urban construction is the primary reason for China’s permanent forest loss [33,34,35].
Over the years, various mathematical and spatial analysis methods have been applied to analyze forest loss. The Analytical Hierarchy Process (AHP), Time Series Analysis (TSA), Data Envelopment Analysis (DEA), and other mathematical methods have been used to analyze the trend characteristics, causes, and action mechanisms of forest loss [36,37,38]. These methods often use administrative regions as the analysis unit, which is effective for macro analysis but not for analyzing micro-spatial change. With advancements in geospatial technology and developments in computing techniques, new methods and approaches have been developed, allowing for more micro-scale analyses and high-temporal-scale investigations. For instance, the use of geographic information systems (GIS) has become ubiquitous in various spatial applications, including forest loss and land use change analyses [39]. Remote sensing data such as AVHRR, MODIS, Landsat, AlOS, SPOT, and ENVISAT have also become mainstream for forest loss analysis, having resolutions ranging from 30 m to 1000 m [40,41]. Land use and landcover (LULC) data provided by the United States Geological Survey (USGS) includes classified vegetation information such as forest, shrub, grassland, and tundra, with a resolution of 100–300 m [42,43]. Google Earth images have also been used in vegetation cover analyses and landcover change detection, providing high-resolution data at 0.6–1.0 m resolution [44]. Long-Term Data Record (LTDR), Random Forest Algorithm (RFA), Cellular Automata (CA), and other computing techniques have also been used to analyze spatiotemporal changes in forest lands [45,46,47]. These methods are not limited by the conventional practice of using administrative units and instead use polygons or grid cells that can more accurately characterize micro-level characteristics and trends in landcover change [48].
Moreover, advancements in remote sensing technologies and survey instrumentation have provided new avenues to measure, detect, and analyze spatial changes in landcover [49]. Terrestrial Laser Scanning (TLS) can be used to accurately measure heights, Diameter at Breast Height (DBH), and other tree parameters, providing information to characterize the location, distribution, and maturity of forests [50]. Thermal Imaging can monitor fire risks and human activities in forests and provide support in identifying high-risk areas for forest loss [51]. These spectral remote sensing technologies rely on special satellites or UAVs in collecting data; however, in many countries and regions, access to and availability of these technologies are limited [52]. This means that while news methods and data for spatiotemporal forest analyses have largely progressed, limitations and contradictions in the accuracy of analysis and data availability remain highly unresolved [53].
These datasets and methods have their own advantages. However, if only one is used, it would be difficult to comprehensively and accurately analyze forest loss at the scale of urban agglomeration. LULC data can be used to analyze the spatial change in forests but have difficulty identifying the causes of forest change. Remote sensing data (e.g., AVHRR, MODIS, Landsat, ALOS, SPOT, and ENVISAT) can reflect the causes of macro-level forest change but cannot reflect the causes of forest change at the micro level, given their 30 m resolution. Google Earth provides a higher resolution and can reflect trends and causes of forest change at the micro level, but the dataset has not been vectorized, which makes it difficult to process. LTDR and RFA can accurately analyze spatial trends of forest loss or growth in a certain region but have difficulty reflecting spatial distribution. Existing CA methods can reflect the macro spatial distribution of forest growth or loss but have limited capabilities reflecting micro-level changes and the dynamic factors causing the change. TLS and Thermal Imaging can analyze micro-level changes in forests and its dynamic factors, but their datasets must be obtained by professional equipment, making it difficult to obtain necessary data for huge regions, such as urban agglomerations.
In this study, we developed a new approach to evaluate the spatiotemporal characteristics and dynamic mechanism of forest loss in urban agglomerations. This approach can be divided into five steps. First, the scope of the research area was clarified, and the LULC, Landsat, Google Earth, and other datasets were collected. Second, the datasets underwent project correction, geometric correction, and image optimization and were then imported into ArcGIS. For all areas where forest vegetation had been re-moved, Landsat and Google Earth images were compared to determine the causes of forest change and generate a spatial database reflecting forest and other landcover changes. Third, using the spatial database, a grid system composed of massive grid cells was established to determine total forest loss and identify the cause for each grid cell. Statistical calculations were carried out on all grid cells, and the complex spatial changes in forest cover could be reflected. Fourth, the grid cells where forest area changes occurred in each time period were determined. The coordinate systems representing the regional differences and characteristics of forest loss were established using the centrifugal model and were classified into several categories according to their impact degree and scope. Fifth, the forest loss in the coordinate systems was analyzed and compared with the spatial distribution of forest loss in the grid system. The spatial characteristics and mechanism of forest loss could then be summarized. This approach adopts time series analysis of the LTDR and the spatial unit division and discrete analysis in the CA and can utilize the advantages of the LULC, Landsat, Google Earth, and other spatial data. The proposed approach is expected to accurately analyze spatial trends, characteristics, and mechanisms of forest loss in urban agglomerations and other regions.
The study area is the urban agglomeration in the middle reaches of the Yangtze River (UAMRYR), the first national urban agglomeration approved to be established in China [54]. The region has the most concentrated urbanization and most rapid urban expansion in Central China [55]. Although there are strict forest protection policies and active afforestation activities, forest cover in the UAMRYR has decreased in the last three decades [56]. This study utilized the previously mentioned analyses to characterize and identify the causes of forest loss in the UAMRYR. The structure of the study can be divided into five parts. The first part is the Introduction, which introduces the research background, research object, existing theories, methods, and common data. The second part is the Materials and Methods, which establishes the methodology for forest loss analysis in the UAMRYR. The third part is the Results, which elaborates the overall forest loss, the spatial distribution of forest loss and its causes, and the forest loss in important areas. The fourth part is the Discussion, which summarizes the spatiotemporal characteristics and mechanism of forest loss in the UAMRYR, puts forward several countermeasures to curb forest loss, and presents the limitations of the study. The fifth part is the Conclusion, which presents the highlights of the results. The methodology and results of this study can be used in developing targeted optimization countermeasures and be used as a reference for other studies of forest loss in similar areas.

2. Materials and Methods
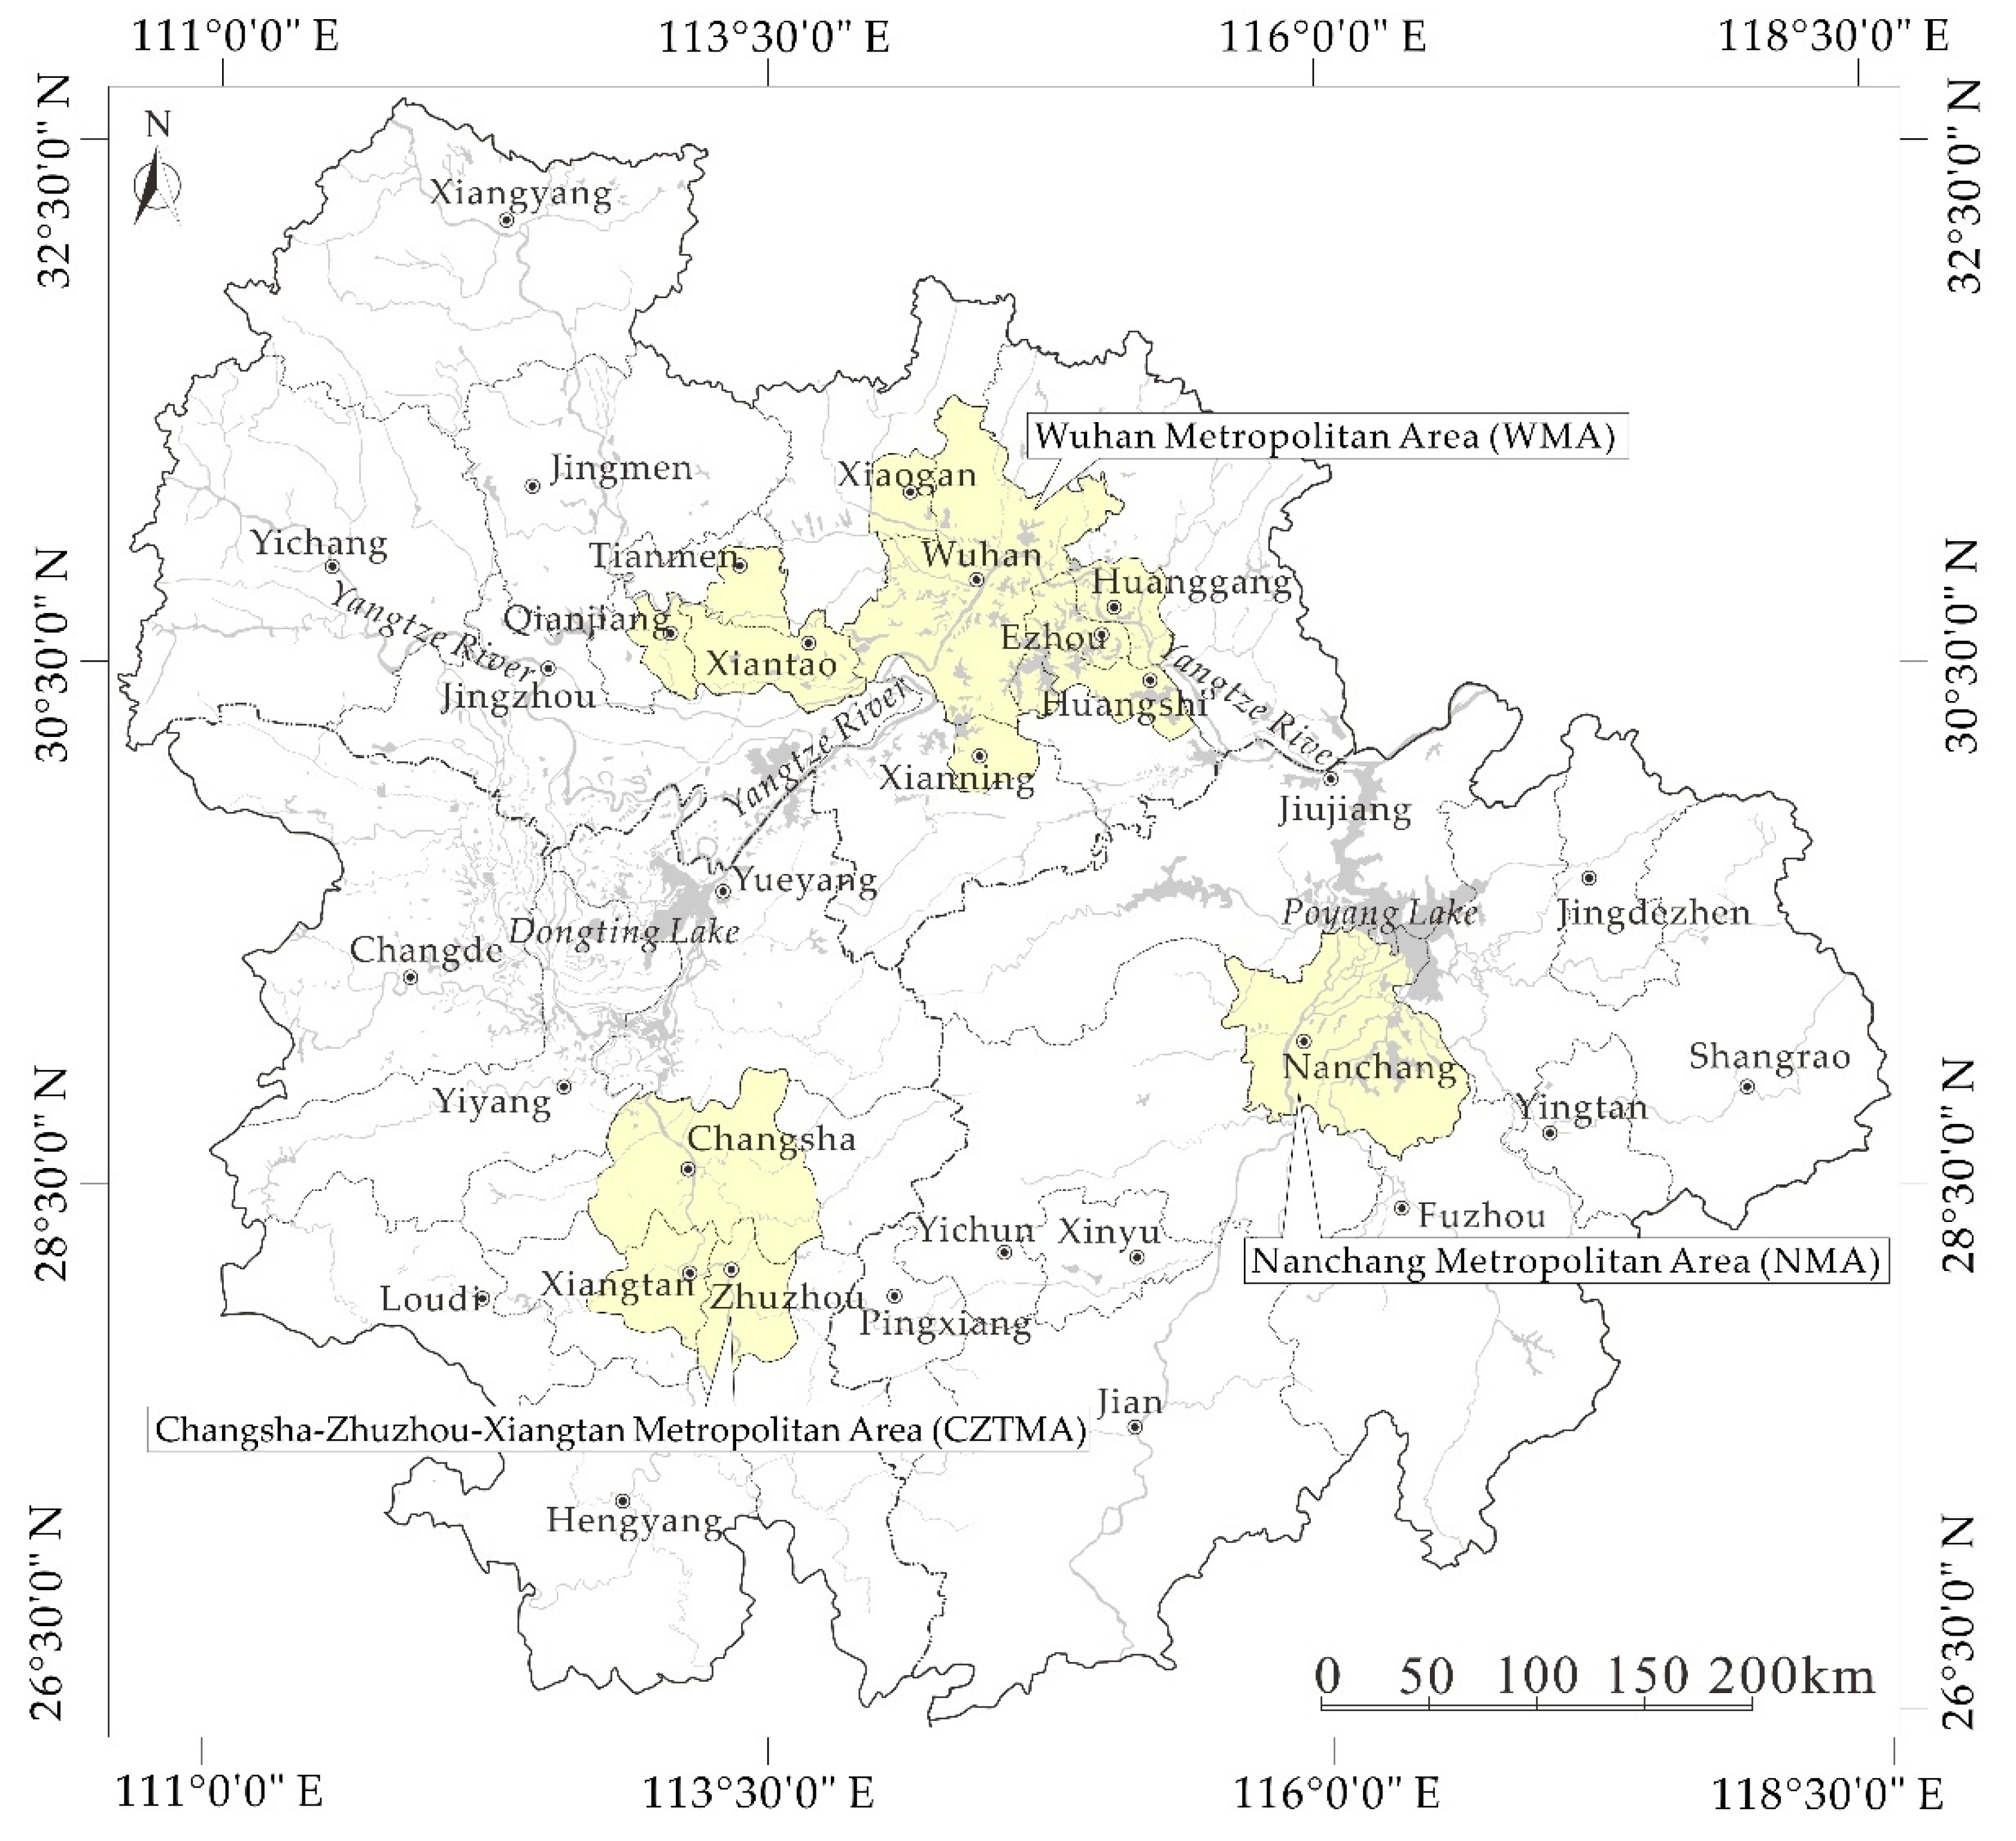
2.1. Study Area

The UAMRYR is located in Central China (110°23′~118°28′ E; 26°29′~32°30′ N), covering 31 cities in Hubei, Hunan, and Jiangxi provinces, with a total area of about 317,000 km2, as shown in Figure 1. In 2020, the region’s population reached 129.16 million, including an urban population of about 79.24 million. It is the second-largest urban agglomeration in China, second only to the urban agglomeration in the Yangtze River Delta (UAYRD). The UAMRYR is rich in forest resources. In 2020, the total forest area was 144,953.79 km2, accounting for 45.72% of the total regional area, and the forest volume was estimated at 1.60 billion m3 [57]. Urban expansion in the UAMRYR has accelerated in recent years, especially in the Wuhan metropolitan area (WMA), the Changsha–Zhuzhou–Xiangtan metropolitan area (CZTMA), and the Nanchang metropolitan area (NMA) [58]. In the WMA, Wuhan serves as the core, with eight surrounding cities: Huangshi, Huanggang, Ezhou, Xiaogan, Xianning, Xiantao, Tianmen, and Qianjiang. The CZTMA consists of Changsha, Zhuzhou, and Xiangtan. Additionally, in the NMA, Nanchang serves as the core to the surrounding small towns. Forest loss occurs in all 31 cities of the UAMRYR but is more significant in these three metropolitan areas [59].

2.2. Data Sources

Spatial data from the Chinese standard digital map, Landsat, Globaland 30, LULC, and Google Earth were used in this study. The standard digital map of China was obtained from the National Platform for Common Geospatial Information Services (NPCGIS, https://map.tianditu.gov.cn/, accessed on 15 May 2021), digital map No. GS (2021) 3715. Landsat data, including TM, ETM+, and OLI/TIRS, were acquired from the USGS using the UTM-WGS84 projection coordinate system at 30 m resolution. The Globeland 30 dataset was obtained from the Globeland 30 Website, established by the Ministry of Natural Resource of the PRC (http://www.globallandcover.com, accessed on 18 May 2021). The dataset has a 30 m resolution and includes data for 2000, 2010, and 2020. The LULC dataset was obtained from the European Space Agency Website (http://www.esa-landcover-cci.org/, accessed on 18 May 2021). The dataset has a 100 m resolution and includes data for 1990, 1995, 2005, and 2015. The Globeland 30 and LULC use eight landcover types: urban, agricultural, tree, shrub, grass, wetland, water, and bar areas (there is no frozen soil and tundra within the UAMRYR). The Google Earth dataset was obtained from the Google Earth Pro software (version: 7.3.3). Its image resolution is 10–30 m for 1990–2000 and 0.6–10 m for 2005–2020, which can be used as reference for Landsat and LULC data.

2.3. Methods

2.3.1. Spatial Data Processing

The digital map provided by the NPCGIS was imported into ArcGIS (version 10.2) and was used to draw the boundaries for the UAMRYR, Hubei, Hunan, Jiangxi, and subordinate cities and important infrastructure, including railways, highways, and roads. Landsat data were imported in ENVI (version 5.1) and underwent projection correction, geometric correction, and image optimization before being imported into ArcGIS [60]. The Globeland 30 and LULC datasets were also imported into ArcGIS for coordinate alignment and projection correction. Finally, the tree and shrub landcover were merged to generate the forest landcover type [61].

2.3.2. Spatial Differentiation for Forest Loss

Using the intersect function in ArcGIS, the forest polygons in the spatial database for 1990–1995, 1995–2000, 2000–2005, 2005–2010, 2010–2015, and 2015–2020 were superimposed and analyzed to determine the change in landcover. For all polygons where vegetation was removed, the Landsat image was used for comparison to determine which landcover type the forest transformed. The Arcscan and Raster Calculator functions of ArcGIS were used to automatically compare the images and evaluate the change in landcover [62]. If a forest polygon is replaced by urban built-up areas, expressways, and railways in a certain period, the cause of forest loss for this polygon is assumed to be construction [63]. If a forest polygon is replaced by grassland, farmland, or bare land, the cause of forest loss may be logging, fire, or pollution. The cause must then be clarified using visual interpretation on high-resolution images, such as Google Earth. For instance, if the high-resolution image corresponding to the forest polygon is black or dark brown, or the dark brown area is mixed with grassland, the cause of forest loss is assumed to be fire. If the corresponding high-resolution image is grayish-white or grayish-yellow, the cause of forest loss can be determined as pollution. If there is no obvious fire and pollution occurrence in the corresponding high-resolution image, or there are regular tree stumps in agricultural land and grassland, the cause of loss can is assumed to be logging [64]. The cause of forest loss for each polygon was determined and inputted into the database to generate the spatial distribution of forest loss and overall landcover change.

2.3.3. Construction of Grid System

In the urban agglomeration, forest loss and landcover change are extremely complex and difficult to quantify or describe directly. A grid system helps standardize complex changes and unify the spatial system for statistical operation. The smaller the area and the greater the number of cells in the grid system, the more accurate the calculation results would be, but the number of calculations would also increase. Therefore, the area and number of cells need to be determined according to the scale of the research region. Considering the spatial scale of the UAMRYR and the feasibility of operation, a grid system was used in the analysis, containing 12,780 5 km × 5 km grid cells [65]. Using the Partition Statistical function in ArcGIS, the total area for each landcover type in each cell was calculated for the years 1990, 1995, 2000, 2005, 2010, 2015, and 2020. Through temporal analysis, the areas of forest loss and landcover change for each cell were calculated. Additionally, the area of forest loss sorted by the cause and extent of afforestation in each cell was calculated for each of the six periods (i.e., 1990–1995, 1995–2000, 2000–2005, 2005–2010, 2010–2015, and 2015–2020). The grid system was then used to show the overall forest loss, the distribution of forest loss classified according to cause, and the afforestation distribution in the UAMRYR, as shown in Figure 2.

2.3.4. Establishment of Forest Loss Coordinate Systems

All cells with added or subtracted forest cover during 1990–2020 were identified, and lots of coordinate systems were generated with their cell center as the origin. The effective range and the total amount of forest loss (or increment) of all coordinate systems were calculated using the following equations [66]:
P f ( i , j ) P f .   ( 0 < P f ( i , j ) P f ( i 1 , j 1 ) i 1 ; j 1 )
P f t = i = 0 t j = 0 t P f ( i , j )
In Equation (1), Pf(i,j) is either forest loss caused by a particular cause or forest restored through afforestation efforts in period f in cell (i, j); i and j are the cell coordinates; Pf is the effective set; and f is the observation period, which either pertains to the entire research time (i.e., 1990–2020) or one of the six periods. When the forest loss (or increment) of Pf(i,j) is bigger than 0, and less than or equal to the adjacent cell closer to the origin Pf(i−1,j−1), Pf(i,j) is regarded as a valid cell of this particular coordinate system. Otherwise, the cell is regarded as invalid and is excluded in the calculations for this particular coordinate system. Through this process, the effective cells of each coordinate system were obtained to determine the extent of the coordinate systems [67]. In Equation (2), Pft is the sum of forest loss categorized by cause in a coordinate system, and t is the number of effective cells in this coordinate system. Using the results, the total forest loss in the UAMRYR from 1990 to 2020 can then be calculated by:
P T = f = 1 6 n = 1 4 P f n f = 1 6 P f r
where PT is the total forest loss of a cell in a coordinate system from 1990 to 2020, Pfn is the forest loss caused by a certain cause in a certain period of the cell, Pfr is the forest restoration in a certain period, f refers to the observation period, and n refers to the cause of forest loss. Since there are four causes of forest loss: fire, logging, construction, and pollution, the n in one cell shall not be greater than 4.
The coordinate systems could then be divided into several levels according to their subordination using the expression:
C T D C f   ( T = 0 t P T D < m = 1 t P f m t / D ; D 10 )
where CTD refers to the subordinate coordinate system, Cf refers to the main coordinate system, PTD is the total forest loss of a cell in CTD from 1990 to 2020, Pfm is the total forest loss of a cell in Cf from 1990 to 2020, t is the number of cells in the coordinate system, and D is the distance between the origins of the subordinate and main coordinate systems, and its unit is the side length of the grid cell (5 km). When CTD belongs to Cf, all cells in CTD are considered in Cf. A subordinate coordinate system belonging to a main coordinate system indicates that it is under the influence of the main coordinate system and that the forest loss is likely to be affected by the main coordinate system. The main coordinate systems in dominant levels often have a larger scope and greater influence on the surrounding area and have more subordinate coordinate systems. They are often the most important areas of forest loss. Using the results of the calculations, the dominant coordinate systems are taken as the primary research objects in generating the curves of forest loss categorized according to cause [68]. The findings are then used to characterize the spatiotemporal features of forest loss in particular areas of the UAMRYR.

3. Results

3.1. Overall Analysis of Forest Loss

The change in landcover in the UAMRYR from 1990 to 2020 is presented in Figure 3. Urban built-up area and traffic land increased by 3380.23 km2 and 787.43 km2, respectively, while the agricultural land, forest, grassland, water area, and wetland decreased by 2113.51 km2, 767.29 km2, 539.32 km2, and 759.97 km2, respectively. Forest loss (767.29 km2) was the second highest among the four main ecological land types, accounting for 18.36% of the total ecological land loss (4180.09 km2). Analyzing forest distribution for the different periods, the results suggest that substantial forest lands were restored through afforestation in subsequent years.
According to the data released by the Forestry Bureaus of the three provinces, annual afforestation in the UAMRYR reaches 1500–2000 km2. However, some of the effects of these afforestation measures cannot be reflected simply by the change in landcover extent. Restoration efforts include replenishing stocks in mature forests and tending on young forests, which do not increase the size of forest lands. In this paper, afforestation refers only to those that have changed the forest extent, such as forest restoration from fire events and forest replanting in barren lands. The total afforested land in the UAMRYR from 1990 to 2020 was estimated at 523.61 km2. The results suggest that from 1990 to 2020, the gross forest loss in the UAMRYR was 1290.9 km2, of which 523.61 km2 was restored, resulting in the total forest loss (net forest loss) of 767.29 km2.
Visual analyses of Landsat and Google Earth images indicate forest loss in the UAMRYR was caused mainly by fire, logging, construction, and pollution. Among them, pollutions caused by mining and industry have very similar visual characteristics and are difficult to differentiate using remote sensing images and were therefore combined under one category. Forest loss caused by geological disasters, such as landslides and debris flows, constituted only a very small proportion (~0.23%) and were therefore combined with pollution. As presented in Figure 4, four categories of forest loss causes were used in this study: fire, logging, construction, and pollution. The total area of forest loss in each category was then calculated for the different time periods, and the results are summarized in Table 1.
As shown in Table 1, the rate of forest loss in the UAMRYR increased continually during 1990–2010. The value peaked in 2010–2015, with forest loss at 189.50 km2, and decreased slightly in 2015–2020, with forest loss estimated at 186.88 km2. The forest restoration rate caused by afforestation increased from 58.53 km2 in 1990–1995 to 92.84 km2 in 2005–2010 and then stabilized at about 95 km2.
In terms of causes, 17.84% of forest loss was attributed to fire, 18.74% to logging, 60.57% to construction, and 2.85% to pollution. The trend for fire-induced forest loss showed a gentle parabola, with 29.74 km2 in 1990–1995, 45.14 km2 in 2005–2010, and then decreased to 36.64 km2 in 2015–2020. The forest loss caused by logging also had a gentle parabolic trend, initially slightly lower than fire-induced forest loss, but it became higher starting from 2005–2010. Construction-related forest loss had an S-shaped curve, having relatively flat growth in 1990–2000, sharply increasing in 2000–2005, and reaching 186.38 km2 in 2010–2015 and 191.41 km2 in 2015–2020. Its growth rate and proportion were also much higher than the other three causes. Forest loss caused by pollution exhibited a very gentle parabolic trend and was considerably lower than the other categories in terms of growth rate and proportion.

3.2. Spatial Difference Analysis of Forest Loss

In Figure 5, the forest loss polygons in the six periods of 1990–2020 are presented with light to dark colors, and the forest loss polygons caused by various reasons are showed in different colors. Then, the spatial distribution of forest loss and its causes are displayed intuitively.
After establishing the grid system, we calculated the area of forest loss for each category and the total forest loss area for the entire region in each cell. The coordinate systems were established for the cells with forest change, and the effective cells of the coordinate systems were calculated. In Figure 6, the grid cells are expressed in different heights and colors according to total forest loss and causes for 1990–2020.
As shown in Figure 5 and Figure 6, the distribution of fire-induced forest loss in the UAMRYR was relatively scattered and random, occurring in areas with forest distribution. The fire Pft value (the sum of the forest loss area of each cell in the coordinate system) in 89% of the coordinate systems was less than 5 km2, and the highest Pft was 8.25 km2. This suggests that in UAMRYR, the spread tendency of forest fires is weak and that most fires are extinguished before they spread. About 22% of the coordinate systems had repeated fires in two or more periods, indicating potential fire hazards in some parts of the region.
Forest loss caused by logging was also dispersed, and the regional differences were not particularly significant. The logging value Pft in 83% of the coordinate systems was less than 5 km2, 14% had 5–10 km2, and only 3% had Pft more than 10 km2, with the highest being 11.74 km2. This suggests no severe deforestation in the UAMRYR and that most of the lumber operations were planned. Unlike fire-induced forest losses, those caused by logging were mostly located close to urban built-up areas, with only a few occurring in large forests far from urban spaces. Economic forests are usually established close to existing urban built-up areas to meet the timber needs of the nearby populations and to save on transportation costs.
Forest losses due to construction were found to be the highest in the region. The distribution shows significant agglomeration, situated largely around the cities. The construction Pft value was less than 10 km2 in 42% of the coordinate systems, 10–20 km2 in 33%, 20–30 km2 in 19%, and 30 km2 or higher in 6% of the coordinate systems. The highest Pft value was 64.25 km2. In terms of subregions, the CZTMA had the highest and most concentrated construction-related forest loss estimated at 191.28 km2, followed by the WMA with 181.34 km2, and the NMA with 98.92 km2. These three sub-regions accounted for 62% of the region’s forest loss caused by construction, while 37% were found in the other 18 cities, and 1% were distributed outside urban zones.
The forest loss caused by pollution was the smallest among the different groups and had a relatively scattered distribution. The pollution Pft value in 93% of the coordinate systems was below 5 km2, and the highest value was 7.18 km2. The coordinate systems with Pft value greater than 5 km2 were located near mining operations (e.g., coal mines, non-metallic mines, non-ferrous metal mines), which are not directly related to the distribution of urban built-up areas. This suggests that forest loss caused by pollution is closely related to mineral development.
Afforestation was higher than the combined forest losses from fire, logging, and pollution and had high correspondence in spatial distribution with these groups. About 82% of the forest losses from fire, logging, and pollution were restored within the next 5–15 years, accounting for 83% of the total forest restoration. The restoration rate for fire-induced forest losses was 83%, 82% for logging-related forest losses, and 68% for pollution-induced forest losses. About 11% of forest restoration occurred in bare and agricultural lands. These mostly occurred in areas where croplands are reverted into forestlands, a common afforestation practice in China. About 5% of forest restoration transpired in urban built-up areas, mainly in spaces for urban parks and large greeneries. The total afforested urban area was 26.18 km2, accounting for 3% of the forest loss caused by construction. The results suggest that the afforestation in UAMRYR has been very effective, with more than 80% of forest losses from fire, logging, and pollution restored. The findings also mean that the forest losses from construction are generally permanent.
As shown in Figure 6f, the forest losses in the UAMRYR had significant regional differences. The forest losses around the metropolitan areas of the CZTMA, WMA, and NMA were 192.81 km2, 183.52 km2, and 100.57 km2, respectively, accounting for 62% of the total forest loss of the UAMRYR. The forest losses in the 18 cities outside the three metropolitan areas reached 242.31 km2, accounting for 32% of the total forest loss in the UAMRYR. There were more than 200 scattered coordinate systems between the metropolitan areas and cities. The total forest loss in 90% of the scattered coordinate system was less than 0.50 km2, and in about 10% of them it was 0.50–2.21 km2. The sum of the total forest loss in scattered coordinate systems was 48.11 km2, accounting for 6% of the total forest loss in the UAMRYR. These values suggest that the spatial distribution of forest loss in the region directly corresponds to the development of metropolitan areas and cities. Around large-scale and fast-growing cities or metropolitan areas, forest loss is rapid and severe.

3.3. Analysis of Forest Loss in Important Areas

Using the calculation method of subordination, the coordinate systems in the UAMRYR were evaluated and grouped into classes, as shown in Figure 7. Three were categorized as primary coordinate systems within the three metropolitan areas of the CZTMA, WMA, and NMA. These areas have the most concentrated and severe forest loss in the entire UAMRYR and significantly impact the surrounding areas. Eighteen were secondary coordinate systems in the cities of Xiangyang, Jingmen, Yichang, Jingzhou, Yueyang, Yiyang Loudi, Hengyang, Changde Yichun, Pingxiang, Xinyu, Ji’an, Fuzhou, Yingtan, Jiujiang, Jingdezhen, and Shangrao. While their degree and influence range of forest loss was less than that of the primary coordinate system, they had a particular effect on nearby areas. In addition, there were 329 tertiary coordinate systems and 442 quaternary coordinate systems, both having far less influence and scope than the primary and secondary coordinate systems and most belonging to the coordinate systems in the first two levels.
The total forest loss and forest losses caused by four reasons in primary and secondary coordinate systems were calculated. The curves of forest loss for the metropolitan areas and cities were generated, as shown in Figure 8 and Figure 9, respectively.
As shown in Figure 8, the three metropolitan areas had similar forest loss trends, increasing gradually in 1990–2000, then accelerating in 2000–2010, and peaking in 2010–2015, before slightly decreasing in 2015–2020. The total forest loss in the CZTMA was the largest, reaching 48.14 km2 in 2010–2015. Forest loss in the WMA was slightly lower than in the CZTMA, totaling 44.28 km2 at its peak period. The total forest loss in the NMA was significantly less than the other two, totaling 23.78 km2 at its peak period. In terms of the composition of gross forest loss, there was little difference among the metropolitan areas. Forest loss due to construction constituted 61%, logging comprised 18%, fire made up 18%, and pollution comprised 3%. The proportion of forest losses due to logging and fire was relatively high during 1990–2010 and decreased significantly in 2010–2020. Fire-induced forest loss accounted for only 14% in 2015–2020, while the share of logging was stable at 18%. Construction accounted for 45%–50% in 1990–2000, increased to 60% in 2000–2010, and reached more than 65% in 2010–2020. Among the three, the share of construction-related forest loss was highest in the CZTMA, reaching about 68% in 2010–2020. With little change, the share of pollution-related forest loss was about 3% each year in the three metropolitan areas. In terms of afforestation, there was little difference between the CZTMA and WMA, which was about 10 km2 in 1990–1995, gradually increasing and stabilizing at 17%–18% in 2010–2020. The urban built-up area in WMA increased by 1034.35 km2 in 1990–2020, much larger than the 573.17 km2 increase in the CZTMA, while its total forest loss was slightly lower than in the CZTMA. This is mainly because the periphery of the WMA was mainly farmlands, waters, and wetlands, while the periphery of the CZTMA was mainly large forest lands, which are difficult to avoid being converted into construction spaces. The afforestation in NMA was less than the other two, which was 5 km2 in 1990–1995 and less than 10 km2 in 2015–2020.
As shown in Figure 9 and Table S1, the total forest losses in the 18 cities varied considerably, while the general trends were similar. The forest losses gradually increased in 1990–2000, accelerating in 2000–2010, peaking in 2010–2015, and maintaining the level or slightly decreasing in 2015–2020. Xiangyang had the highest total forest loss, reaching 8.13 km2 in the peak period, i.e., 2010–2015, significantly higher than other cities, and is classified as first level. Total forest losses in Jingmen, Yichang, Yichun, Yingtan, Jingdezhen, and Shangrao were relatively high, reaching 5.79–6.50 km2 in the peak period, and are classified as second level. Total forest losses in Jingzhou, Yueyang, Loudi, Hengyang, Pingxiang, Ji’an, Fuzhou, and Jiujiang were relatively low, reaching 3.97–5.27 km2 at the peak period, and are classified as third level. Changde, Yiyang, and Xinyu had the lowest total forest losses, reaching 1.44–3.31 km2 in the peak period, and are classified as fourth level. In terms of the causes of forest loss, forest losses due to construction, logging, fire, and pollution have similar proportions in most cities, at about 60%, 12%, 24%, and 4%, respectively. The share of fire in Hengyang, Yingtan, Jingdezhen, and Shangrao was slightly higher than in other cities, at 16%–18%. The proportion of pollution in Pingxiang, Yiyang, and Changde was higher than in other cities, at 8%. The construction proportion of Xiangyang, Yichang, and Yichun was slightly higher than in other cities, at 62%.
The difference in total forest loss among 18 cities in 1990–1995 was not obvious, but the gap had since widened, particularly in 2010–2015, with the disparity between the highest and lowest cities reaching 300%. Compared with urban expansion and the original forest distribution, the total forest loss in most cities was directly proportional to the speed of urban expansion. There were also special cases observed. Because of the few forests around Changde and Jiujiang, the city’s built-up areas expanded rapidly, while total forest loss remained low. Yingtan and Jingdezhen had large forests surrounding the city, so the expansion of urban built-up areas was relatively slow, while the total forest loss was high.

4. Discussion

4.1. Analysis of Characteristics and Mechanism of Forest Loss in the UAMRYR

First, forest losses in the UAMRYR underwent three stages: continuous acceleration (1990–2010), peak (2010–2015), and slight decline (2015–2020). Forest loss caused by urban construction accounted for 60.57% of the gross forest loss. More than 96% of the forest loss caused by urban construction was not restored by afforestation, accounting for 90% of the permanent forest loss in the UAMRYR for 1990–2020.
Second, the three metropolitan areas played important roles in the loss of forests in the UAMRYR. From 1990 to 2020, the total forest losses in the three metropolitan areas accounted for 62.15%, twice that of the other 18 cities, and exhibited a pronounced rapid growth trend. This suggests that the expansion of the metropolitan areas is the primary reason for the spatial forest loss in the UAMRYR. Given that the three metropolitan areas are located along the Yangtze River, Dongting Lake, and Poyang Lake, if forest lands continued declining following current trends, significant soil degradation would occur and degrade the environment in the middle and lower reaches of the Yangtze River [69].
Third, forest losses caused by fire, logging, and pollution should not be ignored. From 1990 to 2020, more than 80% of the forest losses caused by fire, logging, pollution in UAMRYR were restored by afforestation, resulting in minimal permanent forest losses. Fire-induced forest loss has been declining since 2005–2010, indicating the success in forest fire prevention in the UAMRYR. Twenty-two percent of the areas experienced repeated fire, suggesting the prevalence of the hidden dangers of forest fires. Forest loss due to logging has been relatively stable since 2005–2010. Due to the current policies and standards delineating economic forests and protected forests and various measures prohibiting deforestation in the region, significant forest losses due to logging are less likely to occur in the UAMRYR. The total amount and proportion of forest loss caused by pollution were extremely low, but one-third of the loss area had not been restored. Because of the high costs of afforestation in polluted areas, the destructive mining and polluting industry must be controlled from the source [70].
Fourth, while the afforestation measures in the UAMRYR have yielded remarkable results, they have failed to slow down the trend of forest loss. From 1990 to 2020, newly added afforestation areas in the UAMRYR reached 487.61 km2, equivalent to 38.86% of gross forest loss. Construction is the primary cause of forest loss in the UAMRYR, and forest loss caused by construction is difficult to recover through afforestation. Therefore, when the urban expansion is not effectively controlled, the forest loss rate of the UAMRYR will not be significantly reduced.

4.2. Countermeasures to Curb Forest Loss

First, urban expansion should be planned more judiciously. As China’s second-largest urban agglomeration, the UAMRYR’s urban expansion can be particularly challenging to manage. The expansion of urban built-up areas should be guided from the perspective of spatial planning. The annual construction land index and main development directions should be controlled effectively. The forest-related ecological protection zones and prohibited development zones must be delimited as soon as possible and strictly protected. At the same time, cities should be gradually transformed from export-oriented expansion to connotative development and replace part of urban expansion with urban renewal to reduce the destruction of forests [71].
Second, new urban areas and urban renewal projects must be equipped with afforestation areas. For instance, new urban areas and urban renewal projects must set up centralized green spaces equivalent to 25% and 20% of their area as forest protection or afforestation areas to reduce the impact of urban development on forests [72].
Third, the hidden hazards of forest fire need to be further eliminated. The regional forest fire hazards should be comprehensively evaluated according to factors such as perennial temperature and humidity, vegetation density and human activities. There should be a focus on areas where more than two fires have occurred. The use of big data, thermal imaging, low altitude scanning, and other technologies should be explored to help dynamically monitor forest fires [73].
Fourth, efforts should be made to control and restore forest losses caused by pollution. Any new industrial and mining project must undergo a rigorous environmental assessment. The ecological reconstruction of wastelands caused by pollution can be carried out using the topsoil conversion method, guest soil cover method, soil property improvement, and pioneer plant community cover. Chemical passivation, redox, and bioremediation methods are used for the ecological restoration of wastelands caused by pollution [74]. Additionally, through subsequent afforestation efforts, the forest loss caused by pollution can be restored gradually.

4.3. Deficiencies and Future Research Directions

The main shortcomings of this paper are as follows. First, the forest types were not adequately explored due to the relatively large research scope and limitations on existing research conditions. This means that the analyses were not able to fully consider ecological value differences between primitive forest and artificial forest, coniferous forest and broad-leaved forest, arbor forest, and shrub. Second, only the external factors of fire, logging, construction, pollution, and afforestation were used to evaluate the loss and restoration of forest areas. Internal factors of forest growth, breeding, and degradation were not sufficiently explored.
For future research directions, the ecological value of different forest types can be evaluated and applied to quantify the impact of forest loss on the ecological environment more accurately. Additionally, the phenomena and causes of forest natural growth and degradation can be further investigated and the mechanism of forest loss can be analyzed from both internal and external aspects.

5. Conclusions

This paper investigated forest loss in the UAMRYR from 1990 to 2020 and analyzed the spatiotemporal characteristics of forest loss and the dynamic mechanism of forest losses caused by fire, logging, construction, and pollution. Urban construction and expansion brought about by rapid urbanization is the main cause of forest loss in the UAMRYR. The three metropolitan areas (i.e., the CTZMA, WMA, and NMA) exhibited the fastest urban expansion and the most severe forest losses. Most of the forest losses caused by fire and logging have been recovered due to the region’s successful afforestation efforts. Forest loss caused by urban construction does not easily recover and is more permanent. Based on the current development trend, urban expansion in the UAMRYR has slightly decelerated but maintains a particular growth rate. In the future, urban growth may encroach into more forests and cause serious losses to the ecological environment of the middle and lower reaches of the Yangtze River. Hidden dangers such as fire and pollution should not be overlooked. Total forest loss can be considerably reduced by guiding the rational expansion of cities, supporting afforestation for urban construction projects, strengthening forest fire risk management, and implementing forest restoration in polluted areas.

Supplementary Materials

The following are available online at https://www.mdpi.com/article/10.3390/f12091242/s1, Table S1. Forest loss of 18 cities in 6 periods during 1990–2020 (km2).

Author Contributions

Methodology, software, validation, formal analysis, data curation, writing original draft, visualization, Z.Z.; conceptualization, investigation, resources, supervision X.Z. All authors have read and agreed to the published version of the manuscript.

Funding

This research was funded by the Youth Program of the National Social Science Foundation of China: study on spatial structure evolution mechanism and model optimization of urban agglomeration in the middle reaches of Yangtze River Based on dynamic simulation analysis, grant number 19CJL026.

Data Availability Statement

The data used in the paper mainly come from four websites: National Platform for Common Geospatial Information Services (NPCGIS, https://map.tianditu.gov.cn/, accessed on 15 May 2021); Globeland 30 website published by Ministry of Natural Resource of the PRC (http://www.globallandcover.com, accessed on 18 May 2021); European Space Agency website (http://www.esa-landcover-cci.org/, accessed on 18 May 2021); Software of Google Earth Pro (version: 7.3.3).

Conflicts of Interest

The authors declare no conflict of interest.

References

  1. Chen, H.; Zeng, Z.; Wu, J.; Peng, L.; Lakshmi, V.; Yang, H.; Liu, J. Large Uncertainty on Forest Area Change in the Early 21st Century among Widely Used Global Land Cover Datasets. Remote Sens. 2020, 12, 3502. [Google Scholar] [CrossRef]
  2. Nepal, P.; Korhonen, J.; Prestemon, J.P.; Cubbage, F.W. Projecting Global and Regional Forest Area under the Shared Socioeconomic Pathways Using an Updated Environmental Kuznets Curve Model. Forests 2019, 10, 387. [Google Scholar] [CrossRef] [Green Version]
  3. Cai, X.; Zhang, B.; Lyu, J. Endogenous Transmission Mechanism and Spatial Effect of Forest Ecological Security in China. Forests 2021, 12, 508. [Google Scholar] [CrossRef]
  4. Zhou, W.; Zhang, S.; Yu, W.; Wang, J.; Wang, W. Effects of Urban Expansion on Forest Loss and Fragmentation in Six Megaregions, China. Remote Sens. 2017, 9, 991. [Google Scholar] [CrossRef] [Green Version]
  5. Wang, J.; Xin, L.; Tan, M.; Wang, Y. Spatial Heterogeneity in Chinese Forest Area Change in the Early 21st Century. Forests 2016, 7, 232. [Google Scholar] [CrossRef] [Green Version]
  6. Chen, X.; Li, F.; Li, X.; Hu, Y.; Hu, P. Quantifying the Compound Factors of Forest Land Changes in the Pearl River Delta, China. Remote Sens. 2021, 13, 1911. [Google Scholar] [CrossRef]
  7. Hill, A.; Mandallaz, D.; Langshausen, J. A Double-Sampling Extension of the German National Forest Inventory for Design-Based Small Area Estimation on Forest District Levels. Remote Sens. 2018, 10, 1052. [Google Scholar] [CrossRef] [Green Version]
  8. Mellor, A.; Haywood, A.; Stone, C.; Jones, S. The Performance of Random Forests in an Operational Setting for Large Area Sclerophyll Forest Classification. Remote Sens. 2013, 5, 2838–2856. [Google Scholar] [CrossRef] [Green Version]
  9. Schleeweis, K.G.; Moisen, G.G.; Schroeder, T.A.; Toney, C.; Freeman, E.A.; Goward, S.N.; Dungan, J.L. US National Maps Attributing Forest Change: 1986–2010. Forests 2020, 11, 653. [Google Scholar] [CrossRef]
  10. Adrianto, H.A.; Spracklen, D.V.; Arnold, S.R. Relationship Between Fire and Forest Cover Loss in Riau Province, Indonesia Between 2001 and 2012. Forests 2019, 10, 889. [Google Scholar] [CrossRef] [Green Version]
  11. Nolan, R.H.; Blackman, C.J.; de Dios, V.R.; Choat, B.; Medlyn, B.E.; Li, X.; Boer, M.M. Linking Forest Flammability and Plant Vulnerability to Drought. Forests 2020, 11, 779. [Google Scholar] [CrossRef]
  12. St. Peter, J.; Anderson, C.; Drake, J.; Medley, P. Spatially Quantifying Forest Loss at Landscape-scale Following a Major Storm Event. Remote Sens. 2020, 12, 1138. [Google Scholar] [CrossRef] [Green Version]
  13. de Bem, P.P.; de Carvalho Junior, O.A.; Fontes Guimarães, R.; Trancoso Gomes, R.A. Change Detection of Deforestation in the Brazilian Amazon Using Landsat Data and Convolutional Neural Networks. Remote Sens. 2020, 12, 901. [Google Scholar] [CrossRef] [Green Version]
  14. Min, K.-D.; Lee, J.-Y.; So, Y.; Cho, S.-I. Deforestation Increases the Risk of Scrub Typhus in Korea. Int. J. Environ. Res. Public Health 2019, 16, 1518. [Google Scholar] [CrossRef] [Green Version]
  15. Wang, C.; Myint, S.W. Environmental Concerns of Deforestation in Myanmar 2001–2010. Remote Sens. 2016, 8, 728. [Google Scholar] [CrossRef] [Green Version]
  16. Urgilez-Clavijo, A.; Rivas-Tabares, D.A.; Martín-Sotoca, J.J.; Tarquis Alfonso, A.M. Local Fractal Connections to Characterize the Spatial Processes of Deforestation in the Ecuadorian Amazon. Entropy 2021, 23, 748. [Google Scholar] [CrossRef] [PubMed]
  17. Assis, T.O.; Escada, M.I.S.; Amaral, S. Effects of Deforestation over the Cerrado Landscape: A Study in the Bahia Frontier. Land 2021, 10, 352. [Google Scholar] [CrossRef]
  18. Rijal, S.; Barkey, R.A.; Nasri, N.; Nursaputra, M. Profile, Level of Vulnerability and Spatial Pattern of Deforestation in Sulawesi Period of 1990 to 2018. Forests 2019, 10, 191. [Google Scholar] [CrossRef] [Green Version]
  19. Tabor, K.; Hewson, J.; Tien, H.; González-Roglich, M.; Hole, D.; Williams, J.W. Tropical Protected Areas Under Increasing Threats from Climate Change and Deforestation. Land 2018, 7, 90. [Google Scholar] [CrossRef] [Green Version]
  20. Ullah, S.; Noor, R.S.; Abid, A.; Kashinda, R.M.; Waqas, M.M.; Shah, A.N.; Tian, G. Socio-Economic Impacts of Livelihood from Fuelwood and Timber Consumption on the Sustainability of Forest Environment: Evidence from Basho Valley, Baltistan, Pakistan. Agriculture 2021, 11, 596. [Google Scholar] [CrossRef]
  21. Wang, J.; Bai, X.; Liu, F.; Zhang, J.; Chen, F.; Lu, Q. Enrichments of Cadmium and Arsenic and Their Effects on the Karst Forest Area. Int. J. Environ. Res. Public Health 2019, 16, 4665. [Google Scholar] [CrossRef] [Green Version]
  22. Hambuckers, A.; Trolliet, F.; Simon, A.; Cazetta, E.; Rocha-Santos, L. Seed Removal Rates in Forest Remnants Respond to Forest Loss at the Landscape Scale. Forests 2020, 11, 1144. [Google Scholar] [CrossRef]
  23. Ranagalage, M.; Gunarathna, M.H.J.P.; Surasinghe, T.D.; Dissanayake, D.; Simwanda, M.; Murayama, Y.; Sathurusinghe, A. Multi-Decadal Forest-Cover Dynamics in the Tropical Realm: Past Trends and Policy Insights for Forest Conservation in Dry Zone of Sri Lanka. Forests 2020, 11, 836. [Google Scholar] [CrossRef]
  24. Juniyanti, L.; Purnomo, H.; Kartodihardjo, H.; Prasetyo, L.B. Understanding the Driving Forces and Actors of Land Change Due to Forestry and Agricultural Practices in Sumatra and Kalimantan: A Systematic Review. Land 2021, 10, 463. [Google Scholar] [CrossRef]
  25. Kouassi, J.-L.; Gyau, A.; Diby, L.; Bene, Y.; Kouamé, C. Assessing Land Use and Land Cover Change and Farmers’ Perceptions of Deforestation and Land Degradation in South-West Côte d’Ivoire, West Africa. Land 2021, 10, 429. [Google Scholar] [CrossRef]
  26. Santoro, A.; Venturi, M.; Piras, F.; Fiore, B.; Corrieri, F.; Agnoletti, M. Forest Area Changes in Cinque Terre National Park in the Last 80 Years. Consequences on Landslides and Forest Fire Risks. Land 2021, 10, 293. [Google Scholar] [CrossRef]
  27. Gao, Y.; Solórzano, J.V.; Quevedo, A.; Loya-Carrillo, J.O. How BFAST Trend and Seasonal Model Components Affect Disturbance Detection in Tropical Dry Forest and Temperate Forest. Remote Sens. 2021, 13, 2033. [Google Scholar] [CrossRef]
  28. Wang, M.; Li, J.; Kuang, S.; He, Y.; Chen, G.; Huang, Y.; Łowicki, D. Plant Diversity Along the Urban–Rural Gradient and Its Relationship with Urbanization Degree in Shanghai, China. Forests 2020, 11, 171. [Google Scholar] [CrossRef] [Green Version]
  29. Zhao, X.; Pu, J.; Wang, X.; Chen, J.; Yang, L.E.; Gu, Z. Land-Use Spatio-Temporal Change and Its Driving Factors in an Artificial Forest Area in Southwest China. Sustainability 2018, 10, 4066. [Google Scholar] [CrossRef] [Green Version]
  30. Yao, Y.; Liang, S.; Cheng, J.; Lin, Y.; Jia, K.; Liu, M. Impacts of Deforestation and Climate Variability on Terrestrial Evapotranspiration in Subarctic China. Forests 2014, 5, 2542–2560. [Google Scholar] [CrossRef] [Green Version]
  31. Tanioka, Y.; Cai, Y.; Ida, H.; Hirota, M. A Spatial Relationship between Canopy and Understory Leaf Area Index in an Old-Growth Cool-Temperate Deciduous Forest. Forests 2020, 11, 1037. [Google Scholar] [CrossRef]
  32. Gu, C.; Kesteloot, C.; Cook, I.G. Theorising Chinese urbanisation: A multi-layered perspective. Urban Stud. 2014, 52, 2564–2580. [Google Scholar] [CrossRef] [Green Version]
  33. Wang, Z.; Cao, J.; Yang, H. Multi-Time Scale Evaluation of Forest Water Conservation Function in the Semiarid Mountains Area. Forests 2021, 12, 116. [Google Scholar] [CrossRef]
  34. Tao, H.; Nan, Y.; Liu, Z.-F. Spatiotemporal Patterns of Forest in the Transnational Area of Changbai Mountain from 1977 to 2015: A Comparative Analysis of the Chinese and DPRK Sub-Regions. Sustainability 2017, 9, 1054. [Google Scholar] [CrossRef] [Green Version]
  35. Molinario, G.; Hansen, M.; Potapov, P.; Tyukavina, A.; Stehman, S. Contextualizing Landscape-Scale Forest Cover Loss in the Democratic Republic of Congo (DRC) between 2000 and 2015. Land 2020, 9, 23. [Google Scholar] [CrossRef] [Green Version]
  36. Riitters, K.; Schleeweis, K.; Costanza, J. Forest Area Change in the Shifting Landscape Mosaic of the Continental United States from 2001 to 2016. Land 2020, 9, 417. [Google Scholar] [CrossRef]
  37. Slattery, Z.; Fenner, R. Spatial Analysis of the Drivers, Characteristics, and Effects of Forest Fragmentation. Sustainability 2021, 13, 3246. [Google Scholar] [CrossRef]
  38. Pang, C.; Yu, H.; He, J.; Xu, J. Deforestation and Changes in Landscape Patterns from 1979 to 2006 in Suan County, DPR Korea. Forests 2013, 4, 968–983. [Google Scholar] [CrossRef] [Green Version]
  39. Voight, C.; Hernandez-Aguilar, K.; Gutierrez, S.; Garcia, C. Utilizing GIS and Remote Sensing to Inform Spatial Conservation Planning: Assessing Vulnerability to Future Tropical Forest Loss in Southern Belize. Proceedings 2018, 2, 5150. [Google Scholar] [CrossRef] [Green Version]
  40. Giree, N.; Stehman, S.; Potapov, P.; Hansen, M. A Sample-Based Forest Monitoring Strategy Using Landsat, AVHRR and MODIS Data to Estimate Gross Forest Cover Loss in Malaysia between 1990 and 2005. Remote Sens. 2013, 5, 1842–1855. [Google Scholar] [CrossRef] [Green Version]
  41. Chen, W.; Yin, H.; Moriya, K.; Sakai, T.; Cao, C. Retrieval and Comparison of Forest Leaf Area Index Based on Remote Sensing Data from AVNIR-2, Landsat-5 TM, MODIS, and PALSAR Sensors. ISPRS Int. J. Geo-Inf. 2017, 6, 179. [Google Scholar] [CrossRef] [Green Version]
  42. Moisen, G.G.; McConville, K.S.; Schroeder, T.A.; Healey, S.P.; Finco, M.V.; Frescino, T.S. Estimating Land Use and Land Cover Change in North Central Georgia: Can Remote Sensing Observations Augment Traditional Forest Inventory Data? Forests 2020, 11, 856. [Google Scholar] [CrossRef]
  43. Rosa, I.; Rentsch, D.; Hopcraft, J. Evaluating Forest Protection Strategies: A Comparison of Land-Use Systems to Preventing Forest Loss in Tanzania. Sustainability 2018, 10, 4476. [Google Scholar] [CrossRef]
  44. Yamada, Y.; Ohkubo, T.; Shimizu, K. Causal Analysis of Accuracy Obtained Using High-Resolution Global Forest Change Data to Identify Forest Loss in Small Forest Plots. Remote Sens. 2020, 12, 2489. [Google Scholar] [CrossRef]
  45. García-Lázaro, J.R.; Moreno-Ruiz, J.A.; Riaño, D.; Arbelo, M. Estimation of Burned Area in the Northeastern Siberian Boreal Forest from a Long-Term Data Record (LTDR) 1982–2015 Time Series. Remote Sens. 2018, 10, 940. [Google Scholar] [CrossRef] [Green Version]
  46. Ramo, R.; Chuvieco, E. Developing a Random Forest Algorithm for MODIS Global Burned Area Classification. Remote Sens. 2017, 9, 1193. [Google Scholar] [CrossRef] [Green Version]
  47. Khatancharoen, C.; Tsuyuki, S.; Bryanin, S.V.; Sugiura, K.; Seino, T.; Lisovsky, V.V.; Wada, N. Long-Time Interval Satellite Image Analysis on Forest-Cover Changes and Disturbances around Protected Area, Zeya State Nature Reserve, in the Russian Far East. Remote Sens. 2021, 13, 1285. [Google Scholar] [CrossRef]
  48. Mpanda, M.; Kashindye, A.; Aynekulu, E.; Jonas, E.; Rosenstock, T.S.; Giliba, R.A. Forests, Farms, and Fallows: The Dynamics of Tree Cover Transition in the Southern Part of the Uluguru Mountains, Tanzania. Land 2021, 10, 571. [Google Scholar] [CrossRef]
  49. Marshak, C.; Simard, M.; Denbina, M. Monitoring Forest Loss in ALOS/PALSAR Time-Series with Superpixels. Remote Sens. 2019, 11, 556. [Google Scholar] [CrossRef] [Green Version]
  50. Pascu, I.-S.; Dobre, A.-C.; Badea, O.; Tanase, M.A. Retrieval of Forest Structural Parameters from Terrestrial Laser Scanning: A Romanian Case Study. Forests 2020, 11, 392. [Google Scholar] [CrossRef] [Green Version]
  51. Kyere-Boateng, R.; Marek, M.V. Analysis of the Social-Ecological Causes of Deforestation and Forest Degradation in Ghana: Application of the DPSIR Framework. Forests 2021, 12, 409. [Google Scholar] [CrossRef]
  52. Arai, E.; Shimabukuro, Y.E.; Pereira, G.; Vijaykumar, N.L. A Multi-Resolution Multi-Temporal Technique for Detecting and Mapping Deforestation in the Brazilian Amazon Rainforest. Remote Sens. 2011, 3, 1943–1956. [Google Scholar] [CrossRef] [Green Version]
  53. Van Der Laan, C.; Budiman, A.; Verstegen, J.; Dekker, S.; Effendy, W.; Faaij, A.; Verweij, P. Analyses of Land Cover Change Trajectories Leading to Tropical Forest Loss: Illustrated for the West Kutai and Mahakam Ulu Districts, East Kalimantan, Indonesia. Land 2018, 7, 108. [Google Scholar] [CrossRef] [Green Version]
  54. Fang, C.L.; Yu, D.L. Urban agglomeration: An evolving concept of an emerging phenomenon. Landsc. Urban Plan. 2017, 162, 126–136. [Google Scholar] [CrossRef]
  55. Ye, C.; Zhu, J.J.; Li, S.M.; Chen, M.X. Assessment and analysis of regional economic collaborative development within an urban agglomeration: Yangtze River Delta as a case study. Habitat Int. 2019, 83, 20–29. [Google Scholar] [CrossRef]
  56. Xia, C.; Zhang, A.Q.; Wang, H.J. Bidirectional urban flows in rapidly urbanizing metropolitan areas and their macro and micro impacts on urban growth: A case study of the Yangtze River middle reaches megalopolis, China. Land Use Policy 2019, 82, 158–168. [Google Scholar] [CrossRef]
  57. Xie, H.L.; Chen, Q.R.; Lu, F.C. Spatial-temporal disparities, saving potential and influential factors of industrial land use efficiency: A case study in urban agglomeration in the middle reaches of the Yangtze River. Land Use Policy 2018, 75, 518–529. [Google Scholar] [CrossRef]
  58. Tan, R.H.; Liu, Y.L.; Liu, Y.F.; He, Q.S.; Ming, L.C.; Tang, S.H. Urban growth and its determinants across the Wuhan urban agglomeration, central China. Habitat Int. 2014, 44, 268–281. [Google Scholar] [CrossRef]
  59. Tan, R.H.; Zhou, K.; He, Q.; Xu, H. Analyzing the effects of spatial interaction among city clusters on urban growth—Case of Wuhan Urban agglomeration. Sustainability 2016, 8, 759. [Google Scholar] [CrossRef] [Green Version]
  60. Plekhov, D.; VanValkenburgh, P.; Abrams, P.; Cutler, A.; Han, J.; Reátegui Díaz, A.J.; Wernke, S. Linking Past and Present Land-Use Histories in Southern Amazonas, Peru. Remote Sens. 2021, 13, 2274. [Google Scholar] [CrossRef]
  61. Lõhmus, A.; Kont, R.; Runnel, K.; Vaikre, M.; Remm, L. Habitat Models of Focal Species Can Link Ecology and Decision-Making in Sustainable Forest Management. Forests 2020, 11, 721. [Google Scholar] [CrossRef]
  62. Riitters, K.; Potter, K.M.; Iannone, B.V.; Oswalt, C.; Guo, Q.; Fei, S. Exposure of Protected and Unprotected Forest to Plant Invasions in the Eastern United States. Forests 2018, 9, 723. [Google Scholar] [CrossRef] [Green Version]
  63. Bonan, G.B.; Pollard, D.; Thompson, S.L. Effects of Boreal Forest Vegetation on Global Climate. Nature 1992, 359, 716–718. [Google Scholar] [CrossRef]
  64. Khan, I.A.; Khan, W.R.; Ali, A.; Nazre, M. Assessment of Above-Ground Biomass in Pakistan Forest Ecosystem’s Carbon Pool: A Review. Forests 2021, 12, 586. [Google Scholar] [CrossRef]
  65. Robles-Ortega, M.D.; Ortega, L.; Coelho, A.; Feito, F.; de Sousa, A. Automatic Street Surface Modeling for Web-Based Urban Information Systems. J. Urban Plan. Dev. 2013, 139, 40–48. [Google Scholar] [CrossRef]
  66. Wheeler, M.M.; Neill, C.; Groffman, P.M.; Avolio, M.; Bettez, N.; Cavender-Bares, J.; Trammell, T.L.E. Continental-scale homogenization of residential lawn plant communities. Landsc. Urban Plan. 2017, 165, 54–63. [Google Scholar] [CrossRef]
  67. Halarewicz, A.; Pruchniewicz, D.; Kawałko, D. Using Direct and Indirect Methods to Assess Changes in Riparian Habitats. Forests 2021, 12, 504. [Google Scholar] [CrossRef]
  68. Egenolf, V.; Vita, G.; Distelkamp, M.; Schier, F.; Hüfner, R.; Bringezu, S. The Timber Footprint of the German Bioeconomy—State of the Art and Past Development. Sustainability 2021, 13, 3878. [Google Scholar] [CrossRef]
  69. Clémençon, R. The Two Sides of the Paris Climate Agreement. J. Environ. Dev. 2016, 25, 3–24. [Google Scholar] [CrossRef] [Green Version]
  70. Harnesk, D.; Brogaard, S. Social Dynamics of Renewable Energy—How the European Union’s Renewable Energy Directive Triggers Land Pressure in Tanzania. J. Environ. Dev. 2016, 26, 156–185. [Google Scholar] [CrossRef]
  71. Bhattarai, S.; Pant, B.; Laudari, H.K.; Rai, R.K.; Mukul, S.A. Strategic Pathways to Scale up Forest and Landscape Restoration: Insights from Nepal’s Tarai. Sustainability 2021, 13, 5237. [Google Scholar] [CrossRef]
  72. Nago, M.; Ongolo, S. Inside Forest Diplomacy: A Case Study of the Congo Basin under Global Environmental Governance. Forests 2021, 12, 525. [Google Scholar] [CrossRef]
  73. Reiche, J.; Verhoeven, R.; Verbesselt, J.; Hamunyela, E.; Wielaard, N.; Herold, M. Characterizing Tropical Forest Cover Loss Using Dense Sentinel-1 Data and Active Fire Alerts. Remote Sens. 2018, 10, 777. [Google Scholar] [CrossRef] [Green Version]
  74. Singh, P.P.; Chakraborty, T.; Dermann, A.; Dermann, F.; Adhikari, D.; Gurung, P.B.; Saha, S. Assessing Restoration Potential of Fragmented and Degraded Fagaceae Forests in Meghalaya, North-East India. Forests 2020, 11, 1008. [Google Scholar] [CrossRef]
Figure 1. Scope and location of UAMRYR.
Forests 12 01242 g001
Figure 2. Grid system of UAMRYR and the example of grid cell.
Forests 12 01242 g002
Figure 3. Landcover change in UAMRYR (1990–2020).
Forests 12 01242 g003
Figure 4. Reason classification of forest loss: (a) forest loss caused by fire; (b) forest loss caused by logging; (c) forest loss caused by construction; (d) forest loss caused by pollution.
Forests 12 01242 g004
Figure 5. Spatiotemporal loss of forest in UAMRYR: (a) forest loss in 6 periods during 1990–2020; (b) distribution of forest losses caused by various reasons during 1990–2020.
Forests 12 01242 g005
Figure 6. Spatial distribution of forest loss and afforestation: (a) spatial forest loss caused by fire; (b) spatial forest loss caused by logging; (c) spatial forest loss caused by construction; (d) spatial forest loss caused by pollution; (e) spatial forest restoration caused by afforestation; (f) spatial distribution of total forest loss.
Forests 12 01242 g006
Figure 7. Coordinate systems of forest loss.
Forests 12 01242 g007
Figure 8. Forest loss curves of the metropolitan areas: (a) Changsha–Zhuzhou–Xiangtan metropolitan area; (b) Wuhan metropolitan area; (c) Nanchang metropolitan area.
Forests 12 01242 g008
Figure 9. Forest loss curves of 18 cities: (a) Xiangyang; (b) Jingmen; (c) Yichang; (d) Jingzhou; (e) Yueyang; (f) Loudi; (g) Hengyang; (h) Changde; (i) Yiyang; (j) Yichun; (k) Pingxiang; (l) Xinyu; (m) Jian; (n) Fuzhou; (o) Yingtan; (p) Jiujiang; (q) Jingdezhen; (r) Shangrao.
Forests 12 01242 g009
Table 1. Overall analysis of forest loss of UAMRYR (1990–2020).
1990–19951995–20002000–20052005–20102010–20152015–20201990–2020
Forest loss caused by fire (km2)29.7434.0735.1745.1443.1636.64223.92
Forest loss caused by logging (km2)26.3830.6734.5947.3648.2347.96235.19
Forest loss caused by construction (km2)42.1271.82116.62151.67186.38191.41760.02
Forest loss caused by pollution (km2)3.314.575.128.747.956.0835.77
Gross Forest loss (km2)101.55141.13191.50252.91285.72282.091254.90
Forest restoration caused by forestation (km2)58.5364.3880.4392.8496.2295.21487.61
Total forest loss (km2)43.0276.75111.07160.07189.5186.88767.29
Publisher’s Note: MDPI stays neutral with regard to jurisdictional claims in published maps and institutional affiliations.

