Article

Assessment of Two Adjacent Mountainous Riparian Areas along Nestos River Tributaries of Greece

by
George N. Zaimes
1,*,
Valasia Iakovoglou
1,
Dimitrios Syropoulos
2,
Dimitrios Kaltsas
3 and
Dimitrios Avtzis
4
1
UNESCO Chair Con-E-Ect, Department of Forest and Natural Environment Science, International Hellenic University, 1st km Drama-Mikrohoriou, 66100 Drama, Greece
2
Ministry of Rural Development and Food, 65404 Kavala, Greece
3
Researcher, Don Daleziou 45, 38221 Volos, Greece
4
Forest Research Institute, Hellenic Agricultural Organization Demeter, 57006 Thessaloniki, Greece
*
Author to whom correspondence should be addressed.
Forests 2021, 12(9), 1284; https://doi.org/10.3390/f12091284
Submission received: 25 August 2021 / Revised: 9 September 2021 / Accepted: 16 September 2021 / Published: 18 September 2021
(This article belongs to the Special Issue Long-Term Vegetation Dynamics and Forest Landscape Change)

Abstract

:
The riparian areas of the Mediterranean are unique but face many pressures from anthropogenic and climate change impacts. They have very rich and diverse plant communities as a result of the dynamic fluvio-geomorphologic conditions of the Mediterranean streams. In this study, the riparian areas of two adjacent mountainous tributaries (Arkoudorema and Vathirema) of the Nestos River were studied. To assess the condition of riparian areas holistically, diverse measurements are required. This is why fluvio-geomorphologic (in the field and with GIS), vegetation (surveys and visual protocols) and ground-dwelling insect (pitfall traps and indices) measurements were taken along an elevational gradient. The results of all three methodologies draw to similar conclusions, with Vathirema sub-watershed riparian areas being in better condition than Arkoudoreama. This was expected, since Vathirema has less anthropogenic pressures. In addition, the riparian areas in higher elevations were in better condition for the same reason. To implement integrated water resources management plans, fluvio-geomorphologic and biological (e.g., vegetation and insects) datasets are required to provide a holistic view on the watershed and riparian area conditions. For the studied sub-watersheds, we recommend these measurements to continue, to record the current anthropogenic pressures and based on this information to suggest best management practices that will secure long-term sustainability.

1. Introduction

Mediterranean riparian areas have been inhabited for thousands of years [1]. In many cases, these areas were the center of great civilizations. This long-term interaction of riparian areas with humans in the Mediterranean is the reason why anthropogenic disturbances have been as important as natural factors in structuring their plant communities [1]. Most riparian areas are heavily degraded, especially in lowlands, due to river flow regulation, channel alterations, groundwater withdrawal, agricultural activities and urbanization [2,3,4,5]. Few natural riparian ecosystems remain in the Mediterranean, primarily located in mountainous areas with few inhabitants [6].
Riparian areas of the Mediterranean are of greater importance compared to those of mesic regions [7]. They are distinctive because of the region’s climatic, topographic and hydrologic unique conditions [8] along with the frequent occurrence of natural wildfires [9]. The rivers and streams have natural high stream flow variability [10]. In the high elevation areas (precipitation > 1000 mm year−1), the streams have a perennial flow that peaks typically in spring after major rainfall events or snowmelt [11]. In the lowland areas, precipitation is substantially less (200–500 mm year−1), leading to many intermittent or ephemeral streams [11]. These stream types have a highly irregular hydrologic regime with a great amount of water and sediment transported at high velocities in short periods of time, leading to frequent flash floods [12]. The fluvio-geomorphologic conditions of Mediterranean streams influence riparian diversity and functionality, and understanding these conditions is essential to sustainably manage riparian areas [13,14].
The dynamic fluvio-geomorphologic conditions of Mediterranean streams lead to high year to year and interannual fluctuations in riparian plant species numbers and composition that can vary from woody, to shrubby, to herbaceous vegetation and mixtures [15]. This diversity is also spatial, as they have distinguishable gradients because of the more discrete changes in the groundwater level and soil moisture, and different degrees of natural disturbance impact on the riparian areas as you move away from the aquatic ecosystem. Overall, riparian vegetation assemblages experience high colonization rates and desiccation resistance mechanisms, while their life expectancies are relatively short [16,17].
The protection and conservation of riparian areas has become a priority worldwide due their severe degradation [8]. Riparian areas are ecotones (transitions zones) with biophysical gradients as you move from the terrestrial to the aquatic ecosystem [18]. These gradients lead to the many ecosystem services of riparian areas that have and continue to be utilized, mostly unsustainably, by humans.
The increase in temperatures due to climate change has also increased evapotranspiration in rivers in the summer and decreased snow accumulation in the mountains during winter [19,20,21]. This alters the flows of snow-fed mountainous streams of the Mediterranean region. The riverine ecosystem annual stream flow is expected to be reduced, while water temperature and large flood magnitudes are expected to increase and directly impact riparian areas [22,23].
Most Mediterranean riparian areas will be adjacent to intermittent and ephemeral streams due to climate change’s impact [8]. These riparian areas have characteristics different to those adjacent to perennial streams [24,25,26]. Native riparian species are adapted to seasonal peak flows, and this alteration will retard their regeneration, lessen their growth and allow other species to be more competitive and move into the riparian areas (typically invasive species). Finally, longer and more intense droughts might exceed the natural resilience boundaries of native riparian flora and lead to their demise [27,28].
Assessing the condition of riparian areas requires an interdisciplinary approach that measures abiotic and biotic characteristics [28]. Such an approach will evaluate more accurately the impacts of human actions and climate change on the ecological functioning of riparian areas [29]. This is particularly true for the complex Mediterranean riparian areas that require hydro-, geo- and bio-diversity monitoring to suggest best management practices for functional riparian ecosystems [13,30]. In addition, monitoring methods need to be easy-to-use, reliable, inexpensive and efficient [28].
The aim of this study was to assess and compare the condition of riparian areas of two adjacent sub-watersheds of the Nestos River. These two watersheds have different characteristics and anthropogenic pressures but are representative of Mediterranean mountainous sub-watersheds. Many natural mountainous watersheds and, particularly, their riparian areas, including those of this study, have had increased visits due to the mainstreaming of ecotourism [28]. Specifically, hydrological, geomorphological, vegetation and insect parameters were estimated and measured. These parameters were measured with channel characteristics, vegetation surveys, visual protocols and insect collection and estimated with GIS and biodiversity indices. Spatial comparisons (based on elevation) for each watershed were also conducted. This is one of the few studies that has measured and compared the hydrologic, geomorphologic and biodiversity characteristics of mountainous riparian areas of Greece to such an extent.

2. Materials and Methods

2.1. Study Area

Arkoudorema (ADR) and Vathirema (VTR) were the two sub-watersheds of the Nestos Basin that were assessed (Figure 1). Both are within the Rodopi Mountain Range National Park in Northern Greece (Figure 1). The annual precipitation ranges from 600 mm year−1 in the lowlands to 1500 mm year−1 in the mountainous areas [31]. The climate in the lowlands is characterized as Mediterranean, with relatively mild winters and dry, hot summers. It must be noted that these lowlands receive greater amounts of rainfall compared to typical Mediterranean areas. In the mountainous areas, the climate is a transition between Mediterranean and mid-continental climate.
The ADR sub-watershed is primarily mountainous with 6 villages within its boundaries and Paranesti (the largest town in the region) very close. The VTR sub-watershed is one of the most sparsely-populated regions in Greece with 1 village with its boundaries and 4 villages nearby. The road network in the ADR is substantially greater than in VTR. This along with the more inhabitants in ADR than VTR is the reason for more anthropogenic activities. These activities include livestock grazing by local residents along with fishing and hunting. In the last decade, an increase in ecotourism has also been experienced in ADR because of its proximity to Paranesti and more extensive road network. It must be noted that as the elevation of both sub-watersheds increased the distance from villages and town increases, the network become sparser leading to more limited anthropogenic activities. Overall, both watersheds are very scenic and belong to the Natura 2000 Network.
Within each watershed seven sampling stations were established. Emphasis was given to the homogeneous distribution of the stations to cover all elevation ranges, vegetation zones and geomorphologic characteristics. The selection criteria were: (a) complete coverage of the river route from its springs to its outflows, (b) accessibility by the forest road network and (c) recording of all vegetation types. The distribution of sampling stations is depicted in Figure 1b,c. Table 1 indicates the type of measurements taken in each sampling location. We must mote that all type of measurements were not taken in all sampling stations.

2.2. Fluvio-Geomorphologic Measurements

Fluvial geomorphology studies the natural process that shape streams and adjacent landforms to understand how streams interact with the surrounding riparian and terrestrial areas [32]. This study concentrated on parameters that impact stream stability.

2.2.1. Watershed Scale—GIS

The following frequently used fluvio-geomorphologic parameters were estimated for each sub-watershed: area, perimeter, maximum elevation, minimum elevation, mean elevation, maximum slope, minimum slope, mean slope, relief, length, shape and roundness degree; for the stream: total length, drainage density, Shreve stream order, Strahler stream order, ruggedness, relief ratio and relative stream power [33]. All the aforementioned parameters provide insights on hydrologic and erosion processes, especially on the ability of a watershed to transport water and sediment [34]. For example, when the watershed shape is elongated, water transport capacity is slower but stream flow has a more constant response to precipitation events [35]. In contrast, circular watersheds have greater peak flows (less water concentration time to the stream channel). Another example is the maximum and minimum watershed elevation that can provide information on the source of the discharge, e.g., if it is snow-fed or not. The stream flow regime is very different in snow-fed watersheds that have higher discharges typically in spring when the snow melts [11]. Using regional maps from the Geographic Service of the Hellenic Army (scale 1:50,000) that were inserted in GIS, the contour lines, watershed boundaries and stream network were digited, and the abovementioned parameters were estimated.

2.2.2. Field Measurements

Four field measurements were conducted: (a) pebble count, (b) water surface width (WSW), (c) bankfull width (BW) and stream bank slope [36,37]. Stream reaches of the sampling stations were surveyed during summer baseflow conditions. Pebble counts are used to estimate the substrate particle size distribution. Stream bed material can indirectly be indicative of streams functions [36]. During the pebble count, the observer walks across the stream in a zigzag pattern within the stream channel and measures stream bed material [36]. The material was measured (mm) with a gravelometer at the intermediate axis (width). At least 100 particles were measured and classified to size classes according to Wentworth [36]. The bed particle that touched the tip of the observer’s boot as he walks the stream was measured. It must be noted that riffles and pools were sampled at the same proportion.
The edge of the stream water provides the WSW. To measure BW, indicators such as changes in vegetation and the slope of the bank (slope breaks), staining lines on rocks and boulders, deposits of twigs, leaves, pine needles or garbage and the height of depositional features were utilized [33,36]. Both WSW and BW vary with stream size order and elevation [34]. Finally, the stream bank slopes measured were categorized. Specifically, as: 1 when the slope < 20°, 2 when the slope was 20°–45°, 3 when the slope was 46°–75° and 4 when the slope > 75° [37].

2.3. Riparian Vegetation Identification and Evaluation

This was accomplished by surveying the riparian species but also by utilizing visual protocols. Visual protocols are frequently used to assess riparian areas, as they provide accurate and rapid results [28]. Μany protocols have been developed and its selection depends on the aim of the study and the experience of the assessor [28]. In this study, we selected the riparian forest quality (QBR) protocol and riparian forest evaluation (RFV) protocol that have been develop for the Mediterranean region.

2.3.1. Vegetation Species Survey

The vegetation of the riparian and terrestrial zone was recorded along the seven sampling stations of both sub-watersheds. Specifically, 50 m upstream and downstream from the sampling station, the dominant and subdominant tree species and shrubs within the riparian zone were recorded. Dominant trees are the largest that form the stand main canopy. Subdominant are smaller trees found close to dominant ones, with smaller crown size. The riparian zone was determined visually and its width differed from station to station. Additionally, the dominant species from the terrestrial zones were recorded. The terrestrial zone surveyed was along the same 100 m transect of the riparian zone. Specifically, a 15 m wide zone from the edge of the riparian zone of both stream banks was surveyed. The identification of the species was based on national (Greek) flora guides [38,39,40]. Based on these tree and shrub species, the habitat types were also determined [41].

2.3.2. Riparian Forest Quality (QBR) Protocol

The QBR evaluates riparian forest quality based on four criteria [42]: (a) Total riparian vegetation cover (TRC), which assesses the riparian areas interconnectivity with the adjacent terrestrial ecosystems. (b) Cover structure (CST), which assesses tree, shrub and understory plant cover in the riparian area. (c) Quality of the cover (CQU), which assesses the riparian habitat and the native tree species based on the geomorphologic characteristics of the site. There are three geomorphologic categories. (d) Anthropogenic modifications (CHA), which assesses the in-stream channel and bed alterations due to anthropogenic activities. The values that each criterion can received is 0–25. The final value of the protocol is the sum of the four with values from 0–100. The protocol has five quality classes that correspond to those of the Water Framework Directive (WFD) and are: (a) Natural state, with values ≥ 95 that indicate excellent quality. (b) Good, with values 75–90 that indicate good quality with some anthropogenic interventions. (c) Satisfactory, with values 55–70 that indicate fair quality with substantial anthropogenic interventions. (d) Not satisfactory, with values of 30–50 that indicate poor quality and significant anthropogenic disturbances. (e) Bad, with extreme degradation, with values ≤ 25 that indicate bad quality and extreme degradation.

2.3.3. Riparian Forest Evaluation (RFV) Protocol

The RFV protocol [37] complies with the objectives of the WFD. It has great applicability at a broad range of riverine areas, particularly in the Mediterranean [37]. The RFV assess the spatial and temporal continuity of the riparian forest. Spatial connectivity is assessed in its three dimensions, longitudinal, transversal and vertical. The temporal connectivity is assessed by the regeneration capacity. Initially, BW and riparian forest width need to be defined, before implementing the RFV.
Longitudinal connectivity is assessed on both banks along a reach that is 10–14 times the BW. It is determined by the autochthonous tree and shrub cover. Bank stretches with rocky substrates are not considered. Transversal connectivity is assessed along 5–7 channel sections. The length of these sections needs to be equal to the width of the riparian zone. This connectivity is determined by the presence of autochthonous tree, shrub and macrophyte species. In the transversal cross-section, vertical connectivity is also assessed in regard to the tree and understory shrub cover, along with the existence of lianoid and epiphytic species. Non-native species when present indicate severe forest quality degradation. Finally, regeneration capacity is assessed along the reach of the longitudinal connectivity. Emphasis is given to the presence of young trees or samplings. Based on these four parameters each riparian stand is classified as: (a) very good, (b) good, (c) moderate, (d) poor and (e) bad.

2.3.4. Visual Protocols Statistical Analysis

A one-way analysis of variance (ANOVA) was conducted for the QBR and RFV protocols. The level of significance was at 5%. The total and each criteria value of the two protocols were compared between the sub-watersheds The two protocols were also compared among sampling stations with different elevation (stations below and above 450 m) and habitat types.

2.4. Ground-Dwelling Insects

2.4.1. Pitfall Traps

Pitfall traps were used to collect ground-dwelling beetles [43,44]. Studies have shown that these beetles are sensitive to anthropogenic disturbances in riparian areas [16]. The traps were installed in the first week of August 2014. Insects were collected from the traps every 2 weeks in the two studied sub-watersheds until October 15th. The traps were left in situ for 10 weeks. Three sampling stations were chosen in each watershed in areas representative of the riparian forest structure in different elevations (see Table 1). At each station, pitfall traps were installed in three zones, the bankfull, the riparian and the terrestrial. Special effort was given to place traps away from open spaces or paths to avoid edge effects [45]. Pitfall traps consisted of a plastic cup, 10 cm in diameter and 12 cm in depth. They were filled halfway with one part of propylene glycol and three parts of water as a preservative until collection. After the collection, ground insects were conserved in 70% ethanol and were identified to species level according to taxonomic keys in the laboratory [46,47,48].

2.4.2. Population and Diversity Indices

Species composition for each station and zone was estimated based on species identification and the relative abundance. In addition, two different diversity indices were employed. The Simpson index [49] focuses on species dominance, with values from 0 (highest diversity)–1 (lowest diversity) and was estimated for all sampling stations. The Shannon–Wiener index [50] is based on species richness and evenness of the community. When its value is closer to 0, abundance is concentrated on one species. The Shannon–Wiener index was estimated for all stations, each elevation and each microhabitat.

3. Results

3.1. Fluvio-Geomorphologic Parameters

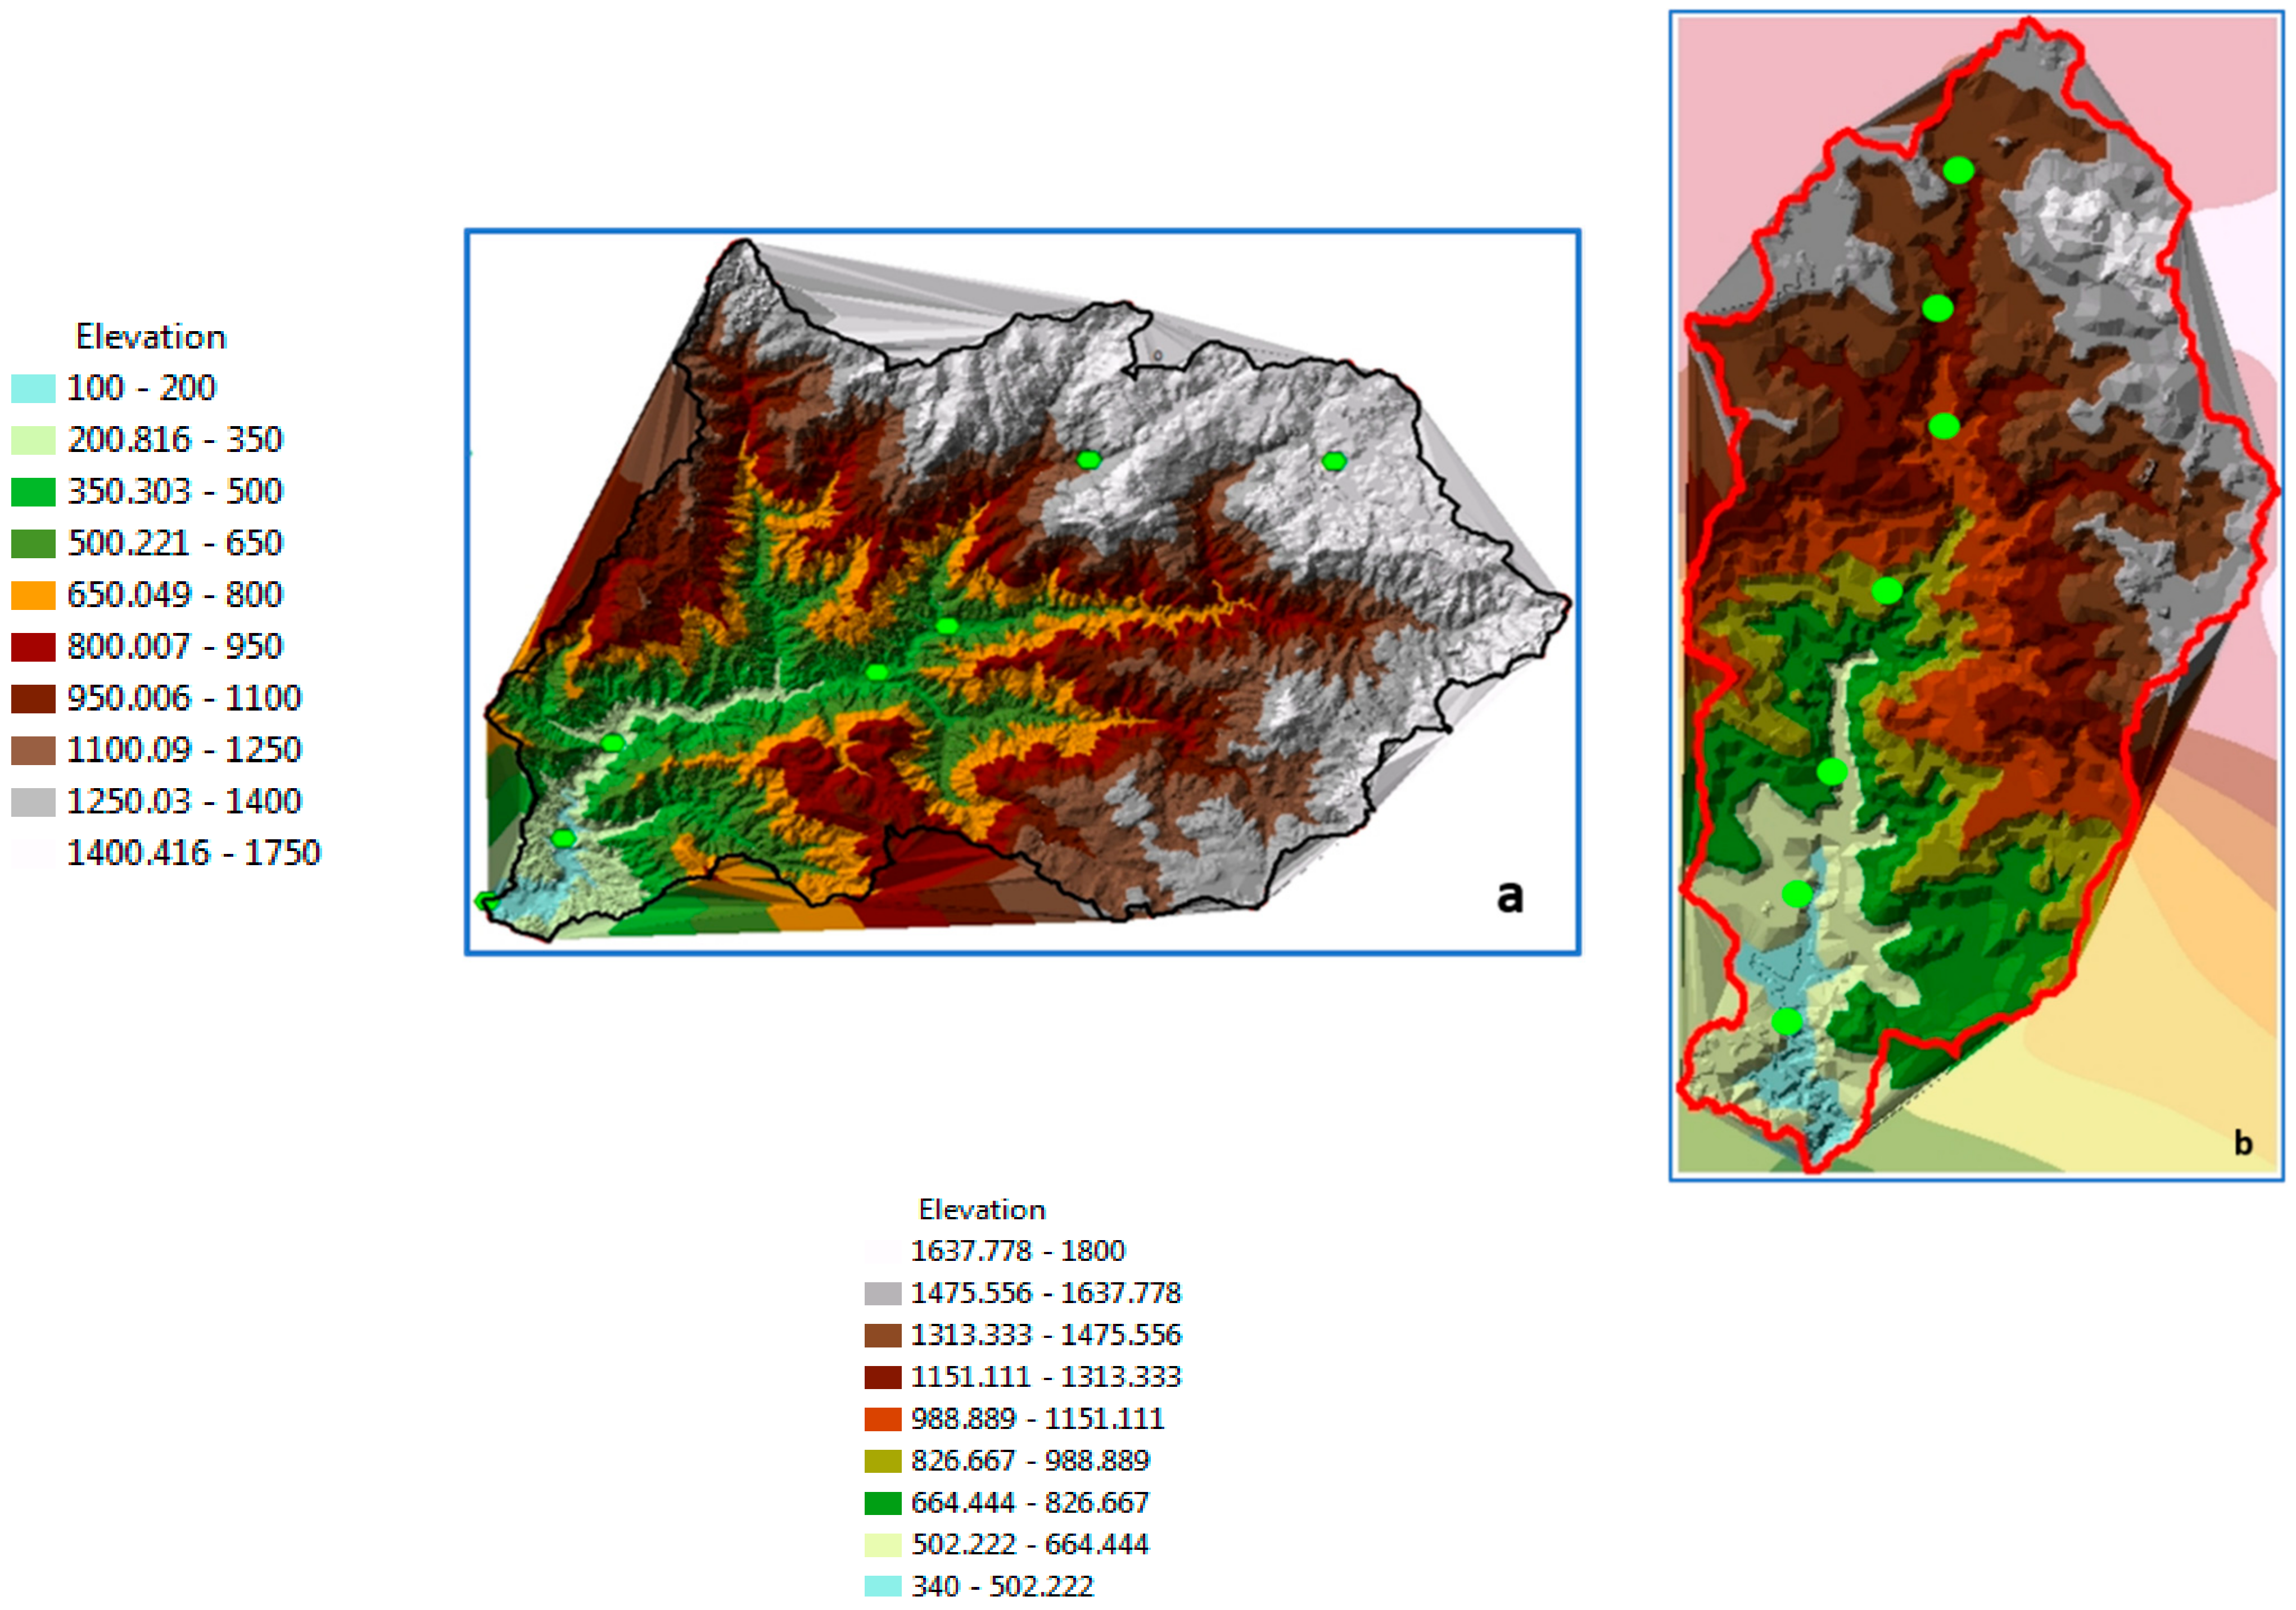
VTR has an elongated shape while ADR is more circular (Figure 1andFigure 2). As ADR also had a larger watershed area than VTR (approximately by 80 km2) (Table 2), it is expected to have greater discharge. In addition, the ADR had greater values of drainage density, relative stream power and ruggedness and higher stream order than the VTR (Table 2). The relief ratio [48] values of the two watersheds were almost the same.
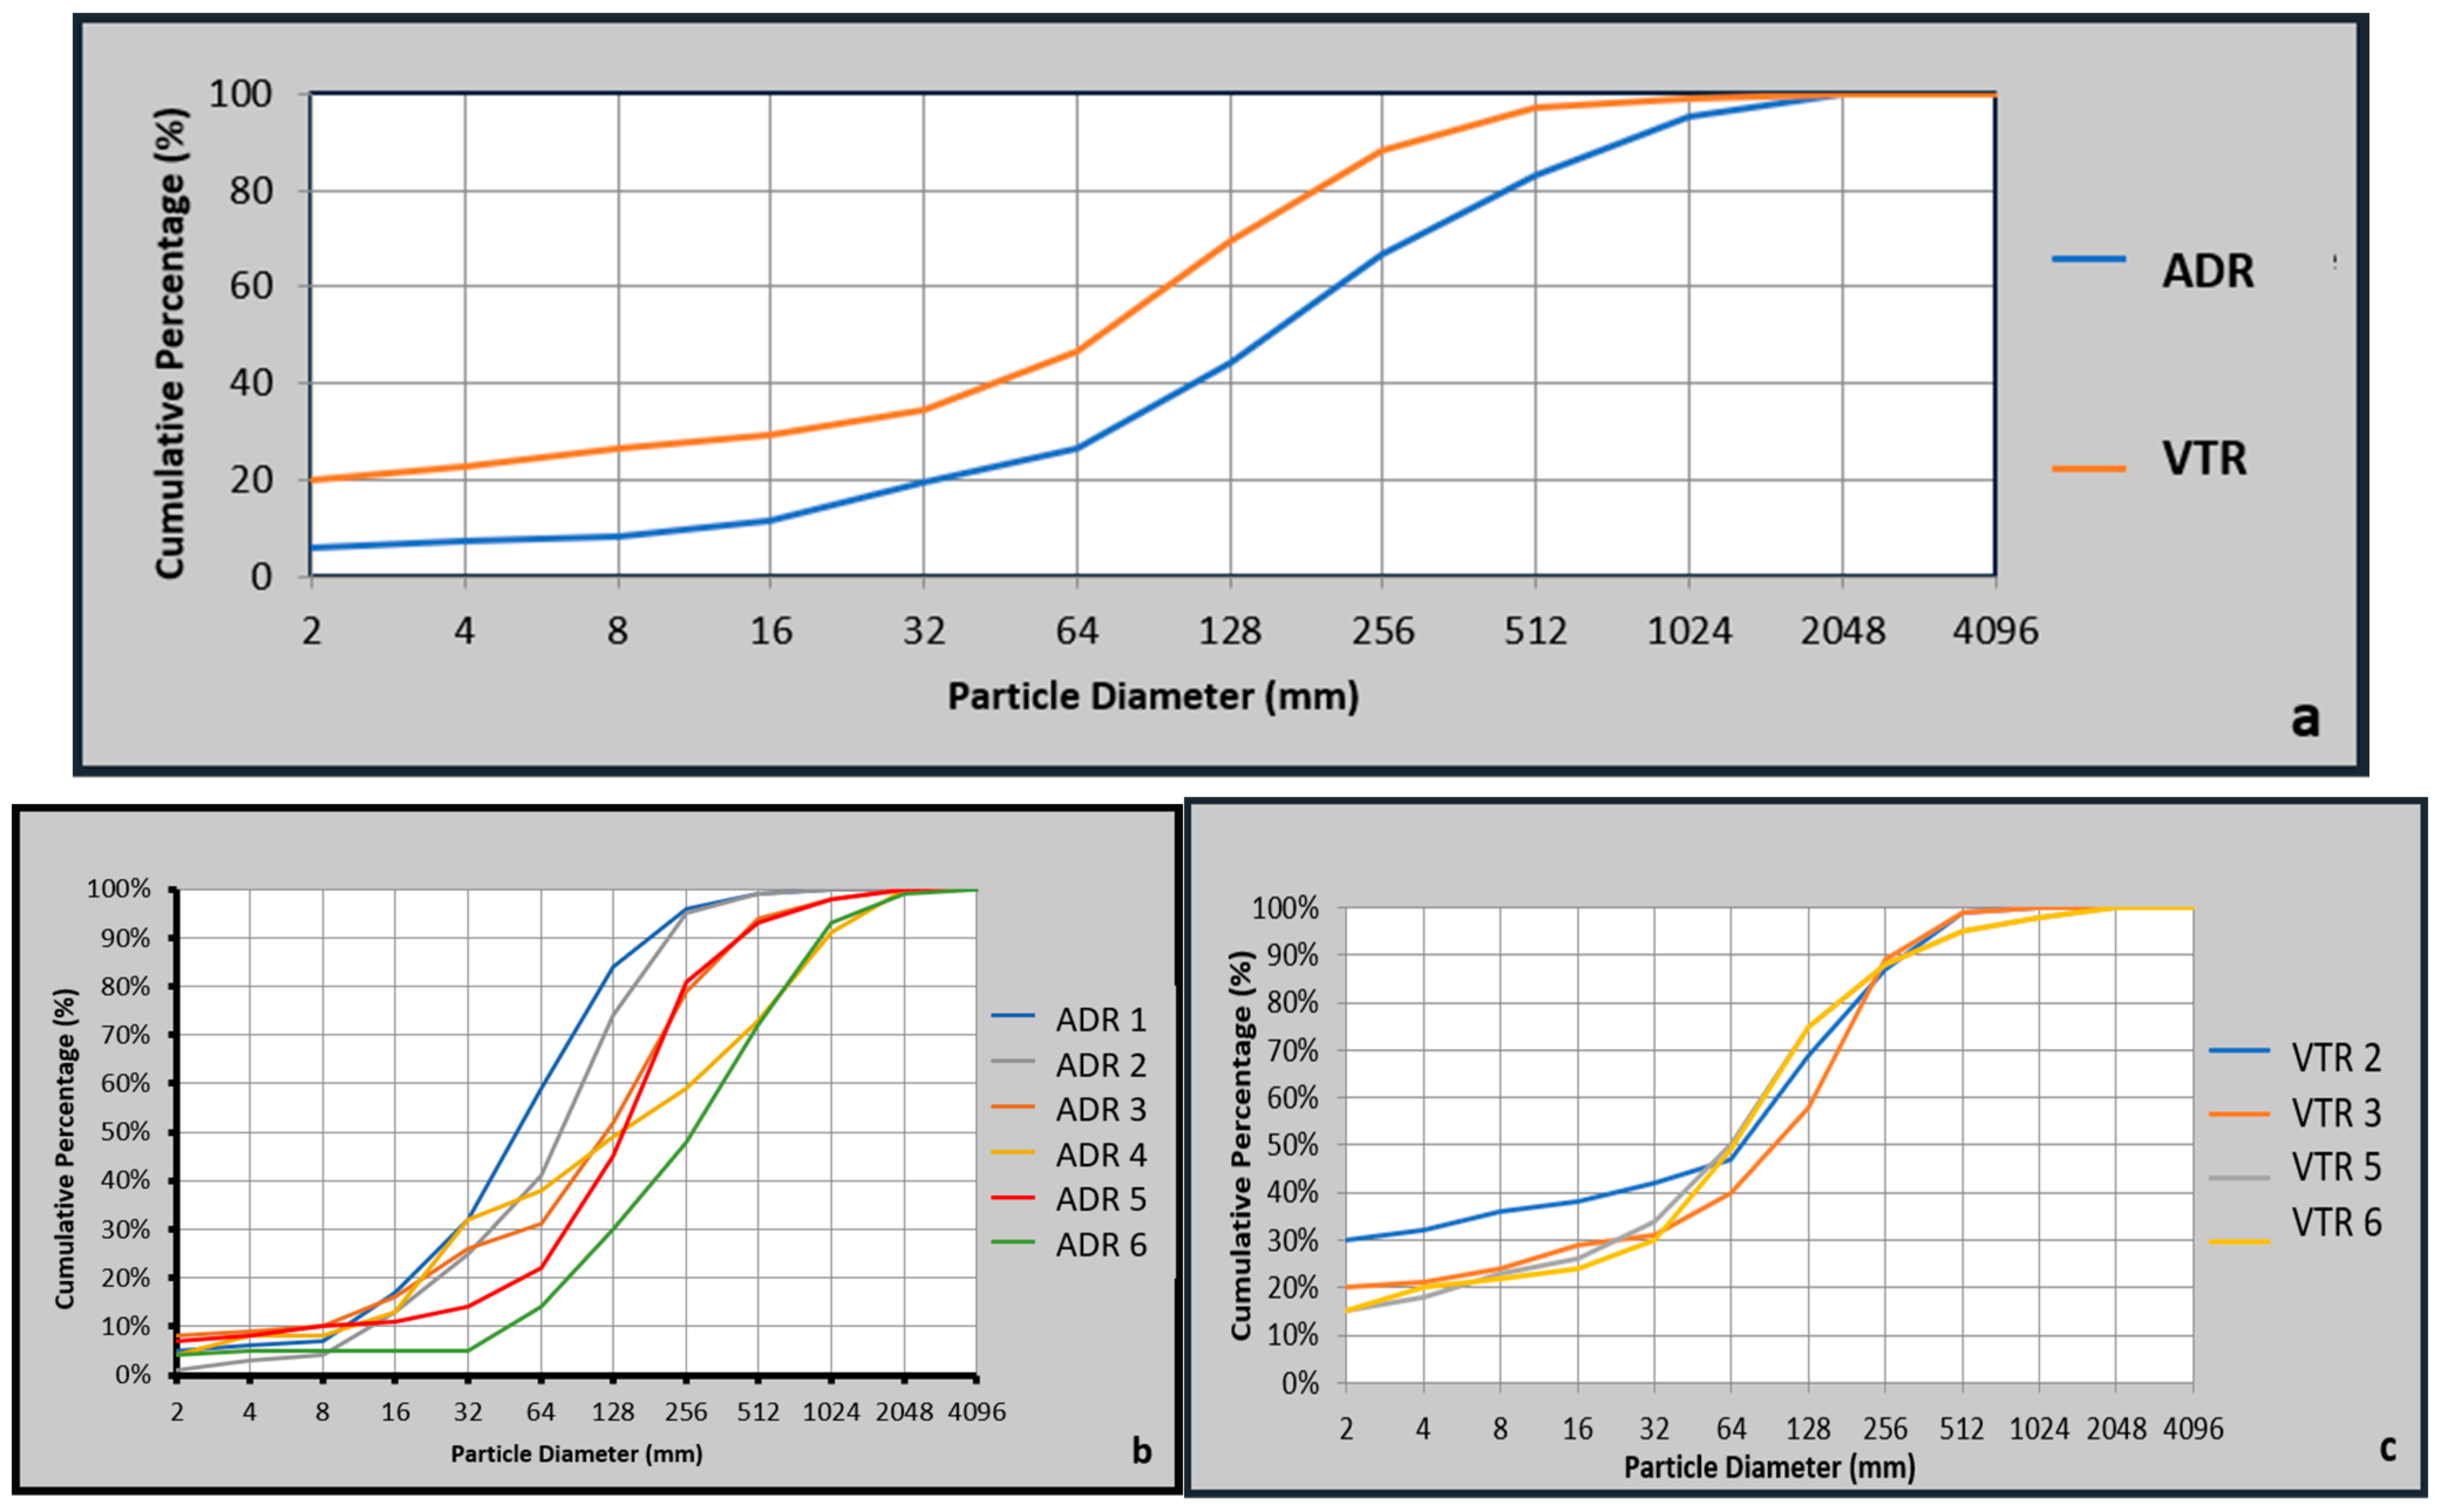
The pebble count particle size cumulative curves are presented in Figure 3a. Four sampling stations of the ADR (3, 4, 5, 6) and four sampling sites of the VTR (2, 3, 5, 6), cumulatively, were compared. The ADR had a greater proportion of coarser (large size) particle material. This is because of the reduced stream power and the decreased slope gradient in the VTR. In addition, the variation of the cumulative curves of the different sampling stations is greater in the ADR that in the VTR (Figure 4b,c).
The WSW decreased as the elevation of the sampling stations increased (Table 3). The ADR WSW are steadily higher than VTR at similar elevations. These findings indicate that the ADR has probably greater discharge magnitudes. BW in most cases had small values with only one station having double digits (Table 3). The stream bank slopes were categorized as either 1, 2 or 3 (Table 3), although most ranged between 46 and 75°.

3.2. Vegetation Identification and Evaluation

Along the ADR stations, elevations ranged from 140–1400 m, while along VTR stations, they ranged from 400 m to 1350 m, so differences in vegetation species and habitat types were expected. The hydrophilic Alnus glutinosa L. was the most dominant species prevailing in four stations in both watersheds (Table 4). Corylus avellana L. was dominant at two stations in VTR and subdominant at three stations in ADR. Salix species and Carpinus betulus L. were also present in many stations. The invasive species Populus × canadensis and Robinia pseudoacacia were recorded at one station at each sub-watershed. At the very high elevation zones, the riparian area was not distinguished with the same species present at the riparian and terrestrial areas. At these high elevations, Fagus sylvatica was the dominant species at one station in each sub-watershed and cold conifers such as Pinus sylvestris L., Picea abies (L.) H.Karst. and Abies borisii-regis Mattf. at two stations at VTR and one station at ADR. Salix and Rubus genera were the most common shrubs.
The most common habitat type was Alno-Pandion, Alnion incanae and Salicion Albae found in eight stations of both watersheds from 400 to 900 m. The habitat type Salix alba and Populus alba galleries was found at one station at the lowest elevation of the ADR (below 150 m). The two non-riparian forest habitats were recorded at the high elevations (above 900 m). Three stations had the Asperulo-Fagetum habitat type and two had the Rhodopide and Balkan Range Scots pine forests habitat type.
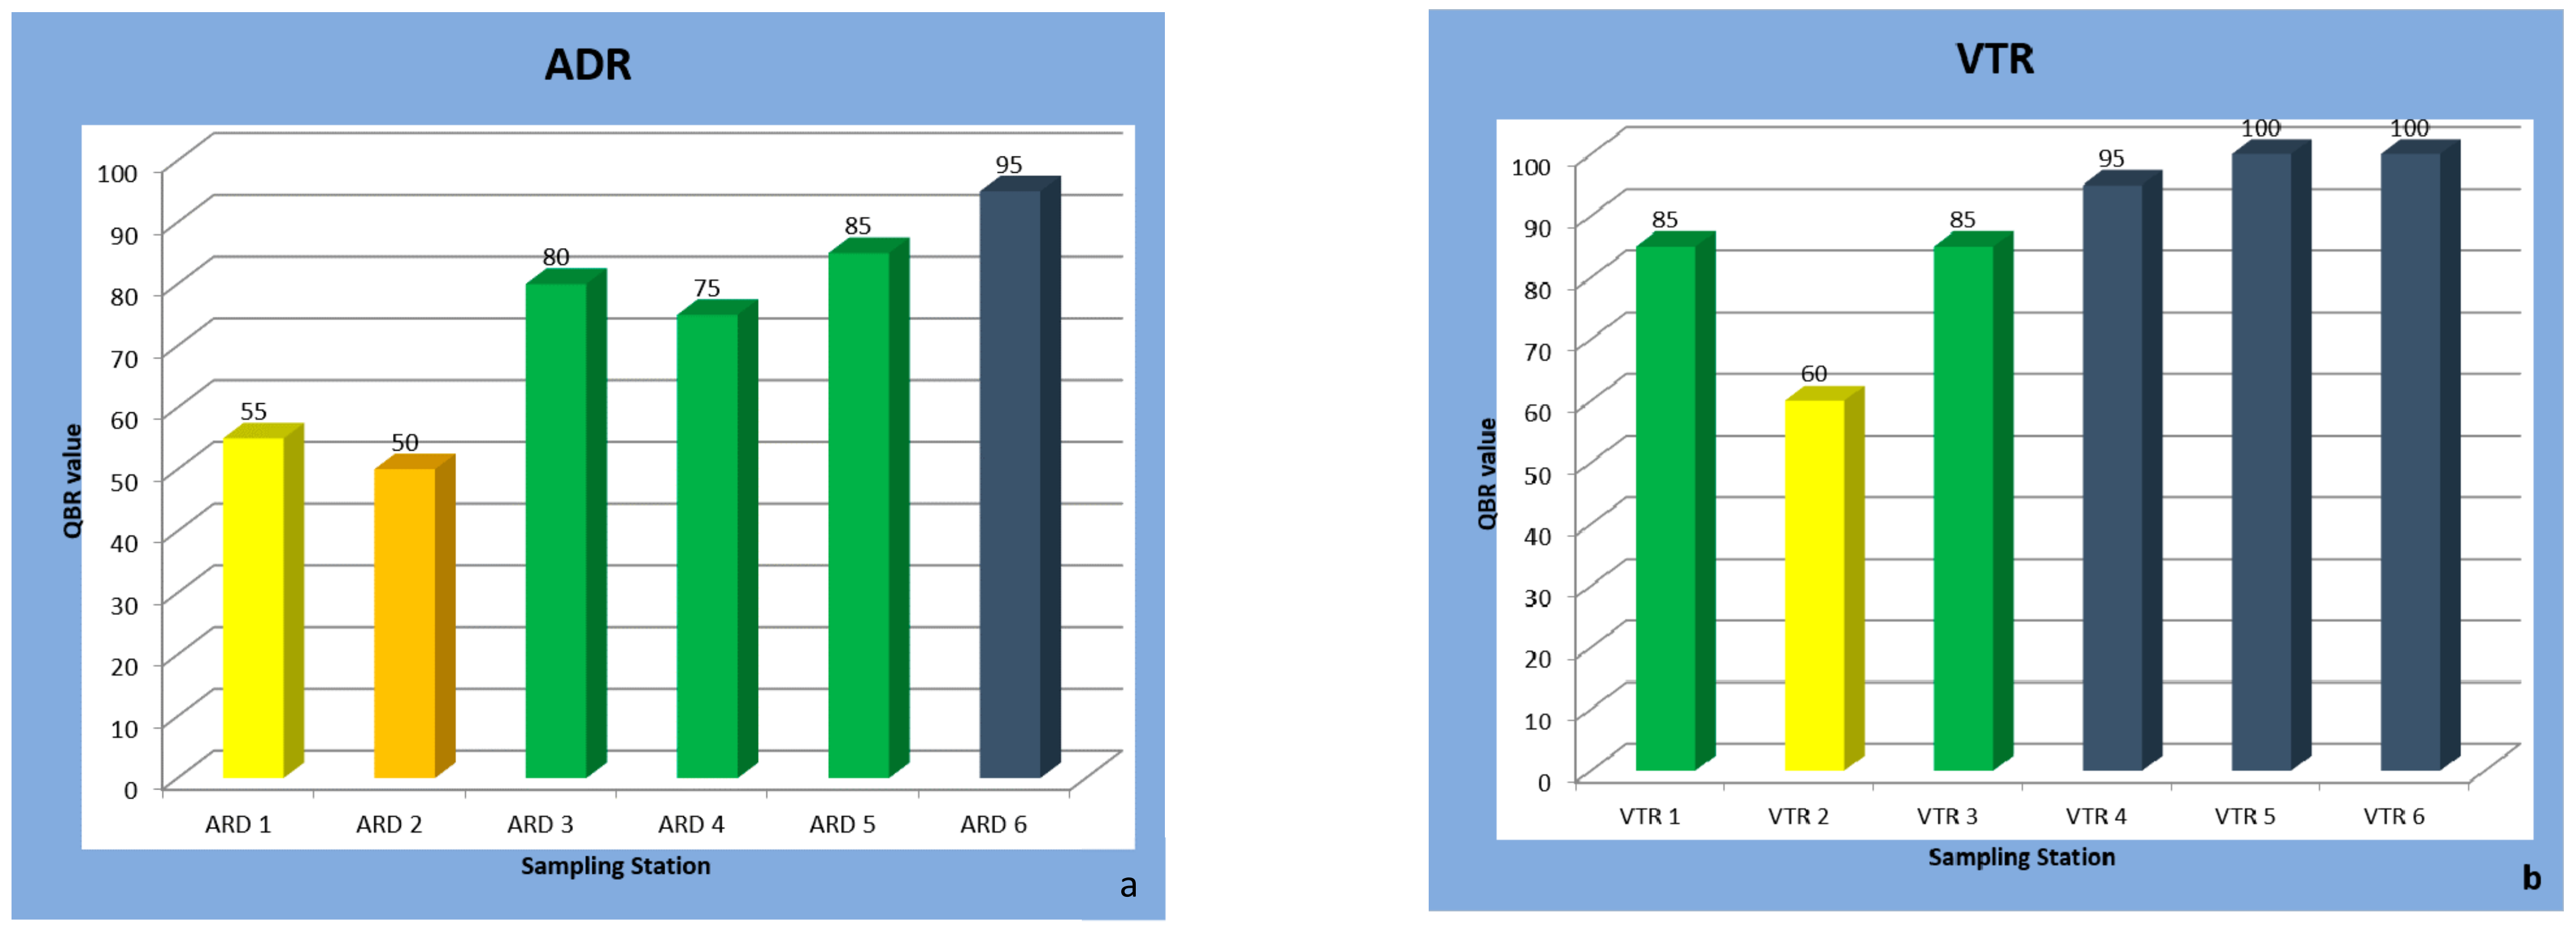
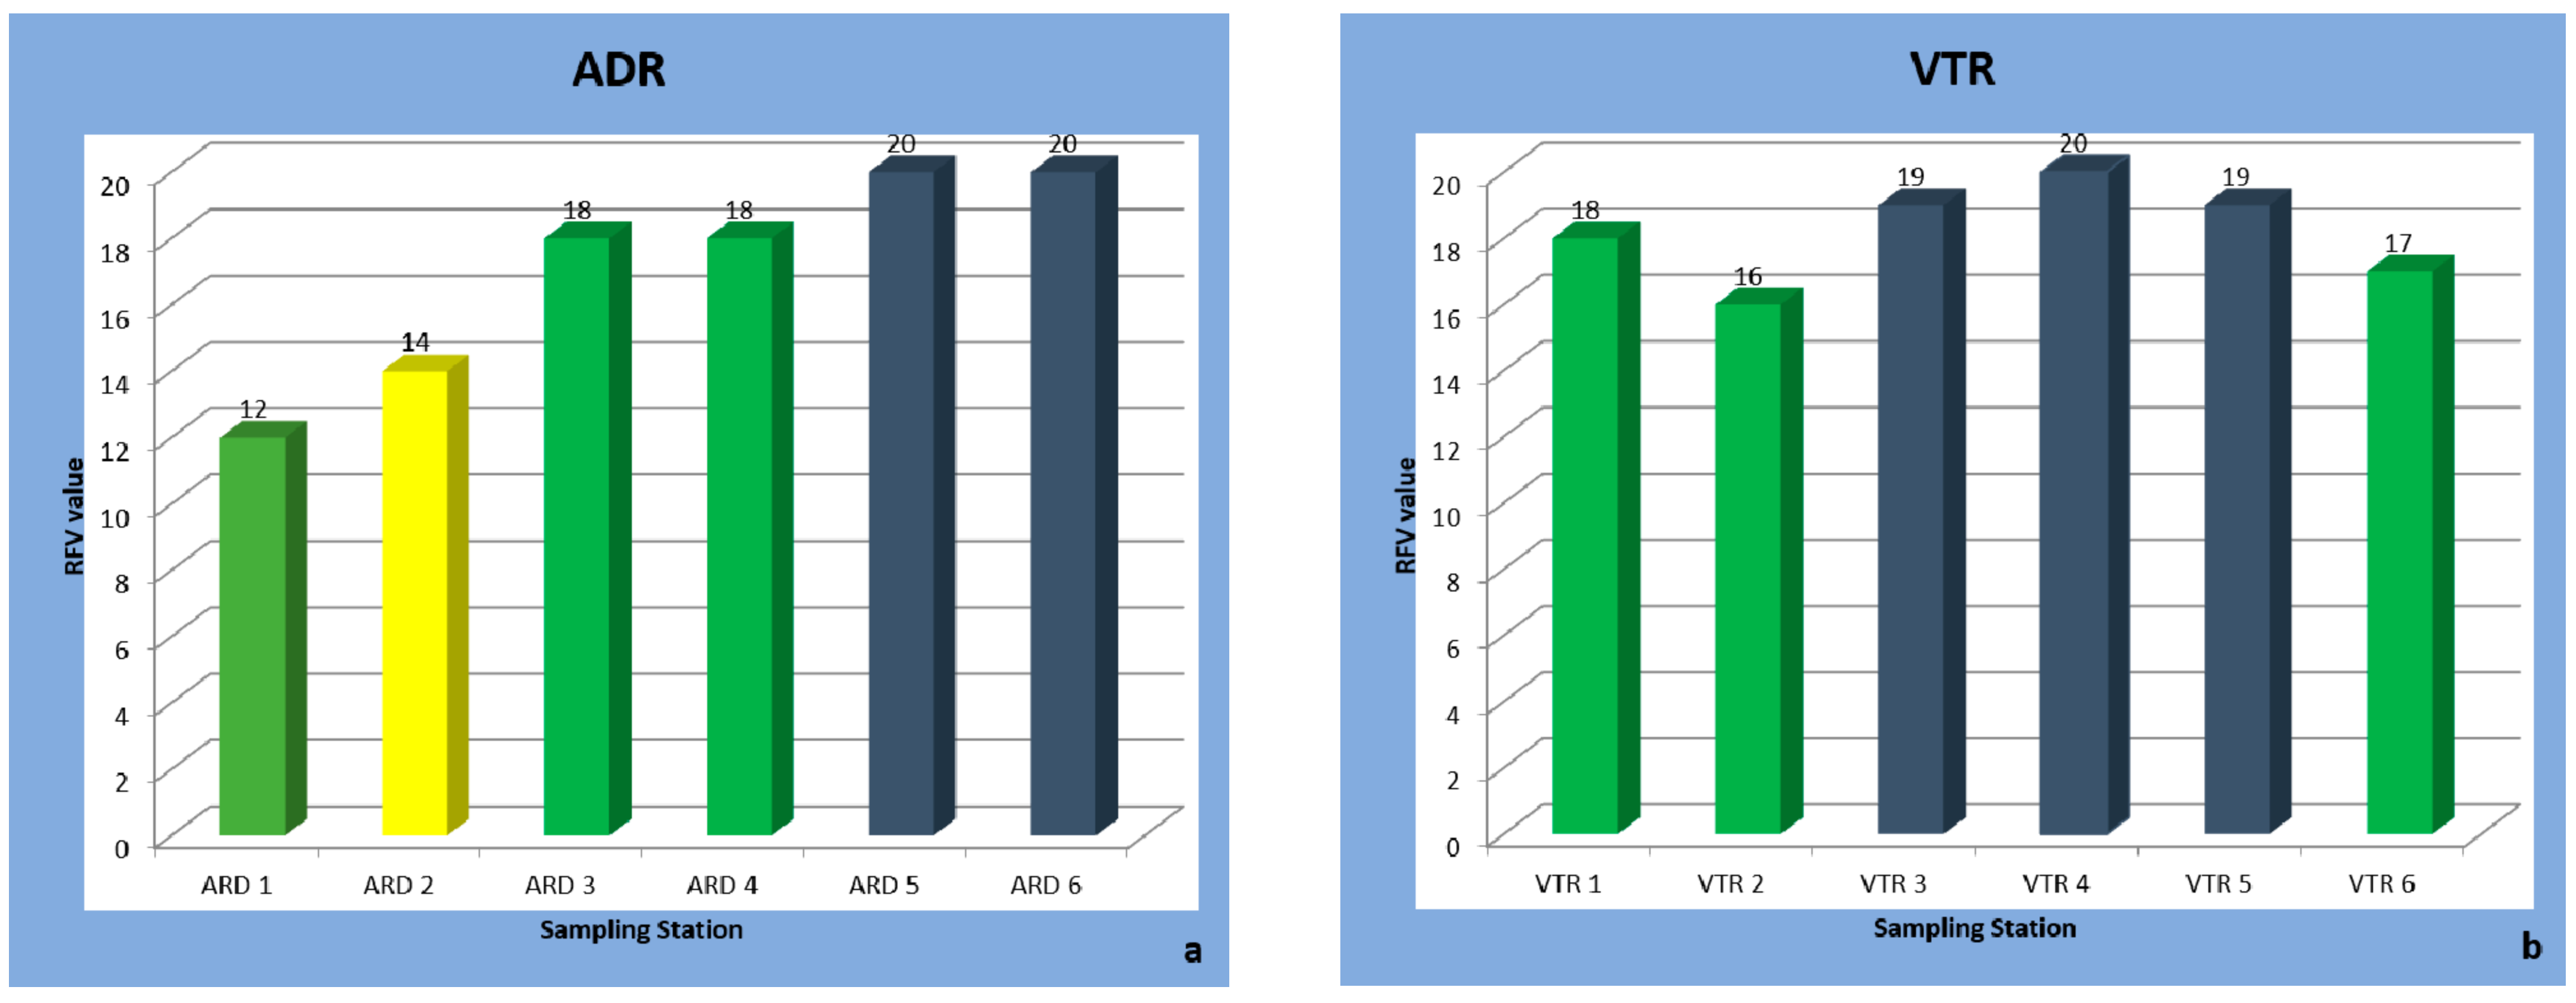
Based on the QBR (Figure 4), there were four riparian quality categories at the ADR locations, with most being good (three stations). For the VTR, the riparian quality categories were only three with most being natural (three stations). The RFV (Figure 5) had four quality categories with good and very good the most frequent (two stations). The VTR sampling stations had only good and very good conditions (each three stations). No significant difference was found between the QBR mean values of ADR and VTR. The TRC and CST values of the QBR were significantly higher in VTR than the ADR (p-value 0.034 and 0.0012, respectively). No significant differences were found in the RFV values between the ADR and VTR. The stations above 450 m had significantly higher quality values compared to stations below 450 m. The differences were significant for both protocols (QBR: p-value 0.002; RFV: p-value 0.024). Based on the forest habitat types, stations with Alno-Pandion, Alnion incanae and Salicion Albae presented lower riparian quality values compared to stations dominated by Asperulo-Fagetum beech forests and Rhodopide and Balkan Range Scots pine forests, but only for QBR (p-value 0.034).

3.3. Ground-Dwelling Insects

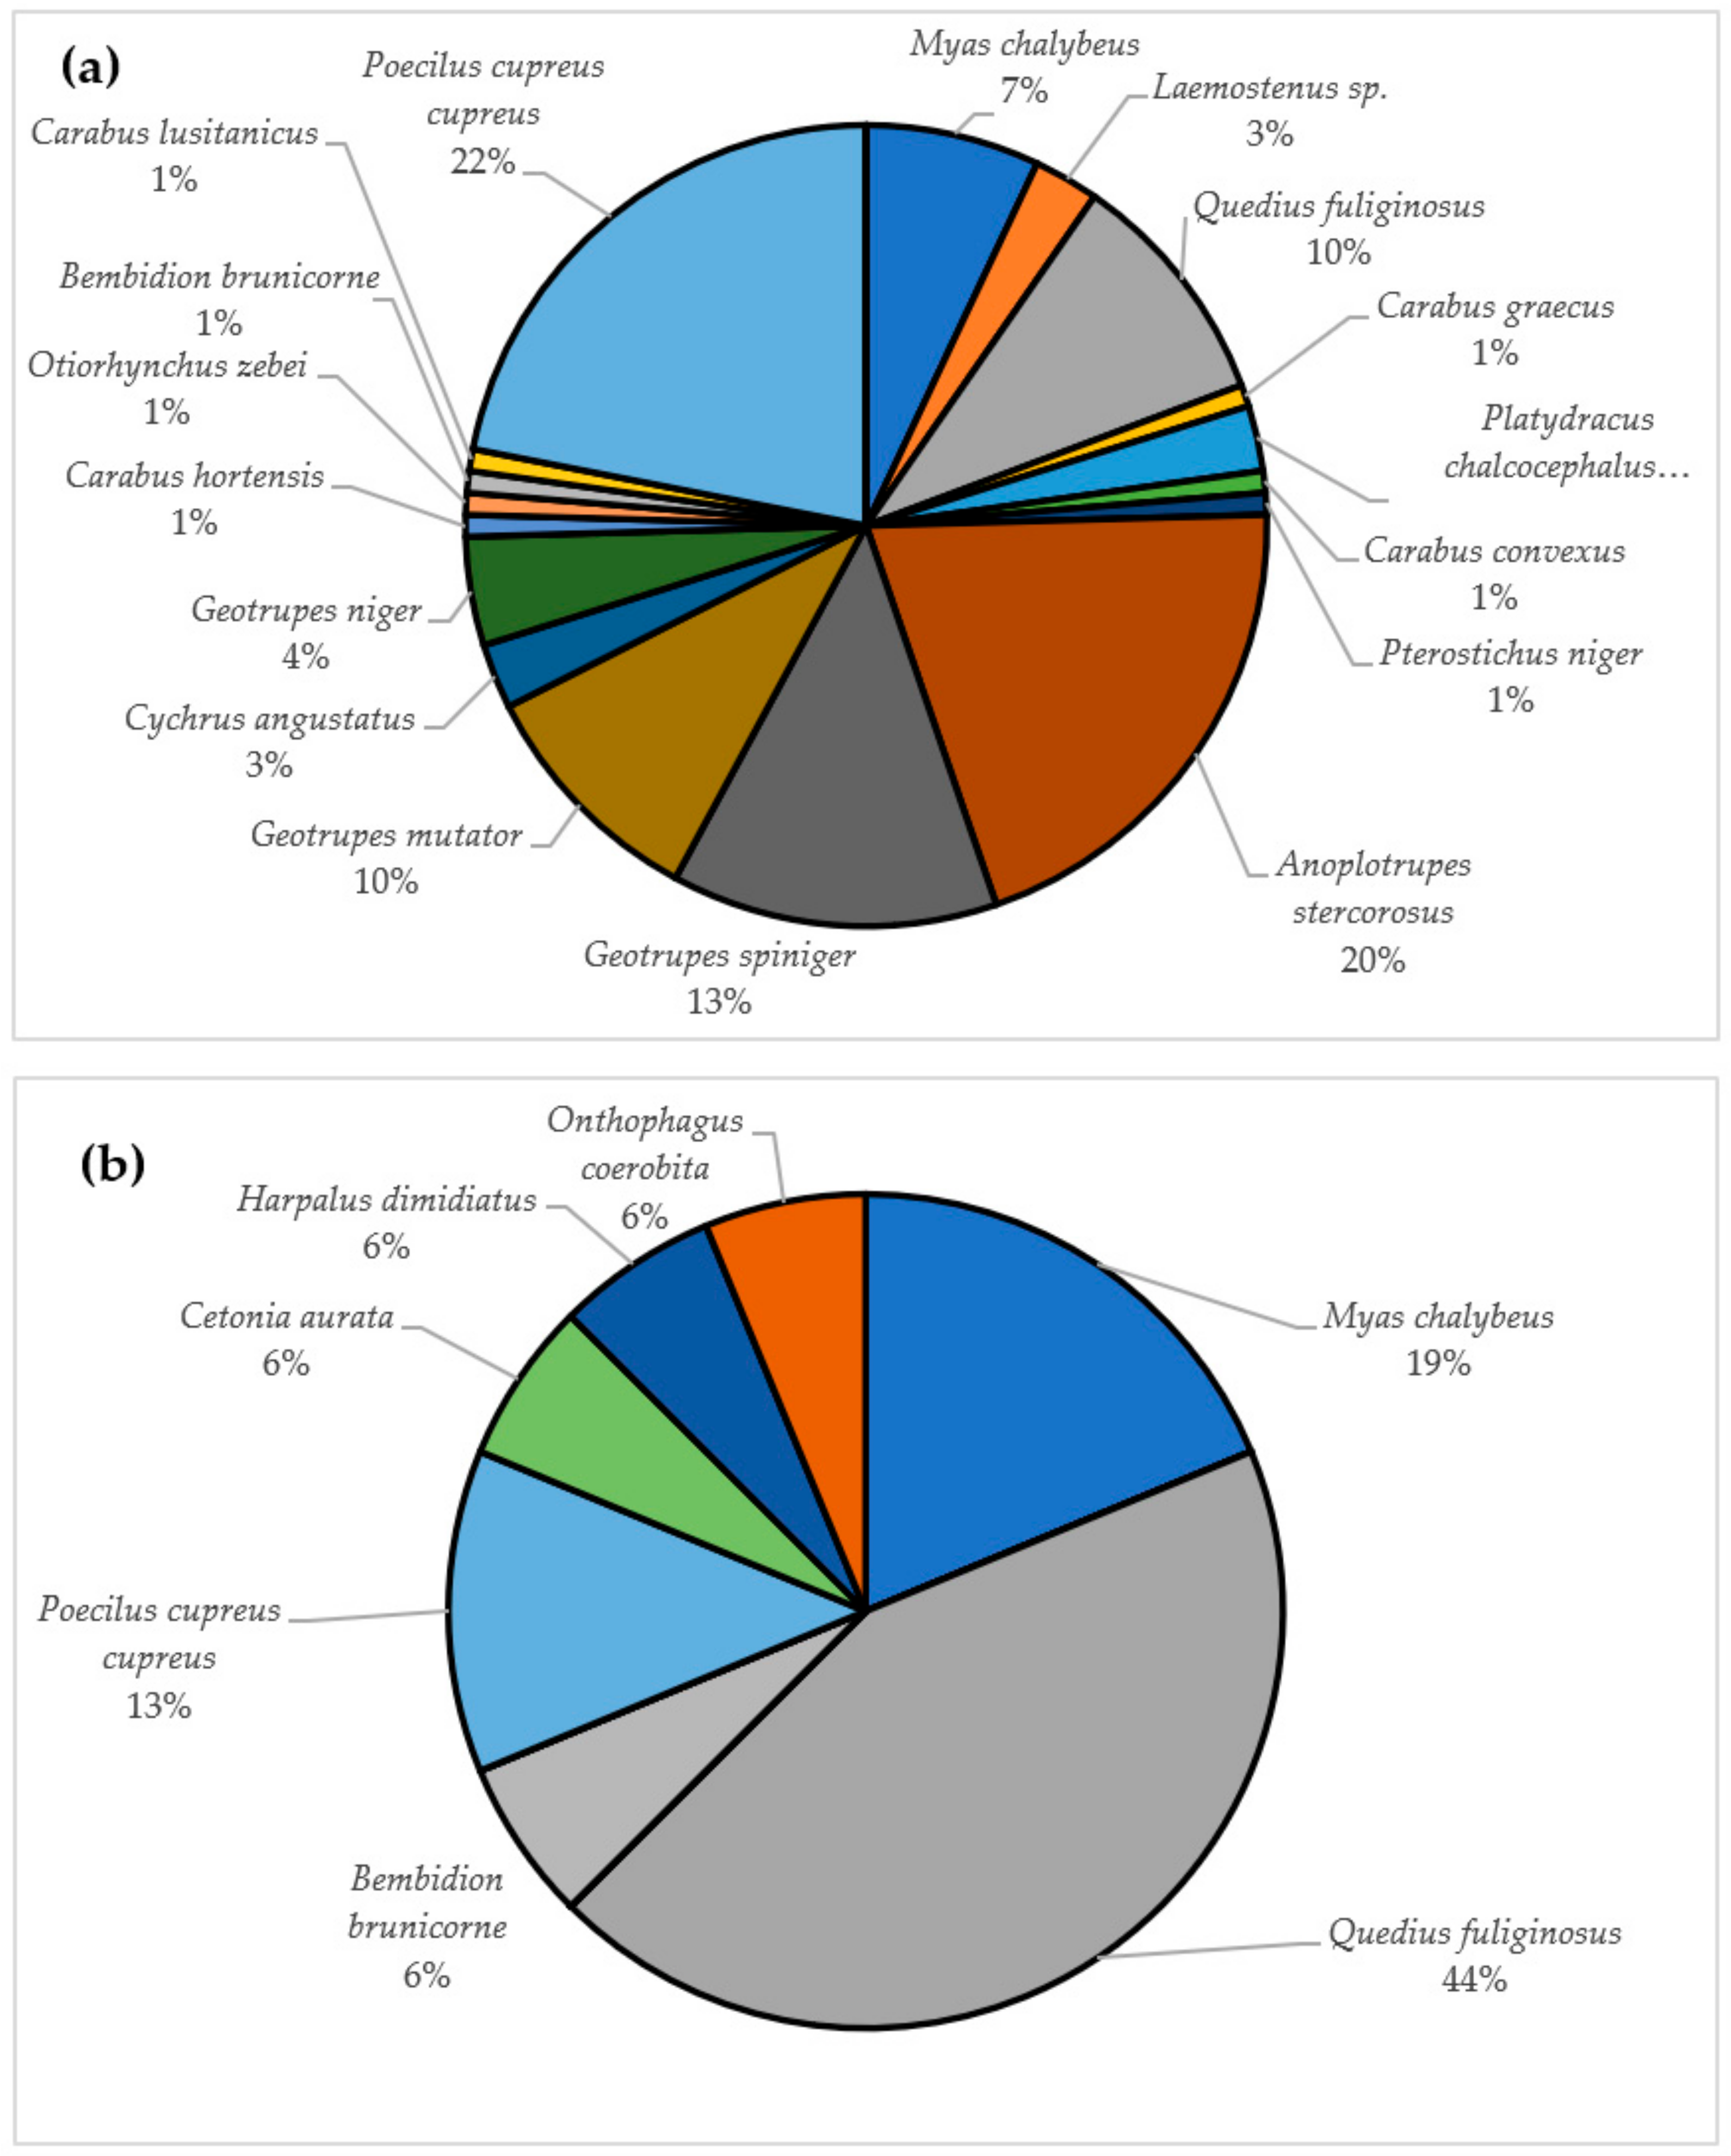
In total, 139 individuals were collected and identified to 20 species of ground-dwelling beetles (Coleoptera). Individuals were not equally distributed in each sub-watershed, with most collected in VTR (114 individuals). Similarly, species richness was much higher in VTR (16) than in ARD (7) (Figure 6a,b).
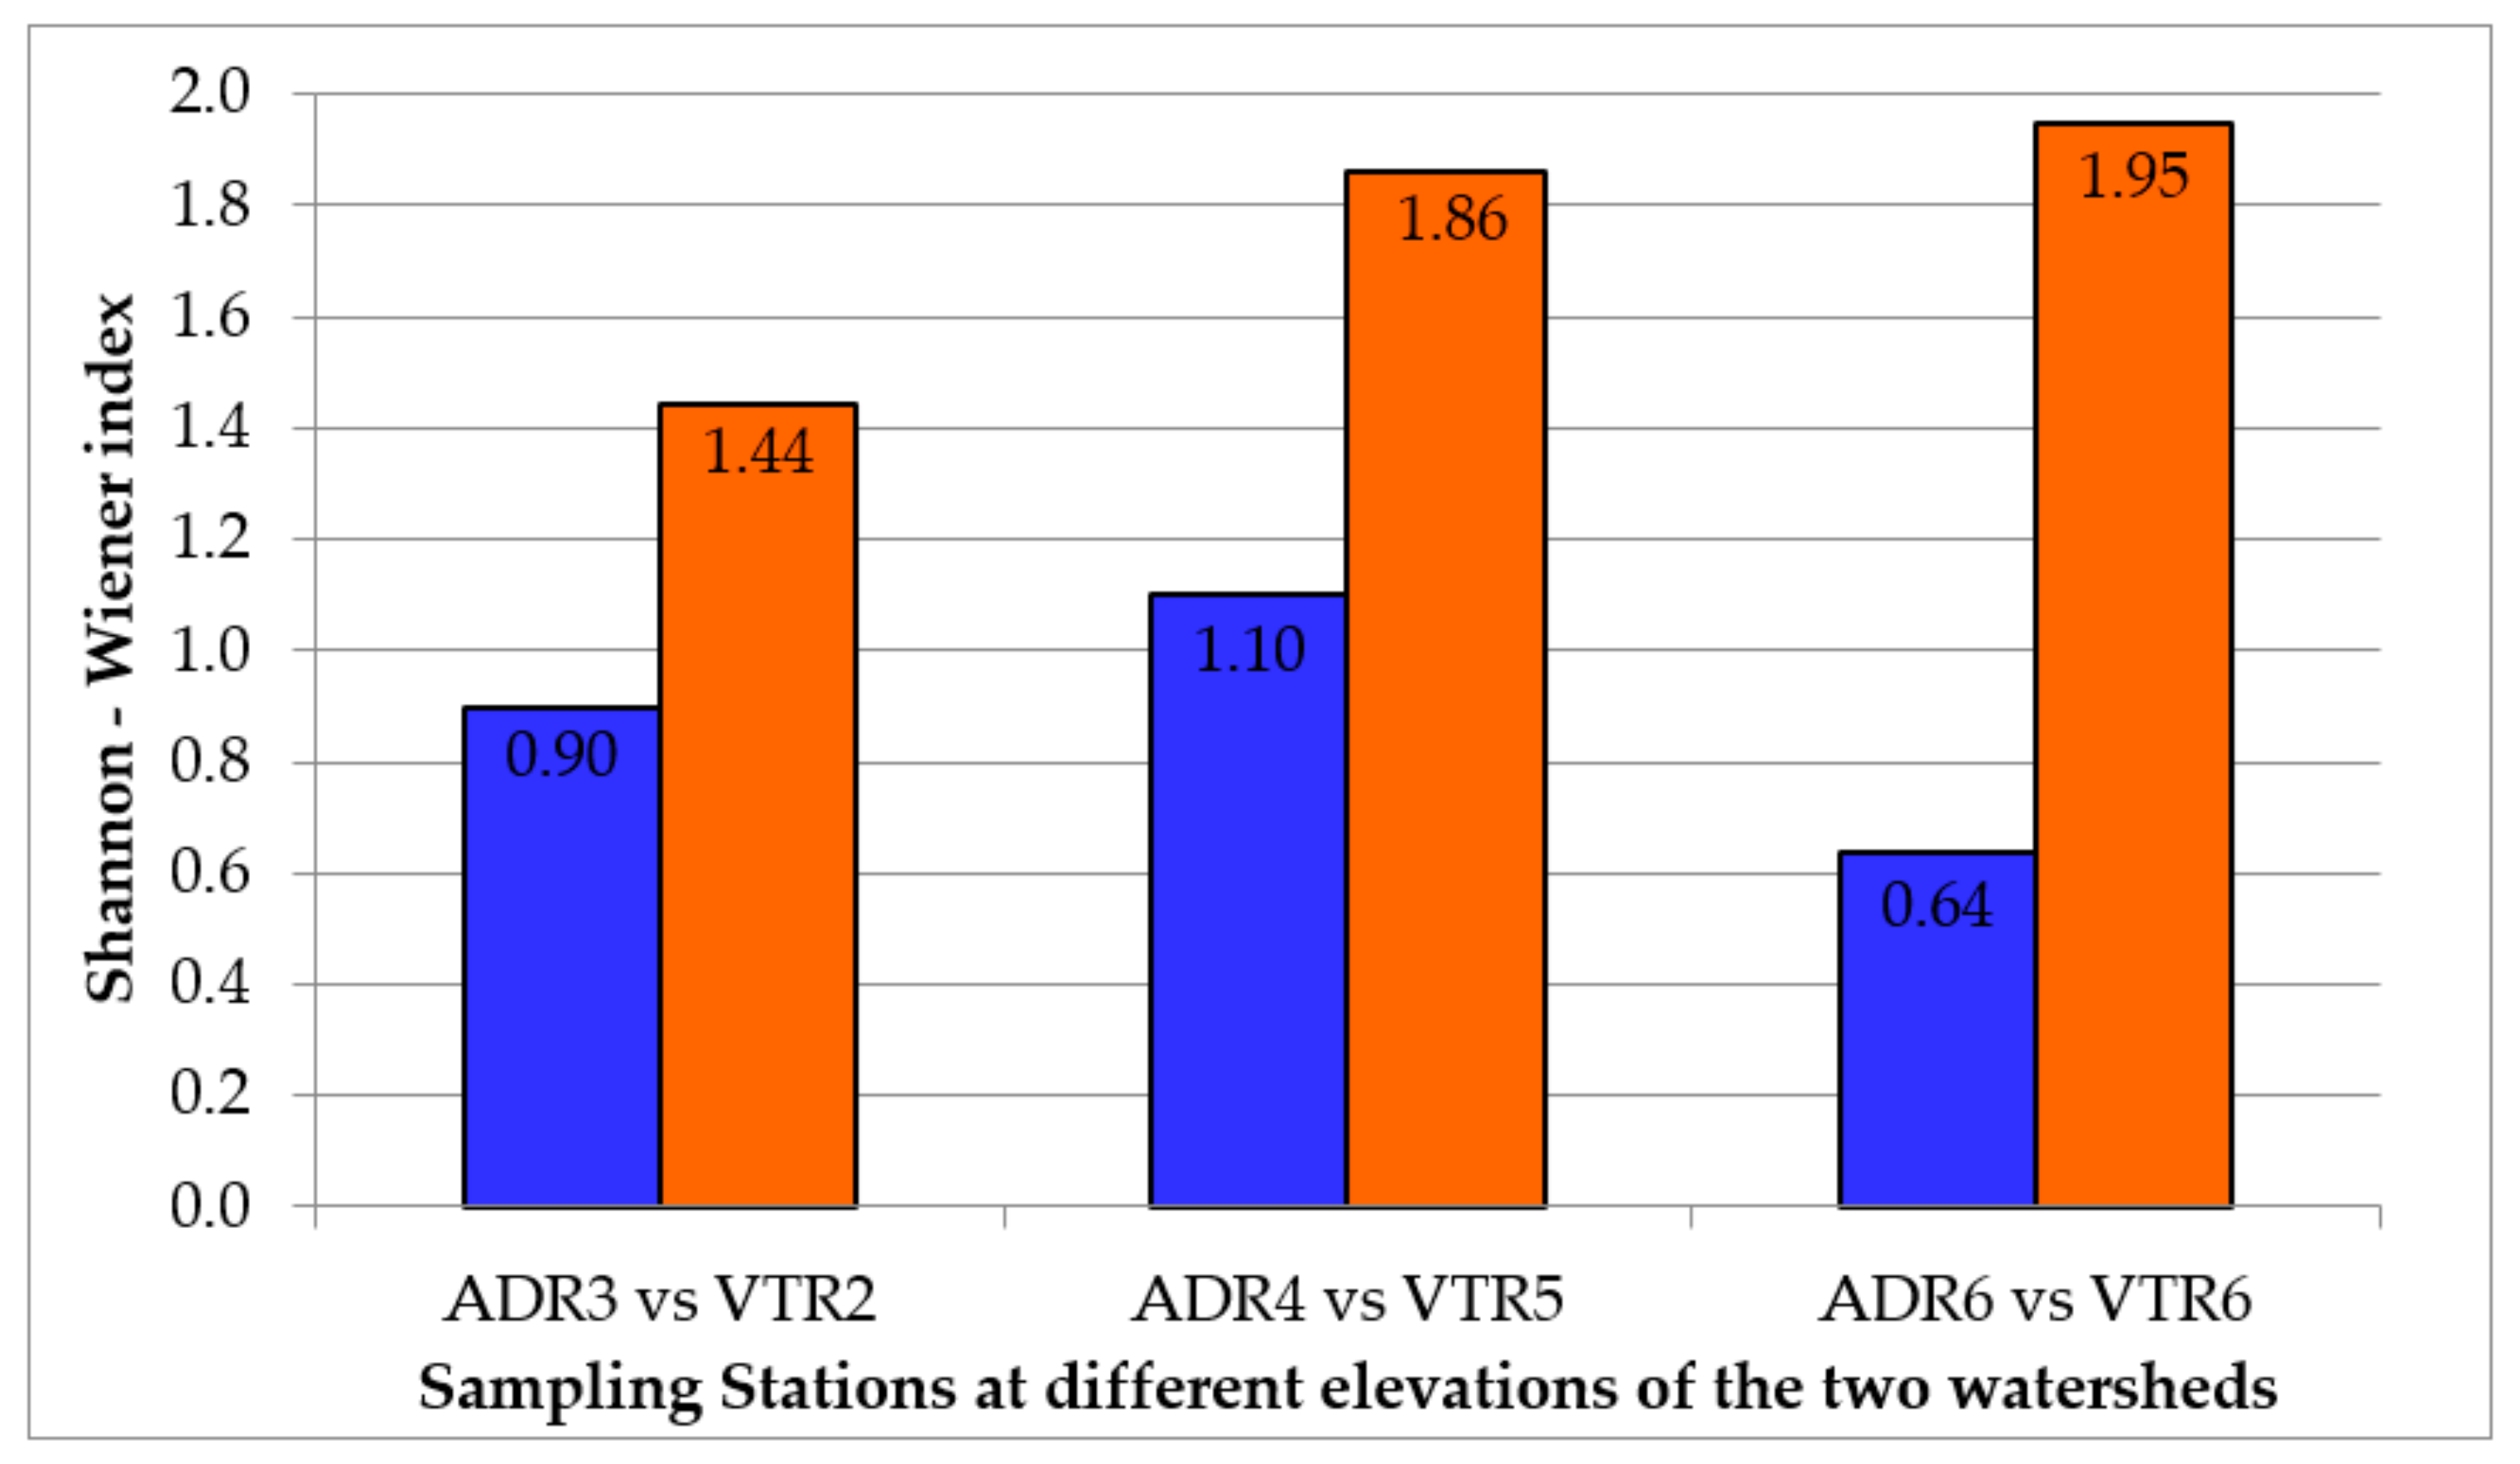
At all three elevations, the Shannon–Wiener index was the highest at VTR (Figure 7), with the differences increasing with elevation (greatest difference between ADR 6 vs. VTR 6).
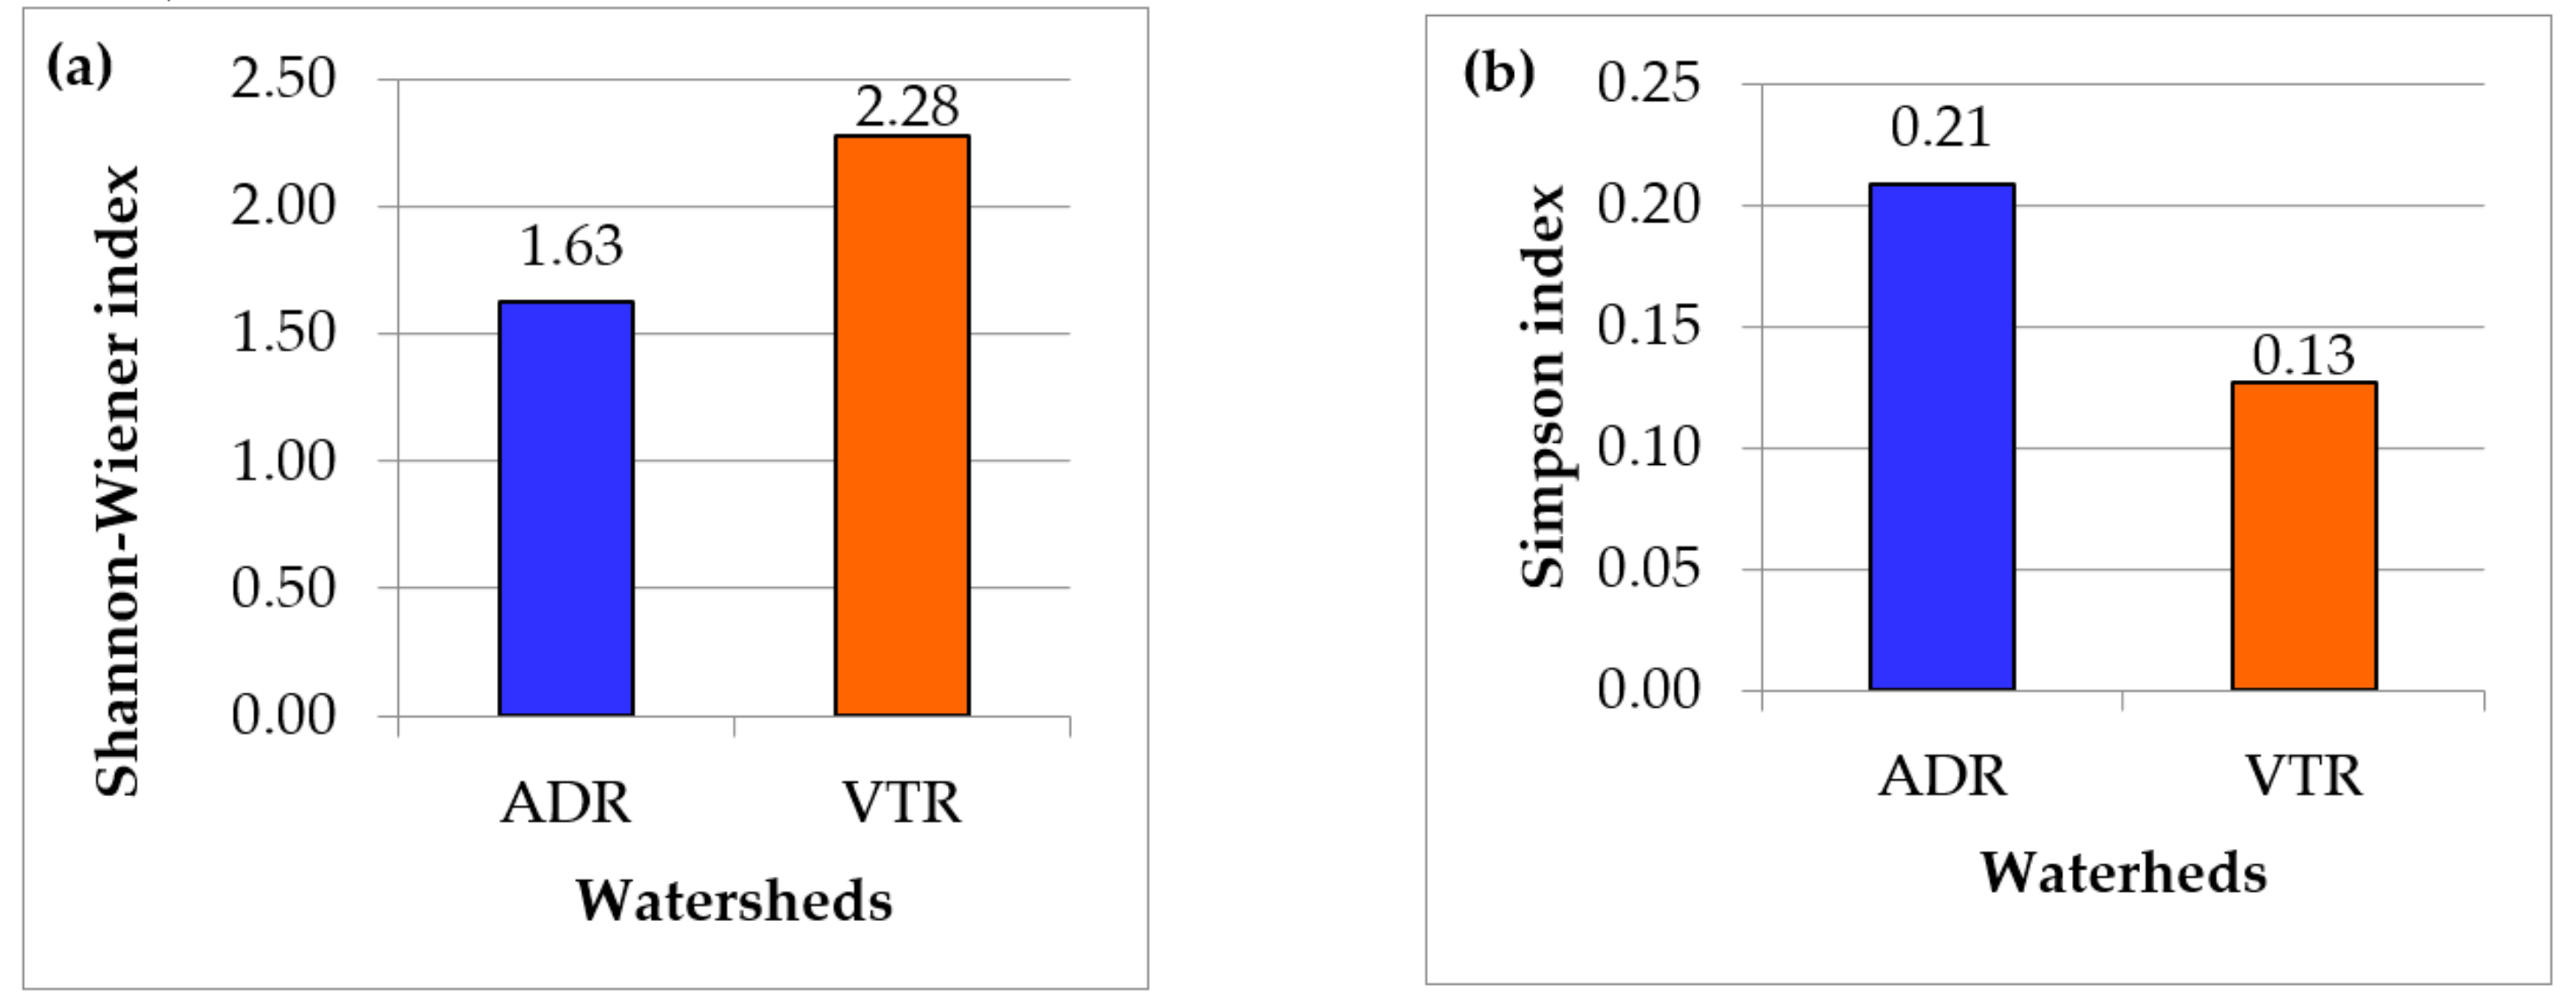
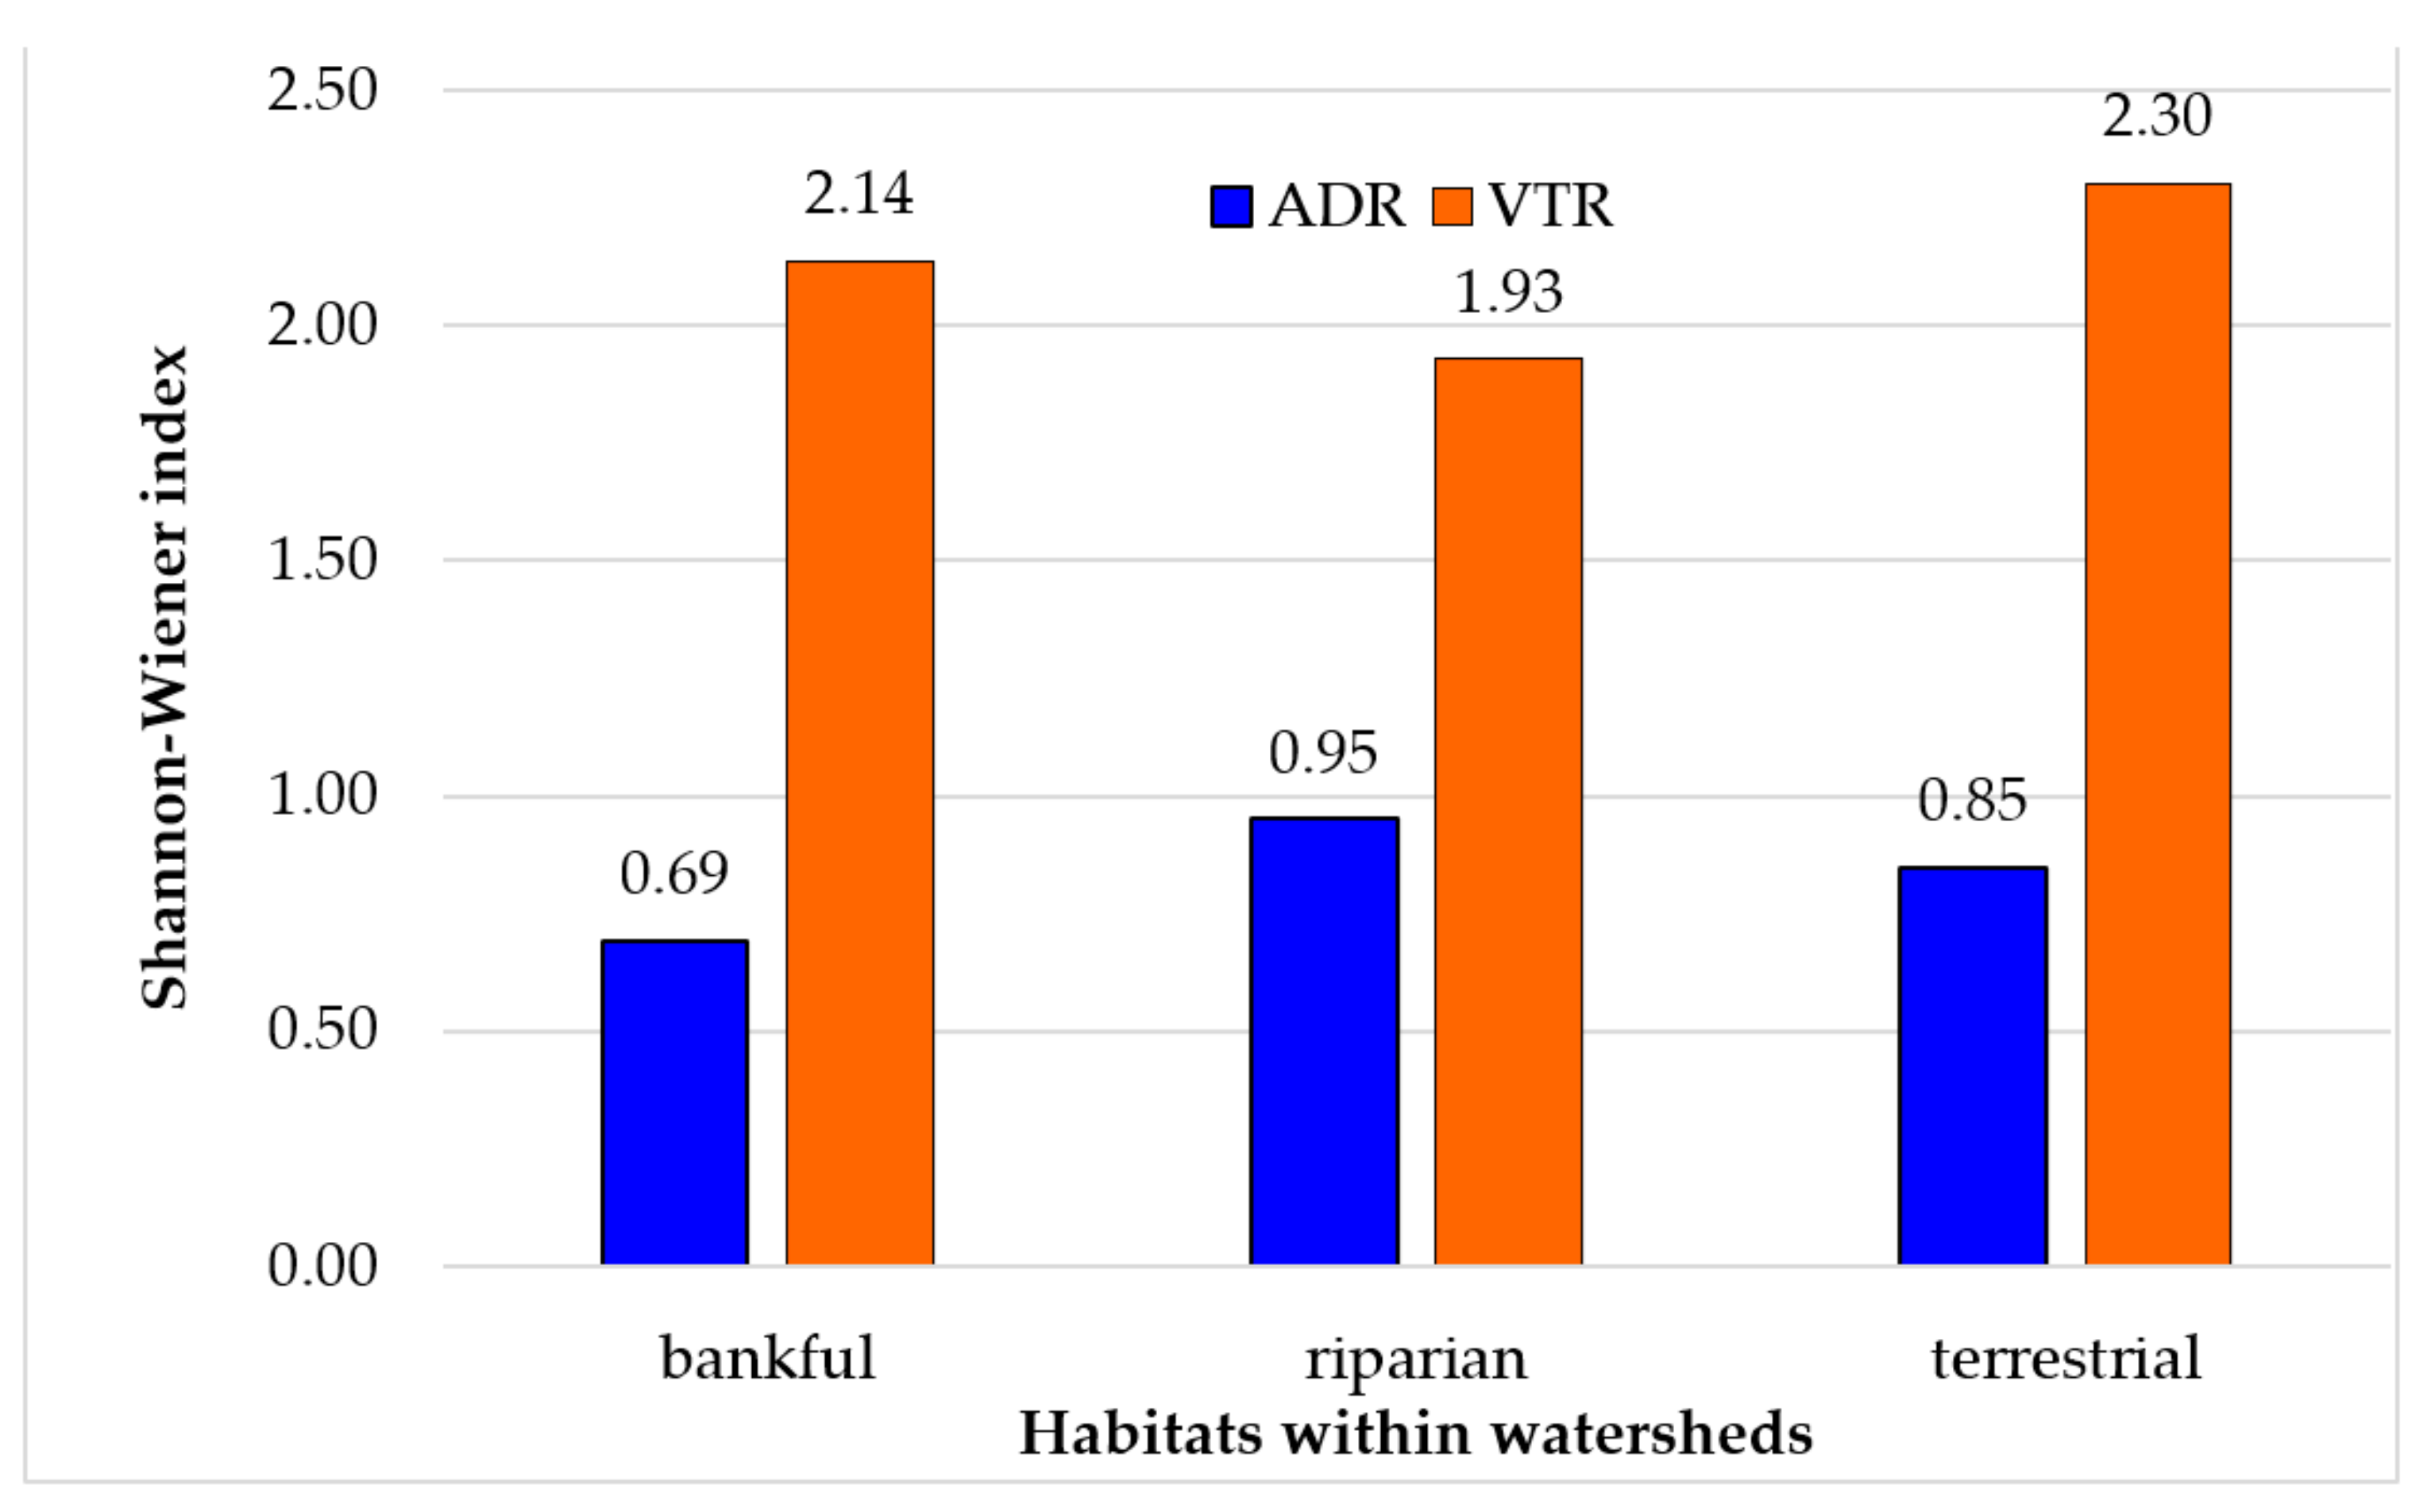
For all traps, both diversity indices showed greater diversity in VTR compared to ADR (Figure 8a,b). The VTR Shannon–Wiener index values also outperformed ADR in each micro-habitat (Figure 9). The bankfull micro-habitat exhibited the lowest Shannon–Wiener index value at ADR, and the other two micro-habitats had slightly higher values. For VTR, the riparian micro-habitat had the lowest Shannon–Wiener index value. Overall, the VTR Shannon–Wiener index microhabitat values were 2- to 3-fold higher compared to the respective values of the ADR.

4. Discussion

Effective integrated water resources management (IWRM) plans require the measurements or estimation of fluvio-geomorphologic parameters [51,52]. The differences in fluvio-geomorphologic parameters can be quite distinct even between adjacent watersheds. The most distinguishable difference in this study was the shape, since ADR tends to be round, while the VTR is elongated. Watershed shape can impact stream flows, especially peak flows when the other parameters are relatively similar [53]. ADR had larger values than VTR for most fluvio-geomorphologic parameters, such as watershed area and slope, drainage density, stream order, ruggedness and relative stream power. Taking in consideration these parameters and the watershed shape, ADR appears to have greater potential for erosion and flooding events [54]. The use of GIS to determine fluvio-geomorphologic parameters can provide the basic dataset for IWRM plans.
Stream bed particle size can be an indirect indicator of stream velocity, sediment transport capacity and disturbances. Stream beds that exhibit a high percentage of fine material indicate sedimentation that is associated with stream or watershed scale disturbances that cause surface erosion [55]. In Mediterranean streams, this can occur after extensive wildfires [56] that leave the watershed bare of vegetation and susceptible to surface erosion and runoff whose sediments are deposited on the stream bed as fine particles. Both watersheds contained different size particles in their stream bed including larger diameter. This was expected, since both streams are in a mountainous region with relative steep slopes and high elevational differences (ADR is 1630 m and VTR is 1490 m). The ADR had greater stream water power based on the GIS fluvio-geomorphologic parameters, something that was confirmed by the cumulative percentage particle size figures (larger particles on the stream bed). VTR streams on average had a greater percentage of finer material (≤2 mm) (~20%), while ADR had less (≤5%). The ADR cumulative particle sizes at the lower elevation stations as expected contained higher percentages of smaller diameter particles [57,58]. This was evident between ADR1 and ADR 6, but less apparent among the other four stations. This lack of differences (ADR 2-5) is likely due to localized lithological controls [59]. The differentiation of the cumulative particle size at the sampling stations along VTR is not as clear. VTR 2 had higher percentages of finer material but the cumulative lines of all stations are close to each other, especially after the medium size particles. The finer particles percentage for VTR 2 is relatively high, reaching 30%, and is always greater than 15% in all VTR stations. In contrast in all ADR stations, the percentage is always below 10%. High sedimentation can negatively affect invertebrates and fishes [60] and destabilize stream channels [61], making them susceptible to re-suspension [62] but was not a serious problem for these watersheds. In contrast, the very low percentages of finer material in all ADR stations should be a concern because it decreases water retention capacity of streams [57].
Moving downstream should normally lead to an increase in WSW and BW, as larger order streams have greater discharges with deviations due to lithologic or topographic restrictions [63]. ADR sampling stations had higher WSW values than VTR stations at similar elevations. This is a response to greater discharge magnitude events that are expected at ADR. With most sampling stations of both watersheds in semi-mountainous or mountainous areas, topographic restrictions (ravines) were present. Most banks were categorized as 3, which was something expected, since both tributaries have high stream power and steep stream slopes. The lack of bank slopes greater than 75° is encouraging and indicates that both watersheds do not have serious stream bank erosion [64]. Overall, field measurements and GIS estimations of fluvio-geomorphologic parameters are essential, since they help understand the fluvial processes of the watershed and stream that strongly influence the health in riverine and riparian ecosystems, especially in Mediterranean environments [59].
Riparian areas are azonal [8] and can encompass a great variety of plant species, even dominant and subdominant ones. Vegetation species and habitat types changed along the elevational gradient in both sub-watersheds [18]. This is expected and due to climatic changes, that occur primarily in temperature and precipitation. In this study, the elevation difference between the highest and lowest station was greater than 1000 m in ADR and almost 1000 in VTR. ADR had one more habitat type (Salix alba and Populus alba galleries) that dominates Mediterranean riparian areas below 300 m [41]. As expected, in the elevation from 150 until 900 m due to climatological condition, Alnus glutinosa was the most abundant species, and Alno-pandion, Alnion incanae and Salicion Albae the most dominant habitat. As the temperature became colder (above 900 m), non-riparian species and habitats dominated. These two sub-watersheds showcase that the riparian areas of the Mediterranean Basin exhibit high species richness along elevation gradients that signifies the importance of finding reference riparian sites for restoration efforts [35].
The visual protocol results indicated that the riparian areas of both sub-watersheds are in good condition compared to many other studies in Greece and the Mediterranean [65,66,67]. This was expected since both sub-watersheds have limited anthropogenic impacts, especially agricultural activities. Other studies, also using visual protocols, have found that anthropogenic activities can degrade riparian areas in the Mediterranean [24,68,69,70,71]. Still, both protocols used in this study indicated that VTR riparian areas are in better condition compared to ADR, even though difference was not statistically significant. The QBR protocol, found that ADR sampling stations showed significantly lower interconnectivity with the adjacent terrestrial ecosystems and lower coverage of trees, shrubs and understory plants in their riparian areas. The ADR sampling station was expected to have a lower score because of the greater anthropogenic activities. For both protocols, the elevation and habitat type of the sampling stations strongly impacted the assessment results. Sampling stations at an elevation higher than 450 m were in better condition. Stations with Asperulo-Fagetum beech forests and Rhodopide and Balkan Range Scots pine forests habitats were of better quality than stations with Alno-Pandion, Alnion incanae and Salicion Albae. In both cases, the key characteristics were the substantially less anthropogenic activities and fewer roads in higher elevation and non-riparian habitat sampling stations. Other studies have also found that riparian areas of lowland regions of Greece have substantially higher anthropogenic activities, particularly agricultural activities [26,69] that degrade their quality. In both ADR and VTR sub-watersheds, anthropogenic activities were more intense near or along riparian areas at stations below 450 m [69] because they are nearer to few villages and towns of the region and have a denser road network.
The results of the two protocols were further confirmed by the evaluation of the ground-dwelling beetle assemblages. More studies are combining the use of visual protocols and insect as bioindicators with good results when assessing riparian areas [70] Ground-dwelling beetles are sensitive to anthropogenic activities and changes in fluvial conditions and vegetation structure [15,71,72,73,74]. Species richness and abundance and diversity indices of the ground beetles along VTR was considerably higher compared to ADR. ADR exhibited an uneven distribution of species, with Quedius fuliginosus accounting for almost half of the individuals trapped (44%), whereas in VTR, there were five species with a percentage higher than 10%. As anthropogenic activities increase (e.g., grazing, hunting, fishing, ecotourism), these impact the number and the diversity of beetle species. Riparian areas exhibit higher biodiversity compared to the terrestrial and bankfull areas [8]. This was reflected in the Shannon–Wiener index among these habitats in the ADR. In the VTR, terrestrial habitats exhibited the highest Shannon–Wiener index value. This might be attributed to the limited anthropogenic impacts [75] and fewer flood flows [73].
All methods seem very promising, since they were able to detect differences among the two sub-watersheds. The methods provide both a physical and biological assessment of the anthropogenic pressures and changes to riparian quality and will allow to develop a holistic framework for their sustainable management [24]. The greater rural population and more extensive road network in the ADR leads to more pressures such as grazing, hunting, fishing and other ecotouristic activities that has impacted the riparian areas, especially those that are easily accessible in the lower elevations. This is a little worrisome, since both sub-watersheds do not have extensive anthropogenic pressures. The potential increase in ecotourism should be monitored along with the other activities that take place to avoid the degradation of the riparian areas [65]. New management plans should be developed that should not be centrally implemented and be based on public participation [76]. Despite the implementation of the WFD, the current plans do not seem very effective. Alternative plans should be adopted based on ecosystem-based approaches and nature-based solutions [55,76] for the sustainable protection and conservation of the riparian areas, always developed at the basin scale [72,77].

5. Conclusions

Natural areas are threatened by anthropogenic disturbances and degradation, and for their sustainable management, effective assessment methods are a necessity. For mountainous natural watersheds and riparian areas, this assessment is complicated, since fluvio-geomorphologic conditions interact with biological conditions and impact their natural processes. Thus, to implement IWRM plans, a holistic view is required to secure long-term sustainability. The fluvio-geomorphologic, vegetative and entomofaunistic datasets of this study provided different assessment perspectives but had the same conclusions. The least-disturbed sub-watershed exhibited the better conditions. The fact that the methods used in this study found differences in the two sub-watersheds despite both not having intensive anthropogenic pressures is very encouraging and indicates that they should be adopted by the responsible authorities in Greece and other Mediterranean countries. Differences were also evident between the sampling stations, with higher elevation stations having the best conditions, since anthropogenic disturbances were limited. Overall, integrating different assessment methods provides a complementary view on the watershed and riparian areas conditions that should help in the development of sustainable management plans.
Ecotourism is gaining greater interest, especially in mountainous and riparian areas of Greece and the Mediterranean. Similar datasets should be collected for riparian areas throughout Greece and even the Mediterranean to be able to capture the current conditions. Such datasets will provide the necessary information to implement ecotourism plans and best management practices to mitigate anthropogenic and climate change impacts.
For the two studied sub-watersheds, although the overall condition of the riparian areas is relatively good compared to other riparian areas of Greece, some measures need to be taken. Firstly, the same or similar assessments need to be continued in both sub-watersheds in order to be able to develop a long-term dataset of the conditions. Another key is to better monitor the anthropogenic pressures. Specifically, the livestock grazing, hunting, fishing and other ecotourism activities need to be checked and measured. In the past, these activities were limited, but based on this study, there are some indications that they are negatively impacting the riparian areas in the low elevations that have more residents living nearby and a more extensive road network that leads to more visitors. A new management plan should be developed to regulate such activities. Specifically, after the current pressures are recorded, the number of visitors for ecotourism might need to be regulated to avoid degradation and promote sustainability, while best management practices should look into minimizing the impacts of residents (e.g., grazing, wood harvesting) from the adjacent communities to maintain the naturalness of these mountainous sub-watersheds and their riparian areas.

Author Contributions

Conceptualization, D.S. and G.N.Z.; methodology, D.A. and V.I.; formal analysis, D.S., D.K. and D.A.; investigation, D.S.; writing—original draft preparation, G.N.Z. and D.S.; writing—review and editing, G.N.Z., V.I., D.K. and D.A.; visualization, V.I. and D.S. All authors have read and agreed to the published version of the manuscript.

Funding

This research received no external funding.

Conflicts of Interest

The authors declare no conflict of interest.

References

  1. Geijzendorffer, I.R.; Beltrame, C.; Chazee, L.; Gaget, E.; Galewski, T.; Guelmami, A.; Perennou, C.; Popoff, N.; Guerra, C.; Leberger, R.; et al. A more effective Ramsar Convention for the conservation of Mediterranean wetlands. Front Ecol. Evol. 2019, 7, 21. [Google Scholar] [CrossRef] [Green Version]
  2. Bruno, D.; Gutierrez-Canovas, C.; Sanchez-Fernandez, D.; Velasco, J.; Nilsson, C. Impacts of environmental filters on functional redundancy in riparian vegetation. J Appl. Ecol. 2016, 53, 846–855. [Google Scholar] [CrossRef] [Green Version]
  3. Aguiar, F.C.; Segurado, P.; Martins, M.J.; Bejarano, M.D.; Nilsson, C.; Portela, M.M.; Merritt, D.M. The abundance and distribution of guilds of riparian woody plants change in response to land use and flow regulation. J. Appl. Ecol. 2018, 55, 2227–2240. [Google Scholar] [CrossRef]
  4. García-Nieto, A.P.; Geijzendorffer, I.; Baró, F.; Roche, P.; Bondeau, A.; Cramer, W. Impacts of urbanization around Mediterranean cities: Changes in ecosystem service supply. Ecol. Indic. 2018, 91, 589–606. [Google Scholar] [CrossRef] [Green Version]
  5. Stefanidis, K.; Latsiou, A.; Kouvarda, T.; Lampou, A.; Kalaitzakis, N.; Gritzalis, K.; Dimitriou, E. Disentangling the main components of hydromorphological modifications at reach scale in rivers of Greece. Hydrology 2020, 7, 22. [Google Scholar] [CrossRef] [Green Version]
  6. Zaimes, G.N.; Gounaridis, D.; Fotakis, D. Assessing riparian land-uses/vegetation cover along the Nestos River in Greece. Fresen Environ. Bull. 2011, 20, 3217–3225. [Google Scholar]
  7. Patten, D. Riparian ecosystems of semi-arid North America: Diversity and human impacts. Wetlands 1998, 18, 498–512. [Google Scholar] [CrossRef]
  8. Zaimes, G.N. 2020. Mediterranean Riparian Areas-Climate change implications and recommendations. J. Environ. Biol. 2020, 41, 957–965. [Google Scholar] [CrossRef]
  9. Rodríguez-Lozano, P.; Rieradevall, M.; Andrei Rau, M.; Prat, N. Long-term consequences of a wildfire for leaf-litter breakdown in a Mediterranean stream. Freshw. Sci. 2015, 34, 1482–1493. [Google Scholar] [CrossRef]
  10. Cid, N.; Bonada, N.; Carlson, S.M.; Grantham, T.E.; Gasith, A.; Resh, V.H. High variability is a defining component of Mediterranean-Climate rivers and their biota. Water 2017, 9, 52. [Google Scholar] [CrossRef] [Green Version]
  11. Lobera, G.; Batalla, R.J.; Vericat, D.; Lopez-Tarazin, J.A.; Tena, A. Sediment transport in two Mediterranean regulated rivers. Sci. Total Environ. 2016, 540, 101–113. [Google Scholar] [CrossRef]
  12. Emmanouloudis, D.; Garcia Rodriguez, J.L.; Zaimes, G.N.; Giminez Suarez, M.C.; Filippidis, E. Euro-Mediterranean torrents: Case studies on tools that can improve their management. In Mountain Ecosystems: Dynamics, Management and Conservation; Richards, K.E., Ed.; Nova Science Publishers: Hauppauge, NY, USA, 2011; pp. 1–44. [Google Scholar]
  13. Guida, D.; Cuomo, A.; Longobardi, A.; Villani, P. Geohydrology of a Reference Mediterranean Catchment (Cilento UNESCO Geopark, Southern Italy). Appl. Sci. 2020, 10, 4117. [Google Scholar] [CrossRef]
  14. Tolkkinen, M.J.; Heino, J.; Ahonen, S.H.K.; Lehosmaa, K.; Mykrä, H. Streams and riparian forests depend on each other: A review with a special focus on microbes. Ecol. Manag. 2020, 462, 117962. [Google Scholar] [CrossRef]
  15. Zaimes, G.N.; Loisios, P.; Fytopoulos, P.; Mersina, C.; Fyllas, N.; Iakovoglou, V.; Avtzis, D. Ground dwelling insects as environmental indicators of riparian habitats in agricultural Mediterranean landscapes. Environ. Eng. Manag. J. 2019, 18, 1977–1986. [Google Scholar] [CrossRef]
  16. Bonada, N.; Dolédec, S.; Statzner, B. Taxonomic and biological trait differences of stream macroinvertebrate communities between Mediterranean and temperate regions. Implications for future climatic scenarios. Glob. Chang. Biol. 2007, 13, 1658–1671. [Google Scholar] [CrossRef]
  17. Santos, M.J. Encroachment of upland Mediterranean plant species in riparian ecosystems of southern Portugal. Biodivers. Conserv. 2010, 19, 2667–2684. [Google Scholar] [CrossRef] [Green Version]
  18. Naiman, R.J.; Decamps, H.; McClain, M.E. Riparia: Ecology, Conservation, and Management of Streamside Communities; Elsevier Acad. Press: London, UK, 2005. [Google Scholar]
  19. Balzan, M.V.; Hassoun, A.E.R.; Aroua, N.; Baldy, V.; Bou Dagher, M.; Branquinho, C.; Dutay, J.C.; El Bour, M.; Médail, F.; Mojtahid, M.; et al. Ecosystems. In Climate and Environmental Change in the Mediterranean Basin–Current Situation and Risks for the Future. First Mediterranean Assessment Report; Cramer, W., Guiot, J., Marini, K., Eds.; Union for the Mediterranean, Plan Bleu, UNEP/MAP: Marseille, France, 2020; p. 151. [Google Scholar]
  20. Terrado, M.; Acuna, V.; Ennaanay, D.; Tallis, T.; Sabater, S. Impact of climate extremes on hydrological ecosystem services in a heavily humanized Mediterranean basin. Ecol. Indic. 2014, 37, 199–209. [Google Scholar] [CrossRef]
  21. Rault, P.A.; Koundouri, P.; Akinsete, E.; Ludwig, R.; Huber-Garcia, V.; Tsani, S.; Acuna, V.; Kalogianni, E.; Luttik, J.; Kokg, K.; et al. Down scaling of climate change scenarii to river basin level: A transdisciplinary methodology applied to Evrotas river basin, Greece. Sci. Total Environ. 2019, 660, 1623–1632. [Google Scholar] [CrossRef] [PubMed]
  22. Calbo, J. Possible climate change scenarios with specific reference to Mediterranean regions. In Water Scarcity in the Mediterranean; Sabater, S.D., Barceló, D., Eds.; Springer: Berlin, Germany, 2010; pp. 1–13. [Google Scholar]
  23. Lelieveld, J.; Hadjinicolaou, P.; Kostopoulou, E.; Chenoweth, E.; Maayar, M.; Giannakopoulos, C.; Hannides, C.; Lange, M.A.; Tanarhte, M.; Tyrlis, E.; et al. Climate change and impacts in the Eastern Mediterranean and the Middle East. Clim. Chang. 2012, 114, 667–687. [Google Scholar] [CrossRef] [Green Version]
  24. Belmar, O.; Bruno, D.; Martínez-Capel, F.; Barquín, J.; Velasco, J. Effects of flow regime alteration on fluvial habitats and riparian quality in a semiarid Mediterranean basin. Ecol. Indic. 2013, 30, 52–64. [Google Scholar] [CrossRef]
  25. Leo, M.; Calleja, J.A.; Lara, F.; Garilleti, R.; Medina, N. G: Drivers of plant richness patterns of Mediterranean riparian forests at local and regional scales have bottom-up and top-down effects. J. Veg. Sci. 2019, 30, 485–497. [Google Scholar] [CrossRef]
  26. Zaimes, G.N.; Gounaridis, D.; Symeonakis, E. Assessing the impact of dams on riparian and deltaic vegetation using remotely-sensed vegetation indices and Random Forests modelling. Ecol. Indic. 2019, 103, 630–641. [Google Scholar] [CrossRef]
  27. Garófano-Gomez, V.; Martınez-Capel, F.; Peredo-Parada, M.; Julia, E.; Marın, O.; Munoz, M.R.; Soares Costa, M.R.; Pinar-Arenas, J.L. Assessing hydromorphological and floristic patterns along a regulated Mediterranean river: The Serpis River (Spain). Limnetica 2011, 30, 307–328. [Google Scholar]
  28. Zaimes, G.N.; Iakovoglou, V. Assessing riparian areas of Greece-An overview. Sustainability 2021, 13, 309. [Google Scholar]
  29. Garcia-Martinez, M.A.; Valenzuela-Gonzalez, J.E.; Escobar-Sarria, F.; Lopez-Barrera, F.; Castaño-Meneses, G. The surrounding landscape influences the diversity of leaf-litter ants in riparian cloud forest remnants. PLoS ONE 2017, 12, e0172464. [Google Scholar] [CrossRef]
  30. Magdaleno, F.; Fernández-Yuste, J.A. Evolution of the riparian forest corridor in a large Mediterranean river system. Riparian. Ecol. Conserv. 2013, 1, 36–45. [Google Scholar] [CrossRef]
  31. Mavrommatis, G. The Bioclimate of Greece. Climate and Natural Vegetation Relations, Bioclimate Maps; Institure of Forest Research in Athens: Athens, Greece, 1980. (In Greek) [Google Scholar]
  32. Fischenich, C. Stability Thresholds for Stream Restoration Materials; EMRRP Technical Notes Collection (ERDC TNEMRRP- SR-29); U.S. Army Engineer Research and Development Center: Vicksburg, MS, USA, 2001. [Google Scholar]
  33. Leopold, L.B.; Wolman, M.G.; Miller, J.P.; Wohl, E. Fluvial Processes in Geomorphology, 2nd ed.; Dover Publications: Mineola, NY, USA, 2020. [Google Scholar]
  34. Schumm, S.A.; Harvey, M.D.; Watson, C.C. Incised Channels: Morphology, Dynamics and Control; Water Resources Publications: Littleton, CO, USA, 1984. [Google Scholar]
  35. Quantitative geomorphology of drainage basins and channel networks. In Handbook of Applied Hydrology; Chow, V.T. (Ed.) McGraw-Hill: New York, NY, USA, 1954; pp. 4.40–4.74. [Google Scholar]
  36. Harrelson, C.; Rawlins, C.; Potyondy, J. Stream Channel References Sites: An Illustrated Guide to Field Technique; U.S. Department of Agriculture, Forest Service, Rocky Mountain Forest and Range Experiment: Fort Collins, CO, USA, 1994. [Google Scholar]
  37. Magdaleno, F.; Martinez, R. Evaluating the quality of riparian forest vegetation: The riparian forest evaluation (RVF) index. Forest Syst. 2014, 23, 259–272. [Google Scholar] [CrossRef] [Green Version]
  38. Arabatzis, T. Shrubs and Trees in Greece Vol 1; Technological Educational Institute of Kavala: Drama, Greece, 1998. [Google Scholar]
  39. Arabatzis, T. Shrubs and Trees in Greece Vol 2; Technological Educational Institute of Kavala: Drama, Greece, 2002. [Google Scholar]
  40. Stefanatos, A. Trees and Shrubs of Forests in Eastern Macedonia and Thrace; Prefecture of Kavala: Kavala, Greece, 2009. [Google Scholar]
  41. Zogaris, S.; Hatzivarsanis, V.; Economou, A.N.; Hatzinikolaou, Y.; Giakoumi, S.; Dimopoulos, N. Riparian Zones in Greece: Protecting Riverine Oasis of Life; HCMR & IIM: Athens, Greece, 2007. [Google Scholar]
  42. Munné, A.; Prat, N.; Solà, C.; Bonada, N.; Rieradevall, M. A simple field method for assessing the ecological quality of riparian habitat in rivers and streams: QBR index. Aquat. Conserv. 2003, 13, 147–163. [Google Scholar] [CrossRef]
  43. Mullen, K.; O’Halloran, J.; Breen, J.; Giller, P.; Pithon, J.; Kelly, T. Distribution and composition of carabid beetle (Coleoptera, Carabidae) communities across the plantation forest cycle—Implications for management. For. Ecol. Manag. 2008, 256, 624–632. [Google Scholar]
  44. Yu, X.; Luo, T.; Zhou, H. Habitat associations and seasonal activity of carabid beetles (Coleoptera: Carabidae) in Dongling Mountain, North China. Entomol. Fenn. 2006, 17, 174–183. [Google Scholar] [CrossRef] [Green Version]
  45. Heliola, J.; Koivula, M.; Niemela, J. Distribution of carabid beetles (Coleoptera, Carabidae) across a boreal forest–clearcut ecotone. Conserv. Biol. 2001, 15, 370–377. [Google Scholar] [CrossRef]
  46. Bellmann, H. Welches Insekt ist das? 2nd ed.; Franckh Kosmos Editions: Stuttgart, Germany, 2011. [Google Scholar]
  47. Bellmann, H. Der neue Kosmos-Insektenführer, 2nd ed.; Franckh Kosmos Editions: Stuttgart, Germany, 2009. [Google Scholar]
  48. Chinery, M. Pareys Buch der Insekten, 2nd ed.; Franckh Kosmos Editions: Stuttgart, Germany, 2012. [Google Scholar]
  49. Simpson, E.H. Measurement of diversity. Nature 1979, 163, 688. [Google Scholar] [CrossRef]
  50. Shannon, C.E.; Weaver, W. A mathematical theory of communication. Bell. Syst. Tech. J. 1948, 27, 379–423. [Google Scholar] [CrossRef] [Green Version]
  51. Katusiime, J.; Schütt, B. Integrated Water Resources Management Approaches to Improve Water Resources Governance. Water 2020, 12, 3424. [Google Scholar] [CrossRef]
  52. Zaimes, G.N.; Emmanouloudis, D. Sustainable Management of the Freshwater Resources of Greece. J. Eng. Sci. Technol. 2012, 5, 77–82. [Google Scholar] [CrossRef]
  53. Yani, D.A.; Bisri, M.; Montarcih Limantara, L.; Suhartanto, E. Model flood peak discharge based on the watershed shape factor. Int. J. Civ. Eng. Technol. 2018, 9, 906–917. [Google Scholar]
  54. Zaimes, G.N.; Tardio, G.; Iakovoglou, V.; Gimenez, M.; Garcia-Rodriguez, J.L.; Sangalli, P. New tools and approaches to promote soil and water bioengineering in the Mediterranean. Sci. Total Environ. 2019, 693, 133677. [Google Scholar] [CrossRef] [PubMed]
  55. Kaufmann, P.R.; Larsen, D.P.; Faustini, J.M. Bed stability and sedimentation associated with human disturbances in Pacific Northwest streams. J. Am. Water Resour. Assoc. 2009, 45, 434–459. [Google Scholar] [CrossRef]
  56. Mishra, A.; Alnahit, A.; Campbell, B. Impact of land uses, drought, flood, wildfire, and cascading events on water quality and microbial communities: A review and analysis. J. Hydrol. 2021, 596, 125707. [Google Scholar] [CrossRef]
  57. Bombino, G.; Gurnell, A.M.; Tamburino, V.; Zema, D.A.; Zimbone, S.M. Sediment size variation in torrents with check dams: Effects on riparian vegetation. Ecol. Eng. 2008, 1, 166–177. [Google Scholar] [CrossRef]
  58. Itsukushim, R. Influence of stream channel characteristics on bed morphology and step–pool structure in a rhyolitic headstream watershed. Catena 2021, 204, 105427. [Google Scholar] [CrossRef]
  59. Stella, J.C.; Riddle, J.; Piégay, H.; Gagnage, M.; Trémélo, M.-L. Climate and local geomorphic interactions drive patterns of riparian forest decline along a Mediterranean Basin river. Geomorphology 2013, 202, 101–114. [Google Scholar] [CrossRef]
  60. Chapman, J.M.; Proulx, C.L.; Veilleux, M.A.N.; Levert, C.; Bliss, S.; André, M.; Lapointe, N.W.R.; Cooke, S.J. Clear as mud: A meta-analysis on the effects of sedimentation on freshwater fish and the effectiveness of sediment-control measures. Water Res. 2014, 56, 190–202. [Google Scholar] [CrossRef] [PubMed]
  61. Wilcock, P.R. The components of fractional transport rate. Water Resour. Res. 1997, 33, 247–258. [Google Scholar] [CrossRef]
  62. Owens, P.N.; Batalla, R.J.; Collins, A.J.; Gomez, B.; Hicks, D.M.; Horowitz, A.J.; Kondolf, G.M.; Marden, M.; Page, M.J.; Peacock, D.H.; et al. Fine-grained sediment in river systems: Environmental significance and management issues. River. Res. Appl. 2005, 21, 693–717. [Google Scholar] [CrossRef]
  63. Finnegan, N.J.; Roe, G.; Montgomery, D.R.; Hallet, B. Controls on the channel width of rivers: Implications for modeling fluvial incision of bedrock. Geology 2005, 33, 229–232. [Google Scholar] [CrossRef] [Green Version]
  64. Zaimes, G.N.; Tufekcioglu, M.; Schultz, R.C. Riparian land-use impacts on stream bank and gully erosion in agricultural watersheds: What we have learned. Water 2019, 11, 1343. [Google Scholar] [CrossRef] [Green Version]
  65. Skoulikidis, N.T.; Karaouzas, I.; Amaxidis, Y.; Lazaridou, M. Impact of EU environmental policy implementation on the quality and status of Greek rivers. Water 2021, 13, 1858. [Google Scholar] [CrossRef]
  66. Fonseca, A.; Ugille, J.-P.; Michez, A.; Rodríguez-González, P.M.; Duarte, G.; Ferreira, M.T.; Fernandes, M.R. Assessing the Connectivity of Riparian Forests across a Gradient of Human Disturbance: The Potential of Copernicus “Riparian Zones” in Two Hydroregions. Forests 2021, 12, 674. [Google Scholar] [CrossRef]
  67. Latsiou, A.; Kouvarda, T.; Stefanidis, K.; Papaioannou, G.; Gritzalis, K.; Dimitriou, E. Pressures and status of the riparian vegetation in Greek Rivers: Overview and preliminary assessment. Hydrology 2021, 8, 55. [Google Scholar] [CrossRef]
  68. Kasapidis, K.; Giatas, G.; Pagonis, G.; Kiourtziadis, P.; Iakovoglou, V.; Zaimes, G.N. Assessing mountainous riparian areas of North Greece adjacent to forested and rural areas with the use of GIS, SVAP and QBR. In Proceedings of the Sixth International Conference on Environmental Management, Engineering, Planning & Economics, Thessaloniki, Greece, 25–30 June 2017; pp. 1167–1178. [Google Scholar]
  69. Zogaris, S.; Chatzinikolaou, Y.; Dimopoulos, P. Assessing environmental degradation of montane riparian zones in Greece. J Envrion. Biol. 2009, 30, 719–726. [Google Scholar]
  70. Bruno, D.; Belmar, O.; Sánchez-Fernández, D.; Guareschi, S.; Millán, A.; Velasco, J. Responses of Mediterranean aquatic and riparian communities to human pressures at different spatial scales. Ecol. Indic. 2014, 45, 456–464. [Google Scholar] [CrossRef]
  71. Rouabah, A.; Villerd, J.; Amiaud, B.; Plantureux, S.; Lasserre-Joulin, F. Response of carabid beetles diversity and size distribution to the vegetation structure within differently managed field margins. Agric. Ecosyst. Environ. 2015, 200, 21–32. [Google Scholar] [CrossRef]
  72. Perry, K.I.; Herms, D.A. Dynamic responses of ground-dwelling invertebrate communities to disturbance in forest ecosystems. Insects 2019, 10, 61. [Google Scholar] [CrossRef] [PubMed] [Green Version]
  73. Xiao, H.; Du, C.; Yuan, Y.; Li, B. Multiple floods affect composition and community structure of the ground-dwelling arthropods in the riparian zone of the Three Gorges Reservoir. Ecol. Indic. 2020, 113, 106220. [Google Scholar] [CrossRef]
  74. Skalski, T.; Kędzior, R.; Radecki-Pawlik, A. Riparian ground beetles in gravel bed rivers: Validation of Invertebrate Bankfull Assessment method. Sci. Total Environ. 2020, 707, 135572. [Google Scholar] [CrossRef]
  75. Baker, S.; Richardson, A.; Barmuta, L. Site effects outweigh riparian influences on ground-dwelling beetles adjacent to first order streams in wet eucalypt forest. Biodivers. Conserv. 2007, 16, 1999–2014. [Google Scholar] [CrossRef]
  76. Idris, N.S.; Mustapha, M.A.; Sulaiman, N.; Khamis, S.; Husin, S.M.; Darbis, N.D.A. The dynamics of landscape changes surrounding a firefly ecotourism area. Glob. Ecol. Conserv. 2021, 29, e01741. [Google Scholar] [CrossRef]
  77. Vidal-Abarca Gutiérrez, M.R.; Suárez Alonso, M.L. Which are, what is their status and what can we expect from ecosystem services provided by Spanish rivers and riparian areas? Biodivers. Conserv. 2013, 22, 2469–2503. [Google Scholar] [CrossRef]
Figure 1. The Rhodopi Mountain Range National Park (red line), the studied sub-watersheds (blue line) and two major dams (yellow dots) along Nestos River in Northern Greece (source: google earth) (a). The two studied watersheds (red line) of Vathirema (VTR) (b) and Arkoudorema (ADR) (c) with their stream network (green lines) and sampling stations (green dots).
Forests 12 01284 g001
Figure 2. The elevation maps of the studied sub-watersheds: (a) Arkoudorema (ADR) and (b) Vathirema (VTR) along with the sampling stations (green dots).
Forests 12 01284 g002
Figure 3. (a) Comparison of total particle size cumulative curves in Arkoudorema (ADR) and Vathirema (VTR). The cumulative percentage of the different size of the stream bed material for the 6 sampling stations in the ADR (b) and the 4 sampling stations for the VTR (c).
Forests 12 01284 g003
Figure 4. The riparian forest quality (QBR) protocol values for the (a) ADR and (b) the VTR sampling stations. The blue column indicates that the station is in natural condition, the green in good condition, the yellow in satisfactory condition and the orange in not satisfactory condition.
Forests 12 01284 g004
Figure 5. The riparian forest evaluation (RFV) protocol values for the (a) ADR and (b) the VTR sampling stations. The blue column indicates that the stations is in very good condition, the green in good condition, the yellow in moderate condition and the orange in poor condition.
Forests 12 01284 g005
Figure 6. The ground-dwelling species composition in (a) Vathirema (VTR) and (b) Arkoudorema (ADR).
Forests 12 01284 g006
Figure 7. The Shannon–Wiener diversity index for all sampling station where insects were collected for Arkoudorema (ADR) (blue column) and Vathirema (VTR) (orange column).
Forests 12 01284 g007
Figure 8. The Shannon–Wiener (a) and Simpson (b) diversity index for all three riparian sampling stations where insects were collected for Arkoudorema (ADR) (blue column) and Vathirema (VTR) (orange column).
Forests 12 01284 g008
Figure 9. The Shannon–Wiener diversity index for the different habitats (bankfull, riparian and terrestrial) where insects were collected for Arkoudorema (ADR) (blue column) and Vathirema (VTR) (orange column).
Forests 12 01284 g009
Table 1. The type of measurements taken at each sampling station of the two studied sub-watersheds. The elevation at each sampling stations is also provided, and an X indicates the type of measurements taken at each station.
Sampling StationElevation (m)Fluvio-Geomorphologic Meas.Riparian Veget. EvaluationInsect Traps
QBR 1RFV 2Vegetation
Arkoudorema (ADR)
ADR 1144XXXX
ADR 2168XXXX
ADR 3247XXXXX
ADR 4375XXXXX
ADR 5462XXXX
ADR 61092XXXXX
ADR 71419X X
Vathirema (VTR)
VTR 1406XXXX
VTR 2458XXXXX
VTR 3505XXXXX
VTR 4625XXXX
VTR 5924XXXX
VTR 61191XXXXX
VTR 71357X X
1 riparian forest quality; 2 riparian forest evaluation.
Table 2. The fluvio-geomorphometric parameters derived for each of the studied sub-watersheds.
ParametersUnitArkoudoremaVathirema
Watershed
Areakm2284.6201.0
Perimeterkm93.075.5
Max elevationm17611825
Min elevationm131335
Mean altitudem11421160
Reliefm16301550
Slope max%9884
Slope min%0.0160.002
Slope mean%2215
Lengthkm37.535.3
Shapekm2/km20.050.06
Roundness degreekm2/km3.12.7
Stream
Total lengthkm1180.6793.5
Drainage densitykm/km24.13.9
Shreve stream order-32711688
Strahler stream order-76
Ruggednesskm km/km26.65.9
Relief ratiokm/km43.542.8
Relative stream powerkm212.48.6
Table 3. Water surface width (WSW) and bankfull width (BW) values and the stream bank slope characterization at the sampling stations of Arkoudorema (ADR) and Vathirema (VTR) sub-watersheds.
Sampling StationStrahler OrderWater Surface Width (m)Bankfull Width (m)Bank Slope Category
LeftRightLeftRight
ADR 1722.40n/m *n/m *31
ADR 2720.20n/m *n/m *32
ADR 3714.702.021.223
ADR 4610.801.00.513
ADR 5617.955.05.012
ADR 635.300.30.533
ADR 733.700.30.433
VTR 169.601.41.023
VTR 2612.8011.11.023
VTR 3614.20n/m *n/m *22
VTR 469.802.50.823
VTR 567.901.70.333
VTR 654.600.71.033
VTR 742.300.30.433
* Not possible to measure due to topography or stream flow restrictions.
Table 4. The dominant and subdominant trees, shrubs and forest habitat types of the riparian zone at each station. In addition, the dominant tree species of the terrestrial zone are presented.
Sampling StationRiparian ZoneTerrestrial ZoneForest Habitat Type (NATURA 2000 Code)
DominantSubdominantShrubs
VTR 1Alnus glutinosa L.Malus dasyphylla Borkh.Rubus sanctus Schreb.Quercus robur L.Alno-Pandion, Alnion incanae, Salicion Albae (91EO)
Corylus avellana L.Salix sp.
Fraxinus ornus L.
VTR 2Alnus glutinosaMalus dasyphylla Quercus roburAlno-Pandion, Alnion incanae, Salicion Albae (91EO)
Corylus avellanaOstrya carpinifolia
Carpinus betulus L.Populus × canadensis
VTR 3Alnus glutinosaCornus sanguinea L. Carpinus orientalis Mill.Alno-Pandion, Alnion incanae, Salicion Albae (91EO)
Carpinus betulusJuglans regia L.
Salix sp.
VTR 4Ostrya carpinifolia Scop.Cornus mas L. Fagus sylvaticaAlno-Pandion, Alnion incanae, Salicion Albae (91EO)
Corylus avellana Carpinus orientalis
Alnus glutinosa
VTR 5Fagus sylvatica L.Corylus avellana Pinus sylvestrisAsperulo-Fagetum beech forests (9130)
Picea abies Carpinus orientalis
Salix alba Quercus robur
VTR 6Pinus sylvestris L.Populus tremula L.Rosa tomentosa Sm.Pinus sylvestrisRhodopide and Balkan Range Scots pine forests (91CA)
Picea abies L. H. Karst.Betula pendula Roth.
Corylus avellana
Salix alba
Fagus sylvatica
VTR 7Pinus sylvestrisSalix caprea L.Salix elaeagnos Scop.Pinus sylvestrisRhodopide and Balkan Range Scots pine forests (91CA)
Picea abies Picea abies
Abies borisii-regis Mattf. Abies borisιi -regis
Alnus glutinosaCornus sanguinea L. Carpinus orientalis
ADR 1Salix alba L.Alnus glutinosaSalix purpurea L. Salix alba and Populus alba galleries (92A0)
Platanus orientalis L.Salix cinerea L.
Salix elaeagnos
Rubus sanctus
ADR 2Alnus glutinosaPaliurus spina-christi Mill.Salix elaeagnos Alno--Pandion, Alnion incanae, Salicion Albae (91EO)
Robinia pseudoacacia L.
ADR 3Salix spPrunus spinosa L.Hedera helix L.Carpinus orientalisAlnon Pandion, Alnion incanae, Salicion Albae (91EO)
Alnus glutinosaCornus masRubus sanctusQuercus robur
Ostrya carpinifoliaRosa tomentosa
Juglans regia
Ficus carica L.
Paliurus spina-christi
ADR 4Alnus glutinosaRobinia pseudoacaciaSalix eleagnosCarpinus orientalisAlno-Pandion, Alnion incanae, Salicion Albae (91EO)
Carpinus orientalisCornus masSalix cinereaQuercus robur
Ostrya carpinifoliaJuglans regiaRubus sanctus
Coryllus avellanaRosa tomentosa
Tilia cordata Mill.
Fraxinus excelsior L.
ADR 5Alnus glutinosaSalix alba Quercus roburAlno-Pandion, Alnion incanae, Salicion Albae (91EO)
Fraxinus ornus L. Carpinus orientalis
Cornus mas
Acer pseudoplatanus L.
Corylus avellana
Juglans regia
Malus sp.
Cornus sanguinea L.
Crategus monogyna Jacq.
ADR 6Fagus sylvaticaCorylus avellana Fagus sylvaticaAsperulo-Fagetum beech forests (9130)
ADR 7Pinus sylvestrisFagus sylvatica Pinus sylvestrisRhodopide and Balkan Range Scots pine forests (91CA)
Picea abiesJuniperus communis L. Picea abies
Abies borisii -regis Abies borisii -regis
Pinus sylvestrisFagus sylvatica Pinus sylvestris
Publisher’s Note: MDPI stays neutral with regard to jurisdictional claims in published maps and institutional affiliations.