Article

Quantifying Drought Resistance of Drylands in Northern China from 1982 to 2015: Regional Disparity in Drought Resistance

by
Maohong Wei
1,
Hailing Li
1,
Muhammad Adnan Akram
1,2,
Longwei Dong
1,
Ying Sun
1,
Weigang Hu
1,
Haiyang Gong
1,
Dongmin Zhao
1,
Junlan Xiong
1,
Shuran Yao
1,
Yuan Sun
1,
Qingqing Hou
1,
Yahui Zhang
1,
Xiaoting Wang
1,
Shubin Xie
1,
Yan Deng
1,
Liang Zhang
1,
Abraham Allan Degen
3,
Jinzhi Ran
1 and
Jianming Deng
1,*
1
State Key Laboratory of Grassland Agro-Ecosystem, School of Life Sciences, Lanzhou University, Lanzhou 730000, China
2
School of Economics, Lanzhou University, Lanzhou 730000, China
3
Desert Animal Adaptations and Husbandry, Wyler Department of Dryland Agriculture, Blaustein Institutes for Desert Research, Ben-Gurion University of Negev, Beer Sheva 8410500, Israel
*
Author to whom correspondence should be addressed.
Forests 2022, 13(1), 100; https://doi.org/10.3390/f13010100
Submission received: 29 November 2021 / Revised: 31 December 2021 / Accepted: 6 January 2022 / Published: 11 January 2022
(This article belongs to the Section Forest Ecology and Management)

Abstract

:
Drylands are expected to be affected by greater global drought variability in the future; consequently, how dryland ecosystems respond to drought events needs urgent attention. In this study, the Normalized Vegetation Index (NDVI) and Standardized Precipitation and Evaporation Index (SPEI) were employed to quantify the resistance of ecosystem productivity to drought events in drylands of northern China between 1982 and 2015. The relationships and temporal trends of resistance and drought characteristics, which included length, severity, and interval, were examined. The temporal trends of resistance responded greatest to those of drought length, and drought length was the most sensitive and had the strongest negative effect with respect to resistance. Resistance decreased with increasing drought length and did not recover with decreasing drought length in hyper-arid regions after 2004, but did recover in arid and semi-arid regions from 2004 and in dry sub-humid regions from 1997. We reason that the regional differences in resistance may result from the seed bank and compensatory effects of plant species under drought events. In particular, this study implies that the ecosystem productivity of hyper-arid regions is the most vulnerable to drought events, and the drought–resistance and drought–recovery interactions are likely to respond abnormally or even shift under ongoing drought change.

1. Introduction

Increased drought events due to rising global temperatures has caused worldwide concern, even though droughts can be mitigated by fluctuations of precipitation [1,2,3]. In fact, an alleviating trend of droughts has been recorded in some regions, including some drylands, in the last decade [4,5,6,7,8]. Such fluctuations in droughts, that is, prolonged increases in droughts followed by an alleviation, provides the basis for a natural study in predicting the response of ecosystems to drought events [9]. Drylands were generally characterized by “long-lasting drought”, with typically unpredictable precipitation and high air temperatures [10,11]. Since greater drought variability is expected in the coming century [12,13,14], understanding the resistance of dryland ecosystems to drought events in a long-term time series is crucial in predicting the response of dryland ecosystems to droughts [15,16].
Drought resistance indicates the ability of an ecosystem to remain close to its undisturbed state under drought events, and is usually applied to quantify the impact of droughts on ecosystem functions, such as productivity and plant biomass allocation [17,18,19,20,21]. In fact, the temporal and spatial patterns of drought resistance also reflect indirectly the changes of population dynamics and community structure with drought stress [22,23,24,25,26]. The increasing drought events have resulted in considerable damage to the stability of ecosystems and, thus, their resistance, and the resulting ecological consequences has varied considerably across continental regions. For example, droughts occurring once every 5 to 10 years in the Amazon since 2005 have resulted in permanent changes in vegetation cover, severe drought has destroyed rainforest greenery permanently in the Congo, and a 17-month drought caused a 40% decline in productivity within tropical rainforests [27,28,29]. Despite recurring or severe drought events, ecosystems in most regions tended to remain relatively stable [30,31,32,33]. However, drylands, comprising hyper-arid, arid, semi-arid, and dry sub-humid ecosystems, may differ greatly in their resistance to drought events [34].
It remains unknown, however, whether resistance increases or decreases with alleviated droughts in drylands, as the response of ecosystem productivity to drought may depend on drought stress from previous years [35,36,37,38]. If previous droughts have caused xylem damage in plants, seed bank depletion, and massive loss of functionally similar plant species, resistance will not recover and may continue to decrease, even under relatively favorable conditions, due to impairments in the ecosystem water use efficiency [9,39,40]. Conversely, if previous droughts caused seed dormancy and loss of a small number of species, but the loss was compensated by functionally similar species, resistance should recover rapidly when conditions improve [31,41,42,43]. These two scenarios have distinct effects on the stability of ecosystem productivity. The former can potentially drive abnormal responses or even shifts within drought–resistance interactions, which can lead to the impairment of ecosystem functions [24,44,45]. As a result, increased drought variability in drylands may be a considerable threat in the future.
During the past several decades, there have been frequent drought events in the drylands of northern China under global climate change. This study examined the resistance of ecosystem productivity to these events between 1982 and 2015. The following questions were addressed: (1) were the temporal trends in drought characteristics and in drought resistance consistent across the drylands of northern China during the past 34 years, and did the trends differ among regions of different aridity levels? (2) which variable, among drought length, severity, and interval, had the strongest impact on resistance in different regions?

2. Materials and Methods
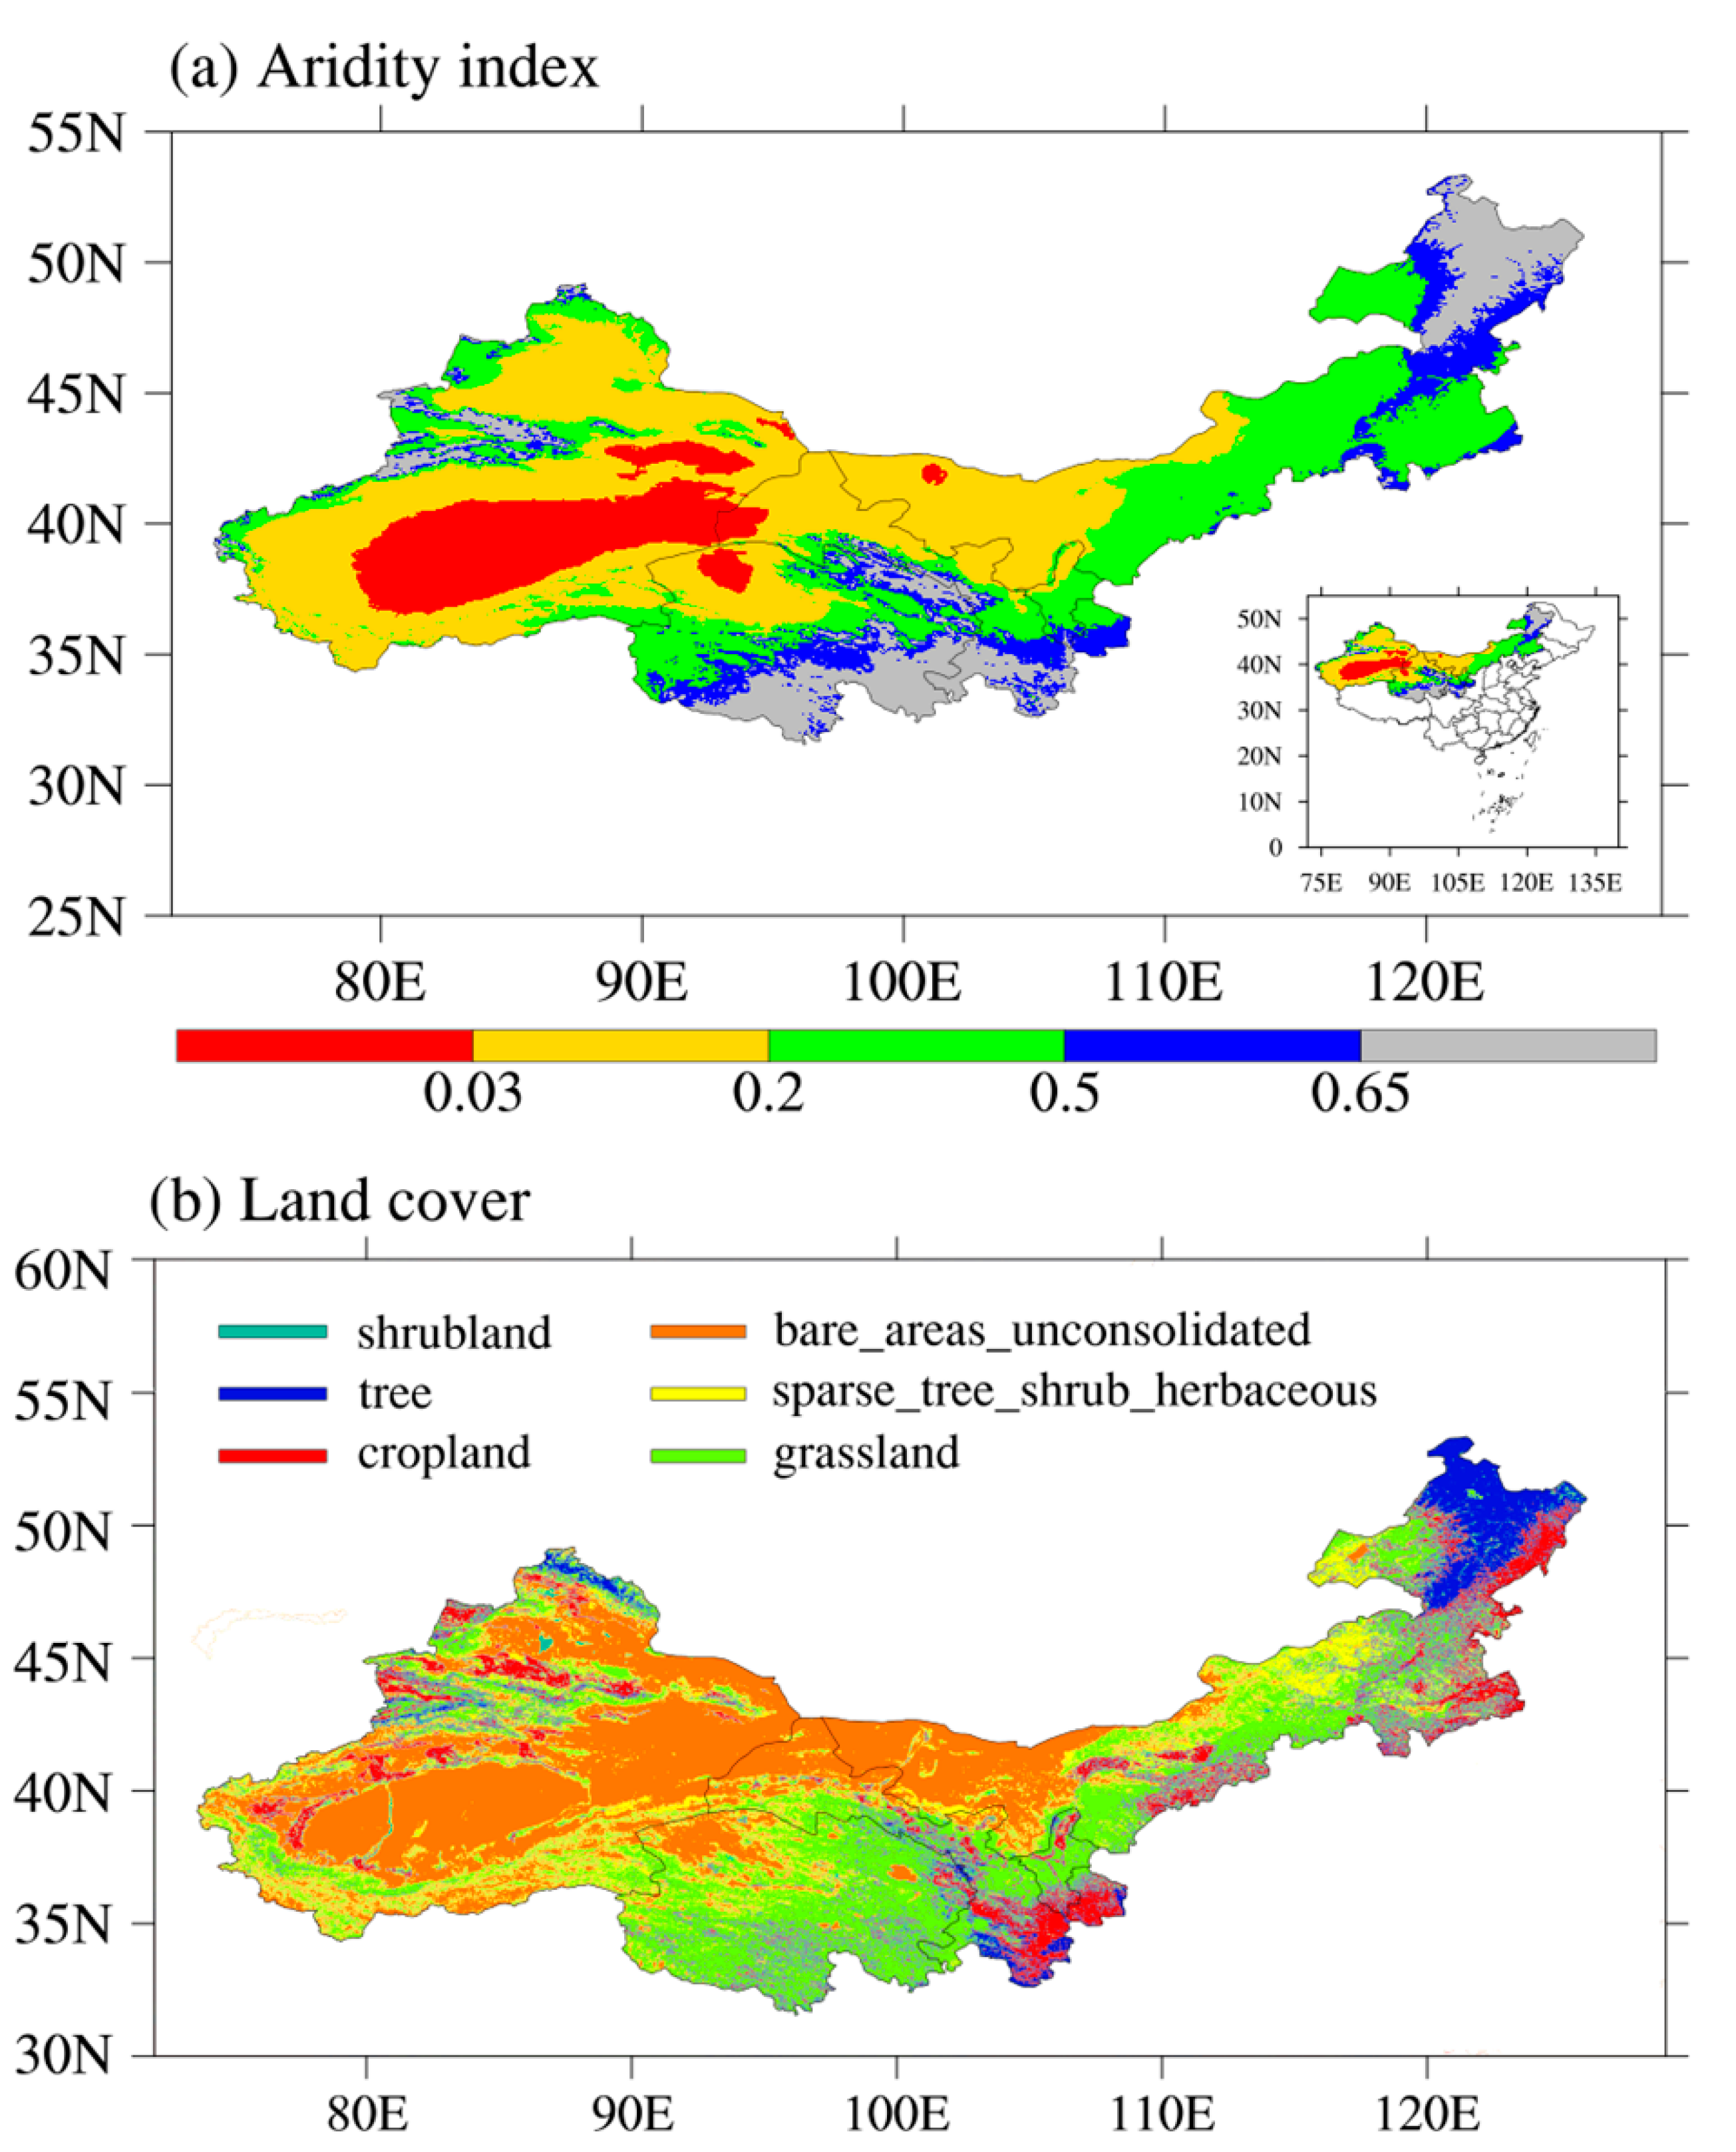
2.1. Study Area

Data for the study were collected in temperate continental drylands in northern China (Figure 1). Grasslands and deserts were the major ecosystems in this region, and the vegetation growing season was from May to September, with maximum biomass in August [46,47]. The mean annual air temperature (MAT) ranged from −29.4 to 15.3 °C, and mean annual precipitation (MAP) ranged from 9 to 795 mm. The aridity index (AI, the ratio of mean annual precipitation to mean annual potential evapo-transpiration) ranged from 0.0084 to 0.65, and included hyper-arid (AI < 0.03), arid (0.03 ≤ AI < 0.20), semi-arid (0.20 ≤ AI < 0.50), and dry sub-humid (0.50 ≤ AI < 0.65) regions [48]. Plant species richness and vegetation cover increased, and vegetation type shifted from desert to grassland with increasing AI; hyper-arid and arid regions had mostly desert vegetation, and semi-arid and dry sub-humid regions had mostly grassland vegetation [49].

2.2. GIMMS NDVI3g Dataset

The GIMMS NDVI3g dataset (https://ecocast.arc.nasa.gov (accessed on 25 July 2021)), published by the National Aeronautics and Space Administration (NASA), was officially corrected and error-processed to ensure quality [50,51]. The 1/12° × 1/12° spatial resolution dataset was applied continuously due to its long time series, which spanned from 1982 to 2015, with 15-day intervals. The GIMMS NDVI was correlated significantly with the MODIS NDVI, which had a higher spatial resolution, but GIMMS NDVI was proven to be more accurate than MODIS NDVI in drylands [52,53,54]. In this study, an annual maximum NDVI (NDVImax) was used to indicate ecosystem productivity [18,33,47,55].

2.3. Identifying Drought Events

The standardized precipitation evapo-transpiration index (SPEI), a site-specific monthly drought indicator based on deviations from the average water balance during a given number of months, was used to identify drought events [43,56]. We extracted SPEI values from the SPEIbase raster files (available from http://sac.csic.es/spei (accessed on 25 July 2021)) from 1901 to 2015, with a temporal interval of one month and a spatial resolution of 0.5° × 0.5°. First, the difference between monthly precipitation and potential evapo-transpiration was calculated to represent the water surplus or deficit for a given month. The calculated difference values were then added together based on a given integration timescale, such as a continuous 12-month period, which indicated the cumulative water deficit or surplus during the preceding 12 months. Here, the integration timescale did not measure drought length; rather, it quantified the aggregated hydrologic state [57]. The SPEI of 12 months or longer integration timescales were more suitable for analyzing drought temporal trends and singling out drought events [43,58]. Finally, the aggregation values were normalized using a three-parameter log–logistic distribution to represent the SPEI, where values less than −1 indicated dryness [56].
SPEI, with a 12-month integration timescale (SPEI-12), was used because: (1) of the possibility to single out drought events; (2) plant seed germination was controlled mainly by the SPEI-12; and (3) primary productivity responded to annual water balances, especially in drylands [32,43,56,58]. To match the time span and spatial resolution of NDVImax and SPEI-12, SPEI-12 was extracted between 1982 and 2015, and NDVImax and SPEI-12 were resampled to a 0.1° × 0.1° resolution by bilinear interpolation using the function “linint2_points” in NCAR Command Language (NCL) [59].
A drought event was identified by two processes: (1) an SPEI-12 of less than −1 for at least 3 months during the growing season (May–September) [57]. The consecutive months were also set at 2, 4, 5, and 6 to determine the robustness of resistance to drought characteristics. SPEI-12 in March–August was used because NDVI reached a maximum in August, and the drought event in May could only be identified when the SPEI-12 included March. SPEI-12 during the non-growing season was not considered because the highest correlations between drought events and vegetation response occurred in the growing season [32,43,60]. In addition, the non-growing season was the dormant period for plants, which caused only a small impact on NDVImax, and taking it into account could result in erroneous information; (2) multiple drought events of less than 3 intervening years were integrated into a single drought event, considering the potential lag effects of drought and ensuring a recovery time of at least 3 years after a drought event [34,61]. It was considered a drought year if there was a drought event in that year.
Drought characteristics included drought length, severity, and interval. Drought length was the cumulative number of months in a drought event, in which SPEI was less than −1 for 3 consecutive months during the growing season [57]. Drought severity was the mean SPEI-12 value during the cumulative number of months, in which a larger value of SPEI corresponded to a smaller drought intensity by the calculation principle of SPEI [56]. Drought interval was the number of years between two consecutive drought events [57]. By definition, drought intensity increased with increasing drought length and decreased with increasing drought severity and interval.

2.4. Quantifying Resistance

Resistance indicated the ability of an ecosystem to remain close to a reference state under drought events and was used to assess the effects of drought on the ecosystem [62]. The reference state refers to the undisturbed state of the ecosystem, which included pre-disturbance, post-disturbance, and normal states [30,34,63]. Given the frequent drought events in the drylands of northern China, it was possible to confound pre-drought and post-drought states. Thus, the reference state is represented by the mean NDVImax for normal years in the present study. Resistance (Equation (1)) is calculated as follows [34]:
Ω = Y e Y ¯
where Ω = resistance, Y e = the minimum NDVImax during a drought event, and Y ¯ = the mean NDVImax for all eligible normal years. Normal years were all non-drought years, except for some years in which the NDVImax was less than the mean NDVImax in drought years. As resistance (Ω) increased, the ecosystem was more resistant to drought events. Resistance greater than or equal to 1, that is, an NDVImax during a drought event that was greater than or equal to the NDVImax under normal years, indicated that the drought event did not result in a decrease in NDVImax, and the ecosystem was completely resistant to the drought event. Resistance of less than 1 indicated that the drought event resulted in a decrease in NDVImax, and the ecosystem was not completely resistant to the drought event [13].

2.5. Data Analysis

Pearson correlation was used to test the relationships between resistance and drought characteristics. Linear ordinary least-squares (OLS) regressions and multinomial regressions were used to identify changes in resistance with increasing drought intensity. A one-way analysis of variance was used to test differences of drought intensity in complete (resistance ≥ 1) or incomplete (resistance < 1) resistance. Wavelet analysis was employed to check the quasi-periodicity in resistance and drought characteristics and to assess whether the quasi-periodicity changed abruptly between 1982 and 2015. In contrast to the regular recurring state of periodicity, quasi-periodicity displays a pattern of recurrence but is not strictly regular, such as the interannual variation of precipitation [64,65].
Wavelet analysis can be used to break down a time series into time/frequency space simultaneously and, thus, allow estimation of the spectral characteristics, revealing how its different periodic components change during a time series [66,67]. Wavelet analysis has been used widely to analyze the volatility and periodicity of climate and vegetation variables during a time series, and also to identify irregular precipitation, warming air temperature, and vegetation changes [68,69,70,71].
Wavelet analysis used the “wavelet” function in NCAR Command Language (NCL) (https://www.ncl.ucar.edu/ (accessed on 25 July 2021)), in which the function calculated the wavelet transform of a time series and significance levels. In this study, 11 parameters, y, mother, param, dt, s0, dj, jtot, npad, noise, isigtest, and siglvl, were needed, where y indicated resistance or drought characteristics for each year from 1982 to 2015; mother = 0 and param = 0 meant to use the most popular “Morlet” wavelet. The default values were used for all other parameters, that is, dt = 1 meant 1 year for the amount of time between each y value; s0 = 2 meant 2 years for the smallest scale of the wavelet; dj = 0.01 meant 0.01 years for space between discrete scales; jtot = floattointeger(((log10(n*dt/s0))/dj)/log10(2.0)) + 1 meant the number of scales; npad = 34 meant 34 years for the total number of years about wavelet transform; noise = 0 meant use a white noise background for significance testing; isigtest = 0 meant do a regular chi-square test; siglvl = 0.95 meant 0.05 significance level.
All analyses used NCL 6.5.0.

3. Results

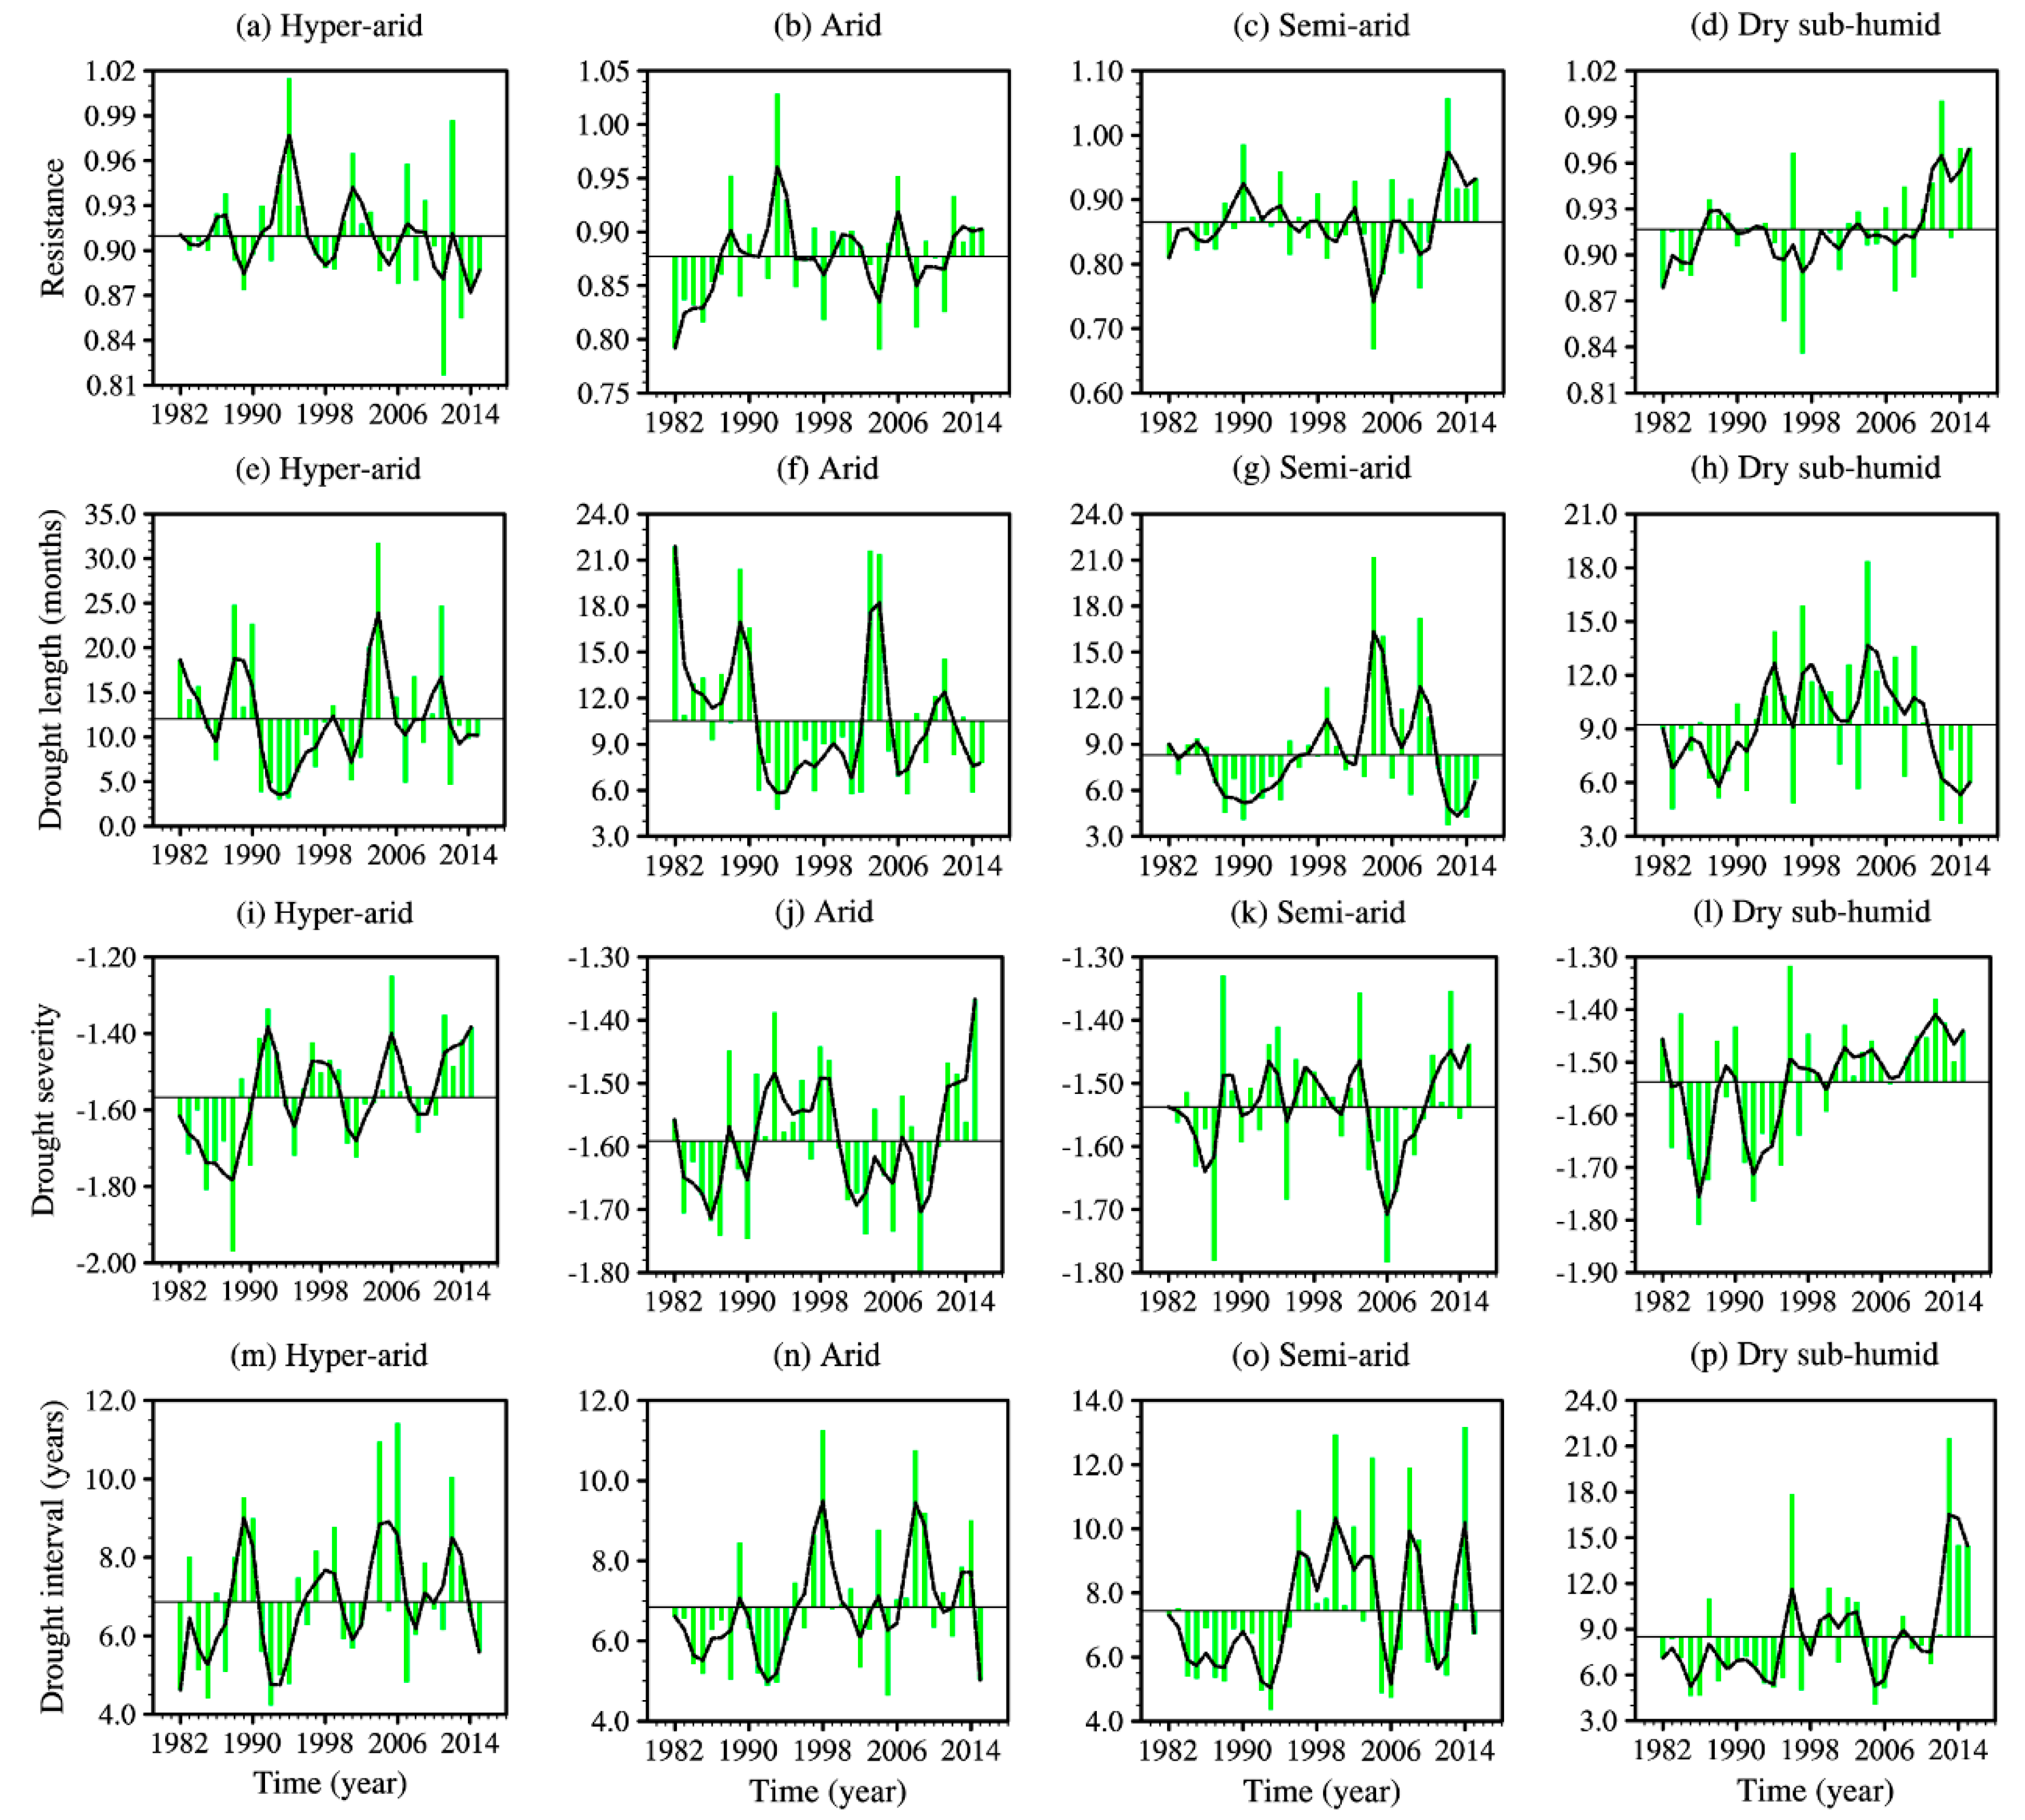
3.1. Temporal Trends in Resistance and Drought Characteristics

In hyper-arid regions, resistance displayed an upward trend from 1982 to 1994, but a downward trend from 1994 to 2015 (Figure 2a). The strongest quasi-periodicity of resistance was for about 8 years between 1982 and 2006, but this declined abruptly to 2 years between 2006 and 2015 (Figure 3a). In arid, semi-arid, and dry sub-humid regions, resistance exhibited rising, falling, and then rising trends between 1982 and 2015. A second period of increasing resistance occurred between 2004 and 2015 in arid and semi-arid regions, and between 1997 and 2015 in dry sub-humid regions (Figure 2b–d). The strongest quasi-periodicity of resistance was about 7 years in arid regions, about 17, 11, or 5 years in semi-arid regions, and about 11 or 2 years in dry sub-humid regions (Figure 3b–d).
Drought intensity increased with increasing drought length and decreased with increasing drought severity and interval, while resistance displayed an opposite trend with drought intensity between 1982 and 2015 (Figure 2). For drought length, severity, and interval, the temporal trends of resistance responded greatest to drought length, that is, with a greater resistance corresponding to a shorter drought length. Temporal trends of drought length matched those of resistance between 1982 and 2004 in hyper-arid regions, and between 1982 and 2015 in arid, semi-arid, and dry sub-humid regions (Figure 2a–h). Drought length and resistance exhibited different strongest quasi-periodicity in hyper-arid regions, but the same strongest quasi-periodicity in arid, semi-arid, and dry sub-humid regions between 1982 and 2015 (Figure 3a–h). Temporal trends in drought severity and interval matched temporal trends in resistance in partial periods (Figure 2a–d,i–p), and drought interval and severity with resistance showed different strongest quasi-periodicity between 1982 and 2015 (Figure 3a–d,i–p).

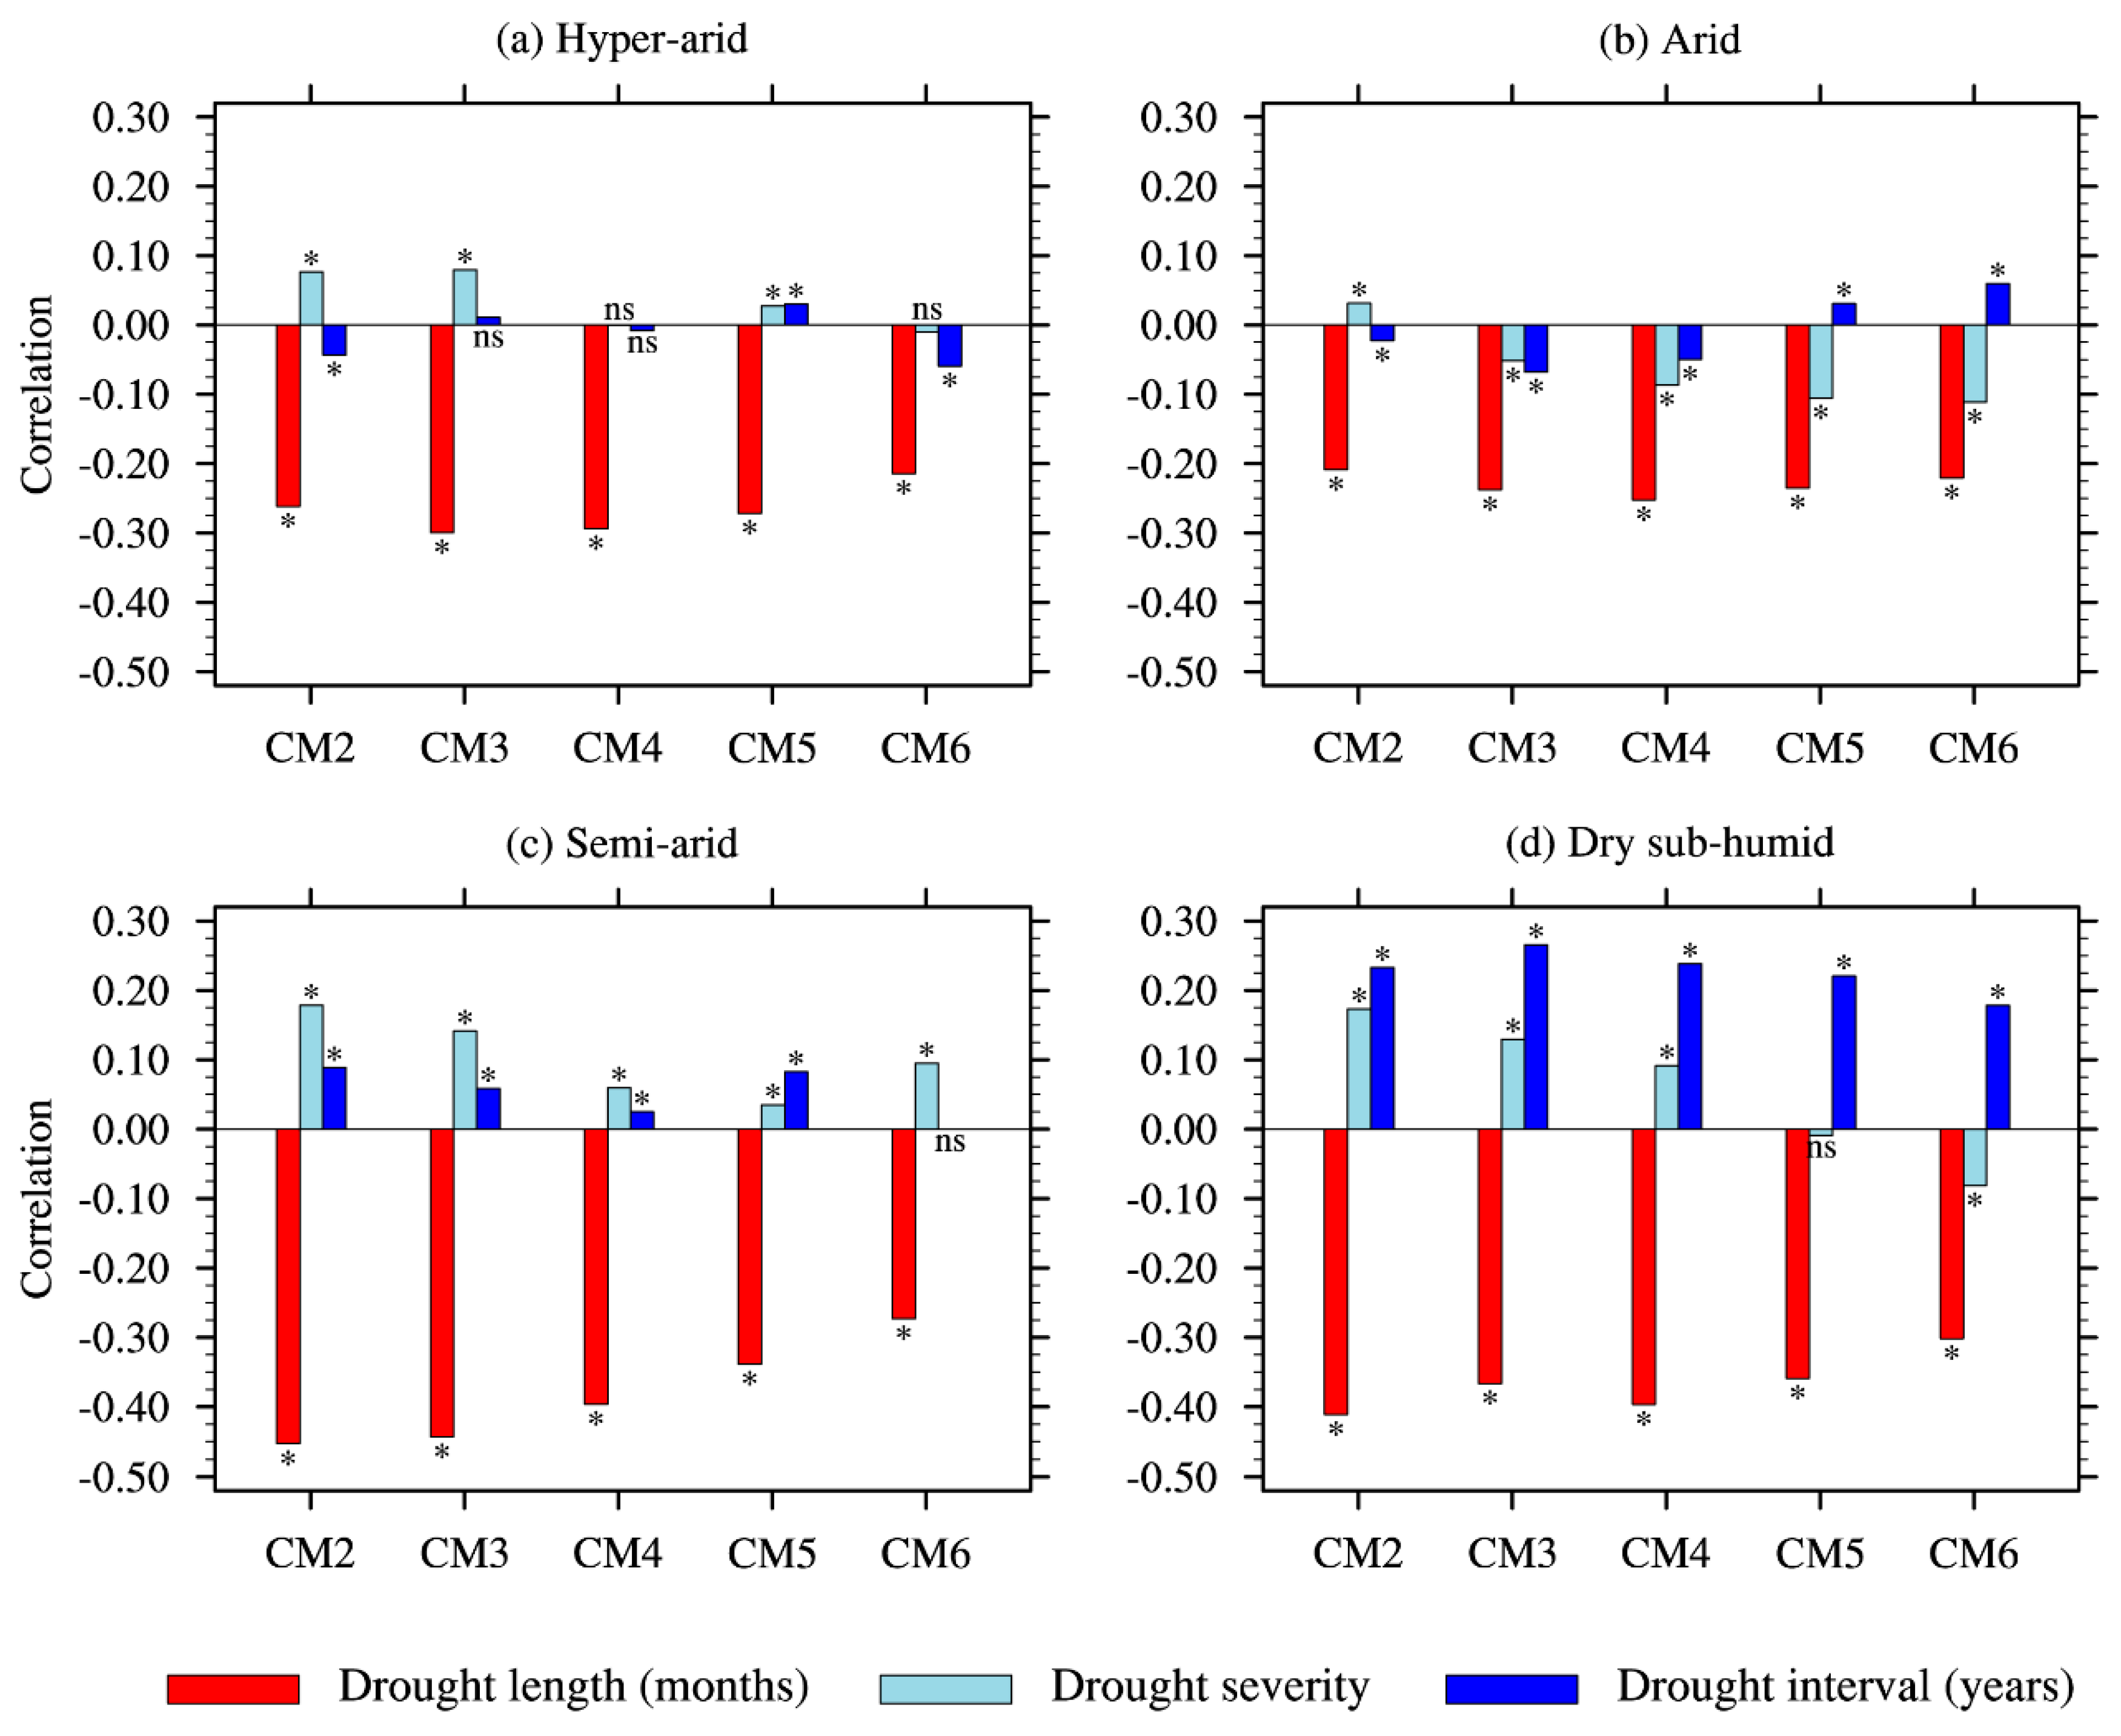
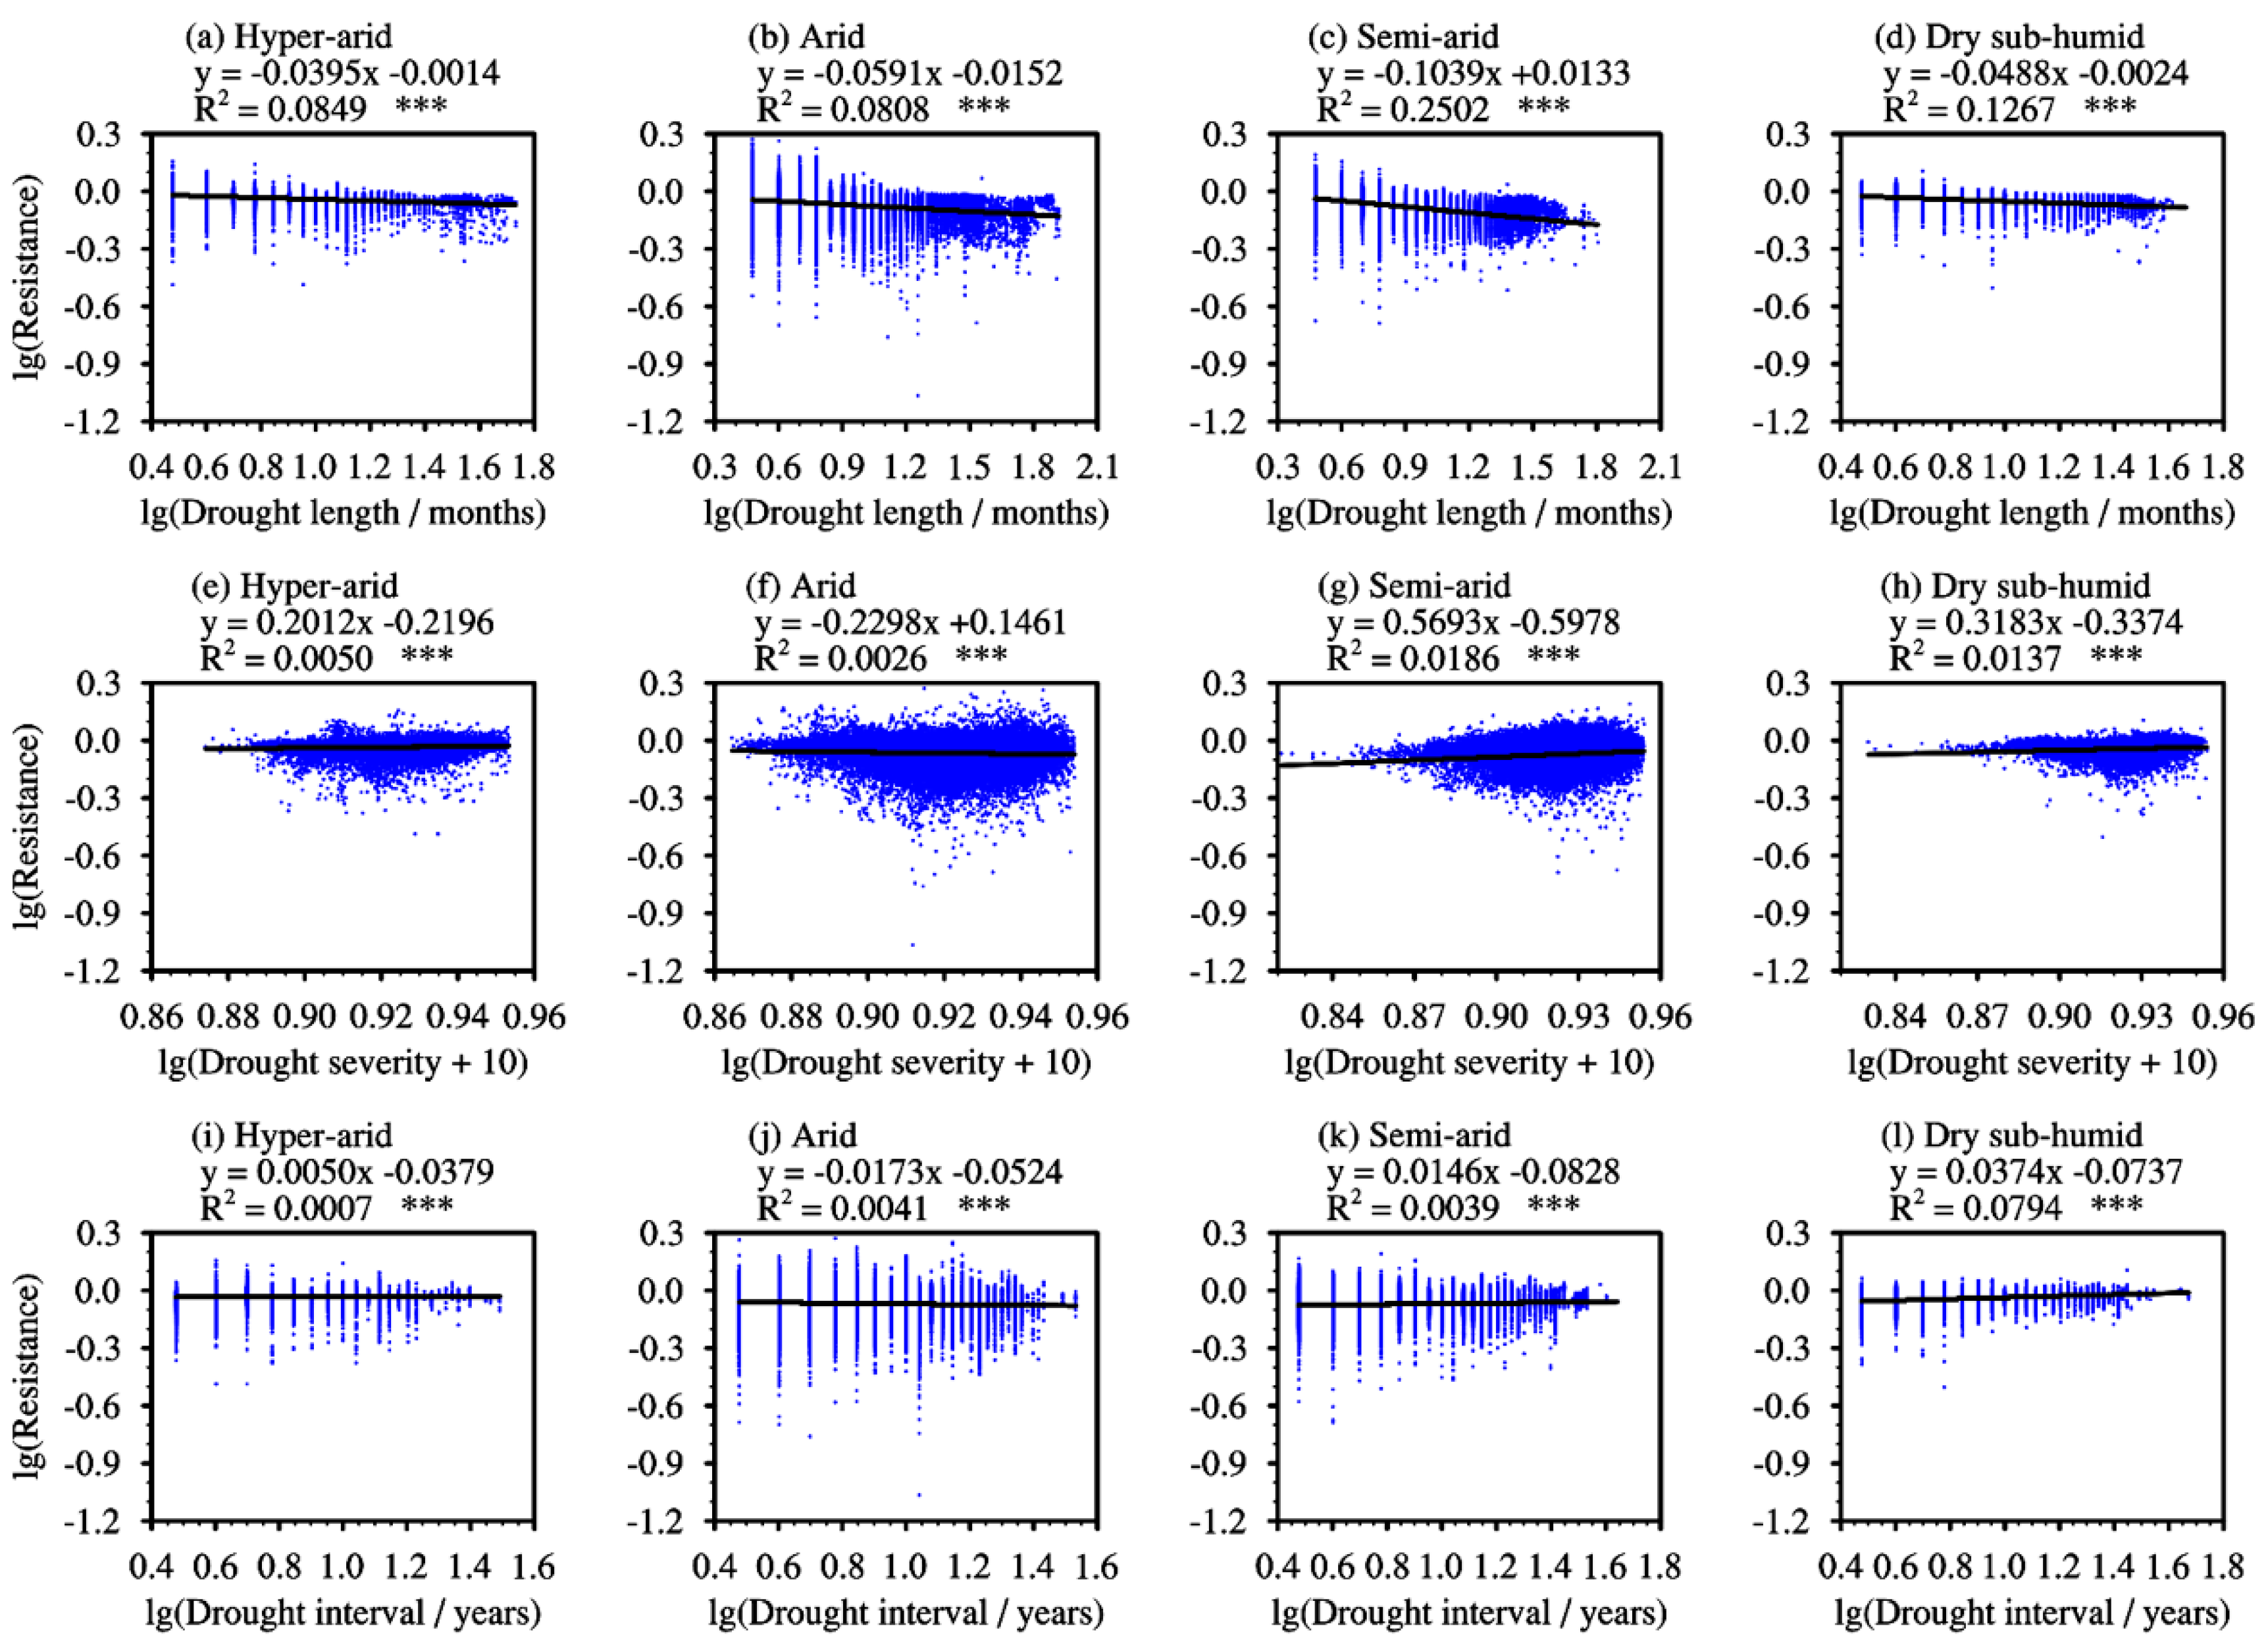
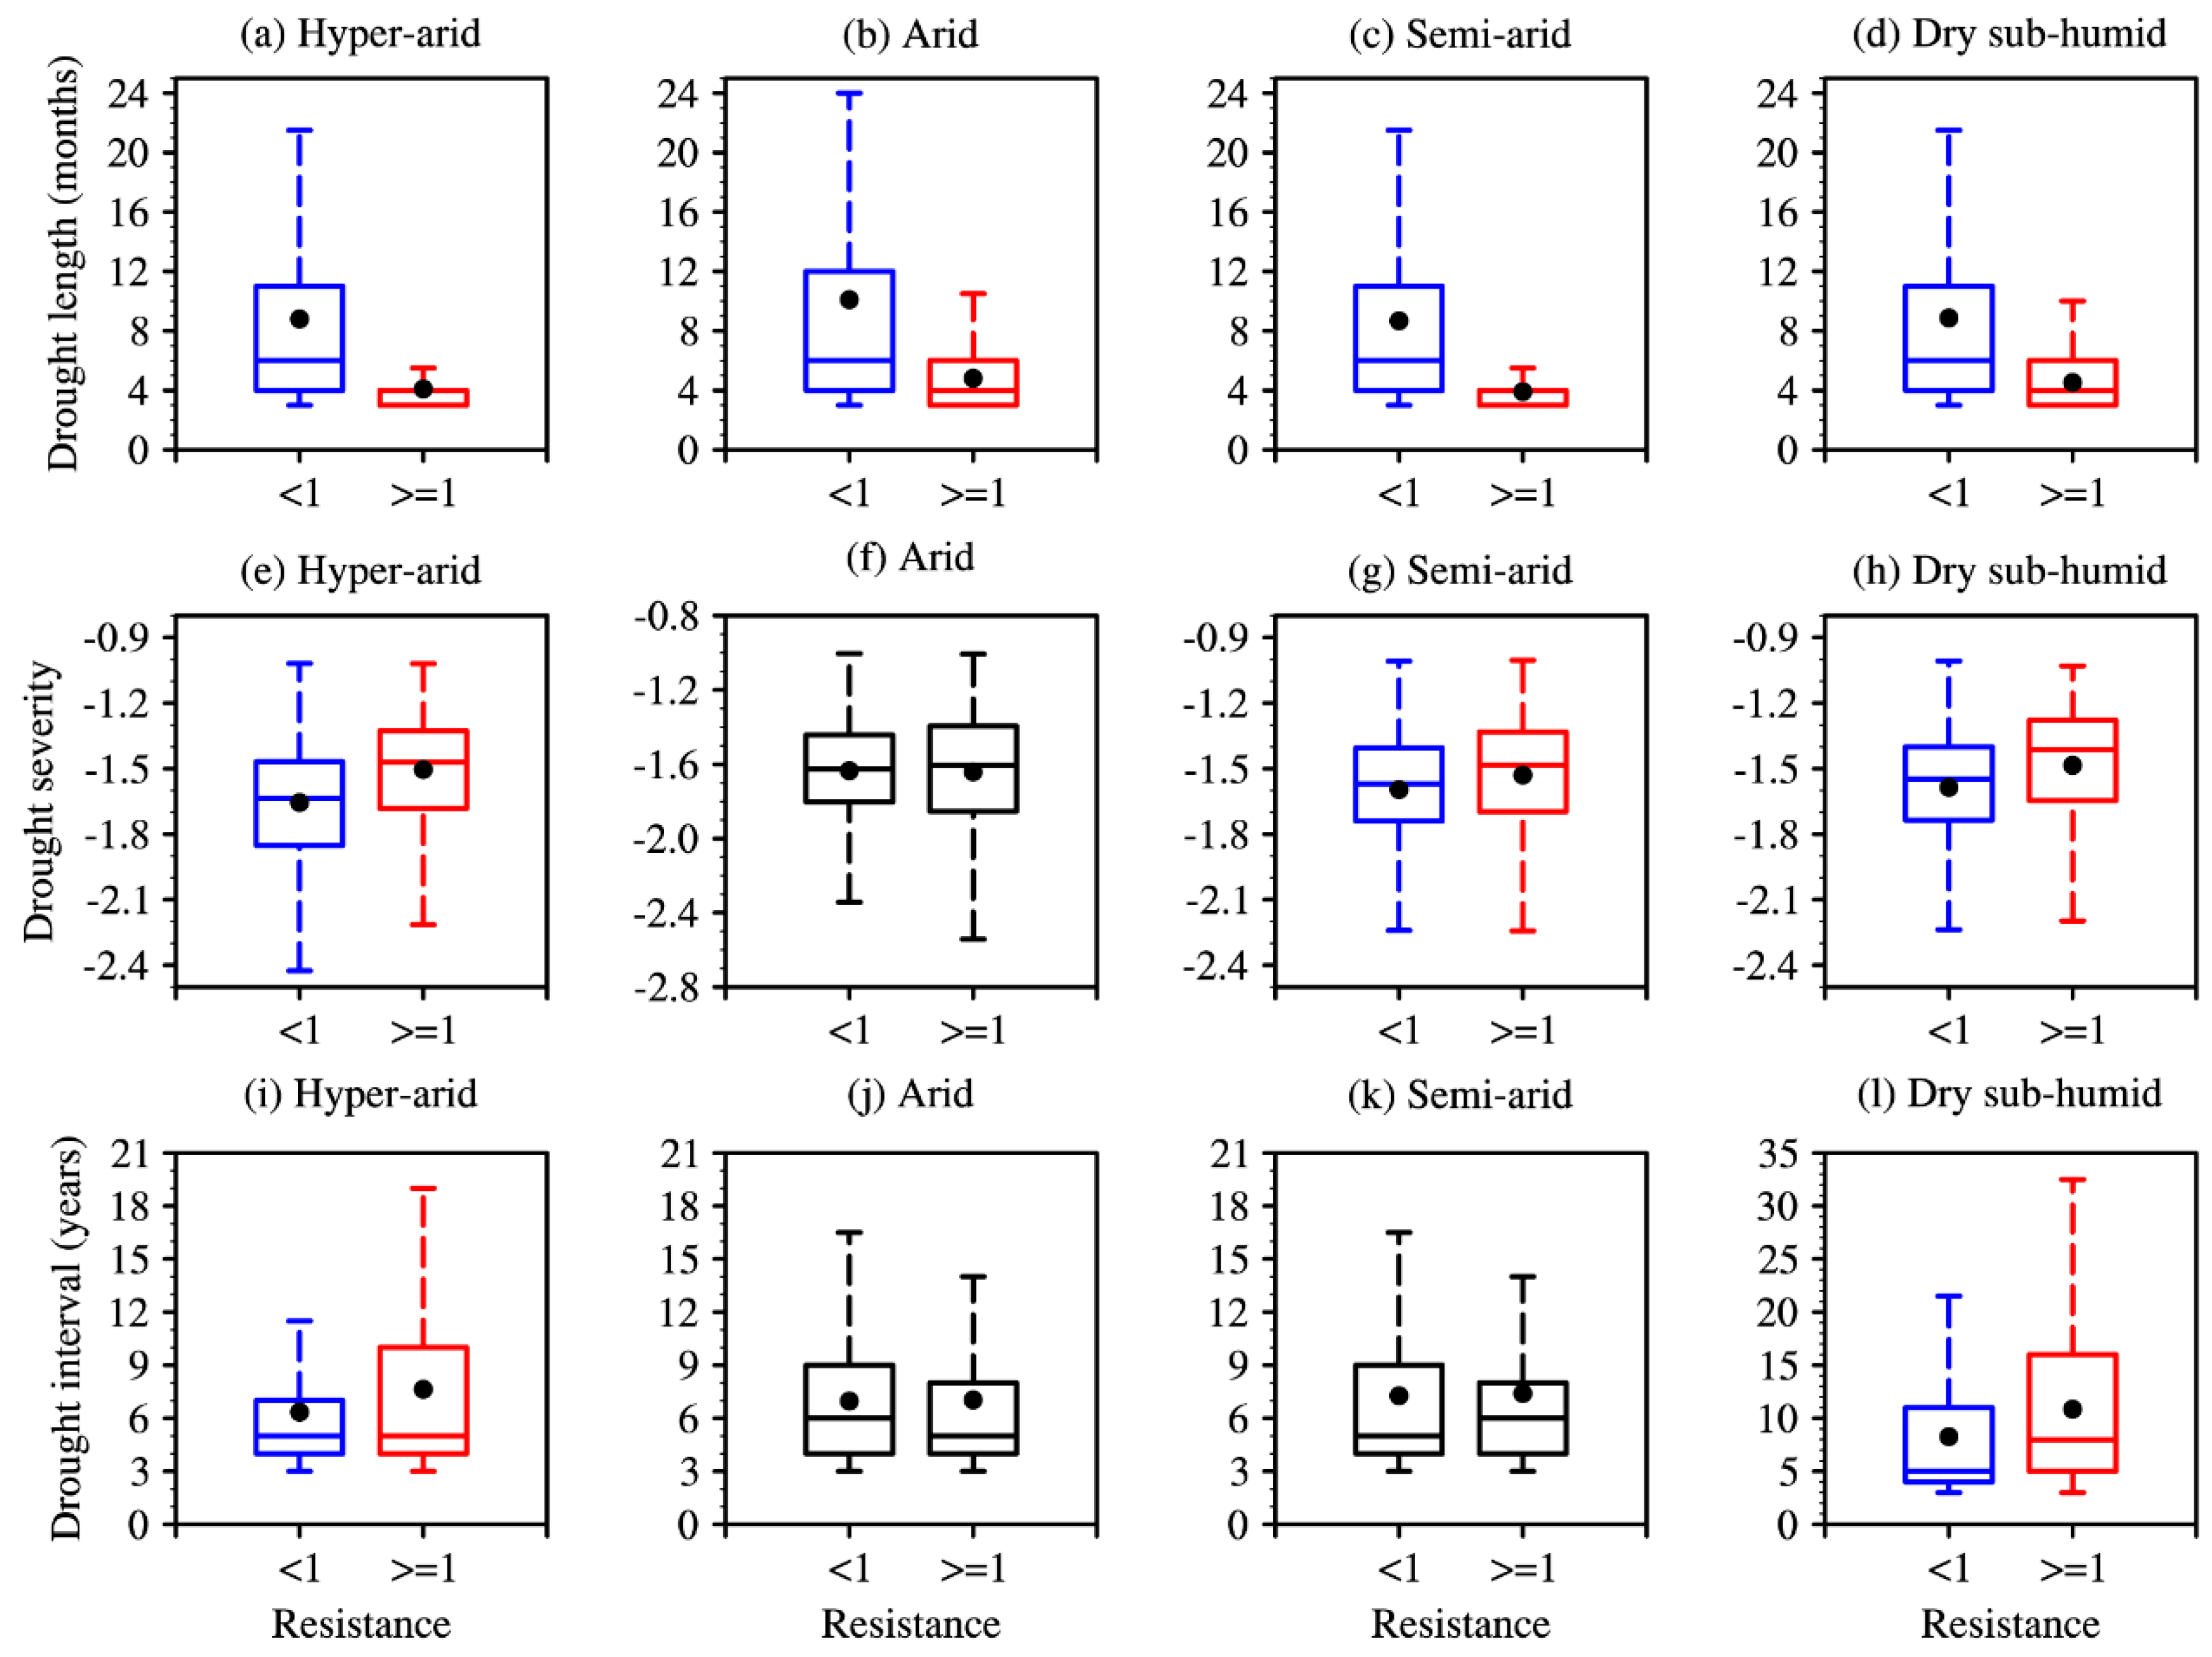
3.2. Effect of Drought Characteristics on Resistance

Of drought length, severity, and interval, drought length had the largest impact on resistance (Table 1, Figure 4, Figure 5 and Figure 6). This effect was not affected by time length, such as consecutive periods of 2, 3, 4, 5, and 6 months, in identifying the drought events and drought years (Figure 4). In hyper-arid, arid, semi-arid, and dry sub-humid regions, drought length and resistance were correlated significantly (Table 1, Figure 4), and the slopes of the linear relationships between lg-transformed resistance and lg-transformed drought length were −0.0395, −0.0591, −0.1039, and −0.0488 (Figure 5a–d). In addition, drought intensity, corresponding to complete or incomplete resistance, indicated whether the ecosystem was tolerable or non-tolerable to drought, with the former having significantly lower drought length than the latter (Figure 6a–d). In hyper-arid, arid, semi-arid, and dry sub-humid regions, average drought lengths were 4.10, 4.81, 3.91, and 4.52 months for complete resistance (resistance ≥ 1); and 8.80, 10.10, 8.67, and 8.87 months, respectively, for incomplete resistance (resistance < 1) (Figure 6a–d). Generally, drought severity or interval displayed weaker correlations with resistance than drought length (Table 1, Figure 4, Figure 5 and Figure 6).

4. Discussion

4.1. Temporal Trends of Drought Characteristics and Resistance, and Inter-Regional Differences

Most studies have focused on resistance under drought events, resistance differences among different ecosystems, and driving factors in the relationship between resistance and drought events [72,73,74]. However, temporal trends of resistance and driving factors under increased drought variability have rarely been examined because the ‘extremeness’ of drought events are highly dependent on historic droughts and what the ecosystem and its component species have experienced in the past [15,35,62]. We found that the temporal trends and quasi-periodicity of resistance between 1982 and 2015 responded mainly to drought length and, to a lesser extent, to drought severity and interval (Figure 2 and Figure 3). These findings can help predict the resistance of dryland ecosystems under increased drought variability.
Temporal trends of drought characteristics and resistance revealed differences among regions of different aridity levels across drylands in northern China. In hyper-arid regions, resistance decreased with increasing drought length since 1994, but did not recover with decreasing drought length after 2004 (Figure 2a,e), while, the strongest quasi-periodicity of resistance changed from 8 to 2 years from 2006 (Figure 3a). Therefore, the present study demonstrated the vulnerability of ecosystem productivity in hyper-arid regions, which may be due to a number of reasons, including: (1) simple species composition and weak compensatory effects; (2) depletion of the seed bank due to prolonged drought; and (3) seedling germination after drought cessation, which, in turn, increases plant mortality at the next drought event [9,47,75,76,77,78,79]. It was assumed that the drought–resistance interactions in hyper-arid regions were likely to respond abnormally under ongoing drought change.
Despite prolonged increasing droughts in previous years, resistance recovered from 2004 in arid and semi-arid regions, and from 1997 in dry sub-humid regions with decreasing drought length (Figure 2b–d,f–h). This may be due to: (1) drought events causing seed dormancy in previous years; (2) productivity declining in a small number of species. However, this reduction was compensated by functionally similar species [9,31,79,80,81]. Temporal trends of resistance were better predictors of future climate change than resistance under drought events [9,34,62,82]. This implies that resistance in arid, semi-arid, and dry sub-humid regions is expected to be relatively stable when climate variability is similar to current values.

4.2. Effects of Drought Characteristics on Resistance and Inter-Regional Differences

Some studies reported that drought characteristics, such as length, severity, and interval, were not important in explaining the variability of ecosystem resistance in response to drought events due to the self-regulating functions of the ecosystem [41,73,83,84]. In contrast, other studies reported that ecosystem productivity can be reduced substantially by extreme drought, as it impaired a number of ecosystem processes, including photosynthesis rate, stomatal conductance, soil respiration, and soil water content [28,34,84,85]. The present study supported the latter studies, as there was a strong and robust negative effect of drought length on resistance, followed by drought severity and interval in the drylands of northern China (Table 1, Figure 4, Figure 5 and Figure 6).
The relationships between resistance and drought characteristics were expected to be more complex when resistance did not recover and the region continued to experience severe drought events as shown in Figure 2 [27,29]. However, the relationship in Figure 2 does not illustrate that resistance increases with increasing drought intensity, but may decrease as drought intensity increases or decreases. The power–law relationships between resistance and drought characteristics (Figure 5), especially for drought length, with the strongest negative effect on resistance, showed a higher coefficient of determination (R2) than the linear, quadratic, and cubic relationships. Moreover, the lg-transformed datasets should be subjected to the normal distribution and thus follow the requirement of regression analysis. We, therefore, concluded that power–law relationships provide relatively appropriate estimates for the effects of drought characteristics on resistance. In addition, given the monotonic relationships between resistance and drought characteristics (Figure 5), quantifying the tolerable or intolerable drought intensity of an ecosystem in the present study (Figure 6) can help decision-makers to take measures in advance and thus alleviate the decrease of productivity and biodiversity loss resulting from drought stress [8,86].
The negative effect of drought characteristics on resistance, and the sensitivity of the negative effect to set different consecutive months in identifying drought events and drought years varied across regions, having a greater negative effect and a higher sensitivity in semi-arid and dry sub-humid regions than in hyper-arid and arid regions, which was consistent with earlier findings [31,41,74,87]. These differences can be attributed to the large-scale heterogeneity of environmental variables such as water conditions in semi-arid and dry sub-humid regions relative to hyper-arid and arid regions, as the former display more variation in plant species richness, and, ultimately, in productivity [24,25,26,72,88,89]. The low heterogeneity of water conditions in the hyper-arid and arid regions contributed to the low variations in plant species richness and productivity, and even ecosystem functions [24,25,26], and was another reason for the low likelihood of resistance recovery when conditions improved.
We identified the drought length that the ecosystem can tolerate, that is, a drought length that corresponded to a resistance greater than or equal to one. This situation may occur because: (1) the time of the drought event was not a critical period for plant growth; (2) during the critical period for plant growth, conditions such as precipitation may have been better; and (3) drought impacts exhibit a lag effect. It should be noted that variables such as vegetation, soil properties, and hydrothermal states were not examined in this study, and they could also affect the response of resistance to drought events. Future research should include more variables and longer-term observations at fixed sites to consolidate the temporal trends and their drivers of ecosystem resistance.

5. Conclusions

Of drought length, severity, and interval, drought length had the strongest negative impact on resistance in drylands of northern China between 1982 and 2015, and this negative effect differed across regions. In hyper-arid regions, resistance declined with increasing drought length from 1994, did not recover with decreasing drought length after 2004, and the quasi-periodicity of resistance changed abruptly from 8 years to 2 years in 2006. Despite increasing drought events in previous years, resistance recovered from 2004 in arid and semi-arid regions, and from 1997 in dry sub-humid regions with decreasing drought length. These results demonstrate that ecosystem productivity in hyper-arid regions is the most vulnerable to drought and the drought–resistance interactions are likely to respond abnormally or even shift under on-going drought change. Resistances in arid, semi-arid, and dry sub-humid regions are expected to be stable when drought characteristics are similar to current ones.

Author Contributions

Conceptualization, M.W., J.R. and J.D.; Data curation, M.W., H.L., L.D., W.H. and H.G.; Funding acquisition, J.D.; Methodology, M.W., H.L., M.A.A., L.D., Y.S. (Ying Sun) and D.Z.; Software, M.W., H.L., M.A.A., L.D. and Y.S. (Ying Sun); Supervision, J.R. and J.D.; Validation, M.W., H.L., M.A.A., L.D., Y.S. (Ying Sun), W.H., H.G., D.Z., J.X., S.Y., Y.S. (Yuan Sun), Q.H., Y.Z., X.W., S.X., Y.D., L.Z., A.A.D. and J.R.; Visualization, J.R. and J.D.; Writing—original draft, M.W. and J.D.; Writing—review & editing, M.W., M.A.A. and A.A.D. All authors have read and agreed to the published version of the manuscript.

Funding

This research was funded by grants from the National Scientific and Technological Program on Basic Resources Investigation (2019FY102002), Biodiversity Survey and Assessment Project of the Ministry of Ecology and Environment, China (2019HJ2096001006), the Innovation Base Project of Gansu Province (20190323), the Top Leading Talents in Gansu Province to JMD, the National Natural Science Foundation of China (31770430, 31700463, 31322010), the National Youth Top-notch Talent Support Programs to JMD, and Fundamental Research Funds for Central Universities (lzujbky-2018-ct06).

Data Availability Statement

Data that support the findings of this study can be requested from the corresponding author.

Acknowledgments

We thank the staff at Guazhou Desert Ecosystem Field Observation Research Station and Core Facility of the School of Life Sciences, Lanzhou University, for their help.

Conflicts of Interest

The authors declare no conflict of interest.

References

  1. Cahill, N.; Rahmstorf, S.; Parnell, A.C. Change points of global temperature. Environ. Res. Lett. 2015, 10, 084002. [Google Scholar] [CrossRef] [Green Version]
  2. McCabe, G.J.; Wolock, D.M. Variability and trends in global drought. Earth Space Sci. 2015, 2, 223–228. [Google Scholar] [CrossRef]
  3. Hieronymus, M. An update on the thermosteric sea level rise commitment to global warming. Environ. Res. Lett. 2019, 14, 054018. [Google Scholar] [CrossRef]
  4. Wang, Q.; Shi, P.; Lei, T.; Geng, G.; Liu, J.; Mo, X.; Li, X.; Zhou, H.; Wu, J. The alleviating trend of drought in the Huang-Huai-Hai Plain of China based on the daily SPEI. Int. J. Climatol. 2015, 35, 3760–3769. [Google Scholar] [CrossRef]
  5. Ganguli, P.; Ganguly, A.R. Space-time trends in U.S. meteorological droughts. J. Hydrol. Reg. Stud. 2016, 8, 235–259. [Google Scholar] [CrossRef] [Green Version]
  6. Sharma, A.; Goyal, M.K. Assessment of drought trend and variability in India using wavelet transform. Hydrol. Sci. J. Sci. Hydrol. 2020, 65, 1539–1554. [Google Scholar] [CrossRef]
  7. Chang, H.; He, G.; Wang, Q.; Li, H.; Zhai, J.; Dong, Y.; Zhao, Y.; Zhao, J. Use of sustainability index and cellular automata-Markov model to determine and predict long-term spatio-temporal variation of drought in China. J. Hydrol. 2021, 598, 126248. [Google Scholar] [CrossRef]
  8. Zhu, X.; Liu, Y.; Xu, K.; Pan, Y. Effects of drought on vegetation productivity of farmland ecosystems in the drylands of northern China. Remote Sens. 2021, 13, 1179. [Google Scholar] [CrossRef]
  9. Harrison, S.P.; LaForgia, M.L.; Latimer, A.M. Climate-driven diversity change in annual grasslands: Drought plus deluge does not equal normal. Glob. Chang. Biol. 2018, 24, 1782–1792. [Google Scholar] [CrossRef]
  10. Reynolds, J.F.; Smith, D.M.; Lambin, E.F.; Turner, B.L., II; Mortimore, M.; Batterbury, S.P.; Downing, T.E.; Dowlatabadi, H.; Fernandez, R.J.; Herrick, J.E.; et al. Global desertification: Building a science for dryland development. Science 2007, 316, 847–851. [Google Scholar] [CrossRef] [Green Version]
  11. Huang, J.; Yu, H.; Dai, A.; Wei, Y.; Kang, L. Drylands face potential threat under 2 °C global warming target. Nat. Clim. Chang. 2017, 7, 417–421. [Google Scholar] [CrossRef]
  12. Yeh, S.W.; Kug, J.S.; Dewitte, B.; Kwon, M.H.; Kirtman, B.P.; Jin, F. El Nino in a changing climate. Nature 2009, 461, 511–514. [Google Scholar] [CrossRef] [PubMed]
  13. Wagg, C.; O’Brien, M.J.; Vogel, A.; Scherer-Lorenzen, M.; Eisenhauer, N.; Schmid, B.; Weigelt, A. Plant diversity maintains long-term ecosystem productivity under frequent drought by increasing short-term variation. Ecology 2017, 98, 2952–2961. [Google Scholar] [CrossRef]
  14. Zhang, F.; Quan, Q.; Ma, F.; Tian, D.; Hoover, D.L.; Zhou, Q.; Niu, S. When does extreme drought elicit extreme ecological responses? J. Ecol. 2019, 107, 2553–2563. [Google Scholar] [CrossRef]
  15. Ogle, K.; Barber, J.J.; Barron-Gafford, G.A.; Bentley, L.P.; Young, J.M.; Huxman, T.E.; Loik, M.E.; Tissue, D.T. Quantifying ecological memory in plant and ecosystem processes. Ecol. Lett. 2015, 18, 221–235. [Google Scholar] [CrossRef] [PubMed] [Green Version]
  16. Seddon, A.W.R.; Macias-Fauria, M.; Long, P.R.; Benz, D.; Willis, K.J. Sensitivity of global terrestrial ecosystems to climate variability. Nature 2016, 531, 229–232. [Google Scholar] [CrossRef] [Green Version]
  17. Lloret, F.; Lobo, A.; Estevan, H.; Maisongrande, P.; Vayreda, J.; Terradas, J. Woody plant richness and NDVI response to drought in Catalonian (northeastern Spain) forests. Ecology 2007, 88, 2270–2279. [Google Scholar] [CrossRef] [PubMed]
  18. De Keersmaecker, W.; Lhermitte, S.; Honnay, O.; Farifteh, J.; Somers, B.; Coppin, P. How to measure ecosystem stability? An evaluation of the reliability of stability metrics based on remote sensing time series across the major global ecosystems. Glob. Chang. Biol. 2014, 20, 2149–2161. [Google Scholar] [CrossRef]
  19. Chen, R.; Ran, J.; Hu, W.; Dong, L.; Ji, M.; Jia, X.; Lu, J.; Gong, H.; Aqeel, M.; Yao, S.; et al. Effects of biotic and abiotic factors on forest biomass fractions. Natl. Sci. Rev. 2021, 8, nwab025. [Google Scholar] [CrossRef]
  20. Chen, R.; Ran, J.; Huang, H.; Dong, L.; Sun, Y.; Ji, M.; Hu, W.; Yao, S.; Lu, J.; Gong, H.; et al. Life history strategies drive size-dependent biomass allocation patterns of dryland ephemerals and shrubs. Ecosphere 2019, 10, 13. [Google Scholar] [CrossRef]
  21. Xiong, J.; Dong, L.; Lu, J.; Hu, W.; Gong, H.; Xie, S.; Zhao, D.; Zhang, Y.; Wang, X.; Deng, Y.; et al. Variation in plant carbon, nitrogen and phosphorus contents across the drylands of China. Funct. Ecol. 2022, 36, 174–186. [Google Scholar] [CrossRef]
  22. Deng, J.; Wang, G.; Morris, E.; Wei, X.; Li, D.; Chen, B.; Zhao, C.; Liu, J.; Wang, Y. Plant mass-density relationship along a moisture gradient in north-west China. J. Ecol. 2006, 94, 953–958. [Google Scholar] [CrossRef]
  23. Deng, J.; Li, T.; Wang, G.; Liu, J.; Yu, Z.; Zhao, C.; Liu, J.; Wang, Y. Trade-offs between the metabolic rate and population density of plants. PLoS ONE 2008, 3, e1799. [Google Scholar] [CrossRef] [PubMed] [Green Version]
  24. Hu, W.; Ran, J.; Dong, L.; Du, Q.; Ji, M.; Yao, S.; Sun, Y.; Gong, C.; Hou, Q.; Gong, H.; et al. Aridity-driven shift in biodiversity-soil multifunctionality relationships. Nat. Commun. 2021, 12, 5350. [Google Scholar] [CrossRef] [PubMed]
  25. Sun, Y.; Sun, Y.; Yao, S.; Akram, M.; Hu, W.; Dong, L.; Li, H.; Wei, M.; Gong, H.; Xie, S.; et al. Impact of climate change on plant species richness across drylands in China: From past to present and into the future. Ecol. Indic. 2021, 132. [Google Scholar] [CrossRef]
  26. Yao, S.; Akram, M.A.; Hu, W.; Sun, Y.; Sun, Y.; Deng, Y.; Ran, J.; Deng, J. Effects of water and energy on plant diversity along the aridity gradient across dryland in China. Plants 2021, 10, 636. [Google Scholar] [CrossRef]
  27. Saatchi, S.; Asefi-Najafabady, S.; Malhi, Y.; Aragao, L.E.; Anderson, L.O.; Myneni, R.B.; Nemani, R. Persistent effects of a severe drought on Amazonian forest canopy. Proc. Natl. Acad. Sci. USA 2013, 110, 565–570. [Google Scholar] [CrossRef] [Green Version]
  28. Moser, G.; Schuldt, B.; Hertel, D.; Horna, V.; Coners, H.; Barus, H.; Leuschner, C. Replicated throughfall exclusion experiment in an Indonesian perhumid rainforest: Wood production, litter fall and fine root growth under simulated drought. Glob. Chang. Biol. 2014, 20, 1481–1497. [Google Scholar] [CrossRef]
  29. Zhou, L.; Tian, Y.; Myneni, R.B.; Ciais, P.; Saatchi, S.; Liu, Y.; Piao, S.L.; Chen, H.S.; Vermote, E.F.; Song, C.H.; et al. Widespread decline of Congo rainforest greenness in the past decade. Nature 2014, 509, 86–90. [Google Scholar] [CrossRef]
  30. Bai, Y.; Han, X.; Wu, J.; Chen, Z.; Li, H. Ecosystem stability and compensatory effects in the Inner Mongolia grassland. Nature 2004, 431, 181–184. [Google Scholar] [CrossRef]
  31. Polley, H.W.; Isbell, F.I.; Wilsey, B.J. Plant functional traits improve diversity-based predictions of temporal stability of grassland productivity. Oikos 2013, 122, 1275–1282. [Google Scholar] [CrossRef] [Green Version]
  32. Huang, K.; Xia, J. High ecosystem stability of evergreen broadleaf forests under severe droughts. Glob. Chang. Biol. 2019, 25, 3494–3503. [Google Scholar] [CrossRef] [PubMed]
  33. García-Palacios, P.; Gross, N.; Gaitan, J.; Maestre, F.T. Climate mediates the biodiversity-ecosystem stability relationship globally. Proc. Natl. Acad. Sci. USA. 2018, 115, 8400–8405. [Google Scholar] [CrossRef] [PubMed] [Green Version]
  34. Ruppert, J.C.; Harmoney, K.; Henkin, Z.; Snyman, H.A.; Sternberg, M.; Willms, W.; Linstadter, A. Quantifying drylands’ drought resistance and recovery: The importance of drought intensity, dominant life history and grazing regime. Glob. Chang. Biol. 2015, 21, 1258–1270. [Google Scholar] [CrossRef]
  35. Smith, M.D. An ecological perspective on extreme climatic events: A synthetic definition and framework to guide future research. J. Ecol. 2011, 99, 656–663. [Google Scholar] [CrossRef]
  36. Anderegg, W.R.L.; Berry, J.A.; Smith, D.D.; Sperry, J.S.; Anderegg, L.D.L.; Field, C.B. The roles of hydraulic and carbon stress in a widespread climate-induced forest die-off. Proc. Natl. Acad. Sci. USA 2012, 109, 233–237. [Google Scholar] [CrossRef] [Green Version]
  37. Smith, M.D.; La Pierre, K.J.; Collins, S.L.; Knapp, A.K.; Gross, K.L.; Barrett, J.E.; Frey, S.D.; Gough, L.; Miller, R.J.; Morris, J.T.; et al. Global environmental change and the nature of aboveground net primary productivity responses: Insights from long-term experiments. Oecologia 2015, 177, 935–947. [Google Scholar] [CrossRef] [Green Version]
  38. Kaisermann, A.; de Vries, F.T.; Griffiths, R.I.; Bardgett, R.D. Legacy effects of drought on plant-soil feedbacks and plant-plant interactions. New Phytol. 2017, 215, 1413–1424. [Google Scholar] [CrossRef] [Green Version]
  39. Anderegg, W.R.L.; Plavcova, L.; Anderegg, L.D.L.; Hacke, U.G.; Berry, J.A.; Field, C.B. Drought’s legacy: Multiyear hydraulic deterioration underlies widespread aspen forest die-off and portends increased future risk. Glob. Chang. Biol. 2013, 19, 1188–1196. [Google Scholar] [CrossRef]
  40. Hallett, L.M.; Stein, C.; Suding, K.N. Functional diversity increases ecological stability in a grazed grassland. Oecologia 2017, 183, 831–840. [Google Scholar] [CrossRef]
  41. Jentsch, A.; Kreyling, J.; Elmer, M.; Gellesch, E.; Glaser, B.; Grant, K.; Hein, R.; Lara, M.; Mirzae, H.; Nadler, S.E.; et al. Climate extremes initiate ecosystem-regulating functions while maintaining productivity. J. Ecol. 2011, 99, 689–702. [Google Scholar] [CrossRef]
  42. Gross, K.; Cardinale, B.J.; Fox, J.W.; Gonzalez, A.; Loreau, M.; Polley, H.W.; Reich, P.B.; van Ruijven, J. Species richness and the temporal stability of biomass production: A new analysis of recent biodiversity experiments. Am. Nat. 2014, 183, 1–12. [Google Scholar] [CrossRef] [PubMed] [Green Version]
  43. Isbell, F.; Craven, D.; Connolly, J.; Loreau, M.; Schmid, B.; Beierkuhnlein, C.; Bezemer, T.M.; Bonin, C.; Bruelheide, H.; De Luca, E. Biodiversity increases the resistance of ecosystem productivity to climate extremes. Nature 2015, 526, 574–577. [Google Scholar] [CrossRef] [PubMed]
  44. Dai, A. Drought under global warming: A review. Wiley Interdiscip. Rev.-Clim. Chang. 2011, 2, 45–65. [Google Scholar] [CrossRef] [Green Version]
  45. Lloret, F.; Keeling, E.G.; Sala, A. Components of tree resilience: Effects of successive low-growth episodes in old ponderosa pine forests. Oikos 2011, 120, 1909–1920. [Google Scholar] [CrossRef]
  46. Ge, Q.; Dai, J.; Cui, H.; Wang, H. Spatiotemporal variability in start and end of growing season in China related to climate variability. Remote Sens. 2016, 8, 433. [Google Scholar] [CrossRef] [Green Version]
  47. Mao, D.; Wang, Z.; Wu, B.; Zeng, Y.; Luo, L.; Zhang, B. Land degradation and restoration in the arid and semiarid zones of China: Quantified evidence and implications from satellites. Land Degrad. Dev. 2018, 29, 3841–3851. [Google Scholar] [CrossRef]
  48. Trabucco, A.; Zomer, R.J. Global Aridity Index (Global-Aridity) and Global Potential Evapo-Transpiration (Global-PET) Geospatial Database. CGIAR Consortium for Spatial Information. 2009. Available online: https://cgiarcsi.community/data/global-aridity-and-pet-database/ (accessed on 25 July 2021).
  49. Hou, X. The Vegetation Atlas of China (1:1000000); Science Press: Beijing, China, 2001. [Google Scholar]
  50. Militino, A.F.; Ugarte, M.D.; Perez-Goya, U. Stochastic spatio-temporal models for analysing NDVI distribution of GIMMS NDVI3g images. Remote Sens. 2017, 9, 76. [Google Scholar] [CrossRef] [Green Version]
  51. Ma, C.; Li, T.; Liu, P. GIMMS NDVI3g+(1982–2015) response to climate change and engineering activities along the Qinghai-Tibet Railway. Ecol. Indic. 2021, 128, 107821. [Google Scholar] [CrossRef]
  52. Dardel, C.; Kergoat, L.; Hiernaux, P.; Mougin, E.; Grippa, M.; Tucker, C.J. Re-greening Sahel: 30 years of remote sensing data and field observations (Mali, Niger). Remote Sens. Environ. 2014, 140, 350–364. [Google Scholar] [CrossRef]
  53. Ibrahim, Y.; Balzter, H.; Kaduk, J.; Tucker, C. Land degradation assessment using residual trend analysis of GIMMS NDVI3g, soil moisture and rainfall in Sub-Saharan West Africa from 1982 to 2012. Remote Sens. 2015, 7, 5471–5494. [Google Scholar] [CrossRef] [Green Version]
  54. Burrell, A.L.; Evans, J.P.; De Kauwe, M.G. Anthropogenic climate change has driven over 5 million km2 of drylands towards desertification. Nat. Commun. 2020, 11, 3853. [Google Scholar] [CrossRef] [PubMed]
  55. Miles, M.W.; Miles, V.V.; Esau, I. Varying climate response across the tundra, forest-tundra and boreal forest biomes in northern West Siberia. Environ. Res. Lett. 2019, 14, 075008. [Google Scholar] [CrossRef] [Green Version]
  56. Beguería, S.; Vicente-Serrano, S.M.; Reig, F.; Latorre, B. Standardized Precipitation Evapotranspiration Index (SPEI) revisited: Parameter fitting, evapotranspiration models, tools, datasets and drought monitoring. Int. J. Climatol. 2014, 34, 3001–3023. [Google Scholar] [CrossRef] [Green Version]
  57. Schwalm, C.R.; Anderegg, W.R.L.; Michalak, A.M.; Fisher, J.B.; Biondi, F.; Koch, G.; Litvak, M.; Ogle, K.; Shaw, J.D.; Wolf, A.; et al. Global patterns of drought recovery. Nature 2017, 548, 202–205. [Google Scholar] [CrossRef] [PubMed]
  58. Yu, M.; Li, Q.; Hayes, M.J.; Svoboda, M.D.; Heim, R.R. Are droughts becoming more frequent or severe in China based on the Standardized Precipitation Evapotranspiration Index: 1951–2010? Int. J. Climatol. 2014, 34, 545–558. [Google Scholar] [CrossRef]
  59. Khoury, S.; Coomes, D.A. Resilience of Spanish forests to recent droughts and climate change. Glob. Chang. Biol. 2020, 26, 7079–7098. [Google Scholar] [CrossRef]
  60. Ji, L.; Peters, A.J. Assessing vegetation response to drought in the northern Great Plains using vegetation and drought indices. Remote Sens. Environ. 2003, 87, 85–98. [Google Scholar] [CrossRef]
  61. Ye, C.; Sun, J.; Liu, M.; Xiong, J.; Zong, N.; Hu, J.; Huang, Y.; Duan, X.; Tsunekawa, A. Concurrent and lagged effects of extreme drought induce net reduction in vegetation carbon uptake on Tibetan Plateau. Remote Sens. 2020, 12, 2347. [Google Scholar] [CrossRef]
  62. De Keersmaecker, W.; Lhermitte, S.; Tits, L.; Honnay, O.; Somers, B.; Coppin, P. A model quantifying global vegetation resistance and resilience to short-term climate anomalies and their relationship with vegetation cover. Glob. Ecol. Biogeogr. 2015, 24, 539–548. [Google Scholar] [CrossRef]
  63. Nimmo, D.G.; Mac Nally, R.; Cunningham, S.C.; Haslem, A.; Bennett, A.F. Vive la resistance: Reviving resistance for 21st century conservation. Trends Ecol. Evol. 2015, 30, 516–523. [Google Scholar] [CrossRef] [PubMed]
  64. An, Z.; Wu, G.; Li, J.; Sun, Y.; Liu, Y.; Zhou, W.; Cai, Y.; Duan, A.; Li, L.; Mao, J.; et al. Global monsoon dynamics and climate change. Annu. Rev. Earth Planet. Sci. 2014, 42, 29–77. [Google Scholar] [CrossRef] [Green Version]
  65. Hartmann, H.; Becker, S.; King, L. Quasi-periodicities in Chinese precipitation time series. Theor. Appl. Climatol. 2008, 92, 155–163. [Google Scholar] [CrossRef]
  66. Torrence, C.; Compo, G.P. A practical guide to wavelet analysis. Bull. Am. Meteorol. Soc. 1998, 79, 61–78. [Google Scholar] [CrossRef] [Green Version]
  67. Aguiar-Conraria, L.; Soares, M.J. The continuous wavelet transform: Moving beyond uni-and bivariate analysis. J. Econ. Surv. 2014, 28, 344–375. [Google Scholar] [CrossRef]
  68. Yan, Z.; Jones, P.D. Detecting inhomogeneity in daily climate series using wavelet analysis. Adv. Atmos. Sci. 2008, 25, 157–163. [Google Scholar] [CrossRef]
  69. Jiang, R.; Gan, T.; Xie, J.; Wang, N. Spatiotemporal variability of Alberta’s seasonal precipitation, their teleconnection with large-scale climate anomalies and sea surface temperature. Int. J. Climatol. 2014, 34, 2899–2917. [Google Scholar] [CrossRef]
  70. Sakamoto, T.; Wardlow, B.D.; Gitelson, A.A.; Verma, S.B.; Suyker, A.E.; Arkebauer, T.J. A two-step filtering approach for detecting maize and soybean phenology with time-series MODIS data. Remote Sens. Environ. 2010, 114, 2146–2159. [Google Scholar] [CrossRef]
  71. Gallegati, M. A systematic wavelet-based exploratory analysis of climatic variables. Clim. Chang. 2018, 148, 325–338. [Google Scholar] [CrossRef]
  72. Koerner, S.E.; Collins, S.L. Interactive effects of grazing, drought, and fire on grassland plant communities in North America and South Africa. Ecology 2014, 95, 98–109. [Google Scholar] [CrossRef] [Green Version]
  73. Matos, I.S.; Menor, I.O.; Rifai, S.W.; Rosado, B.H.P. Deciphering the stability of grassland productivity in response to rainfall manipulation experiments. Glob. Ecol. Biogeogr. 2020, 29, 558–572. [Google Scholar] [CrossRef]
  74. Gao, J.; Zhang, L.; Tang, Z.; Wu, S. A synthesis of ecosystem aboveground productivity and its process variables under simulated drought stress. J. Ecol. 2019, 107, 2519–2531. [Google Scholar] [CrossRef]
  75. Smith, M.D.; Knapp, A.K. Dominant species maintain ecosystem function with non-random species loss. Ecol. Lett. 2003, 6, 509–517. [Google Scholar] [CrossRef] [Green Version]
  76. Isbell, F.; Calcagno, V.; Hector, A.; Connolly, J.; Harpole, W.S.; Reich, P.B.; Scherer-Lorenzen, M.; Schmid, B.; Tilman, D.; van Ruijven, J.; et al. High plant diversity is needed to maintain ecosystem services. Nature 2011, 477, 199–202. [Google Scholar] [CrossRef] [PubMed]
  77. Hallett, L.M.; Hsu, J.S.; Cleland, E.E.; Collins, S.L.; Dickson, T.L.; Farrer, E.C.; Gherardi, L.A.; Gross, K.L.; Hobbs, R.J.; Turnbull, L.; et al. Biotic mechanisms of community stability shift along a precipitation gradient. Ecology 2014, 95, 1693–1700. [Google Scholar] [CrossRef] [Green Version]
  78. Li, J.; Liu, Z.; He, C.; Yue, H.; Gou, S. Water shortages raised a legitimate concern over the sustainable development of the drylands of northern China: Evidence from the water stress index. Sci. Total Environ. 2017, 590, 739–750. [Google Scholar] [CrossRef]
  79. Huang, H.; Ran, J.; Ji, M.; Wang, Z.; Dong, L.; Hu, W.; Deng, Y.; Hou, C.; Niklas, K.J.; Deng, J. Water content quantitatively affects metabolic rates over the course of plant ontogeny. New Phytol. 2020, 228, 1524–1534. [Google Scholar] [CrossRef]
  80. Tilman, D.; Reich, P.B.; Knops, J.M.H. Biodiversity and ecosystem stability in a decade-long grassland experiment. Nature 2006, 441, 629–632. [Google Scholar] [CrossRef] [PubMed]
  81. Hopfensperger, K.N. A review of similarity between seed bank and standing vegetation across ecosystems. Oikos 2007, 116, 1438–1448. [Google Scholar] [CrossRef]
  82. Hoover, D.L.; Knapp, A.K.; Smith, M.D. Resistance and resilience of a grassland ecosystem to climate extremes. Ecology 2014, 95, 2646–2656. [Google Scholar] [CrossRef] [Green Version]
  83. Kreyling, J.; Wenigmann, M.; Beierkuhnlein, C.; Jentsch, A. Effects of extreme weather events on plant productivity and tissue die-back are modified by community composition. Ecosystems 2008, 11, 752–763. [Google Scholar] [CrossRef]
  84. Luo, W.; Zuo, X.; Ma, W.; Xu, C.; Li, A.; Yu, Q.; Knapp, A.K.; Tognetti, R.; Dijkstra, F.A.; Li, M.; et al. Differential responses of canopy nutrients to experimental drought along a natural aridity gradient. Ecology 2018, 99, 2230–2239. [Google Scholar] [CrossRef] [PubMed]
  85. Beierkuhnlein, C.; Thiel, D.; Jentsch, A.; Willner, E.; Kreyling, J. Ecotypes of European grass species respond differently to warming and extreme drought. J. Ecol. 2011, 99, 703–713. [Google Scholar] [CrossRef]
  86. Donohue, I.; Hillebrand, H.; Montoya, J.M.; Petchey, O.L.; Pimm, S.L.; Fowler, M.S.; Healy, K.; Jackson, A.L.; Lurgi, M.; McClean, D.; et al. Navigating the complexity of ecological stability. Ecol. Lett. 2016, 19, 1172–1185. [Google Scholar] [CrossRef] [PubMed]
  87. Zhang, L.; Xiao, J.; Zhou, Y.; Zheng, Y.; Li, J.; Xiao, H. Drought and their effects on vegetation productivity in China. Ecosphere 2016, 7, e01591. [Google Scholar] [CrossRef]
  88. Grman, E.; Lau, J.A.; Schoolmaster, D.R., Jr.; Gross, K.L. Mechanisms contributing to stability in ecosystem function depend on the environmental context. Ecol. Lett. 2010, 13, 1400–1410. [Google Scholar] [CrossRef]
  89. Huang, H.; Ran, J.; Li, X.; Wang, Z.; Chen, R.; Wu, F.; Ye, M.; Jia, F.; Niklas, K.J.; Deng, J. A general model for seed and seedling respiratory metabolism. Am. Nat. 2020, 195, 534–546. [Google Scholar] [CrossRef]
Figure 1. Graphical representation of the (a) aridity index (AI) and (b) land cover in the study area. For (a), colors, except gray, indicate regions in the drylands, and gray indicates the non-drylands, where AI is greater than 0.65. AI < 0.03, 0.03 ≤ AI < 0.2, 0.2 ≤ AI < 0.5, and 0.5 ≤ AI < 0.65 represent hyper-arid, arid, semi-arid, and dry sub-humid regions, respectively. For (b), land cover data are from the Global ESA CCI land cover classification map (http://www.esa-landcover-cci.org/ (accessed on 25 July 2021)).
Forests 13 00100 g001
Figure 2. Temporal trends in (ad) resistance, (e,h) drought length, (il) severity, and (mp) interval in (a,e,i,m) hyper-arid, (b,f,j,n) arid, (c,g,k,o) semi-arid, and (d,h,l,p) dry sub-humid regions between 1982 and 2015. The black line is the three-point smoothing curve.
Forests 13 00100 g002
Figure 3. The wavelet power spectrum of (ad) resistance, (eh) drought length, (il) severity, and (mp) interval in (a,e,i,m) hyper-arid, (b,f,j,n) arid, (c,g,k,o) semi-arid, and (d,h,l,p) dry sub-humid regions between 1982 and 2015. The power of the quasi-periodicity increases with the blue-green-yellow-red-purple colors, and black dots indicate significance at the 0.05 level.
Forests 13 00100 g003
Figure 4. Correlations between resistance and drought characteristics, including drought length, severity, and interval, when the time spent identifying drought events and drought years include durations of 2, 3, 4, 5, and 6 consecutive months in (a) hyper-arid, (b) arid, (c) semi-arid, and (d) dry sub-humid regions. * p < 0.05; ns, not significant. CM2, CM3, CM4, CM5, and CM6 represent 2, 3, 4, 5 and 6 consecutive months, respectively.
Forests 13 00100 g004
Figure 5. Changes in resistance as drought intensity in (ad) drought length, (eh) severity, and (il) interval increases in case of incomplete resistance (resistance < 1) in the (a,e,i) hyper-arid, (b,f,j) arid, (c,g,k) semi-arid, and (d,h,l) dry sub-humid regions. lg indicates the log10 transformed. The linear relationships between lg-transformed resistance and lg-transformed drought characteristics indicate the power-law relationships between resistance and drought characteristics. *** p < 0.001.
Forests 13 00100 g005
Figure 6. Differences in (ad) drought length, (eh) severity, and (il) interval corresponding to complete (resistance ≥ 1) or incomplete (resistance < 1) resistance in (a,e,i) hyper-arid, (b,f,j) arid, (c,g,k) semi-arid, and (d,h,l) dry sub-humid regions. Black dots indicate average values. Black boxes indicate a non-significant difference, while the red and blue boxes indicate significant differences.
Forests 13 00100 g006
Table 1. Correlations between resistance and drought characteristics in hyper-arid, arid, semi-arid, and dry sub-humid regions.
Study AreaDrought CharacteristicsResistance
Correlation (r)Significancen
Hyper-aridDrought length (months)−0.300***17,829
Arid−0.238***47,431
Semi-arid−0.443***37,838
Dry sub-humid−0.367***11,420
Hyper-aridDrought severity0.080***17,829
Arid−0.052***47,431
Semi-arid0.142***37,838
Dry sub-humid0.129***11,420
Hyper-aridDrought interval (years)0.011ns17,829
Arid−0.068***47,431
Semi-arid0.059***37,838
Dry sub-humid0.266***11,420
*** p < 0.001; ns, not significant. The spatial resolution of the study area is 0.1° × 0.1°, and n is the number of grid points.
Publisher’s Note: MDPI stays neutral with regard to jurisdictional claims in published maps and institutional affiliations.

