Article

Correlation between Genetic Characteristics, Cell Structure and Material Properties of Moso Bamboo (Phyllostachys edulis (Carriere) J. Houzeau) in Different Areas of China

1
International Center for Bamboo and Rattan, No. 8, Futong Eastern Avenue, Wangjing Area, Chaoyang District, Beijing 100102, China
2
Key Laboratory of National Forestry and Grassland Administration, Beijing for Bamboo & Rattan Science and Technology, No. 8, Futong Eastern Avenue, Wangjing Area, Chaoyang District, Beijing 100102, China
*
Author to whom correspondence should be addressed.
These authors contributed equally to this work.
Forests 2022, 13(1), 107; https://doi.org/10.3390/f13010107
Submission received: 26 November 2021 / Revised: 17 December 2021 / Accepted: 9 January 2022 / Published: 12 January 2022
(This article belongs to the Special Issue Protection and Modification of Wood and Bamboo Materials)

Abstract

:
Moso bamboo (Phyllostachys edulis (Carriere) J. Houzeau), native to China, is one of the most economically and ecologically important bamboo species. Since the economic interests and the strong clonality, it has been widely cultivated in southern China, which inevitably reduces the natural stands and leads to gene loss in this species. In this study, three natural populations of Moso bamboo distributed in Anhui, Guangxi, and Zhejiang province, were used to analyze the correlation between phenotypic traits, cell structure, and material properties from the perspective of phenotypic, genetic, and environmental. Among those traits and properties, fiber width was correlated with wall thickness at breast height and average nodes length under branch positively. Leaf length was correlated positively with fiber lumen diameter and parenchyma lumen diameter. Furthermore, it showed a very close correlation between moisture content, bending strength, modulus of elasticity, and diameter at breast height, clear height, and leaf length. The lumen diameter of fiber cell wall thickness is positively correlated with bending strength and modulus of elasticity. Density is positively correlated with parenchyma cell wall thickness. The experimental design is relatively detailed and representative, and the workload is huge. This study reflects the research objectives with scientific and rational experiments and data. This study will analyze the differences of various indicators from the perspective of genetic to build a bridge between micro-structure and macro-structure for rational utilization of the whole area of Moso bamboo resources in China.

1. Introduction

Bamboo is an important non-woody forest resource rich in natural lignocellulose. The global annual output of bamboo is about 1.5 billion, and continuously regenerated bamboo is an important alternative resource for about 1/2 of the annual wood gap (250 million m3) [1,2]. China is one of the distribution centers of bamboo plants, ranking first in the world in terms of bamboo species, storage, and area [3,4,5]. There are more than 800 bamboo species in China, which contains more than 1/3 of the bamboo species of the world. Moso bamboo (Phyllostachys edulis (Carrière) J. Houz.) is one of the core bamboo species in the development of the bamboo industry, which has the widest distribution area, the highest output value, and the best industrial utilization in China. Under the background of modern forestry advocating “developing bamboo in place of plastic, timber and steel substitute”, it is particularly important to accelerate the utilization and research of bamboo. However, at present, the germplasm resources of Moso bamboo cannot be fully and rationally exploited, which is a great challenge to bamboo breeders.
The adaptability of Moso bamboo is different in different areas of China [6,7], thus the evaluation of Moso bamboo resources is a basic work. Phenotypic traits are intuitive and measured conveniently and are associated with other traits, which can provide reliable genetic information for breeders [8]. Furthermore, organisms, as an organic whole, are bound to have certain correlations among various organs. This structural relationship is a manifestation of the genetic stability of species and is also affected by environmental conditions. From the perspective of quantitative genetics, phenotypic correlation, and genetic correlation can be used to describe the degree of correlation between different traits due to environmental and genetic reasons. Therefore, in order to excavate fine bamboo germplasm in different geographical environments, it is necessary to analyze and correlate phenotypic traits with traits that affect bamboo yield or quality performance comprehensively, such as fiber cell structure and physical and mechanical properties [9,10].
Bamboo culm is composed of nodes and internodes, shaped similar to a conical shell and hollow. This special structure is closely related to its mechanical properties, which determines the good specific strength and specific stiffness of bamboo [11,12,13]. However, the distribution of vascular bundles in bamboo is not uniform. The age, moisture content, and other conditions of bamboo are related to the species. Therefore, different factors such as bamboo species, growth characteristics, growth environment, water content, and bamboo microstructure will make great differences in mechanical properties [14]. It plays an important role in determining bamboo stiffness, that is, the size and arrangement of the fiber sheaths surrounding the vascular bundles and the arrangement of microfibers of crystalline cellulose in the secondary cell walls [15]. Fiber length is closely related to fiber diameter and cell wall thickness. Internode fiber length is closely related to internode length. The internode is the longest in the middle of bamboo culm, thus there are longer fibers [16,17].
Since 1971, scholars have studied the Phenotypic traits, microscopic structure, density, desiccation, and mechanical properties of vascular bundles of bamboos [18,19,20,21]. The properties and utilization of bamboo are affected by the structural changes brought about by the bamboo ripening process [15,22,23,24,25]. The study shows that the anatomical properties of bamboo are related to the processing properties, toughness, and strength of bamboo [22]. The fiber length of bamboo is positively correlated with the modulus of elasticity and compressive strength and negatively correlated with the shear strength [26,27]. Fiber length is also an important index to evaluate the papermaking properties of bamboo [28,29]. In the process of bamboo production and processing, if the parenchyma tissue and vascular bundle tissue are not separated in advance, the parenchyma may not be conducive to quality or are wasted and discharged in the form of waste and wastewater [30]. This will reduce the comprehensive utilization of bamboo and cause a waste of resources.
This study will analyze the differences of various indicators from the perspective of genetic to build a bridge between the micro-structure and macro-structure. That will provide the most basic theory for the pulp paper and engineering using bamboo, also lay a foundation for mining the fine bamboo germplasm in different geographic environments and rational utilization of the whole area of bamboo resources in China.

2. Materials and Methods

2.1. Plants Materials

According to the subtropical climate, the distribution area of Moso bamboo (Phyllostachys edulis) in China has been divided into 3 groups, north subtropical area, central subtropical area, and south subtropical area [31]. In each area, we selected a location planted Moso bamboo with abundant genetic diversity as one population, respectively. Three populations of Phyllostachys edulis were obtained distributed in Huoshan county of Anhui Province, Guanyang county of Guangxi Province, and Anji county of Zhejiang Province (Table 1).
Materials were collected from the nature forest of Moso bamboo. A total of 70 samples were taken from each area as a population. To avoid sampling the same clone plant, we collected the individual plant in the same direction and from more than 50 m apart. The collected materials should be 3- or 4-years-old and comply with the Chinese national standard GB/T 2690-2000 “Mao Bamboo plant”. One intact and undamaged internode of each plant from diameter at breast height was cut and bought back to the lab as the experimental material.

2.2. Determination of Phenotypic Traits

The diameter at breast height (DBH), node length at DBH, clear height, and Nodes under branch were measured before cutting using the DBH ruler. The average of nodes length under branch was calculated. When the internodes brought back to the lab were cut, the wall thickness at DBH in the 4 directions of bamboo rings was measured for averaging.
A total of 50 leaves were selected randomly from the upper, middle, and lower parts of the bamboo culm. The length of every leaf was measured from the tip of the leaf to the point where the leaf joins the petiole but not including the petiole, and the widest part of the leaf was measured as the leaf width. The average length and width of 50 leaves in every plant and their ratio of length to width were calculated [32,33].

2.3. Determination of Cell Structure

2.3.1. Frequency and Size of Vascular Bundle

A sample piece of the central internode was cut, 10 mm × 10 mm × t mm (bamboo wall thickness), as test materials. The materials were softened for 2–3 h, cut into 30–40 microns thin, dry gas, and made a permanent microscope section. Under the system of microscopic imaging, the bamboo wall sections were divided into 3 uniform divisions along the radial direction of the bamboo wall using image analysis software. The 3 divisions were bamboo green (BG) in the outer zone, bamboo timber (BT) in the middle zone, and bamboo yellow (BY) in the inner zone, respectively. The Frequency of the vascular bundle was determined by checking the number of the vascular bundle in BT of bamboo, the size of the vascular bundle by the ratio of the length to width of the vascular bundle [34].

2.3.2. Length and Width of Fiber and Parenchyma

The fiber length and width of bamboo samples were determined by the segregation process [32,35]. The BT of samples were cut into about 2 cm length as a matchstick and put into the test tube. After the complete segregation of the sample, the segregation liquid was poured out, and then the samples were washed with distilled water to make temporary sections. The sections were amplified and measured by a digital projector 50 times. Each bamboo was randomly measured with 30 fibroblasts and 30 parenchyma cells for their length and width, as shown in Figure 1.

2.3.3. Wall Thickness and Lumen Diameter of Fiber Cell and Parenchyma

In this study, the wall thickness of fiber cells and parenchyma refers to the wall thickness of the single-cell [33]. The prepared permanent Section 2.3.1 was imaged 400 times based on the system of microscopic imaging, and the thickness and lumen diameter were measured by the wood analysis software. The 30 fibroblasts and 30 parenchyma cells of each bamboo were measured randomly for their wall thickness and lumen diameter, as shown in Figure 1.

2.3.4. Crystallinity

After being air-dried, the culms of mature bamboo were fractionated manually with a knife into 3 parts: bamboo green (BG), bamboo timber (BT), and bamboo yellow (BY). The BT parts were ground, and the fraction passing 80-mesh but not 100-mesh was collected for determining crystallinity of cellulose by X-ray diffractometer [36]. The copper target was used for X-ray tube and nickel plate for eliminating CuKa radiation. The control scanning voltage was 40 kV, and the scanning current was 40 mA. The scanning speed was 0.02°/s, and the sample scanning range was from 5° to 45°. According to the intensity of the diffraction pattern, the Segal method was adopted to calculate the relative crystallinity. There was a maximum diffraction peak (I200) near the scanning curve (2θ = 22°), and a minimum peak (Iam) near the scanning curve (2θ = 18°), then the calculation formula of crystallinity is the following formula:
Cr = ((I002 − Iam)/I200) × 100%
where Cr is the percentage of relative crystallinity, I002 is the maximum strength of lattice diffraction Angle (002), namely the diffraction intensity in the crystal region. Iam is the scattering intensity of non-crystal background diffraction at 2θ = 18°.

2.4. Material Properties

2.4.1. Physical Properties

The physical properties of bamboo were carried out according to GB/T 157805-1995 (1995) and the method of [37]. The measurement traits included oven-dried volume shrinking ratio, air-dried volume shrinking ratio, moisture content, oven-dried density, and air-dried density. A total of 10 samples of each bamboo were measured.

2.4.2. Microfibril Angle

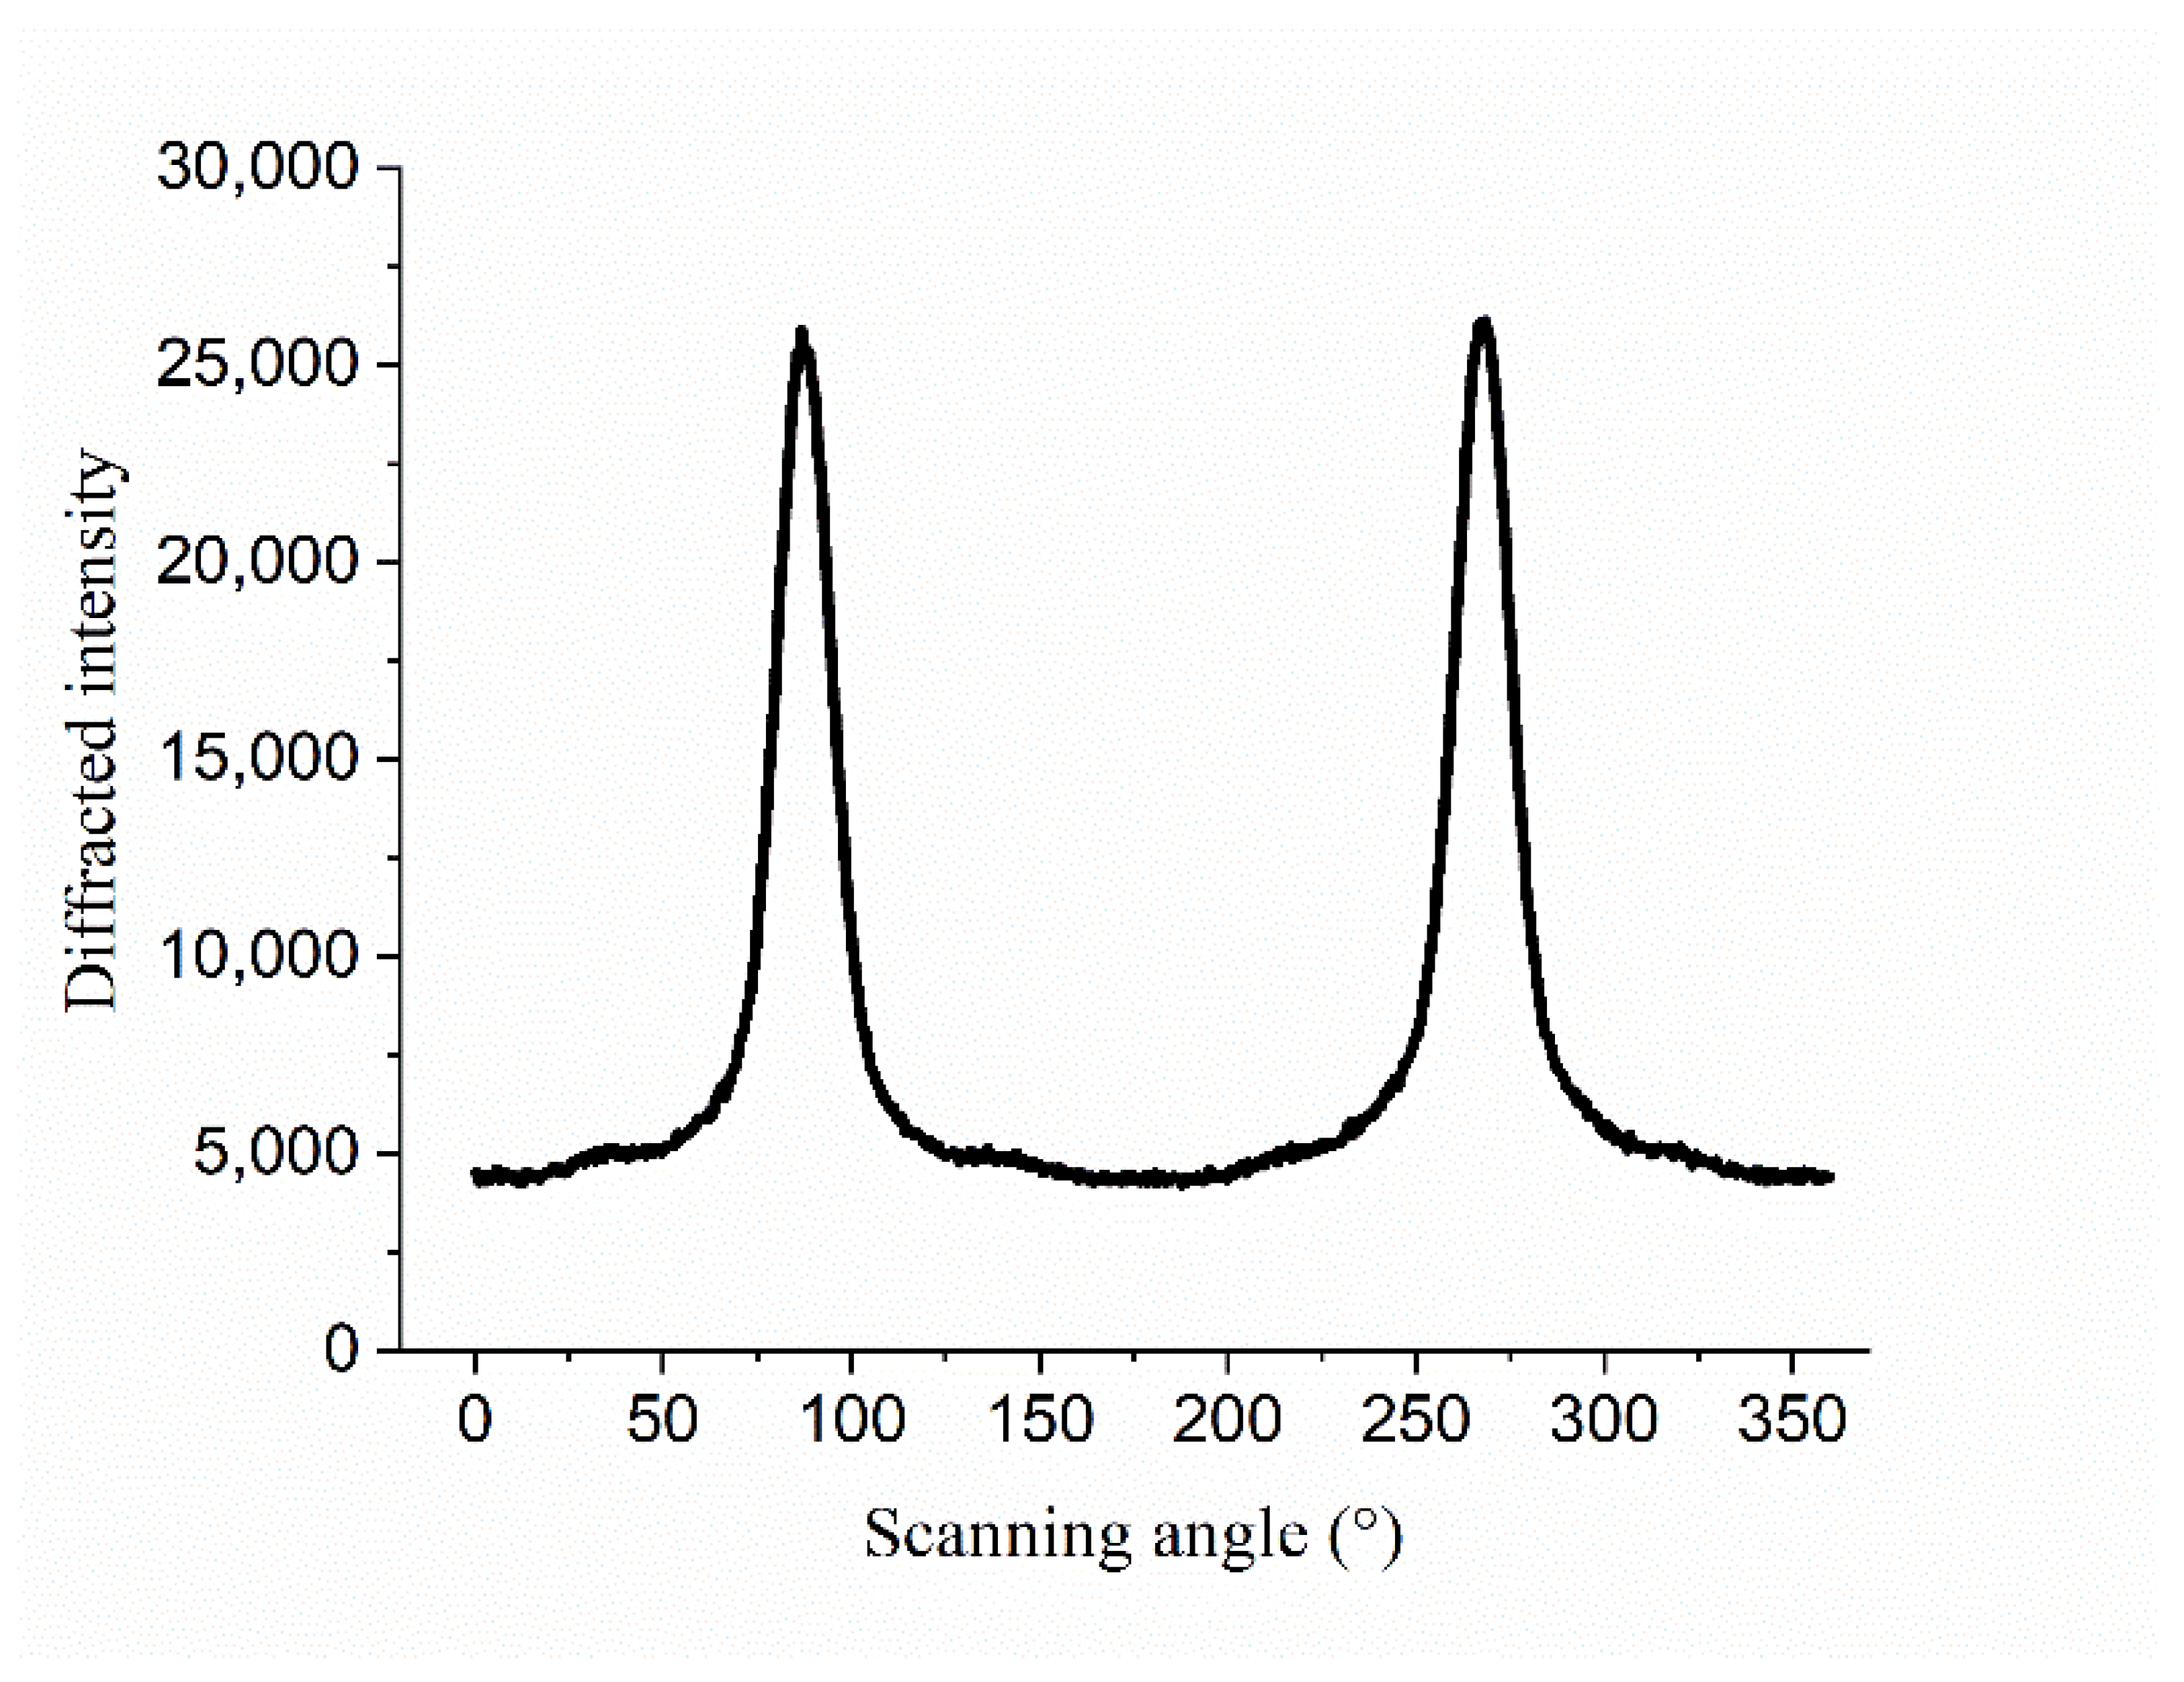
With a sharp single-sided blade, BY and BG of the bamboo block (about 10 mm × 20 mm × t mm) were carefully removed. After the fibers were exposed, the stringy thin slices with a thickness of about 1 mm were cut out as the measurement samples of microfibril Angle (MFA). The test equipment was an X-ray diffractometer. The X-ray source was CuK, the wavelength was 0.154 and 178 nm, and the transmission diffraction pattern was adopted. The control scanning voltage was 40 kV, and the scanning current was 40 mA. The diffraction image was processed with Origin software to realize the fast calculation of the microfilament angle (Figure 2). Each bamboo was measured 5 times by 5 samples.
The specific calculation method was as follows: Phi scanning intensity data obtained by X-ray was imported into Origin8.0, and the scanning curve was fitted by Gaussian function. MFA was calculated using 0.6T method, and its fitting function is:
MFA = 0.6 T = 0.6 ( σ 1 + σ 2 )
where σ1 and σ2 are half peak width in degrees. T is for σ1 + σ2 in degrees. The unit of MFA is degree [38].

2.4.3. Mechanical Properties

The mechanical properties of bamboo were carried out according to GB/T 157805-1995 (1995) and the method of Tran [39] and Zhang [40]. The measurement traits included bending strength (MOR) and Modulus of Elasticity (MOE). The sample size was 160 mm (length) × 10 mm (width) × t mm (bamboo wall thickness). The span of the bending test was 120 mm, and the compression speed was 8 mm/min along the string direction of the bamboo wall. Each set of tests was repeated 5 times by 5 samples of each bamboo.

2.5. Data Analysis

2.5.1. Data Verification

Data were analyzed by R statistical software (R 3.5.3). The normality was tested, and the fitting graph of the normal distribution was drawn by shapiro.test function in the stats package. The homogeneity of variance was tested by the bartlett.test. The regression equation was fitted using the lm. The AOV function was used for a one-way ANOVA. The glht function in the multcomp packet was used for multiple comparative analyses. Principal component analysis (PCA) was carried out by using prcomp in the stats package to obtain eigenvalue and contribution rate. The gravel diagram of PCA was drawn by fa.parallel function in the psych package.

2.5.2. Correlation Analysis

Genetic correlation refers to the correlation between two traits in the same population or between the same trait in different years or at different locations due to genetic factors. The phenotypic variance could be divided into genetic variance and environmental variance. In the same way, phenotypic covariance can also be divided into genetic covariance and environmental covariance. Therefore, the corresponding phenotypic correlation, genetic correlation, and environmental correlation can be calculated. In forestry, it is one of the important contents of genetic determination to develop the correlation among different traits, also an important basis for indirect selection of forest trees [41].
The phenotypic correlation coefficient, genetic correlation coefficient, and environmental correlation coefficient were analyzed using batch and pin commands in the ASReml statistical analysis software based on R language [41,42]. The three kinds of correlation coefficients were estimated according to the variance and covariance. The formula is as follows:
Phenotypic   correlation   coefficient : r p = c o v p ( x ,   y ) / σ 2 p x × σ 2 p y  
Genetic   correlation   coefficient   : r g = c o v g ( x ,   y ) / σ 2 g x × σ 2 g y
Environmental   correlation   coefficient : r e = c o v e ( x ,   y ) / σ 2 e x × σ 2 e y
In the above formula, Covp(x,y), Covg(x,y), and Cove(x,y) represented phenotype covariance, genotype covariance, and environment covariance, respectively. σ2p, σ2g, and σ2e represented phenotype variance, genotype variance, and environmental variance, respectively. σ2px and σ2py represented the phenotypic variance of trait X and trait Y, σ2gx and σ2gy represented the genetic variance of trait X and trait Y, and σ2ex and σ2ey represented the environmental variance of trait X and trait Y.
Generally speaking, the absolute value of the correlation coefficient in 0~0.09, 0.1~0.3, and 0.5~1.0 mean no correlation, weak correlation, and strong correlation, respectively. However, a significant difference test, namely t-test, was necessary to test whether the 2 groups of data were significantly correlated. In this study, if the correlation coefficient of the 2 groups of data was greater than 0.3 and the difference was significant, both of the data was seen to be correlated. The significance level of correlation was analyzed by the corr.test function in psych package and the correlation chart among traits was drawn by corrgram function in corrgram package.

3. Results

3.1. Analysis of Phenotypic Traits and Correlation

3.1.1. Data Analysis of Phenotypic Traits

In order to investigate the variation of phenotypic traits of Phyllostachys edulis distributed in different subtropical provenance regions, 209 samples of Moso bamboo distributed in Anhui, Guangxi, and Zhejiang province were obtained. Nine phenotypic traits were analyzed using a one-way ANOVA and principal component analysis based on R. These traits were diameter at breast height (DBH), node length at DBH (NL_DBH), Wall thickness at DBH (WT_DBH), Clear height (CH), Average of nodes length under branch (NL_CH), Nodes under branch (N_CH), Leaf length (LL), Leaf width (LW), and Leaf length/leaf width (LL.LW), respectively. The data has been published and showed that the phenotypic traits of Moso bamboo were significantly different from 3 populations [43]. The main research results were as follows, the peaks of three DBH traits (DBH, NL_DBH, WT_DBH) and NL_CH were all from Anhui Province. The maximum of CH, N_CH, and LL were all in Guangxi Province. Within 3 populations, the variable coefficient of CH and NL_CH were the largest. The peaks of the variable coefficient of the three leaf traits (LL, LW, and LL.LW) were all from Guangxi Province.

3.1.2. Correlation Analysis of Phenotypic Traits

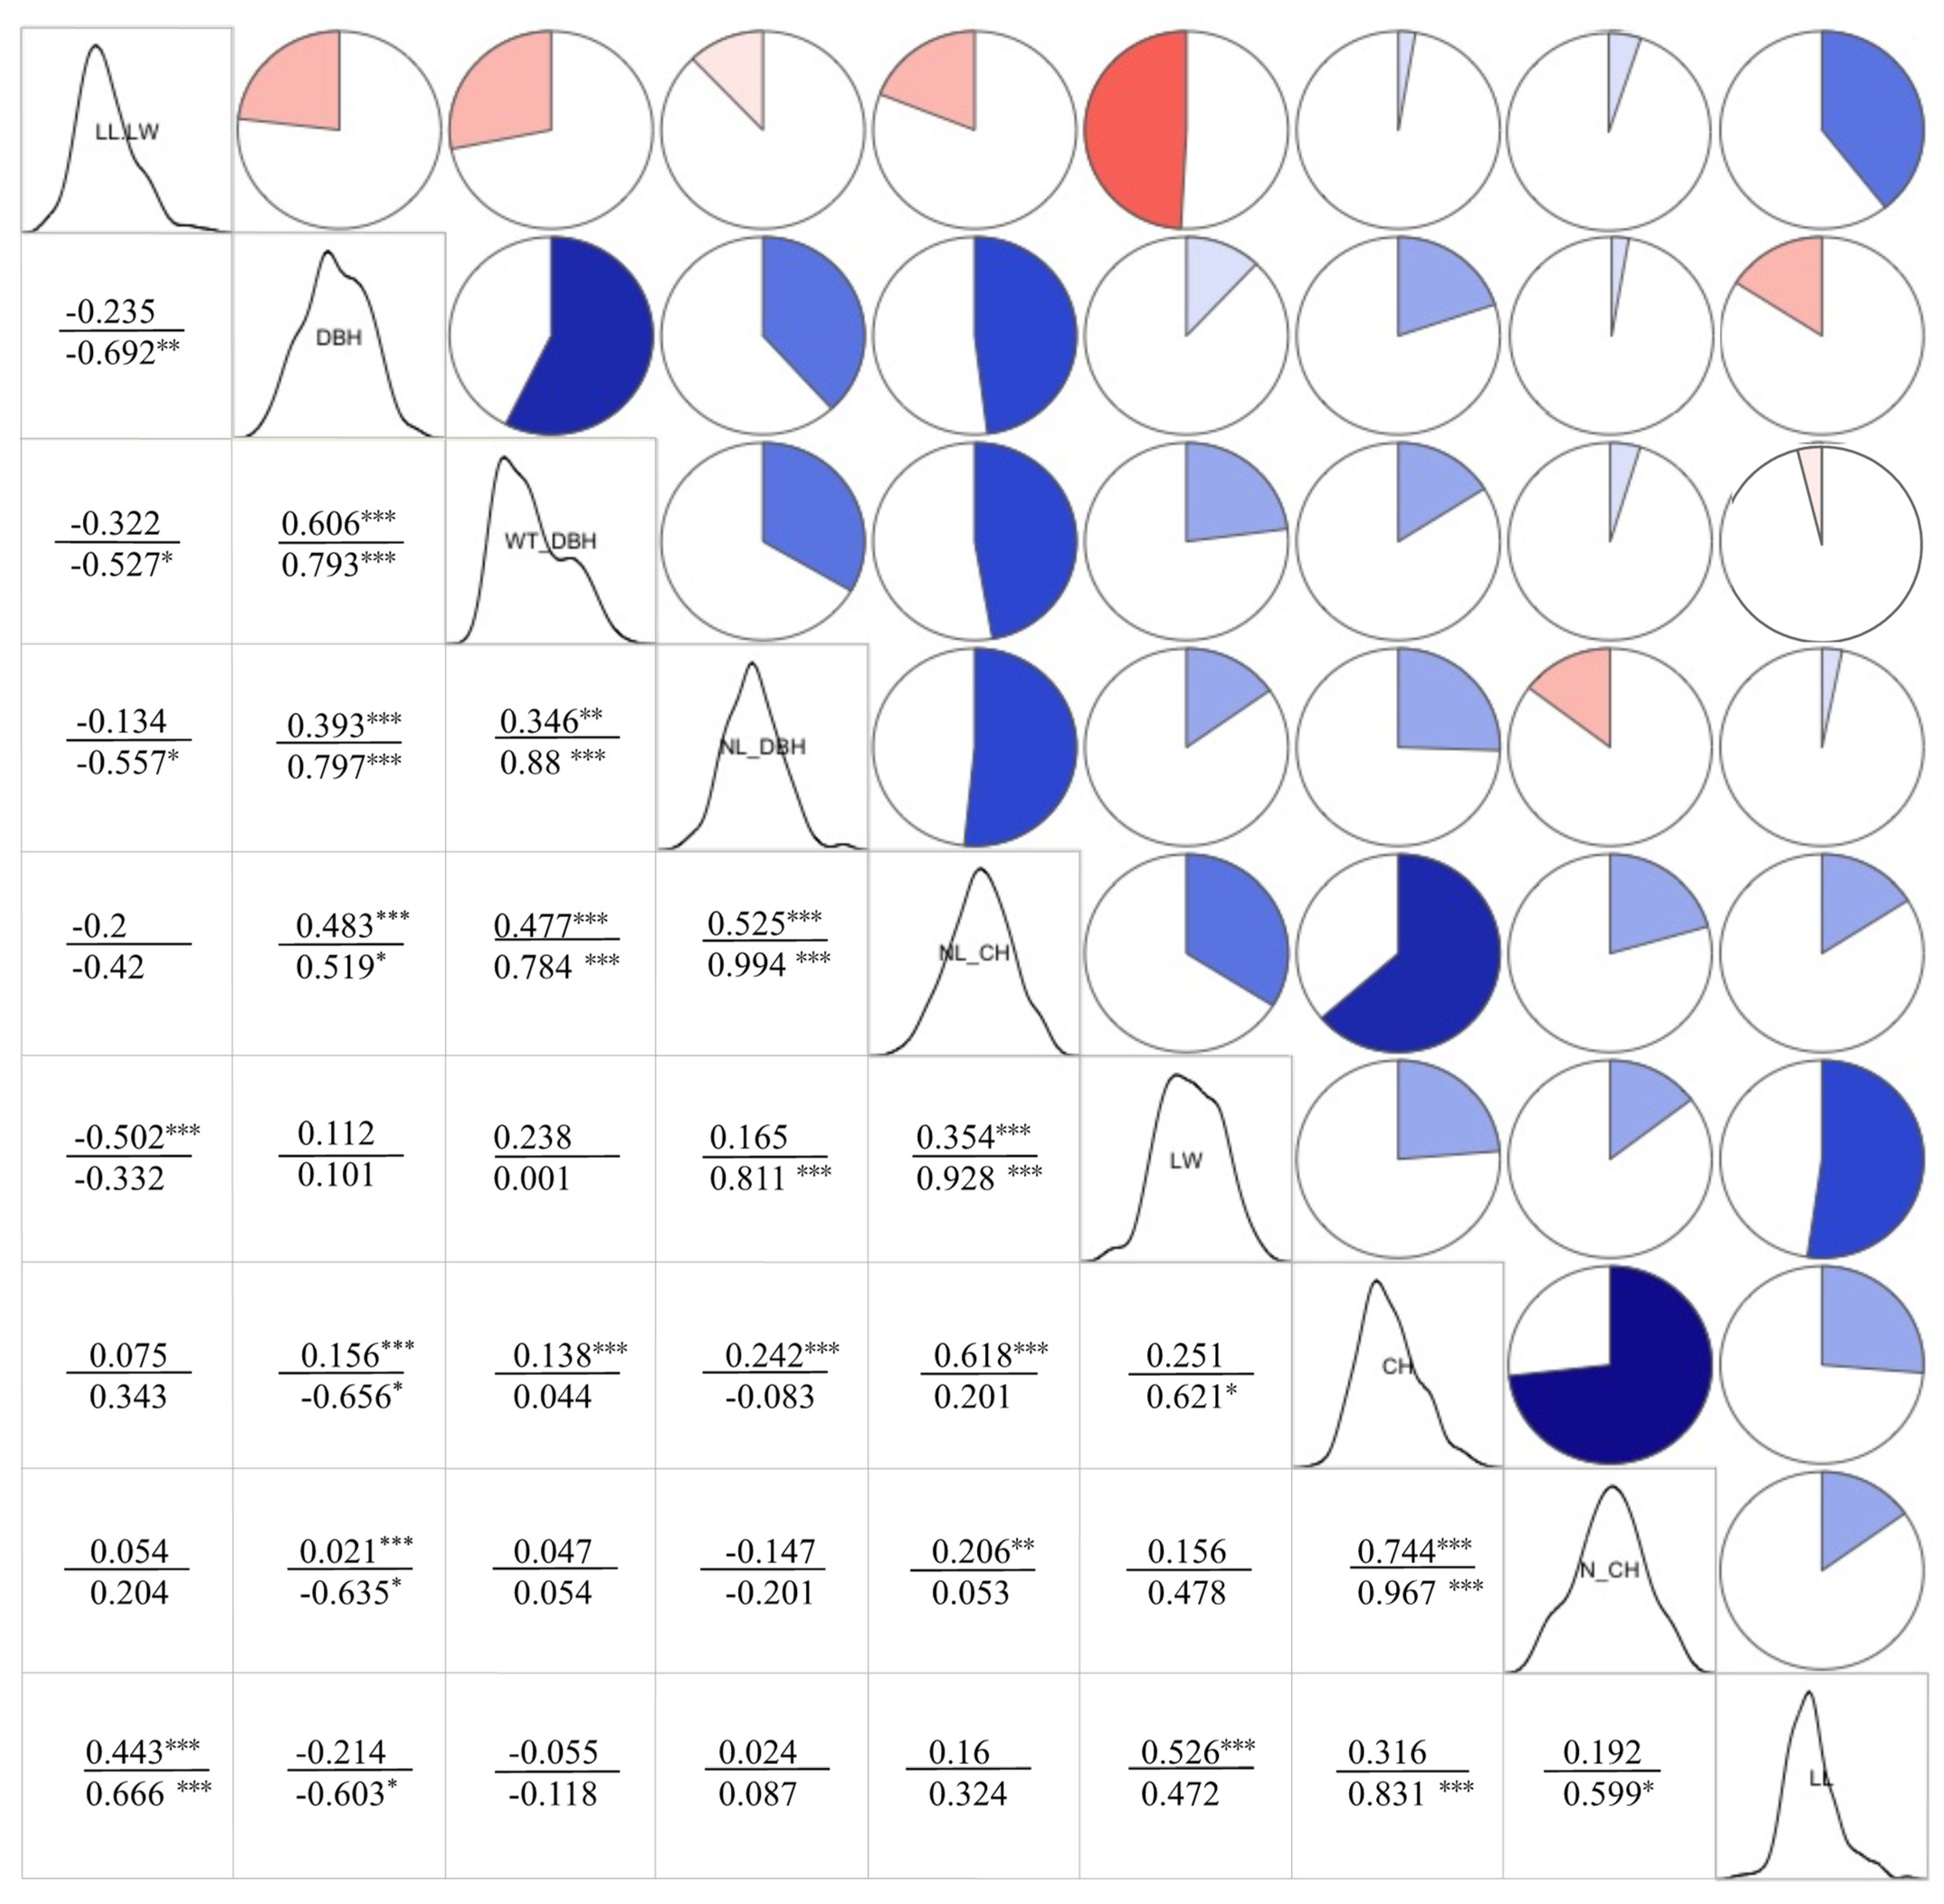
Based on the phenotypic traits of Phyllostachys edulis from Anhui, Guangxi, and Zhejiang, the analysis of phenotypic correlation and genetic correlation were carried out on the genetic variation of nine phenotypic traits (Figure 3). The results showed that there were different degrees of correlation among the traits, both in phenotype and heredity.
The clear height (CH) was highly positively correlated with NL_CH and N_CH. The phenotypic correlation (genetic correlation) was the highest among all traits and reached the extremely significant level of 0.1%, which was 0.618 (0.201) with NL_CH and 0.744 (0.967) with N_CH, respectively. It indicated that the larger CH is, the longer NL_CH is and the more N_CH is. NL_CH was positively correlated with the DBH, NL_DBH, and WT_DBH. The phenotypic correlation (genetic correlation) were 0.483 (0.519), 0.525 (0.994) and 0.477 (0.784), respectively. In the genetic correlation, the three pairs of indicators all reached a significant positive correlation, indicating that they were controlled by the genetic mechanism.
Whether phenotypic correlation or genetic correlation, the three DBH traits (DBH, NL_DBH, WT_DBH) were positively correlated and reached a very significant level. The phenotypic correlation (genetic correlation) was 0.606 (0.793), 0.393 (0.797) and 0.346 (0.88). It showed that the larger DBH is, the longer NL_DBH is, and the thicker WT_DBH is. In the selection of bamboo material, the DBH and NL_DBH were used to predict the WT_DBH for rational classification and utilization of bamboo.
There was a very significant correlation between the three leaf traits (LL, LW, and LL.LW). The phenotypic correlation coefficients between LL and LW, LL, and LL.LW, LW, and LL.LW were 0.526, 0.443, and −0.502, respectively. As LL.LW was the ratio of leaf length to width, it was a general rule that the LL.LW was positively correlated with LL and negatively correlated with LW. The phenotypic correlation was highly positive between LL and LW. The genetic correlation between them showed a very high significance, which the correlation coefficient was 0.666, indicating that the correlation between leaf length and width was mainly controlled by genetic mechanism. There was a high significance and medium positive correlation between LW and NL_CH. It indicated that leaf width could further reflect the trait of NL_CH, and indirectly measure the three traits of DBH.

3.2. Analysis of Cell Structure Traits and Correlation

3.2.1. Data Analysis of Cell Structure Traits

From the 209 samples of Moso bamboo in three natural populations, 11 cell structure traits were diameter and analyzed, including Vascular bundle frequency (FRE_VB), Radial/tangential ratio of the vascular bundle (RL.TL_VB), Fiber length (L_FIBER), Fiber width (W_FIBER), Fiber cell wall thickness (WT_FIBER), Fiber lumen diameter (LD_FIBER). Crystallinity (MPSS), Parenchyma length (L_PAREN), Parenchyma width (W_PAREN), Parenchyma cell wall thickness (WT_PAREN), and Parenchyma lumen diameter (LD_PAREN), respectively. The data about cell structure traits of Moso bamboo was published and were significantly different from the three populations, except vascular bundle frequency [44]. The main research results were as follows, the peaks of RL/TL-VB, W_FIBER, L_PAREN, W_PAREN, and WT_PAREN were all from Anhui Province. The maximum of L_FIBER, WT_FIBER, LD_FIBER, and MPSS were all in Guangxi Province. The peaks of the variable coefficient of vascular bundle traits were all from Guangxi Province. The maximum of the variable coefficient of WT_FIBER and LD_FIBER were from Anhui Province.

3.2.2. Correlation Analysis of Cell Structure Traits

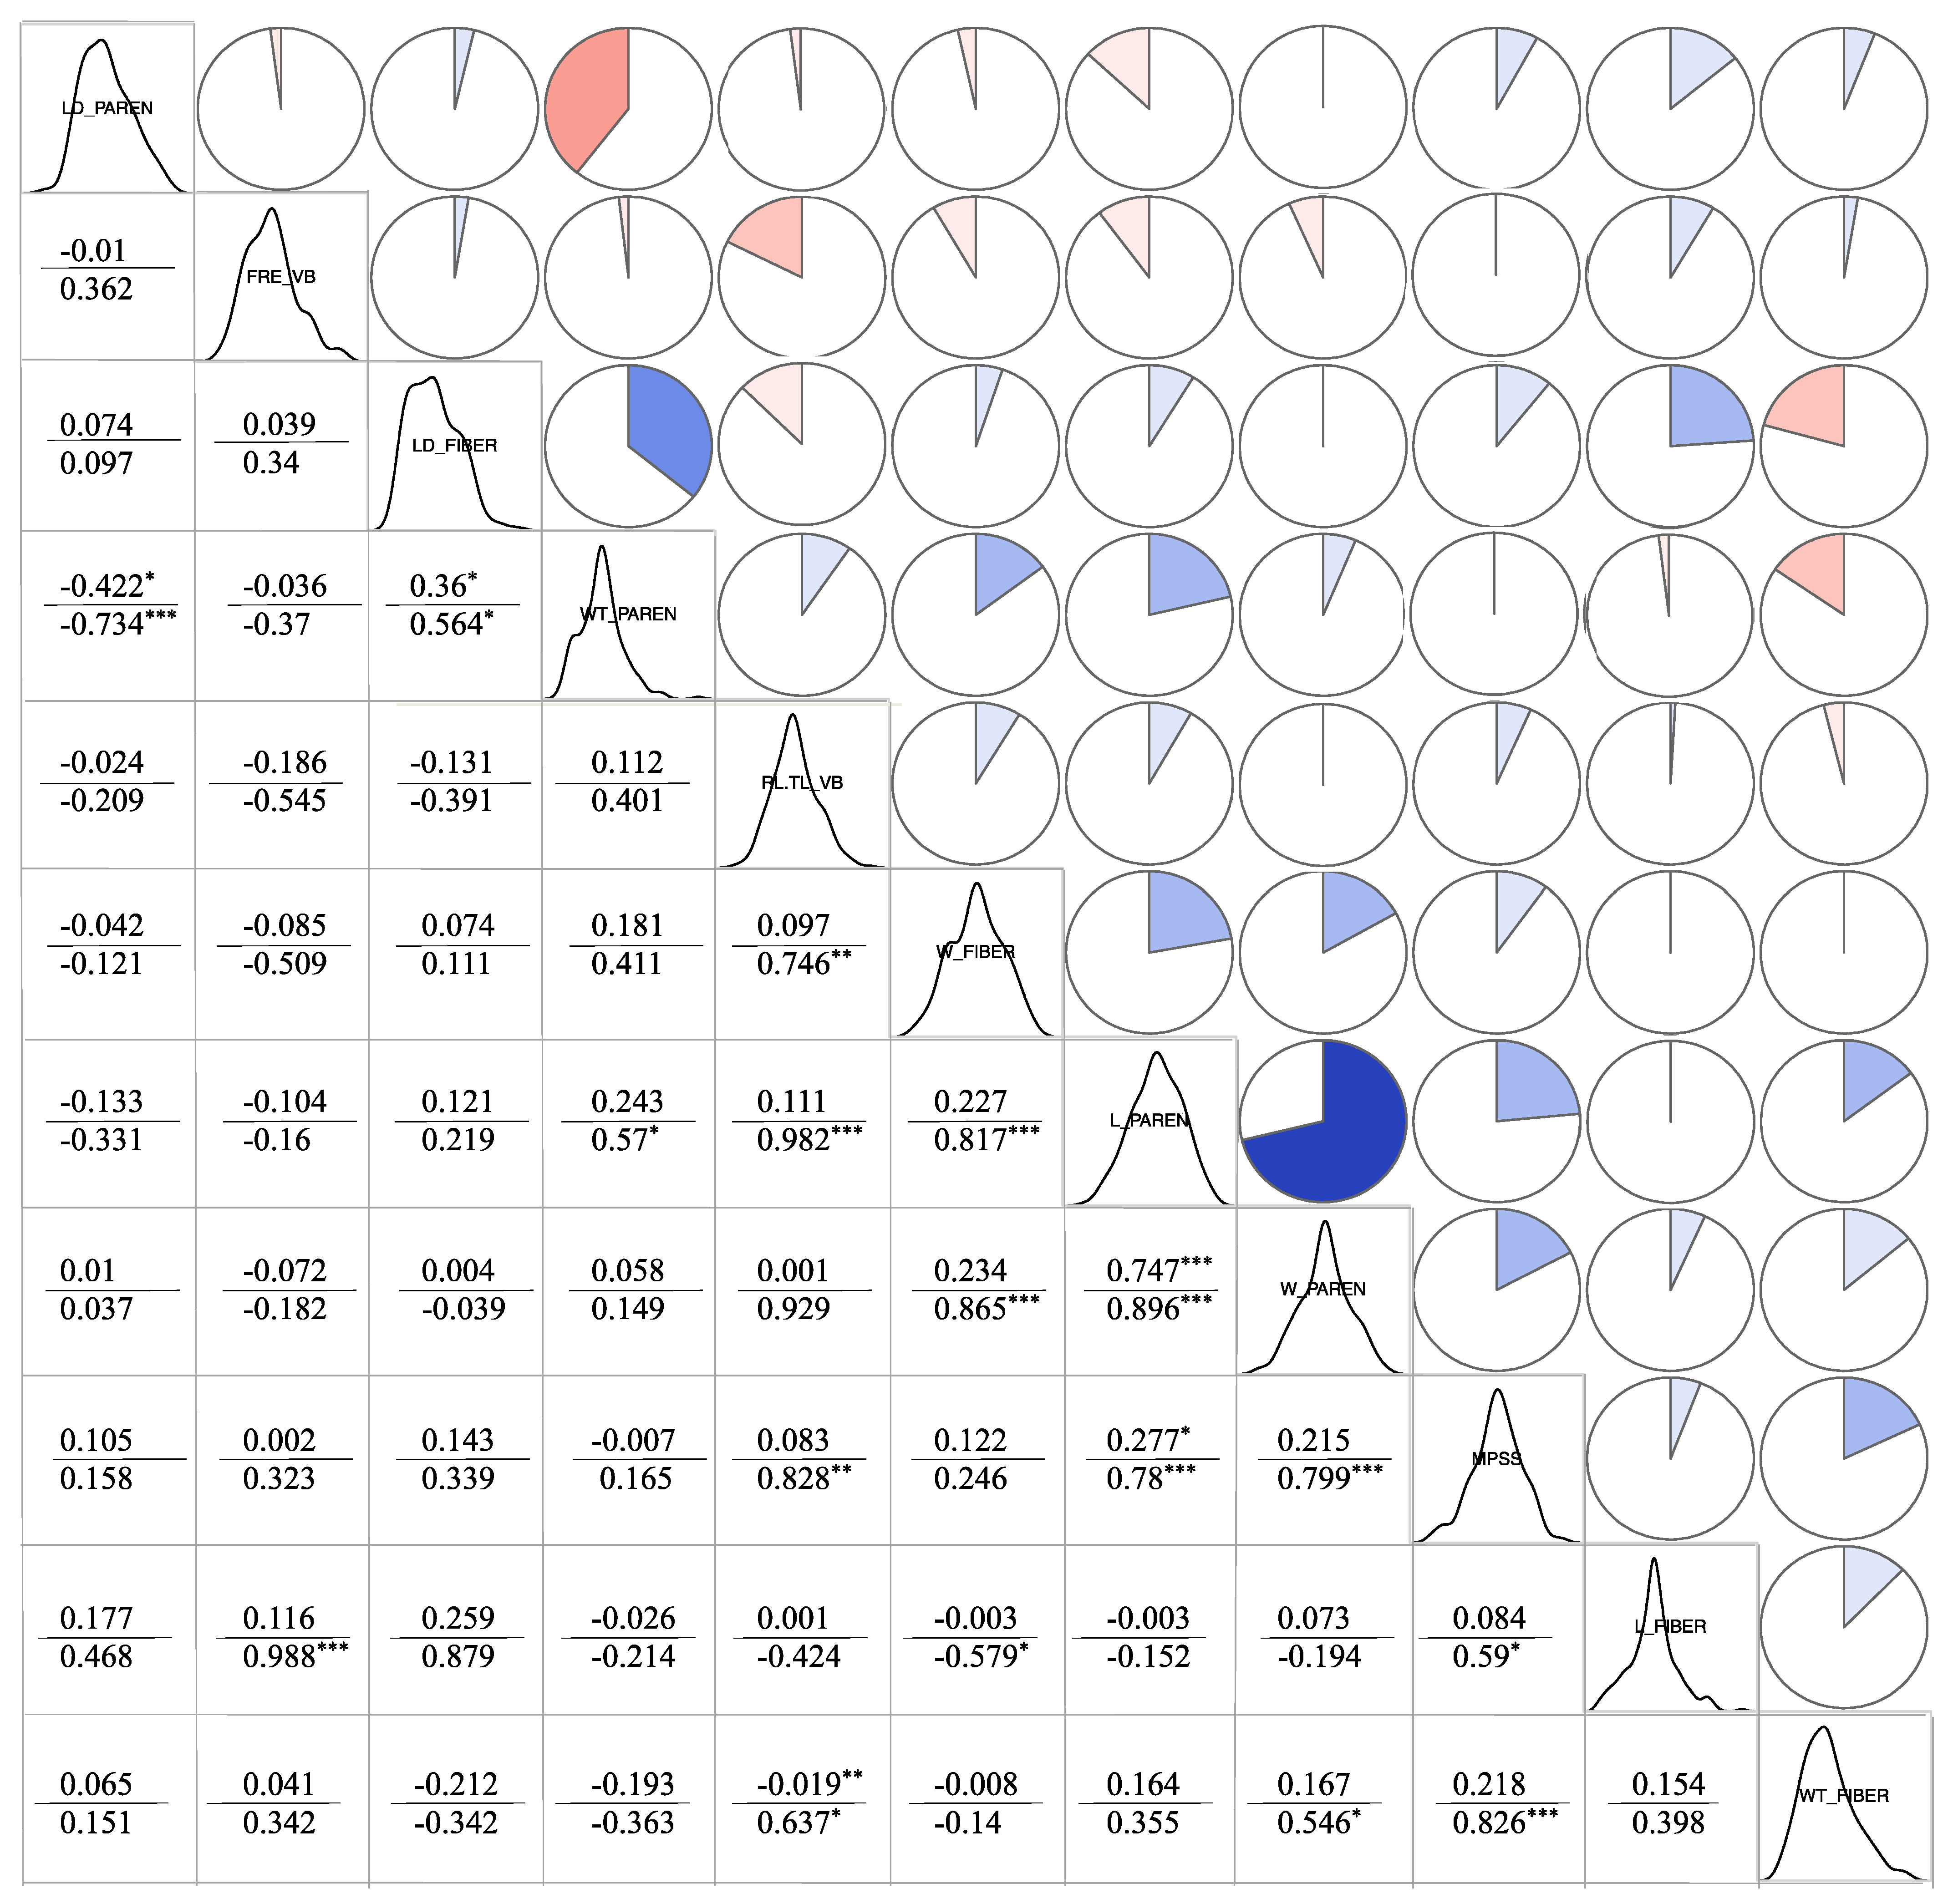
Based on the cell structure data of Phyllostachys edulis from three areas, the analysis of phenotypic correlation and genetic correlation were conducted on the 11 cell structure traits (Figure 4). The results showed that the overall correlation among the 11 traits was low, and only the correlation of the three groups reached more than 0.3.
The correlation between L_PAREN and W_PAREN was the highest, and the phenotypic correlation (genetic correlation) was 0.747 (0.89) with a highly positive correlation and extremely significant level of 1%. It indicated that the elongation of parenchyma cells could promote its lateral broadening. There was not the same correlation between L_FIBER and W_FIBER of fiber cells with a phenotypic correlation of approximately 0 and a genetic correlation of 0.579, unlike the L_PAREN and W_PAREN with a highly positive correlation.
There was a negative correlation between WT_PAREN and LD_PAREN of parenchyma cells with the phenotypic correlation (genetic correlation) of −0.422 (−0.734). It indicated that LD_PAREN decreased with the increase of WT_PAREN. There was a positive correlation between WT_PAREN and LD_FIBER with the phenotypic correlation (genetic correlation) of 0.36 (0.564). It indicated that LD_ FIBER increased with the increase of WT_PAREN.

3.3. Analysis of Physical Mechanic Properties and Correlation

3.3.1. Data Analysis of Physical Mechanic Properties

From the 209 samples of Moso bamboo in three natural populations, 8 physical mechanic properties were diameter and analyzed, including Oven-dried volume shrinking ratio (O_SHRINK), Air-dried volume shrinking ratio (A_SHRINK), Moisture content (MC), Oven-dried density (O_DENSITY), Air-dried density (A_DENSITY), Microfibril Angle (MFA), Bending strength (MOR), and Modulus of Elasticity (MOE), respectively. The data was published and showed that the physical mechanic properties of Moso bamboo were significantly different from the three populations [45]. The peaks of shrink properties, MC, MFA, and bending strength were all from Guangxi Province. The variable coefficient of these traits did not show obvious trends and regulation.

3.3.2. Correlation Analysis of Physical Mechanic Properties

According to the physical mechanic properties of Phyllostachys edulis from the three areas, the analysis of phenotypic correlation and genetic correlation was conducted on 8 properties (Figure 5). The results showed that the overall correlation among the 8 properties was high, and the correlation of several groups reached 0.3 or even more than 0.5.
MOR was highly positively correlated with MOE. The phenotypic correlation (genetic correlation) was the highest among the 8 traits and reached the extremely significant level of 0.1%, which was 0.974 (0.999). O_DENSITY and A_DENSITY were highly positively correlated with the phenotypic correlation of 0.89 and genetic correlation of 0.929. Both of the densities were highly positively correlated with MOE, respectively. The variation coefficients were above 0.5, which reached an extremely significant level. However, the phenotypic correlation between density traits and MOR did not reach a significant level of 5%, which was not statistically significant. The results showed that only MOE of Phyllostachys edulis would be grown with the increase of density, and MOR needs to be further studied. The results of this study that the density was highly positively correlated with MOE, consistent with general research [46].
There was not only a highly and significantly positive correlation between O_SHRINK and that of A_SHRINK with the phenotypic correlation (genetic correlation) of 0.679 (0.71) but also a medium positive correlation between O_SHRINK and MC or O_SHRINK and MFA with 0.377 (0.314) or 0.4 (0.877), respectively. The results showed that the shrinking ratio of volume was closely related to the moisture content of Moso bamboo, and the change affected its MFA. The main reason for bamboo shrinkage is that the vessels in the vascular bundle lose water and shrink [47], which also explains the close relationship between the shrinkage ratio and water content.
The moisture content of bamboo is an important parameter to affect bamboo properties. Their properties of bending and compression differ significantly with the change of water content. In this study, although MC was moderately negatively correlated with MOE and MOR, the phenotypic correlation did not reach the significant level of 5%, and there was no statistical significance.

3.4. Correlation Analysis among Various Traits

3.4.1. Correlation Analysis between Phenotypic Traits and Cell Structure Properties

The correlation was conducted on 9 phenotypic traits and 11 cell structure properties of Moso bamboo from Anhui, Guangxi, and Zhejiang. In the total 99 groups of traits (9 × 11 = 99), the absolute value of the phenotypic correlation of 43 groups was less than 0.1, which could be regarded as no correlation, accounting for 43.43% of the total groups (Table 2). That indicated that there was not much correlation between phenotypic traits and cell structure properties on the whole. There were four groups of traits to obtain medium and high correlation that showed a close correlation.
The phenotypic correlation (genetic correlation) between W_FIBER and WT_DBH was 0.592 (0.953), which was very significant at the 1% level, indicating that the thickness of the bamboo wall at DBH might increase the width of the bamboo fiber at the same height. On the other side, the phenotypic correlation between W_FIBER and NL_CH was 0.377, and the genetic correlation was 0.854, which showed that the larger NL_CH was, the wider bamboo fiber was.
There was a moderate positive correlation between LL and LD_FIBER or LL and LD_PAREN. The phenotypic correlation (genetic correlation) was 0.361 (0.567) and 0.361 (0.687), respectively. They all reached a very significant level of 1%. It indicated that LD_FIBER and LD_PAREN would increase with the longer leaf length. Curiously, there was no significant relationship between LD_FIBER and LD_PAREN. Their phenotypic coefficient was 0.074, showing that LL is significantly related to LD_FIBER or LD_PAREN.

3.4.2. Correlation Analysis between Phenotypic Traits and Material Properties

The correlation was analyzed on 9 phenotypic traits and 8 material properties of Moso bamboo from Anhui, Guangxi, and Zhejiang. In the whole 72 groups of traits (9 × 8 = 72), there were relatively rich groups in the traits to achieve a medium-high correlation (Table 3). The absolute value of the phenotypic correlation of 20 groups was less than 0.1, which could be regarded as no correlation, accounting for 27.78% of the total groups.
The analysis shows that MC, MOR, and MOE were highly correlated with DBH, CH, and LL, respectively, indicating that these six traits are closely related. Among them, MOR and MOE were negatively correlated with DBH, respectively. Moreover, the phenotypic correlation (genetic correlation) was −0.484 (−0.879) and −0.466 (−0.857), respectively. At the same time, MOR and MOE were significantly positively correlated with CH and LL, indicating that the smaller DBH, the larger CH, or the longer leaf might all increase MOR and MOE.
The MFA of bamboo showed a moderate negative correlation with NL_DBH and NL_CH with phenotypic correlation (genetic correlation) of −0.324 (−0.963) and −0.316 (−0.831), respectively. That showed a close relationship between MFA and the node length of bamboo. Moreover, because NL_CH and NL_DBH are highly positively correlated (3.1 above), the increase of any of the two traits may decrease the bamboo MFA.
A_SHRINK was significantly negatively correlated with LW, and the phenotypic correlation (genetic correlation) was −0.323 (−0.714), indicating that the wider the leaf was, the smaller the A_SHRINK was. The absolute value of correlation between LL and A_SHRINK was less than 0.1, which could be seen as no correlation. However, there was a significant and positive correlation between A_density and LL with the phenotypic correlation (genetic correlation) of 0.334 (0.973), indicating that the longer the leaf was, the higher the A_density was. Therefore, the A_DENSITY and A_SHRINK of bamboo can be measured indirectly by measuring leaf length and leaf width during field investigation and sampling.

3.4.3. Correlation Analysis between Cell Structure and Material Properties

The correlation was conducted on 11 cell structure properties and 8 material properties of Moso bamboo from Anhui, Guangxi, and Zhejiang. In the total 88 groups of traits (11 × 8 = 88), the absolute value of the phenotypic correlation of 30 groups was less than 0.1, which could be regarded as no correlation, accounting for 34.09% of the total groups (Table 4). Some physical–mechanical properties, such as SHRINK, DENSITY, MOR, and MOE) were closely correlated with wall thickness and lumen diameter, while MC and MFA were not correlated with all cell structure properties.
The increase of wall thickness of fiber is the result of the thickening of the secondary wall, and the secondary wall has a multi-layer structure with alternating width. The content of lignin in the thin layer is higher than that in the thick layer, and the cell orientation in each layer is different (Liese, 1998; 1996; Alvin, 1988; Murphy, 1992; Murphy, 1997; Walter, 2001; Parameswaran, 1976). In the study of Abd (1990), the wall thickness of fiber has a positive correlation with the modulus of elasticity and a negative correlation with bending strength. The lumen diameter of fiber has a positive correlation with all mechanical properties except compressive strength. In this study, the phenotypic correlation (genetic correlation) between WT_FIBER and MOE was 0.44 (0.614) to show a significant positive correlation, which was consistent with the results of Abd. However, there was still a significant positive correlation between WT_FIBER and MOR with the phenotypic correlation (genetic correlation) of 0.423 (0.597), which was contrary to the results of ABD’s study. LD_FIBER has a significant positive correlation with A_DENSITY, MOR, and MOE, with the phenotypic correlation (genetic correlation) of 0.347 (0.724), 0.3 (0.559), and 0.474 (0.546), respectively. It indicated that the thickening of LD_FIBER can significantly enhance MOR and increase the air-dry density.
O_DENSITY and WT_PAREN were significantly positively correlated with the phenotypic correlation (genetic correlation) of 0.395 (0.651), and A_DENSITY and WT_PAREN were significantly positively correlated with 0.367 (0.654). That indicated that the thickening of the cell wall of parenchyma could significantly increase the density of bamboo. O_SHRINK and A_SHRINK was significantly positively correlated to LD_PAREN with the phenotypic correlation (genetic correlation) of 0.484 (0.901) and 0.417 (0.628), respectively, which showed that increasing the lumen diameter of parenchyma may increase the shrinking ratio of bamboo.

4. Discussion

The inheritance of traits is often controlled by multiple genes, and the interaction between genes makes the traits to be interrelated and interrelated [48]. Only by understanding the degree of correlation between traits can we balance the selection of traits in breeding improvement to improve the efficiency of bamboo improvement. As a basic genetic parameter, genetic correlation plays an important role in analyzing the correlation between important traits, estimating the progress of genetic correlation and evaluating clones, etc. [49]. At the same time, the mutual relationship among various traits affects the consequences of synchronous improvement among various traits.
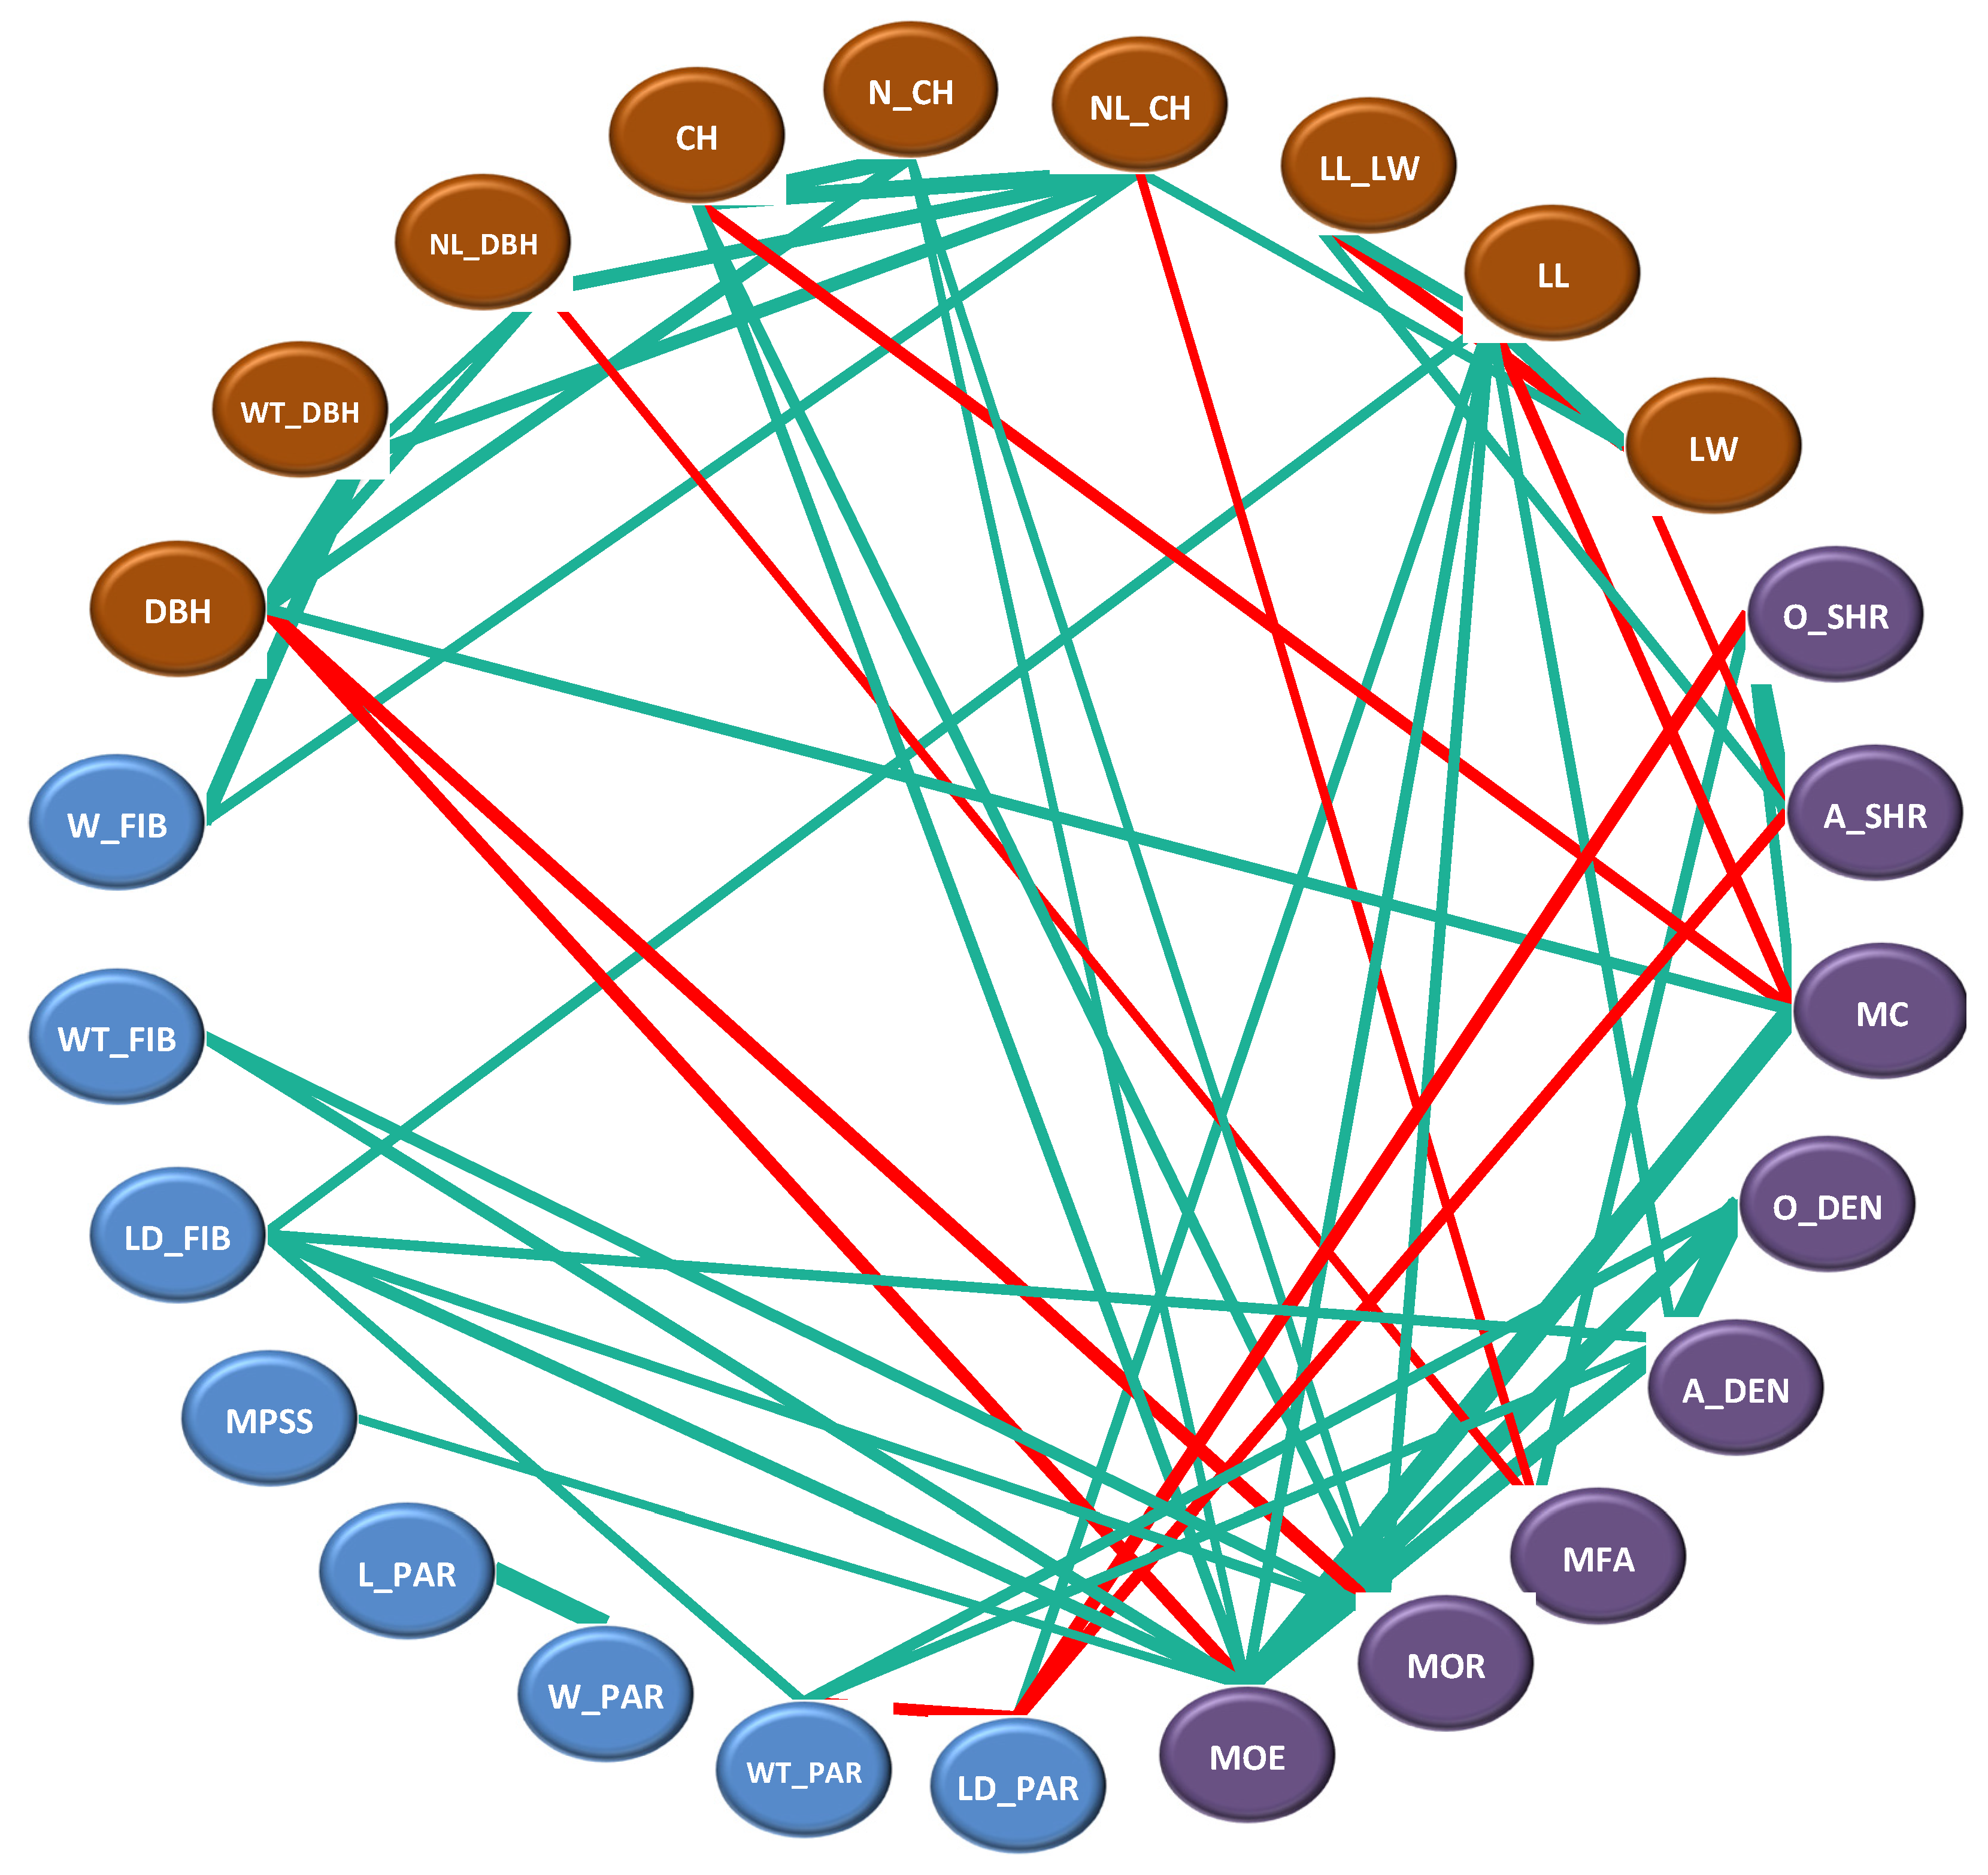
From the correlation analysis of phenotypic traits, the phenotypic correlation and genetic correlation of the three DBH traits (DBH, NL_DBH, and WT_DBH) were positively correlated with each other and reached a very significant level (Figure 6). It showed that the larger DBH is, the longer NL_DBH is, and the thicker WT_DBH is [50]. In the selection of bamboo material, the DBH and NL_DBH were used to predict the WT_DBH for rational classification and utilization of bamboo. Therefore, the DBH traits could be indirectly evaluated by NL_CH, during field investigation and sampling. Furthermore, there was a high significance and medium positive correlation between LW and NL_CH (Figure 6). It indicated that leaf width could further reflect the trait of NL_CH, and indirectly measure the three DBH traits.
From the correlation analysis of cell structure traits, it was interesting that there was no the same correlation between L_FIBER and W_FIBER of fiber cell with a phenotypic correlation of approximately 0 and a genetic correlation of 0.579, unlike the L_PAREN and W_PAREN with highly positive correlation [51]. It showed that although the length and width of fiber cells were controlled by the genetic mechanism and the genes of L_FIBER may change the expression of W_FIBER genes, but there was no obvious phenotypic correlation to be formed.
Relevant studies have shown that bamboo density is an important index to measure the properties of bamboo. In general, the higher the bamboo density is, the higher its mechanical properties will be [52], which is consistent with the results of this study that the density is highly positively correlated with MOE. The shrinking ratio of volume was closely related to the moisture content of Moso bamboo, and the change affected its MFA. The results showed that the shrinking ratio of volume was closely related to the moisture content of Moso bamboo and changed affected its MFA. The main reason for bamboo shrinkage is that the vessels in the vascular bundle lose the water and shrink [47,53], which also explains the close relationship between the shrinkage ratio and water content. The MFA of wood can directly affect the mechanical properties and dimensional stability of wood, which is positively correlated with wood density, longitudinal shrinkage ratio, and elastic modulus, and negatively correlated with the tensile strength, tear strength, and hardness of wood [54,55,56,57]. However, in the study of previous studies [58,59,60] and this study on bamboo, the MFA did not show an obvious change pattern similar to that of wood.
From the correlation analysis of 9 phenotypic traits and 11 cell structure properties, W_FIBER was highly positively correlated with WT_DBH and moderately positively correlated with NL_CH. In combination with the previous results about a moderate positive correlation between NL_CH and WT_DBH, W_FIBER, NL_CH, and WT_DBH may be controlled by linked genes or by the same pleiotropic genes. Therefore, WT_DBH and W_FIBER can be indirectly evaluated by NL_CH during field sampling. On the other hand, it can be seen that all of DBH, NL_DBH, CH, NL_CH, LW, and LL.LW has no significant and moderate or above correlation with any cell structure properties. This may be because the correlation coefficient is affected by the sample size. That is, the larger the sample size, the smaller the correlation coefficient required to achieve a significant correlation. In this study, the sample size was more than 200 plants, which might make the correlation coefficient slightly lower and make the correlation of some groups with a moderate correlation greater than 0.3. However, it is also based on the large sample size to reach the statistical significance, the reference of the results will be greatly improved, thus that the significantly related traits can be better screened out.
From the correlation analysis of 9 phenotypic traits and 8 material properties, MC, MOR and MOE are highly correlated with DBH, CH, and LL, respectively. In combination with the previous results about the significant negative correlation between MOR and MC or MOE and MC can we infer that MC may be positively correlated with DBH and negatively correlated with CH and LL? This conclusion was confirmed in Table 2, and the correlations were all at a significant level. That is, the phenotypic correlation (genetic correlation) between MC and DBH was 0.402 (0.787), that between MC and CH was −0.405 (−0.932), and that between MC and LL was −0.429 (−0.973), respectively. In addition, NL_CH was significantly positively correlated with MOR and MOE, and the phenotypic correlation (genetic correlation) was 0.313 (0.933) and 0.309 (0.945).
The tensile strength, modulus of elasticity, hardness, density, and dimensional stability of the fiber bundle generally increase with the increase of crystallinity [61]. In this study, the crystallinity was significantly positively correlated with MOE with the phenotypic correlation (genetic correlation) of 0.305 (0.992), which was consistent with previous studies. However, the density did not show a significant correlation with the crystallinity in this study.
Depending on the breeding goal, breeders tend to pay attention to the performance of a single character, and the evaluation and analysis of germplasm resources are one-sided. On the other hand, the determination and sampling of cell structure and material properties of bamboo can cause irreversible damage to the plant, and the measurement process is complex. If the relationship between those traits has been known, cell structure and material properties can be indirectly predicted and assessed using easily measurable phenotypic traits. This will greatly improve the utilization of bamboo and reduce the cost of bamboo material improvement.

Author Contributions

W.Z. and Z.J. conceived of the project and planed the analytical approach. W.Z., T.H. and Y.C. wrote the original paper. W.Z. and B.F. conducted the field survey and analyzed the data. W.Z., Y.M. and Y.D. visualized the tables and figures. M.X., K.F. and X.Z. contributed to data interpretation and edited the paper. All authors have read and agreed to the published version of the manuscript.

Funding

This research was supported by Young Elite Scientists Sponsorship Program by CAST (NO. 2018QNRC001), ICBR Fundamental Research Funds Grant (NO. 1632020028), and ICBR Fundamental Research Funds Grant (NO. 1632020001).

Data Availability Statement

Not applicable.

Acknowledgments

The study thanks to the pre-emptive support of the National Key Technology R&D Program of China during the 12th Five-year Plan Period (2015BAD04B03). The authors gratefully acknowledge the contributions of Xiaomei Jiang, who provided input on cell structures. Research conducted in Andrea Polle’s laboratory was supported by Georg-August University Göttingen and the Deutsche Forschungsgemeinschaft (DFG).

Conflicts of Interest

The authors declare no conflict of interest.

References

  1. Zheng, Y.X.; Guan, F.Y.; Fan, S.H.; Yan, X.R.; Huang, L.Y. Biomass Estimation, Nutrient Content, and Decomposition Rate of Shoot Sheath in Moso Bamboo Forest of Yixing Forest Farm, China. Forests 2021, 12, 1555. [Google Scholar] [CrossRef]
  2. Zhao, H.S.; Sun, S.; Ding, Y.L.; Wang, Y.; Yue, X.H.; Du, X.; Wei, Q.; Fan, G.Y.; Sun, H.Y.; Lou, Y.F.; et al. Analysis of 427 genomes reveals moso bamboo population structure and genetic basis of property traits. Nat. Commun. 2021, 12, 5466. [Google Scholar] [CrossRef]
  3. Vorontsova, M.S.; Clark, L.G.; Dransfield, J.; Govaerts, R.; Baker, W.J. World Checklist of Bamboos and Rattans; International Network of Bamboo and Rattan & the Board of Trustees of the Royal Botanic Gardens, Kew: Beijing, China; London, UK, 2016. [Google Scholar]
  4. Peng, Z.H.; Lu, Y.; Li, L.B.; Zhao, Q.; Feng, Q.; Gao, Z.M.; Lu, H.Y.; Hu, T.; Yao, N.; Liu, K.Y.; et al. The draft genome of the fast-growing non-timber forest species moso bamboo (Phyllostachys heterocycla). Nat. Genet. 2013, 45, 456–461. [Google Scholar] [CrossRef] [Green Version]
  5. Peng, Z.H.; Zhang, C.L.; Zhang, Y.; Hu, T.; Mu, S.H.; Li, X.P.; Gao, J. Transcriptome sequencing and analysis of the fast growing shoots of moso bamboo (Phyllostachys edulis). PLoS ONE 2013, 8, e78944. [Google Scholar] [CrossRef]
  6. Gu, H.J.; Zhang, C.C.; Chen, F.S.; Huang, J.H.; Wang, J.S.; Bruelheide, H.; Trogisch, S.; Fang, X.M.; Li, J.J.; Bu, W.S. The Bamboo Rhizome Evolution in China Is Driven by Geographical Isolation and Trait Differentiation. Forests 2021, 12, 1280. [Google Scholar] [CrossRef]
  7. Zhao, H.S.; Yang, L.; Peng, Z.H.; Sun, H.Y.; Yue, X.H.; Lou, Y.F.; Dong, L.L.; Wang, L.L.; Gao, Z.M. Developing genome-wide microsatellite markers of bamboo and their applications on molecular marker assisted taxonomy for accessions in the genus Phyllostachys. Sci. Rep. 2015, 5, 8018. [Google Scholar] [CrossRef] [PubMed]
  8. Schmidt, P.; Hartung, J.; Bennewitz, J.; Piepho, H.P. Heritability in Plant Breeding on a Genotype-Difference Basis. Genetics 2019, 212, 991–1008. [Google Scholar] [CrossRef]
  9. Dong, N.; Tang, M.M.; Zhang, W.P.; Bao, X.G.; Wang, Y.; Christie, P.; Li, L. Temporal Differentiation of Crop Growth as One of the Drivers of Intercropping Yield Advantage. Sci. Rep. 2018, 8, 3110. [Google Scholar] [CrossRef] [Green Version]
  10. Zheng, Y.; Guan, F.; Fan, S.; Zhou, Y.; Jing, X. Functional Trait Responses to Strip Clearcutting in a Moso Bamboo Forest. Forests 2021, 12, 793. [Google Scholar] [CrossRef]
  11. Low, M.I.; Che, Z.Y.; Latella, B.A. Mapping the structure, composition and mechanical properties of bamboo. J. Mater. Res. 2006, 21, 1969–1976. [Google Scholar] [CrossRef]
  12. Akinlabi, E.T.; Anane-Fenin, K.; Akwada, D.R. Properties of Bamboo; Springer: Cham, Switzerland, 2017. [Google Scholar]
  13. Inoue, A.; Tochihara, S.; Sato, M.; Shima, H. Universal node distribution in three bamboo species (Phyllostachys spp.). Trees 2017, 31, 1271–1278. [Google Scholar] [CrossRef]
  14. Ming, C.Y.T.; Jye, W.K.; Ahmad, H.A.I. Mechanical properties of bamboo and bamboo composites: A Review. J. Adv. Res. Mater. Sci. 2017, 35, 7–26. [Google Scholar]
  15. Mannan, S.; Knox, J.P.; Basu, S. Correlations between axial stiffness and microstructure of a species of bamboo. R. Soc. Open Sci. 2017, 4, 160412. [Google Scholar] [CrossRef] [PubMed] [Green Version]
  16. Wahab, R.; Mustafa, M.T.; Amini, M.H.M.; Rasat, M.S.M. Anatomy and strength properties between tropical bamboo Gigantochloa levis and G. scortechinii. In Proceedings of the 2nd International Conference on Kenaf and Allied Fibres, Selangor, Malaysia, 3–5 December 2013. [Google Scholar]
  17. Petroudy, S.R.D. Physical and Mechanical Properties of Natural Fibers; Elsevier: Tehran, Iran, 2016. [Google Scholar]
  18. Grosser, D.; Liese, W. On the Anatomy of Asian Bamboos, with Special Refererce to Their Vascular Bundles. Wood Sci. Technol. 1971, 5, 290–312. [Google Scholar] [CrossRef]
  19. Ray, A.K.; Momdal, S.; Das, S.K. Bamboo-a Functionally Graded Composite-Correlation between Microstructure and Mechanical Strength. J. Mater. Sci. 2005, 40, 5249–5253. [Google Scholar] [CrossRef]
  20. Liu, G.L.; Shi, P.J.; Cu, Q.; Dong, X.B.; Wang, F.S.; Wang, G.G.; Hui, C. Does the Size-Density Relationship Developed for Bamboo Species Conform to the Self-Thinning Rule? For. Ecol. Manag. 2016, 361, 339–345. [Google Scholar] [CrossRef]
  21. Amom, T.; Tikendra, L.; Rahaman, H.; Potshangbam, A.; Nongdam, P. Evaluation of genetic relationship between 15 bamboo species of North-East India based on ISSR marker analysis. Mol. Biol. Res. Commun. 2018, 7, 7–15. [Google Scholar]
  22. Mohmod, A.L. Effects of age and height of three bamboo species on their machining properties. J. Trop. For. Sci. 1992, 5, 528–535. [Google Scholar]
  23. Kelemwork, S. Effects of some anatomical characteristics of Ethiopian lowland bamboo (Oxytenanthera abyssinica) on physical and mechanical properties. J. Bamboo Ratt. 2009, 8, 161–174. [Google Scholar]
  24. Parameswaran, N.; Liese, W. On the fine structure of bamboo fibres. Wood Sci. Technol. 1976, 10, 231–246. [Google Scholar]
  25. Penellum, M.; Sharma, B.; Shah, D.U.; Foster, R.M.; Ramage, M.H. Relationship of structure and stiffness in laminated bamboo composites. Constr. Build. Mater. 2018, 165, 241–246. [Google Scholar] [CrossRef]
  26. Mohmod, A.L.; Mustafa, M.T. Variation in anatomical properties of three Malaysian bamboos from natural stands. J. Trop. For. Sci. 1992, 5, 90–96. [Google Scholar]
  27. Omobowale, M.O.; Gedengbe, O.K. Trends in fiber characteristics of Nigerian grown bamboo and its effect on its impact and tensile strengths. J. Am. Bamboo Soc. 2008, 21, 9–13. [Google Scholar]
  28. Latif, A.M.; Liese, W.; Kumar, A.; Rao, I.V.R.; Sastry, C. Moisture Content of Two Malaysian Bamboos in Relation to Age, Culm Height, Site and Harvesting Month. In Bamboo for Sustainable Development; Kumar, A., Ramanuja Rao, I.V., Sastry, C., Eds.; Brill Publishers: Leiden, The Netherlands, 2002; Available online: https://brill.com/view/book/9789004473911/B9789004473911_s024.xml (accessed on 25 November 2021).
  29. Wangaard, F.F.; Woodson, G.E. Fiber length strength interrelationship for slash pine and its effect on pulp-sheet properties. Wood Sci. 1973, 5, 235–240. [Google Scholar]
  30. Sadiku, N.A.; Oluyege, A.O.; Ajayi, B. Fibre dimension and chemical characterisation of naturally grown Bambusa vulgaris for pulp and paper production. J. Bamboo Ratt. 2016, 15, 33–43. [Google Scholar]
  31. Li, X.; Mao, F.; Du, H.; Zhou, G.; Xing, L.; Liu, T.; Han, N.; Liu, Y.; Zhu, D.; Zheng, J.; et al. Spatiotemporal evolution and impacts of climate change on bamboo distribution in China. J. Environ. Manag. 2019, 248, 109265. [Google Scholar] [CrossRef]
  32. Razak, W.; Janshah, M.; Hashim, W.S.; Shirley, B. Morphological and anatomical characteristics of managed natural bamboo stands—Gigantochloa scortechinii. J. Bamboo Ratt. 2007, 6, 115–121. [Google Scholar]
  33. Wahab, R.; Mohamed, A.; Mustafa, M.T.; Hassan, A. Physical Characteristics and Anatomical Properties of Cultivated Bamboo (Bambusa vulgaris Schrad.) Culms. J. Biol. Sci. 2009, 9, 753–759. [Google Scholar] [CrossRef]
  34. Tamizi, M.; Mu, S.; Wahab, R.; Sudin, M.; Khalid, I. Anatomical and microstructures features of tropical bamboo Gigantochloa brang, G. levis, G. scotechinii and G. wrayi. Int. J. For. Soil Eros. 2011, 1, 25–35. [Google Scholar]
  35. He, L.; Zhou, G.Y.; Zhang, H.Y. Research and utilization status of natural bamboo fiber. Adv. Mater. Res. 2011, 159, 236–241. [Google Scholar]
  36. Fei, B.; Gao, Z.; Jin, W.; Liu, Z. Biological, Anatomical, and Chemical Characteristics of Bamboo. In Secondary Xylem Biology; Academic Press: New York, NY, USA, 2016; pp. 283–306. [Google Scholar]
  37. Kamruzzaman, M.; Saha, S.K.; Bose, A.K.; Islam, M.N. Effects of age and height on physical and mechanical properties of bamboo. J. Trop. For. Sci. 2008, 20, 211–217. [Google Scholar]
  38. Cave, I.D. Theory of X-ray measurement of microfibril angle in wood. Wood Sci. Technol. 1997, 31, 225–234. [Google Scholar] [CrossRef]
  39. Tran, V.H. Growth and Quality of Indigenous Bamboo Species in the Mountainous Regions of Northern Vietnam. Ph.D. Thesis, Georg-August-Universität Göttingen, Göttingen, Germany, 2010. [Google Scholar]
  40. Zhang, Y.M.; Yu, Y.L.; Yu, W.J. Effect of thermal treatment on the physical and mechanical properties of Phyllostachys pubescen bamboo. Eur. J. Wood Wood Prod. 2013, 71, 61–67. [Google Scholar] [CrossRef]
  41. Lin, Z.Y.; Yang, H.X.; Ivković, M.; Gapare, W.J.; Matheson, C.A.; Wu, H.X. Effect of genotype by spacing interaction on radiata pine genetic parameters for height and diameter growth. For. Ecol. Manag. 2013, 304, 204–211. [Google Scholar] [CrossRef]
  42. Gilmour, A.; Cullis, B.; Welham, S.; Gogel, B.; Thompson, R. An efficient computing strategy for prediction in mixed linear models. Adv. Mater. Res. 2004, 44, 571–586. [Google Scholar] [CrossRef] [Green Version]
  43. Zhang, W.B.; Fei, B.H.; Tian, G.L.; Yue, X.H.; Jiang, Z.H. Comparative Study on Growth and Phenotypic Traits of Phyllostachys edulis in Different Areas. J. Northeast For. Univ. 2019, 47, 1–5. [Google Scholar]
  44. Zhang, W.B.; Fei, B.H.; Hu, T.; Ma, Y.J.; Chang, Y.T.; Xia, M.S.; Fan, K.K.; Jiang, Z.H. Comparative Study on Cell Structure Traits of Moso Bamboo (Phyllostachys edulis) in Different Areas. J. Mater. Sci. Eng. 2020, 38, 431–438. [Google Scholar]
  45. Zhang, W.B.; Fei, B.H.; Tian, G.L.; Hu, T.; Yue, X.H.; Chang, Y.T.; Jiang, Z.H. Comparative study on physical mechanic properties of Phyllostachys edulis in different latitudes. J. Beijing For. Univ. 2019, 41, 136–145. [Google Scholar]
  46. Lakkad, S.C.; Patel, J.M. Mechanical properties of bamboo, a natural composite. Fibre Sci. Technol. 1981, 14, 319–322. [Google Scholar] [CrossRef]
  47. Chen, Q.; Fang, C.H.; Wang, G.; Ma, X.X.; Fei, B.H. Hygroscopic swelling of moso bamboo cells. Cellulose 2020, 27, 611–620. [Google Scholar] [CrossRef]
  48. Ribaut, J.M.; Fracheboud, Y.; Monneveux, P.; Banziger, M.; Vargas, M.; Jiang, C.J. Quantitative trait loci for yield and correlated traits under high and low soil nitrogen conditions in tropical maize. Mol. Breed. 2007, 20, 15–29. [Google Scholar] [CrossRef]
  49. Krueger, R.F.; South, S.; Johnson, W.; Iacono, W. The Heritability of Personality Is Not Always 50%: Gene-Environment Interactions and Correlations Between Personality and Parenting. J. Personal. 2008, 76, 1485–1521. [Google Scholar] [CrossRef] [Green Version]
  50. Yang, B.G.; Shen, Z.; Li, Z.Y.; Li, Y.L.; Shen, X.G.; Chen, Y.J. A Study on the Stalk Factor and Fiber Traits and Their Correlation of Phyllostachys edulis ‘Pachyloen’. Acta Agric. Univ. Jiangxiensis 2021, 42, 101–109. [Google Scholar]
  51. Xie, J.L.; Qi, J.Q.; Hu, T.X.; Xiao, H.; Chen, Y.Z.; Hoop, C.F.D.; Huang, X.Y. Anatomical characteristics and physical–mechanical properties of Neosinocalamus affinis from Southwest China. Eur. J. Wood Wood Prod. 2017, 75, 659–662. [Google Scholar] [CrossRef]
  52. Rousset, P.; Aguiar, C.; Labbe, N.; Commandre, J.M. Enhancing the combustible properties of bamboo by torrefaction. Bioresour. Technol. 2011, 102, 8225–8231. [Google Scholar] [CrossRef]
  53. Yuan, J.; Fang, C.H.; Chen, Q.; Fei, B.H. Observing bamboo dimensional change caused by humidity. Constr. Build. Mater. 2021, 309, 124988. [Google Scholar] [CrossRef]
  54. Armstrong, J.P.; Kyanka, G.H.; Thorpe, J.L. S2 fibril angle elastic modulus relationship of TMP Scotch pine fibers. Woodence 1977, 10, 72–80. [Google Scholar]
  55. Cave, I.D.; Walker, J. Stiffness of wood in fast-grown plantation softwoods: The influence of microfibril angle. For. Prod. J. 1994, 44, 43–48. [Google Scholar]
  56. Shupe, T.F.; Choong, E.T.; Stokke, D.; Gibson, M.D. Variation in cell dimensions and fibril angle for two fertilized even-aged loblolly pine plantations. Wood Fiberence 1996, 28, 268–275. [Google Scholar]
  57. Elspeth, M.; Jason, H. A review of the effects of silviculture on timber quality of Sitka spruce. Forestry 2002, 75, 107–138. [Google Scholar]
  58. Yu, Y.; Wang, H.K.; Lu, F.; Tian, G.L.; Lin, J.G. Bamboo fibers for composite applications: A mechanical and morphological investigation. J. Mater. Sci. 2014, 49, 2559–2566. [Google Scholar] [CrossRef]
  59. Huang, Y.H.; Fei, B.H. Comparison of the mechanical characteristics of fibers and cell walls from moso bamboo and wood. BioResours 2017, 12, 8230–8239. [Google Scholar] [CrossRef]
  60. Okahisa, Y.; Kojiro, K.; Kiryu, T.; Oki, T.; Furuta, Y.; Hongo, C. Nanostructural changes in bamboo cell walls with aging and their possible effects on mechanical properties. J. Mater. Sci. 2018, 53, 3972–3980. [Google Scholar] [CrossRef]
  61. Petroudy, S.R.D. 3-Physical and mechanical properties of natural fibers. In Advanced High Strength Natural Fibre Composites in Construction; Woodhead Publishing: Mazandaran, Iran, 2017. [Google Scholar]
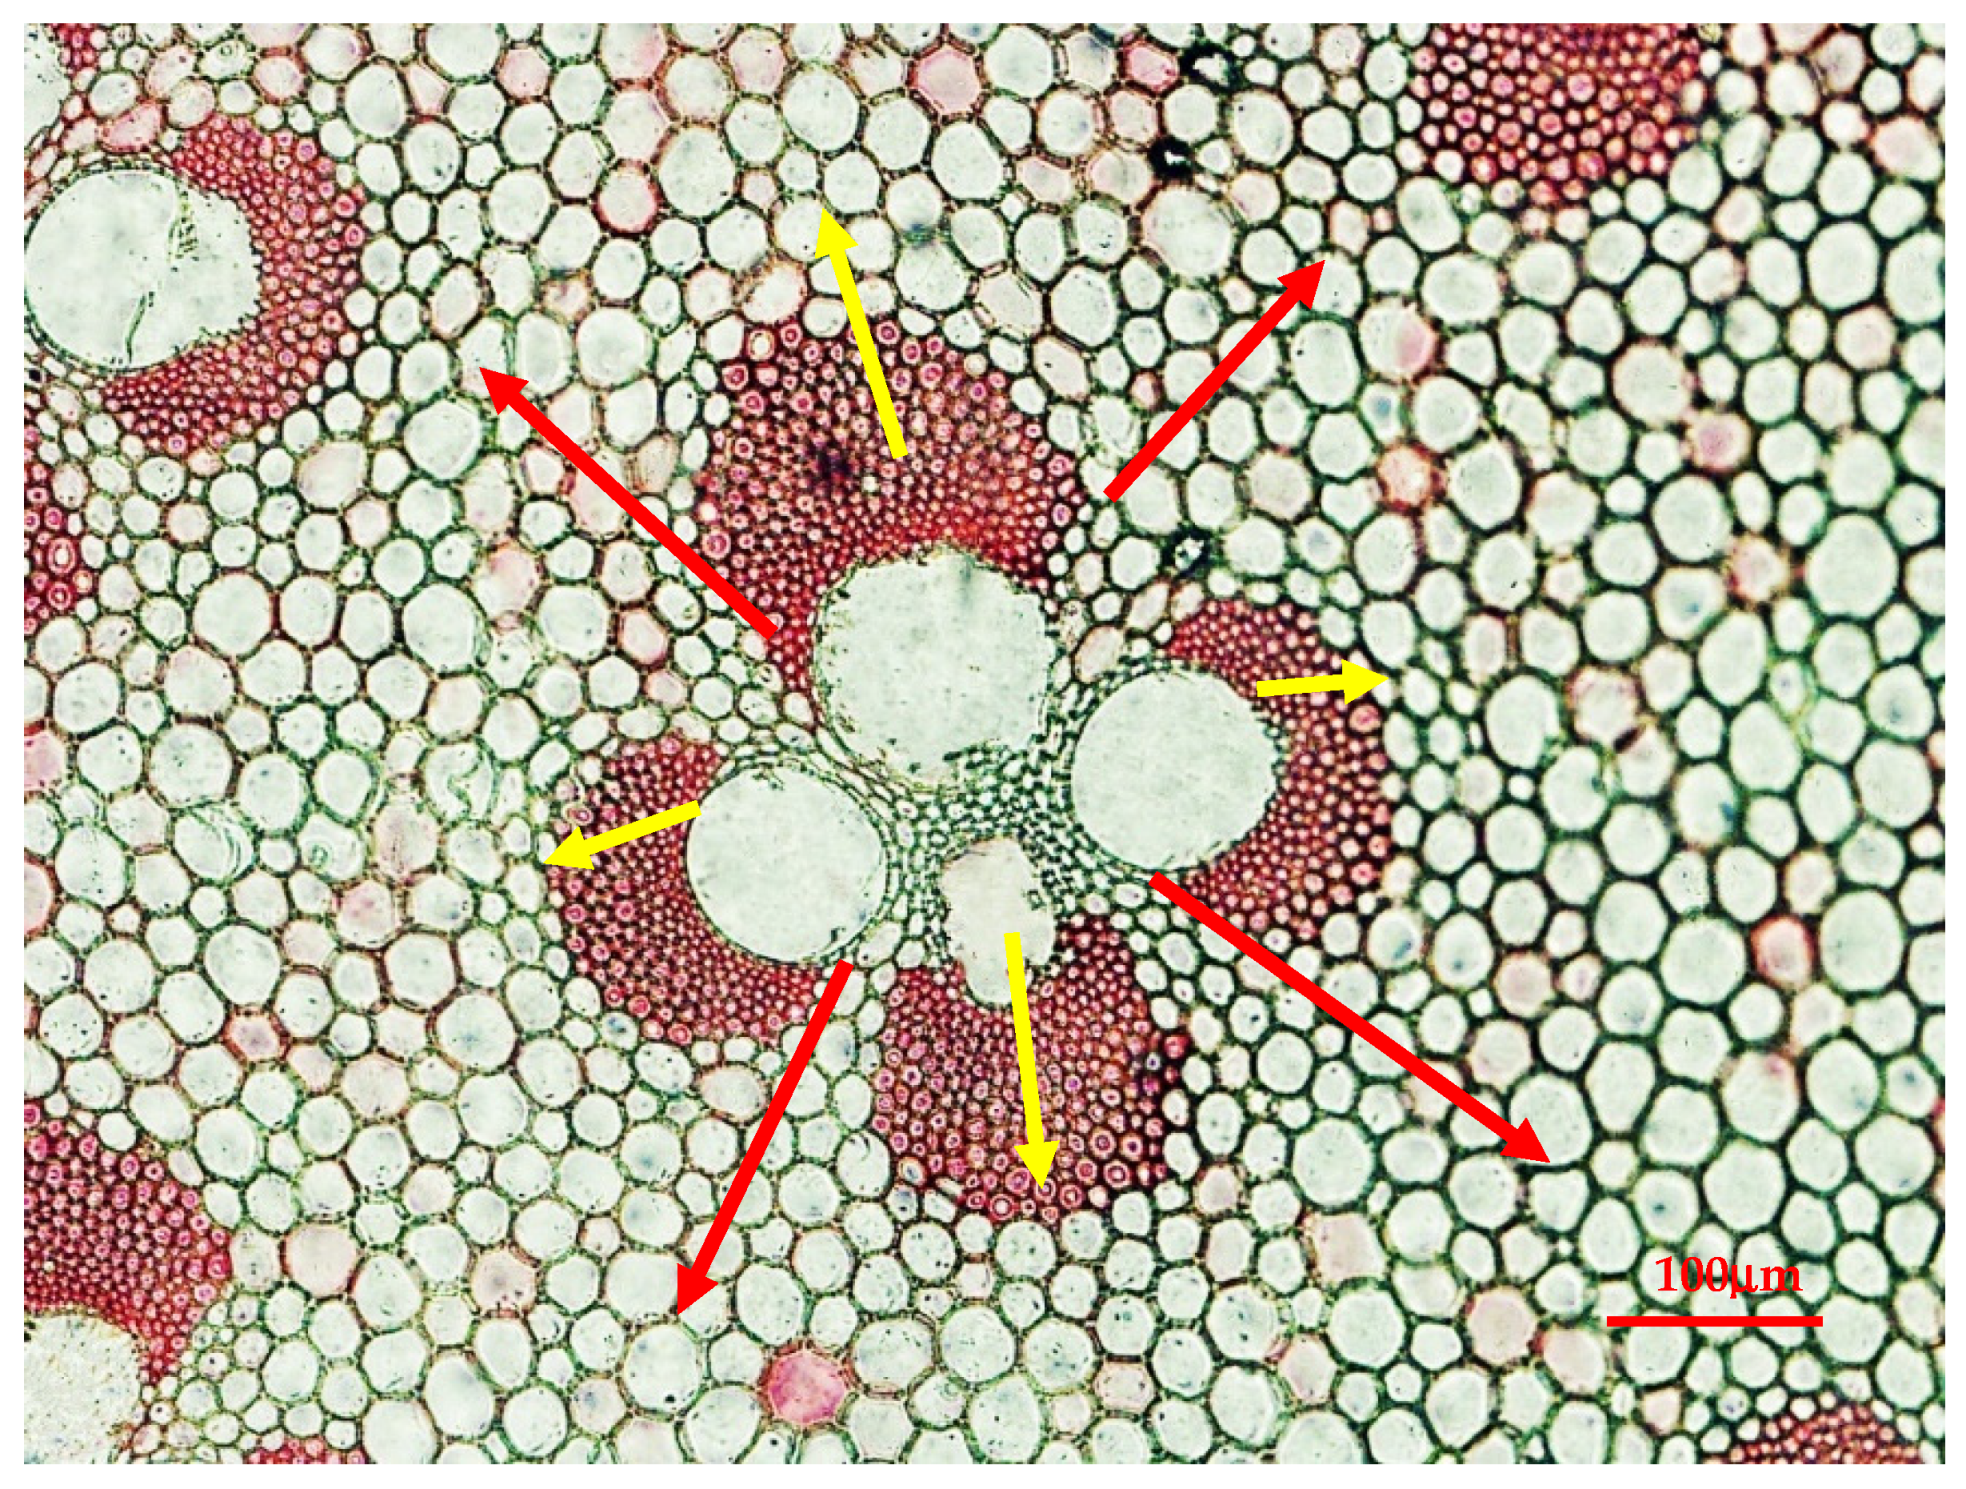
Figure 1. Schematic diagram of measure method about the wall thickness and lumen diameter of fiber cell and parenchyma. In the figure of the permanent section, a vascular bundle in BT was selected. According to the direction of the yellow arrow, the fiber cell was selected in turn to obtain the double-wall thickness and lumen diameter, and according to the direction of the red arrow, the parenchyma was also selected.
Forests 13 00107 g001
Figure 2. Bimodal diagram of microfibril angle determined.
Forests 13 00107 g002
Figure 3. Correlation analysis of 9 phenotypic traits in Moso bamboo (Phyllostachys edulis). Notes: DBH: diameter at breast height, NL_DBH: node length at DBH, WT_DBH: wall thickness at DBH, CH: clear height, NL_CH: average of nodes length under the branch, N_CH: nodes under the branch, LL: leaf length, LW: leaf width, LL.LW: leaf length/leaf width. The one above the diagonal line is the pie chart of the phenotypic correlation coefficient, the one below the diagonal line is the phenotypic correlation coefficient (up) and genetic correlation coefficient (down). *** stands for 0.1% level prominent, ** stands for 1% level prominent, * stands for 5% level prominent.
Forests 13 00107 g003
Figure 4. Correlation analysis of 11 cell structure properties in Moso bamboo (Phyllostachys edulis). Notes: FRE_VB: vascular bundle frequency, RL.TL_VB: radial/tangential ratio of vascular bundle, L_FIBER: fiber length, W_FIBER: fiber width, WT_FIBER: fiber cell wall thickness, LD_FIBER: fiber lumen diameter, MPSS: crystallinity, L_PAREN: parenchyma length, W_PAREN: parenchyma width, WT_PAREN: parenchyma cell wall thickness, LD_PAREN: parenchyma lumen diameter. The one above the diagonal line is the pie chart of the phenotypic correlation coefficient, the one below the diagonal line is the phenotypic correlation coefficient (up) and genetic correlation coefficient (down). *** stands for 0.1% level prominent, ** stands for 1% level prominent, * stands for 5% level prominent.
Forests 13 00107 g004
Figure 5. Correlation analysis of 8 material properties in Moso bamboo (Phyllostachys edulis). Notes: O_SHRINK: oven-dried volume shrinking ratio, A_SHRINK: air-dried volume shrinking ratio, MC: moisture content, O_DENSITY: oven-dried density, A_DENSITY: air-dried density, MFA: microfibril angle, MOR: bending strength, MOE: modulus of elasticity. The one above the diagonal line is the pie chart of the phenotypic correlation coefficient, the one below the diagonal line is the phenotypic correlation coefficient (up) and genetic correlation coefficient (down). *** stands for 0.1% level prominent, ** stands for 1% level prominent, * stands for 5% level prominent.
Forests 13 00107 g005
Figure 6. Summary of correlation analysis about 28 traits in Moso bamboo (Phyllostachys edulis). Notes: Brown: phenotypic traits, blue: cell structure traits, purple: physical mechanic properties. DBH: diameter at breast height, NL_DBH: node length at DBH, WT_DBH: wall thickness at DBH, CH: clear height, NL_CH: average of nodes length under the branch, N_CH: nodes under the branch, LL: leaf length, LW: leaf width, LL.LW: leaf length/leaf width. FRE_VB: vascular bundle frequency, RL.TL_VB: radial/tangential ratio of vascular bundle, L_FIBER: fiber length, W_FIBER: fiber width, WT_FIBER: fiber cell wall thickness, LD_FIBER: fiber lumen diameter, MPSS: crystallinity, L_PAREN: parenchyma length, W_PAREN: parenchyma width, WT_PAREN: parenchyma cell wall thickness, LD_PAREN: parenchyma lumen diameter. O_SHRINK: oven-dried volume shrinking ratio, A_SHRINK: air-dried volume shrinking ratio, MC: moisture content, O_DENSITY: oven-dried density, A_DENSITY: air-dried density, MFA: microfibril Angle, MOR: bending strength, MOE: modulus of elasticity.
Forests 13 00107 g006
Table 1. Geographical longitude, latitude, and altitude of Moso bamboo (Phyllostachys edulis) in 3 areas.
AreaLongitudeLatitudeAltitude/mCollected TimeSimple NO.
Huoshan, Anhui Province116°21′32″ E31°18′38.5″ N33515–17 October 201670
Guanyang, Guangxi Province110°49′13.4″ E25°12′24.8″ N5195–7 November 201669
Anji, Zhejiang Province119°36′37.6″ E30°33′3.6″ N13527–29 October 201670
Table 2. Correlation analysis between phenotypic traits and cell structure properties in Moso bamboo (Phyllostachys edulis).
TraitDBHNL_DBHWT_DBHCHNL_CHN_CHLLLWLL.LW
Phenotypic
Correlation
Coefficient
FRE_VB−0.269 **−0.06−0.287 ***−0.053−0.1610.007−0.008−0.035−0.004
RL.TL_VB0.088−0.0690.2190.0990.1030.1230.1130.0960.017
L_FIBER−0.188−0.022−0.330.259 *0.0470.2220.2040.0090.157
W_FIBER0.2660.281 *0.592 **0.2150.377 **0.1290.0530.229−0.215
WT_FIBER−0.155−0.038−0.1140.107−0.050.034 *0.214−0.0070.188
LD_FIBER−0.311−0.024−0.1440.3050.0280.2740.361 **0.1720.17
MPSS−0.1550.0450.0070.199 *0.040.162 *0.1460.1080.048
L_PAREN0.0560.0740.2960.2440.150.2690.0440.138−0.091
W_PAREN0.0740.0750.2850.1930.1790.1730.0220.05−0.072
WT_PAREN0.026−0.0250.1830.2310.071 *0.2720.0010.082−0.052
LD_PAREN−0.0450.119−0.1290.0960.208−0.0340.361 **0.2050.14
Genetic
Correlation
Coefficient
FRE_VB−0.615 *−0.413−0.697 *0.3−0.1760.2970.090.33−0.242
RL.TL_VB0.1030.1730.669 *0.574 *0.2220.646 *0.1630.179−0.013
L_FIBER−0.992 ***−0.645 *−0.84 ***0.53 *−0.3980.4680.569 *0.1220.469
W_FIBER0.537 *0.833 ***0.953 ***0.4060.854 ***0.4040.150.764 ***−0.457
WT_FIBER−0.446−0.387−0.2050.393−0.2180.3780.268−0.0660.254
LD_FIBER−0.577 *−0.145−0.2070.694 **0.0610.687 **0.567 *0.4270.279
MPSS−0.699 **−0.288−0.0520.985 ***0.040.996 ***0.746 **0.3890.41
L_PAREN−0.0030.2290.622 *0.755 ***0.3890.85 ***0.2620.547 *−0.212
W_PAREN0.1220.5070.704 **0.694 **0.641 *0.658 *0.4030.708 **−0.202
WT_PAREN−0.059−0.1830.280.364−0.1290.593 *−0.0720.007−0.054
LD_PAREN−0.240.378−0.2110.2160.455−0.1180.687 **0.470.338
Notes: DBH: diameter at breast height, NL_DBH: node length at DBH, WT_DBH: wall thickness at DBH, CH: clear height, NL_CH: average of nodes length under the branch, N_CH: nodes under the branch, LL: leaf length, LW: leaf width, LL.LW: leaf length/leaf width. FRE_VB: vascular bundle frequency, RL.TL_VB: radial/tangential ratio of vascular bundle, L_FIBER: fiber length, W_FIBER: fiber width, WT_FIBER: fiber cell wall thickness, LD_FIBER: fiber lumen diameter, MPSS: crystallinity, L_PAREN: parenchyma length, W_PAREN: parenchyma width, WT_PAREN: parenchyma cell wall thickness, LD_PAREN: parenchyma lumen diameter. *** stands for 0.1% level prominent, ** stands for 1% level prominent, * stands for 5% level prominent.
Table 3. Correlation analysis between phenotypic traits and material properties in Moso bamboo (Phyllostachys edulis).
TraitDBHNL_DBHWT_DBHCHNL_CHN_CHLLLWLL.LW
Phenotypic
Correlation
Coefficient
O_SHRINK−0.198 *−0.218−0.211 *−0.104−0.3030.014−0.122 **−0.1750.029
A_SHRINK−0.208−0.21−0.215−0.046−0.30.079−0.021−0.323 *0.371 ***
MC0.402 *0.0560.207−0.405 *−0.033−0.311−0.429 ***−0.104−0.342
O_DENSITY−0.26−0.0440.0110.3020.0610.249 ***0.289 **0.267 **−0.013
A_DENSITY−0.151−0.0140.0790.22 **0.105−0.0810.334 **0.267 **0.05
MFA−0.262−0.324 **−0.380.076−0.316 *0.246−0.163−0.1550.004
MOR−0.484 **−0.131−0.290.379 *−0.0660.313 ***0.392 *0.1660.201
MOE−0.466 **−0.076−0.2640.405 *−0.0270.309 ***0.414 *0.1710.214
Genetic
Correlation
Coefficient
O_SHRINK−0.198−0.849 ***−0.267−0.152−0.84 ***0.174−0.585 *−0.703 **−0.049
A_SHRINK−0.316−0.737 **−0.2680.007−0.728 **0.183−0.097−0.714 **0.515 *
MC0.787 ***0.1710.261−0.932 ***−0.122−0.782 ***−0.973 ***−0.456−0.652 **
O_DENSITY−0.554 *−0.3050.0240.889 ***−0.0460.994 ***0.3630.3890.027
A_DENSITY−0.59 *−0.1850.1050.991 ***0.0880.9840.65 *0.440.311
MFA−0.655 **−0.963 ***−0.588 *0.194−0.831 ***0.443−0.213−0.4460.103
MOR−0.879 ***−0.551 *−0.3720.892 ***−0.2360.933 ***0.609 *0.2340.405
MOE−0.857 ***−0.503−0.3290.913 ***−0.1830.945 ***0.633 *0.2790.392
Notes: DBH: diameter at breast height, NL_DBH: node length at DBH, WT_DBH: wall thickness at DBH, CH: clear height, NL_CH: average of nodes length under the branch, N_CH: nodes under branch, LL: leaf length, LW: leaf width, LL.LW: leaf length/leaf width. O_SHRINK: oven-dried volume shrinking ratio, A_SHRINK: air-dried volume shrinking ratio, MC: moisture content, O_DENSITY: oven-dried density, A_DENSITY: air-dried density, MFA: microfibril Angle, MOR: bending strength, MOE: modulus of Elasticity. *** stands for 0.1% level prominent, ** stands for 1% level prominent, * stands for 5% level prominent.
Table 4. Correlation analysis between cell structure and material properties in Moso bamboo (Phyllostachys edulis).
TraitO_SHRINKA_SHRINKMCO_DENSITYA_DENSITYMFAMORMOE
Phenotypic
Correlation
Coefficient
FRE_VB0.0990.05 *−0.0080.085−0.0210.0780.1680.154
RL.TL_VB0.0430.023−0.0270.1530.1630.0770.1110.109
L_FIBER−0.0350.009−0.0350.1480.1570.1370.3270.035
W_FIBER−0.159−0.157−0.0020.2040.173−0.1480.0140.029
WT_FIBER0.043−0.099−0.1790.284 ***0.213 *0.0920.423 *0.44 *
LD_FIBER−0.0340.135−0.4820.410.347 *0.1130.36 *0.474 **
MPSS−0.022−0.104−0.2010.2440.1970.0710.286 *0.305 *
L_PAREN0.001−0.041−0.1710.2930.1790.0230.2610.281
W_PAREN−0.151−0.123−0.1380.1610.136−0.1280.1610.197
WT_PAREN0.2320.32−0.0480.395 *0.367 ***0.180.2090.199
LD_PAREN−0.484 *−0.417 *−0.328−0.156−0.065−0.3070.0240.05
Genetic
Correlation
Coefficient
FRE_VB0.012−0.501−0.3340.3970.090.626 *0.619 *0.603 *
RL.TL_VB0.20.114−0.1950.571 *0.669 *0.0120.3840.423
L_FIBER−0.024−0.052−0.9050.660.6590.551 *0.812 ***0.946
W_FIBER−0.318−0.298−0.060.3450.449−0.487−0.05−0.004
WT_FIBER0.108−0.176−0.3250.310.2660.3580.597 *0.614 *
LD_FIBER−0.0450.272−0.706 **0.631 *0.724 **0.2310.559 *0.546 *
MPSS0.011−0.001−0.859 ***0.862 ***0.966 ***0.3620.982 ***0.992 ***
L_PAREN0.127−0.015−0.3330.814 ***0.86 ***0.1360.52 *0.552 *
W_PAREN−0.242−0.378−0.3490.562 *0.652 *−0.1750.4030.455
WT_PAREN0.564 *0.673 **−0.1010.651 **0.654 *0.3850.2540.238
LD_PAREN−0.901 ***−0.628 *−0.51 *−0.295−0.116−0.552 *0.0760.103
Notes: FRE_VB: vascular bundle frequency, RL.TL_VB: radial/tangential ratio of vascular bundle, L_FIBER: fiber length, W_FIBER: fiber width, WT_FIBER: fiber cell wall thickness, LD_FIBER: fiber lumen diameter, MPSS: crystallinity, L_PAREN: parenchyma length, W_PAREN: parenchyma width, WT_PAREN: parenchyma cell wall thickness, LD_PAREN: parenchyma lumen diameter. O_SHRINK: oven-dried volume shrinking ratio, A_SHRINK: air-dried volume shrinking ratio, MC: moisture content, O_DENSITY: oven-dried density, A_DENSITY: air-dried density, MFA: microfibril Angle, MOR: bending strength, MOE: modulus of Elasticity. *** stands for 0.1% level prominent, ** stands for 1% level prominent, * stands for 5% level prominent.
Publisher’s Note: MDPI stays neutral with regard to jurisdictional claims in published maps and institutional affiliations.