Article

Environmental Heterogeneity Affecting Community Assembly Patterns and Phylogenetic Diversity of Three Forest Communities at Mt. Huangshan, China

1
Co-Innovation Center for Sustainable Forestry in Southern China, Key Laboratory of State Forestry and Grassland Administration on Subtropical Forest Biodiversity Conservation, College of Biology and the Environment, Nanjing Forestry University, Nanjing 210037, China
2
Research Center for Nature Conservation and Biodiversity, State Environmental Protection Scientific Observation and Research Station for Ecology and Environment of Wuyi Mountains, State Environmental Protection Key Laboratory on Biosafety, Nanjing Institute of Environmental Sciences, Ministry of Ecology and Environment, Nanjing 210037, China
*
Author to whom correspondence should be addressed.
Forests 2022, 13(1), 133; https://doi.org/10.3390/f13010133
Submission received: 18 November 2021 / Revised: 6 January 2022 / Accepted: 11 January 2022 / Published: 17 January 2022

Abstract

:
Studying community assembly has always been a central issue in ecological research and is necessary for understanding mechanisms of species coexistence and biodiversity. Environmental heterogeneity is a driver of biodiversity, but much remains to be learned about how evolutionary processes are affected by environmental factors. We aimed to clarify the evolutionary processes in different vegetation communities in the Huangshan Scenic Area, Anhui Province, China. We constructed a phylogenetic tree of these communities based on a constraint tree and three DNA barcode regions. Community I was characterized by a weakly overdispersed phylogenetic structure for all three plant groups. The structure of Community II showed clustered for total plants and shrubs, overdispersed for trees. However, the phylogenetic structure was clustered for total plants, overdispersed for trees and shrubs in Community III. The main drivers of these patterns were spatial and climatic factors. Phylogenetic α-diversity had a significant positive relationship with species richness. The values of phylogenetic β-diversity reached their maximum at intermediate elevations among three vegetation communities for total plants. The main factors that affected diversity patterns were spatial variables, not climatic factors, indicating that environmental heterogeneity determined the mechanisms of biodiversity and species coexistence in the community. Our results showed that deterministic processes may control community assembly in three different vegetation regions.

1. Introduction

Mechanisms of species coexistence and biodiversity maintenance have been core topics in community ecology research for several decades. Some researchers believe that species are evolutionarily independent and ecologically equivalent; however, evolutionary history is often ignored [1,2]. Recently, with advances in genetic information and computing, evolutionary history is being combined with phylogenetics to better understand the community assembly rules that underlie elevation-driven patterns [3]. Phylogeny based on community ecology helps us to understand the mechanism of community assembly. The phylogenetic structure of ecological communities can reveal the relative importance of different ecological processes. Niche theory and neutral theory are two scientific models for investigating species coexistence from different perspectives. The niche theory based on the deterministic process emphasizes the important roles of niche differentiation and environmental filtering in structuring community species assemblages [4]. If niche differentiation is conserved, then environmental filters (such as stressful habitats and climatic factors) should lead to phylogenetic clustering of plants with similar ecological traits [5]. If competitive exclusion arises from competition among species, then the phylogenetic assembly of a community will be overdivergent [6]. In contrast to niche theory, Hubbell’s neutral theory is based on a stochastic process; it holds that equal niches exist among different species, and the number of coexisting species is constrained by random processes and spatial distance [7,8]. Researchers have found that evergreen broad-leaved forests show phylogenetically random structures [9]. In fact, recent studies have found that community structure is determined by the interaction between random drift and niche differentiation and have discussed the relative importance of stochastic and deterministic effects on community assembly [10].
Many researchers have used a phylogenetic approach to investigate the predominant processes that underlie community structure [6,8,9,11]. Community phylogenetic structure is mainly reflected in two aspects: one is that measure the relatedness of species occurring together in a community or sample, and the other is that measure the concordance of phylogenetic and ecological dissimilarities among species [3]. A number of studies have suggested that phylogenetic structure changes significantly with elevation [12,13]. Biodiversity varies greatly among different regions. Some studies have considered a connection between α- and β-diversity at the level of phylogenetic structure [14,15]. Non-random patterns of phylogenetic diversity may influence the spatial transformation of phylogeny and provide additional information for explaining mechanisms of community assembly [16]. Measures of phylogenetic diversity can take Faith’s PD, which is the sum of lengths of branches spanning that subset on the tree [17], and distance among species into account, and provide a means of quantifying the phylogenetic community structure in space.
It is also important to compare different species types when evaluating community assembly patterns. For example, trees and shrubs may exhibit different phylogenetic structures due to differences in life history characteristics or resource absorption mechanisms [18]. Of course, understanding factors that drive phylogenetic community structure remains a major issue in ecology. Numerous studies have shown positive correlations between the spatial distribution of biodiversity and driving factors such as climate and topography [19,20]. For instance, mean winter temperature was the major factor that limited the phylogenetic distribution of shrubs in the Mongolian Plateau [8], and phylogenetic structure was related to precipitation in northwestern South America [21]. Lower precipitation may have caused the coexistence of closely related species. HyunghoKim [22] found that topographic factors were the main factors controlling community diversity patterns. However, the influence of spatial and topographic factors on phylogenetic diversity has received much less attention.
In many regions, mountains exhibit ecological and biogeographic patterns and possess many conservation resources. However, some studies have shown that 85.7% of the world’s mountainous areas are affected by human activities, and biodiversity is facing increasing human disturbance and threats [23]. At present, mountain forests remain the least studied forest ecosystems [24]. Therefore, evaluating the phylogenetic diversity of a community is crucial for maintaining ecosystem functions. The elevational is an important environmental factor in the formation of mountain forests and dictates present-day distributional patterns because it affects temperature and precipitation, as well as other aspects of the ecosystem [25]. Although an increasing number of studies have focused on large-scale elevational phylogenetic structures and patterns in ecology and biogeography, fewer have addressed phylogenetic structures and patterns on smaller space scales [26]. Biodiversity patterns may vary with different vegetation types in small space and scale, and it is clearly important to explore such small-scale patterns [27]. The Huangshan Mountains in China are not only a priority core area of China’s biodiversity conservation but also one of the world’s cultural and natural heritage sites [28]. However, to date, few studies have addressed the distribution pattern and phylogenetic community structure of plants in this area.
Large forest dynamic monitoring plots are important platforms for biodiversity and community studies. Harvard University and Duke University in the United States have carried out long-term studies of forest dynamics to carry out scientific research in the macroscopic field: plant functional shapes and species coexistence mechanisms, the relationship between plant spatial distribution patterns and habitat, forest ecosystem services and restoration, and so forth [29,30]. At present, plant DNA barcoding requires such a platform to study community assembly, and such a monitoring network provides a better platform for data collection [31]. Here, we collected information from 176 species in three permanent plots established at Mt. Huangshan in order to investigate small-scale space patterns. We evaluated the relationships among phylogenetic structure, diversity, and environmental variables associated, which have been strongly correlated with community assembly in previous studies [32,33]. The study was designed to answer the following scientific questions:
  • Did the phylogenetic structure of three community assembly differ between tree and shrub plants, and how did phylogenetic diversity change in three vegetation regions?
  • How did environmental variables (space, topography, and climate) influence and contribute to community diversity and community structure?
  • Did the phylogenetic diversity of the three plant groups deviate faster or slower than predicted by the null model?

2. Materials and Methods

2.1. Study Area and Data Collection

The study area is located in the Huangshan Scenic Area (referred to as Mt. Huangshan in this article), Anhui Province, China (118°11′ E, 30°10′ N). The annual mean temperature and precipitation in this area are 7.8 °C and 2394.5 mm, respectively. A rich diversity of trees and shrubs are harbored in various unique vegetation types: evergreen broadleaf forest dominated by Castanopsis eyrei, Eurya nitida, and Rhododendron ovatum; mixed evergreen and deciduous broadleaf forest dominated by Quercus myrsinifolia, Lindera glauca, and Lindera rubronervia; and mixed needleleaf and broadleaf forest dominated by Pinus taiwanensis, Eurya nitida, and Symplocos anomala [28].
Three plots were established at Mt. Huangshan in 2014 according to international protocols: Xiaolingjiao (here referred to as plot I and community I, 427–566 m), Guanpulou (plot II and Community II, 729–783 m), and Yungusi (plot III and Community III, 846–899 m) (Figure 1).Community I (10.24 hm2, 256 quadrats), Community II (1 hm2, 25 quadrats), and Community III (1 hm2, 25 quadrats) representthree typical vegetation types: evergreen broadleaf forest, mixed evergreen and deciduous broadleaf forest, and mixed needleleaf and broadleaf forest, respectively. The plots were established by delimiting the boundary of 20 × 20 m large quadrats using a total station combined with a real-time dynamic control system (real-time kinematic, RTK). To facilitate the investigation, each 20 × 20 m large quadrat was subdivided into 16 small quadrats of 5 × 5 m. Within each 5 × 5 m quadrat, trees and shrubs with a diameter at breast height (DBH) ≥ 1 cm were marked with metal plates, and the plant species, DBH, height, crown diameter, under crown height, and spatial coordinates were recorded.
For delimitation of the Huangshan Mountain species pool, samples of all angiosperms and gymnosperm from the three plots were collected. After preliminary identification in the field, all species were verified in the laboratory using Angiosperm Phylogeny Group IV [34] and Flora of China.

2.2. Phylogenetic Tree Construction

In the field of community ecology, most community studies lack DNA sequence data [35], and such phylogenetic trees are usually only resolved at the order and family levels. Therefore, we conducted a phylogenetic tree with DNA sequences. A total of 176 species representing 54 families and 110 genera were collected from three plots (Figure S1). Total DNA was extracted from silica-dried leaf materials from one to two tagged individuals of 176 species using a plant DNA extraction kit (Beijing Tiangen Technology Company, Beijing, China, DP305). The internal nuclear ITS2 gene and the plastid rbcL and matK genes were amplified by polymerase chain reaction (PCR) using standard forward and reverse primers for each species. The amplified ITS2, rbcL, and matK sequences were sequenced by the two-directional sequencing method at Sangon Biotech [36]. Each of the three markers was compared against the entire sequence database of NCBI using BLAST. Then, a multiple sequence alignment was performed in MEGA. In brief, we used the online phylogenetic database and toolkit Phylomatic (http://phylodiversity/net/phylomatic/, accessed on 28 May 2021) to generate a constraint tree [37,38]. Then the DNA supermatrix and the constraint tree were run together using RAxML [39] on the CIPRES supercomputer cluster (www.phylo.org, accessed on 22 June 2021) to obtain the phylogenetic tree.

2.3. Phylogenetic Community Structure

Phylogenetic structure was calculated using the net relatedness index (NRI) and the nearest taxon index (NTI) to evaluate the differences between total plants, trees, and shrubs. The net relatedness index (NRI) reflects the mean phylogenetic distance (MPD) between any possible pair of species in the community; it describes the overall phylogenetic structure of species formation in the community and is better able to detect phylogenetic clustering [11]. The nearest taxon index (NTI) measures the mean nearest taxon distance (MNTD) between any species and its closest relatives; it describes the pattern of community phylogenetic relatedness index between closely related species and has more power to detect phylogenetic overdispersion [40]. The NRI and NTI were calculated using the following formulas:
N R I = 1 × MPD sam MPD rnd s d   ( MPD rnd )
N T I = 1 × MNTD sam MNTD rnd s d   ( MNTD rnd )
where MPDsam is the observed mean phylogenetic distance, and MNTDsam is the observed mean nearest taxon distance between all possible pairs of taxa in each plot. MPDrnd and MNTDrnd represent the mean MPD and mean MNTD of randomized assemblages, in which species in a plot are selected randomly from the species pool 999 times to obtain a distribution of MPD and MNTD for the random null model [16]. sd(MPDrnd) and sd(MNTDrnd) are the standard deviations of MPDrnd and MNTDrnd. A positive NRI or NTI means that the community is composed of closely related species and has a clustered phylogenetic structure. By contrast, a negative NRI or NTI indicates that the species in the community are more distantly related than expected, and the community has an overdispersed phylogenetic structure [41,42].

2.4. Phylogenetic α- and β-Diversity

To quantify phylogenetic α-diversity, we calculated Faith’s phylogenetic diversity (PD), which is the total length of the branches from the basal node to the tips in a subset of a phylogenetic tree [17]. Species richness was measured as the number of species in a quadrat. The null model analysis is an important research tool in community ecology [43]. In recent years, several methods for measuring phylogenetic β-diversity have emerged. Here, we used the mean pairwise distance (D’pw) and the nearest neighbor distance (D’nn), as D’ pw is more sensitive near the tips of the tree, whereas D’nn is sensitive to turnover among nearest neighbor distances [35]. They were calculated as follows:
D pw = i = 1 n k 1 f i mean ( δ ik 2 ) + j = 1 n k 2 f j mean ( δ jk 1 ) n k 1 + n k 2 ,
D nn = i = 1 n k 1 f i min ( δ ik 2 ) + j = 1 n k 2 f j min ( δ jk 1 ) n k 1 + n k 2 ,
where mean(δik2) represents the average paired distance between species in community k1 and all species in community k2; min(δik2) represents the nearest neighbor distance between species i in community k1 and all species in community k2; mean(δjk1) represents the mean pair distance between species j in community k2 and all species in community k1; min(δjk1) represents the nearest neighbor distance between species j in community k2 and all species in community k1; fi is the relative abundance of species i in community k1; and fj is the relative abundance of species j in community k1 [43,44], nk1 represents the total number of species in community k1, nk2 represents the total number of species in community k2.
Within an ecosystem framework, the mechanisms underlying phylogenetic diversity can be analyzed by comparing observed data with a null model, where each species has an equal probability of occurring within each plot. We further computed the standard effect sizes (S.E.S) of these measurements. Positive S.E.S values indicate that the observed PD is higher than expected, whereas negative values indicate that it is lower.

2.5. Environmental Variables

We explored the relationship between three classes of environmental and species diversity. First, we modeled the variation in phylogenetic structure in terms of spatial vectors based on geographical coordinates using principal coordinates of neighbor matrices (PCNMs). Thirty-two PCNM eigenfunction [40,45] vectors produced the latitude and longitude of each quadrat using the function ‘PCNM’ from the R package ‘vegan’. Next, four topographic attributes were computed in the field: elevation, aspect, slope, and convexity [46]. Climate data, including 19 bioclimatic factors (Table S4), were downloaded from the WorldClim global climate data set (http://www.worldclim.org, accessed on 13 August 2021) and extracted with DIVA-GIS software based on the latitude and longitude of the study plots.

2.6. Data Analysis

All of the phylogenetic analyses were performed in R version 4.0.2. The ‘picante’ package was used to calculate phylogenetic structure indices (NRI and NTI), Faith’s phylogenetic diversity (PD), mean pairwise distance (D’pw and S.E.S.D’pw), and nearest neighbor distance (D’nn and S.E.S.D’nn) [14,47].
To evaluate the relative importance of environmental factors for plant community formation, we analyzed the relationships of phylogenetic structure with topographic factors, climatic data, and spatial variables by a forward variable selection.The variation partitioning used the functions ‘varpart’ in a redundancy analysis (RDA) with 9999 permutations. We also performed multiple regression on distance matrices (MRM) to evaluate the relative contributions of environmental factors to patterns of phylogenetic diversity with the ‘ecodist’ and ‘vegan’ packages in R [48].

3. Results

3.1. DNA Amplification, Sequencing, and Phylogenetic Tree Construction

More than half of the studied species were trees (69%, 40 families, 78 genera, and 122 species), and 31% (26 families, 38 genera, and 54 species) were shrubs. For the three DNA barcoding loci, the percentages of PCR success for ITS2, rbcL, and matK were 97.72%, 97.15%, and 88.63%, respectively. Sequencing success was high for both rbcL (100%) and ITS2 (97.09%), whereas matK (92.94%) had a lower overall success rate (Table S1). In cases where we failed to obtain a sequence for a given species, the relevant sequence was downloaded from GenBank; detailed information on such sequences is provided in Table S2.
Based on the APG IV as the framework for the constraint tree, a community phylogenetic tree (Bar.cons) was constructed from the three DNA barcoding sequences by the maximum likelihood (ML) method (Figure S2). Phylogenetic trees generated from the three-sequence supermatrix data alone were called Bar.uncons. Total support (bootstrap or ratchet) for nodes on the Bar.uncons tree was frequently strong (59.88%), but some nodes received medium (13.77%), weak (15.57%), or different (10.78%) support values (Figure S3, Table 1). The Bar.cons tree had a higher node support rate, and 78.23% of the strong ratchet was resolved. By contrast, the phylogenetic tree formed by the APG IV classification had no node support, and the terminal branches were generally multi-branched structures (Figure S4). As a result, we selected the Bar.cons tree for analysis of the phylogenetic structure of the Huangshan community.

3.2. Phylogenetic Structure of Total, Tree, and Shrub Plants

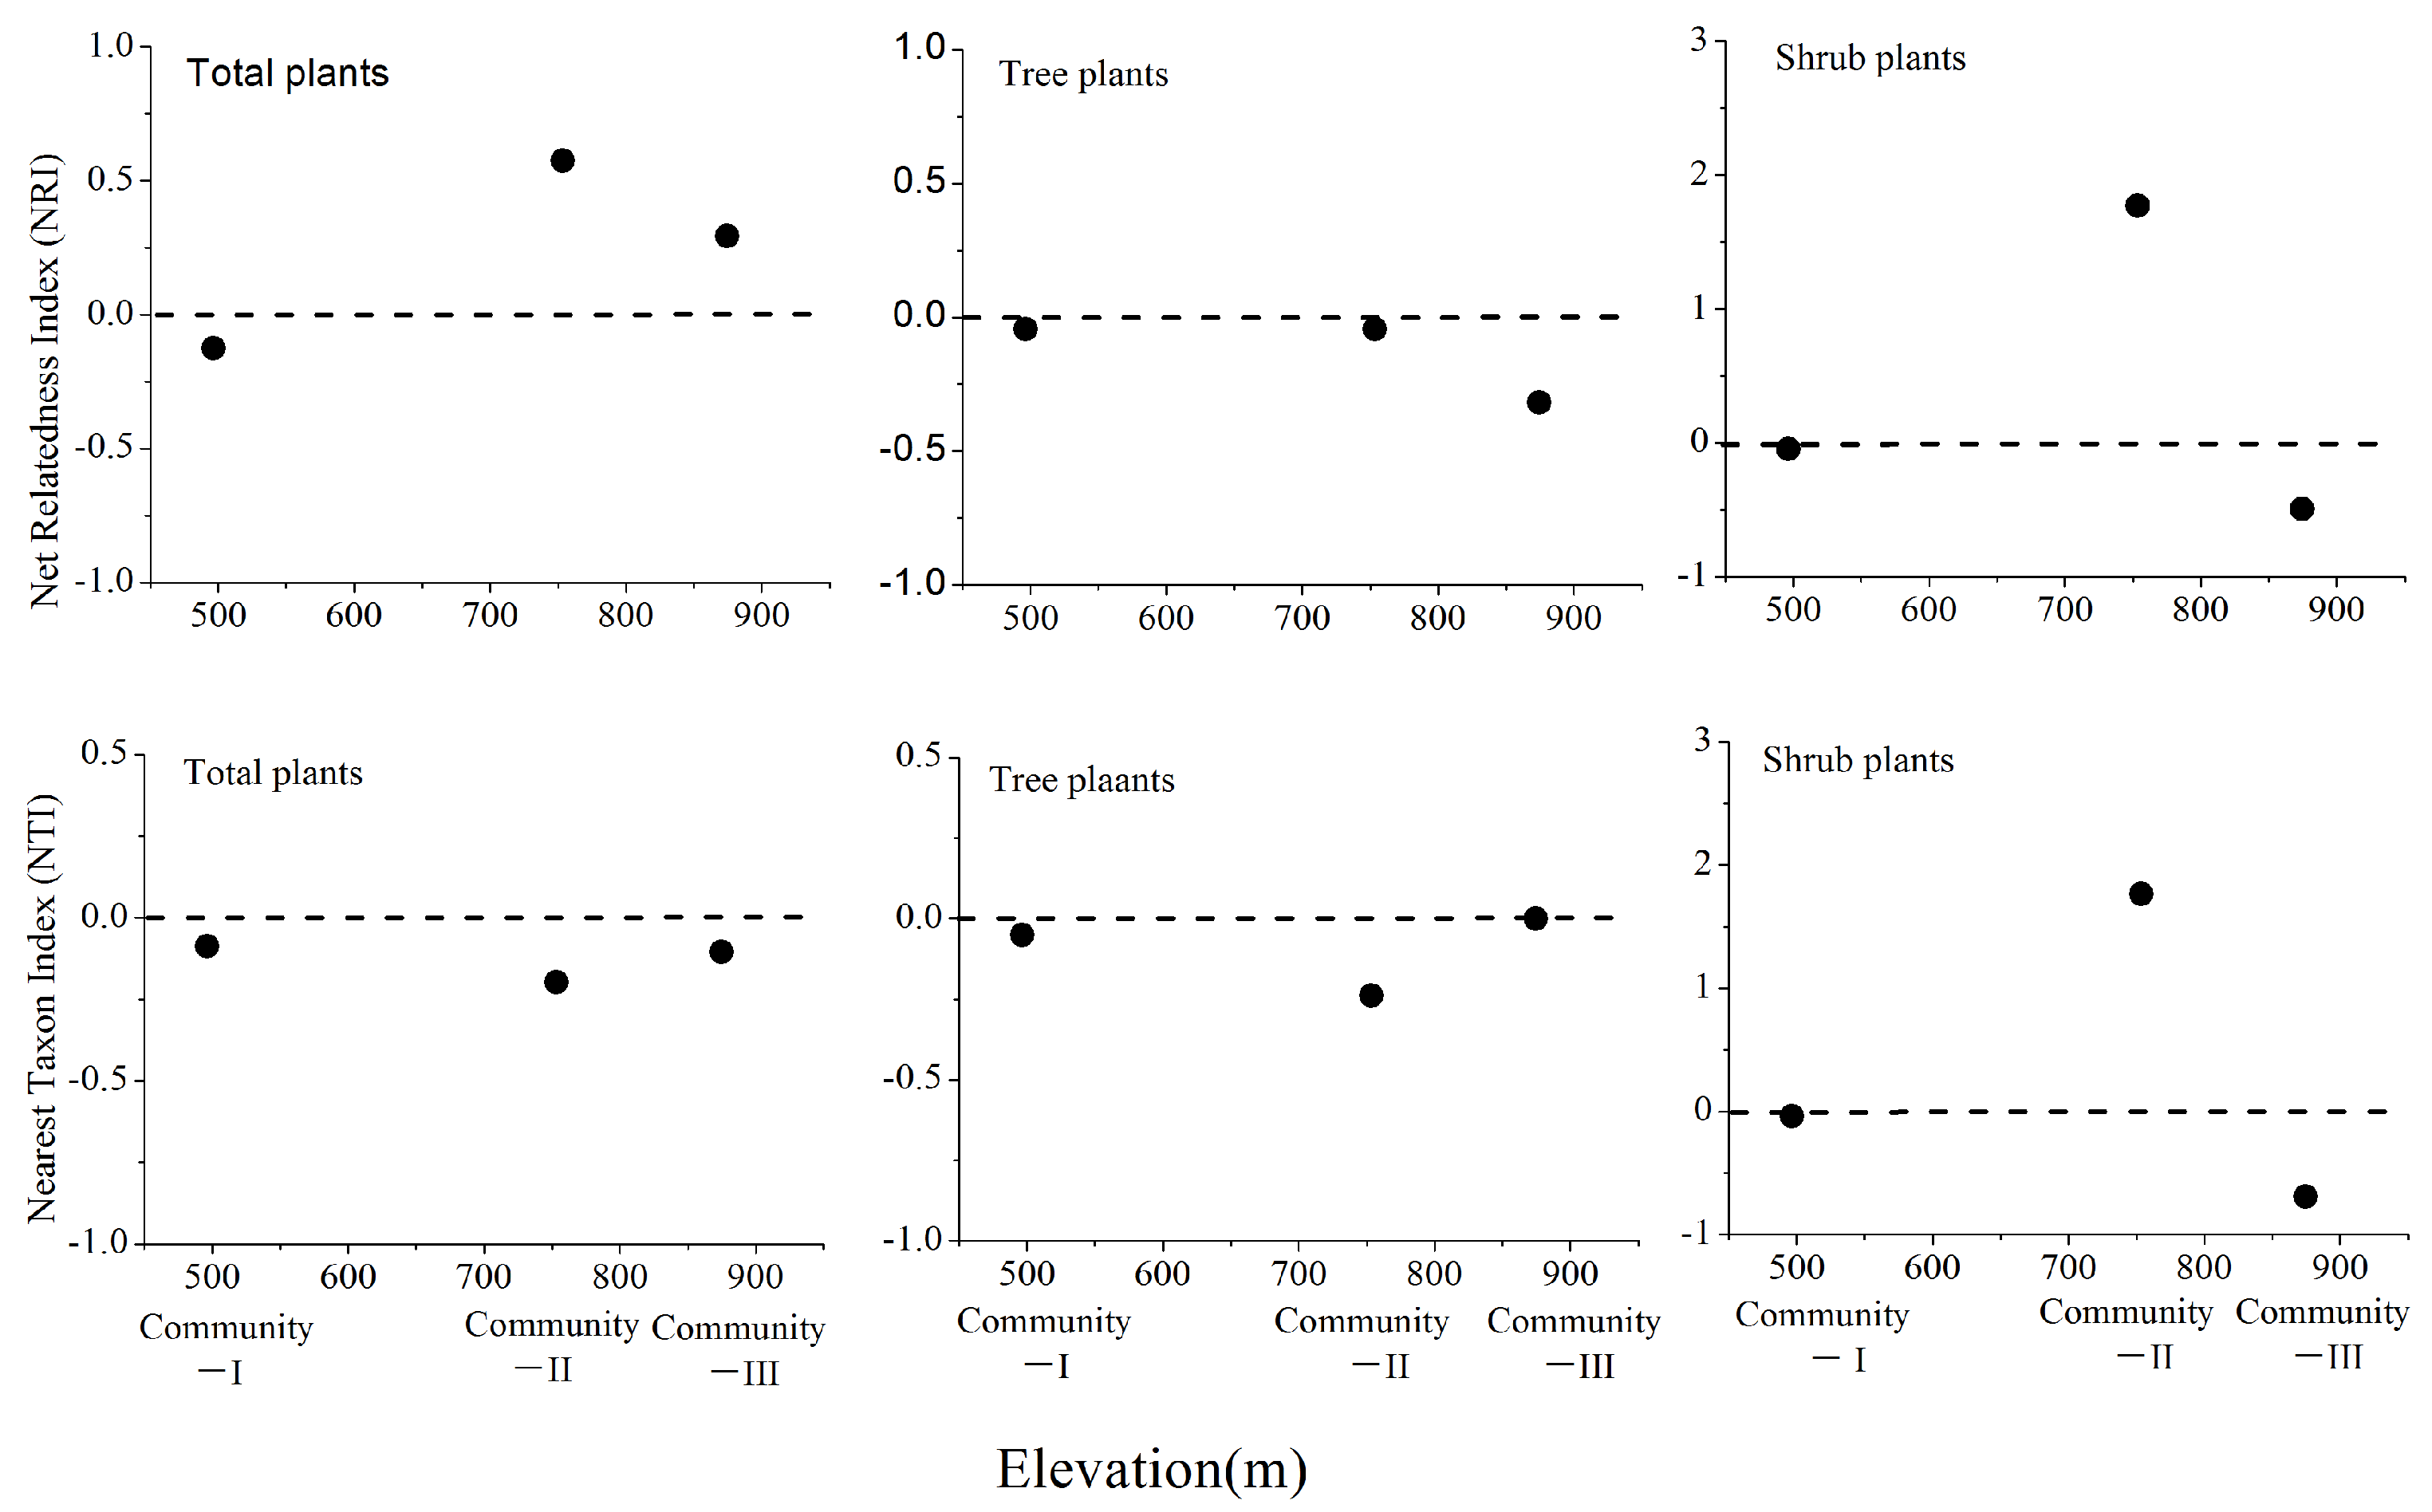
When we examined differences between three vegetation communities, NRI and NTI showed different patterns in total, tree, and shrub plants (Figure 2). For total plants, both the NRI and NTI metrics were negative, indicating that there was no significant overdispersion at Community I. Especially, NRI of Community II and III were positive, indicating phylogenetic clustering for total plants. For tree plants, all of NRI and NTI were negative, indicating phylogenetic overdispersion in three communities. For shrub plants, the values of NRI and NTI were negative, showing phylogenetic overdispersion in Community I and III, while NRI and NTI of Community II were positive values.
The phylogenetic indices (NRI and NTI) respond differently to environmental variables. These variables could explain more with NRI than NTI(AdjR2Cum) (Table 2 and Table S3). These results showed that spatial factors had more influence on the phylogenetic structure of the three plant groups than climatic and topographic factors. The climatic factors with the greatest effect for shrubs were Bio1(annual mean temperature), Bio9(mean temperature of driest quarter), whereas Bio10(mean temperature of warmest quarter) and Bio15(precipitation seasonality) significantly affected the phylogenetic structure of total plants. The topographic variables of elevation and aspect affected NRI. In addition, the results of variation partitioning differed slightly from those of forward selection (Figure S5). The spatial factors could explain the NTI of total plants in forward selection (Table S3), whereas they could not explain variation partitioning.The pure effects of each environmental factor were lower than those of combined factors. For example, the common explanatory rate of the three vectors was 19% for total plants, whereas their pure effects were 2%, 1%, and 3%. However, the combined effect of spatial and climatic factors was higher than that of the other factors for shrub layers (38% for NRI and 29% for NTI).

3.3. Species Richness and Phylogenetic Diversity across Three Different Communities

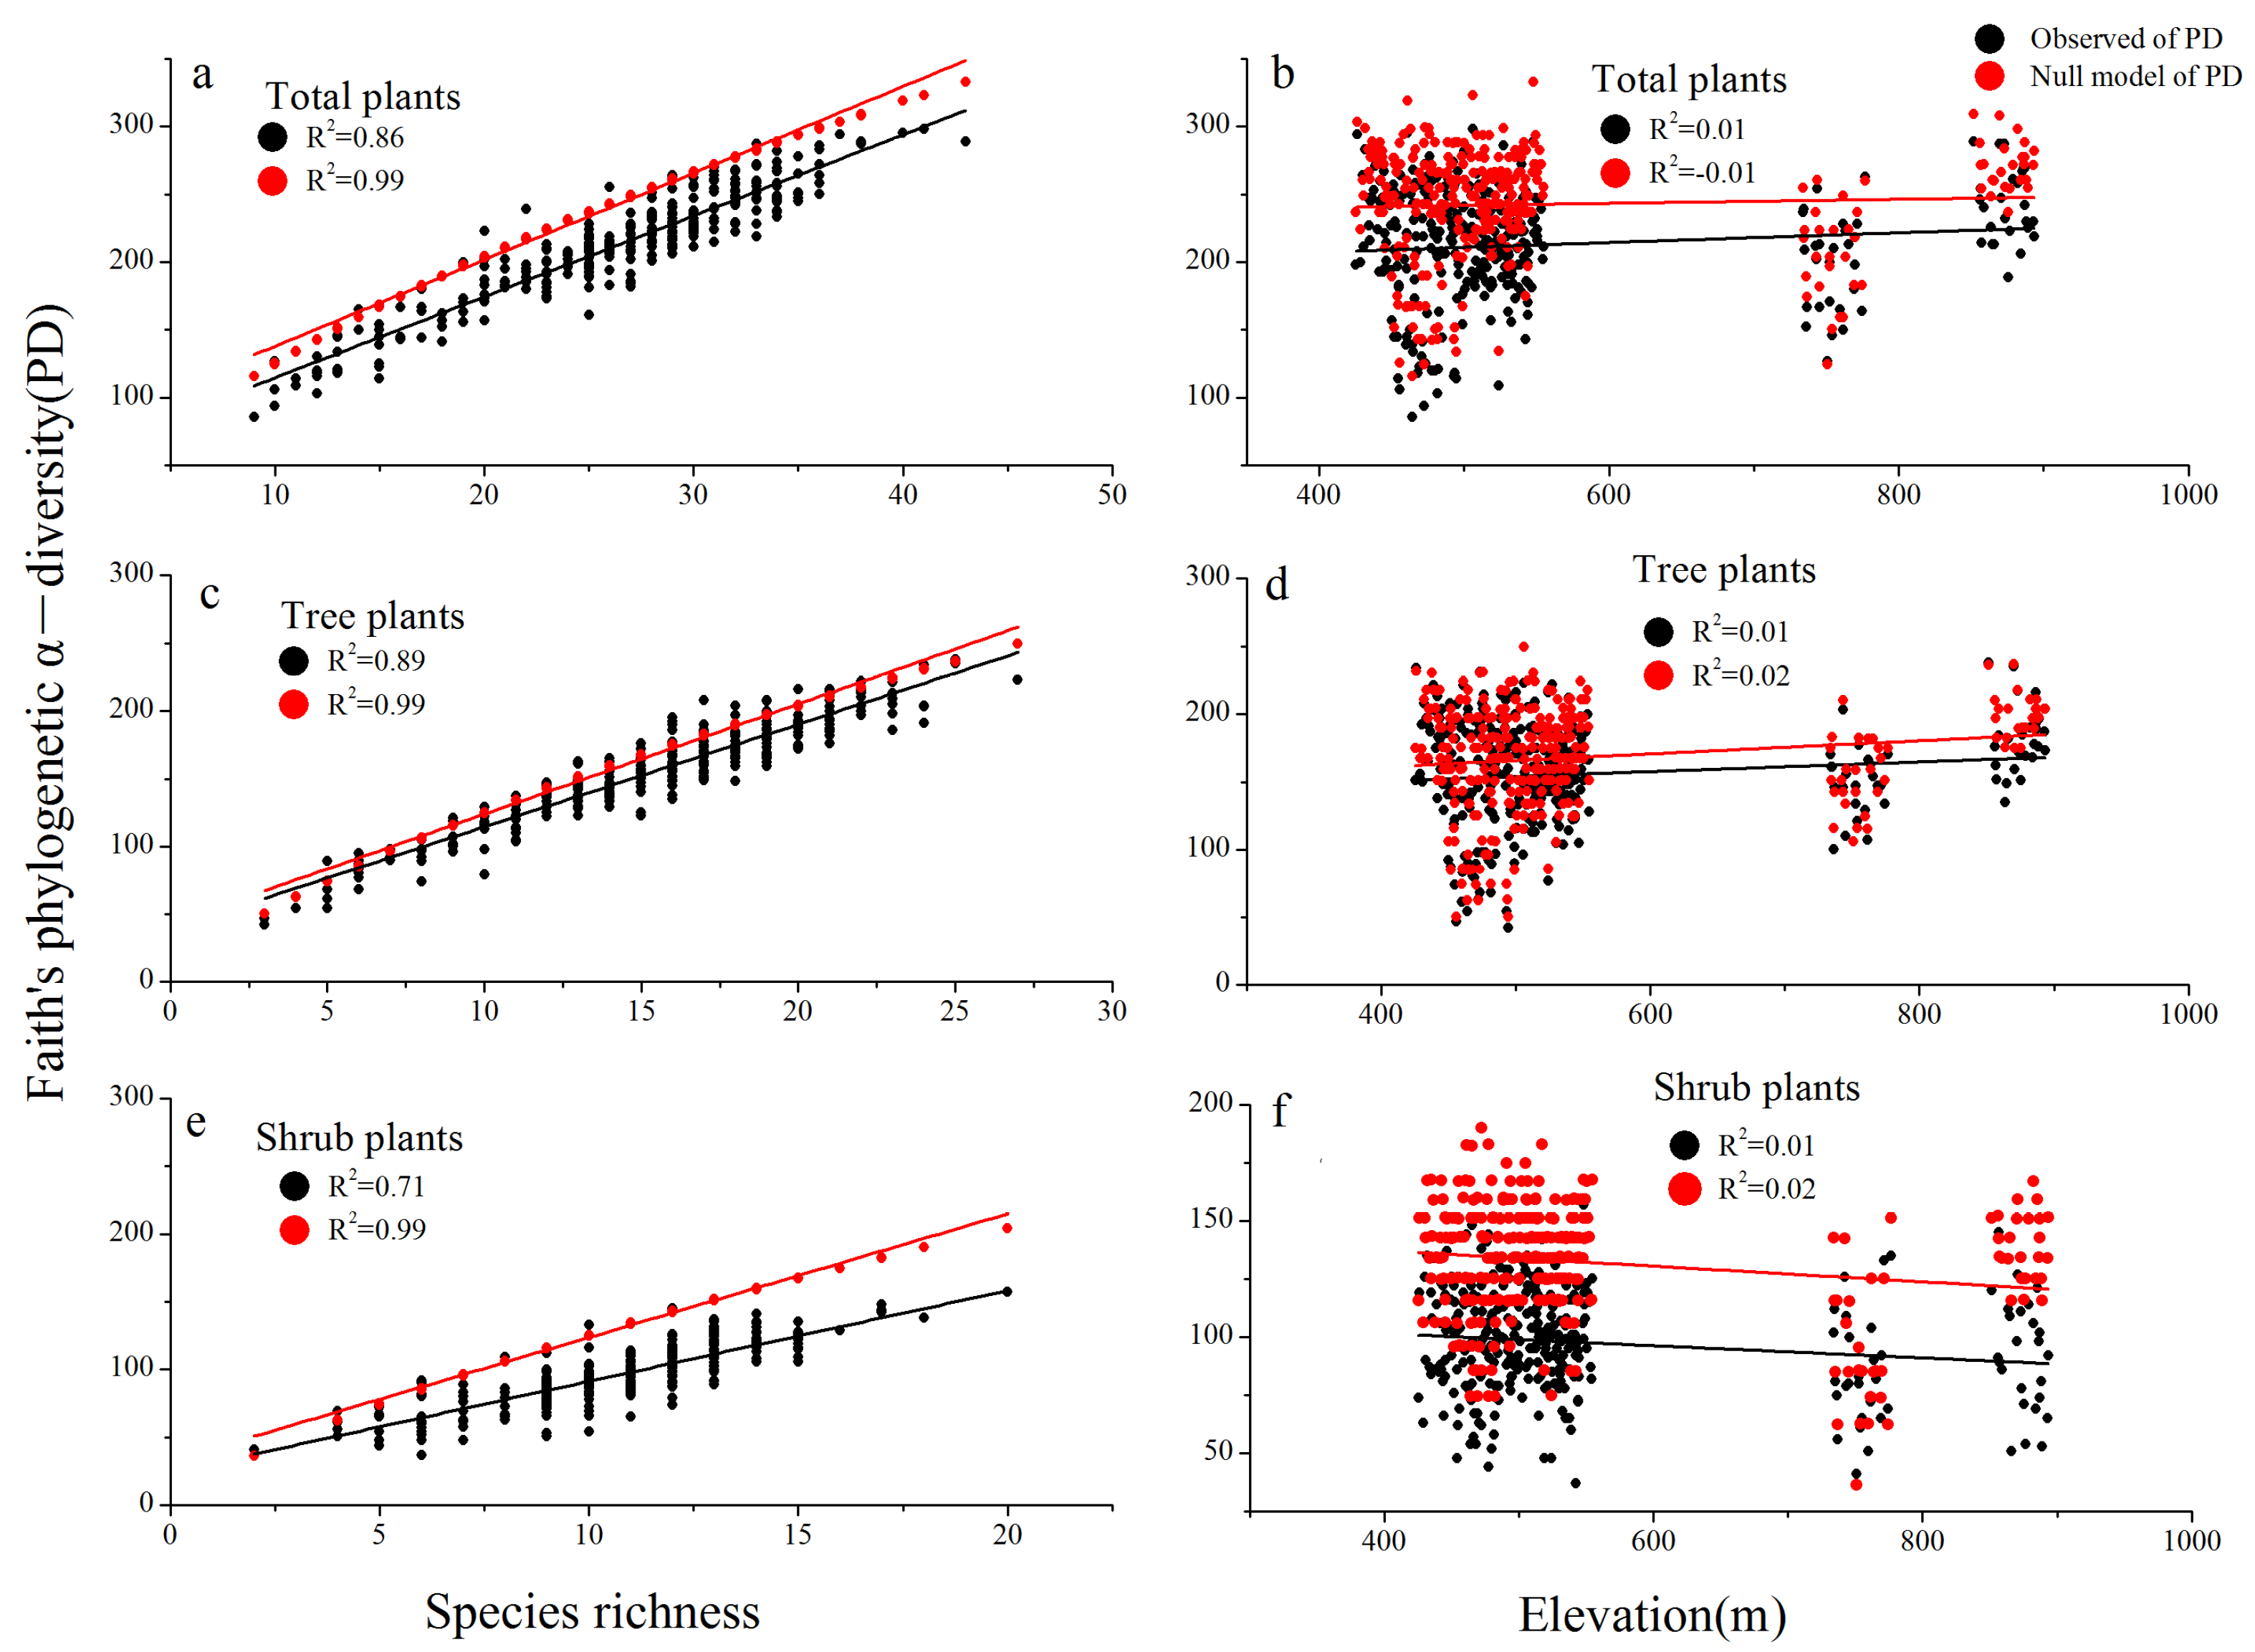
Faith’s phylogenetic α-diversity (PD) was positively correlated with species richness (Figure 3a,c,e), whereas PD had weak correlation coefficients with altitude for total plants and trees (Figure 3b,d,f). As species richness increased, the measured values of PD were lower than the expected value (S.E.S.PD), but the value of PD and the expected value (S.E.S.PD) had little difference along species richness for tree plants, and the trend is consistent. (Figure 3c). However, the extent of the deviation between PD and S.E.S.PD in shrubs increased with increasing elevation (Figure 3e), indicating that these species were more distantly related to their neighbors in the community construction mechanism.
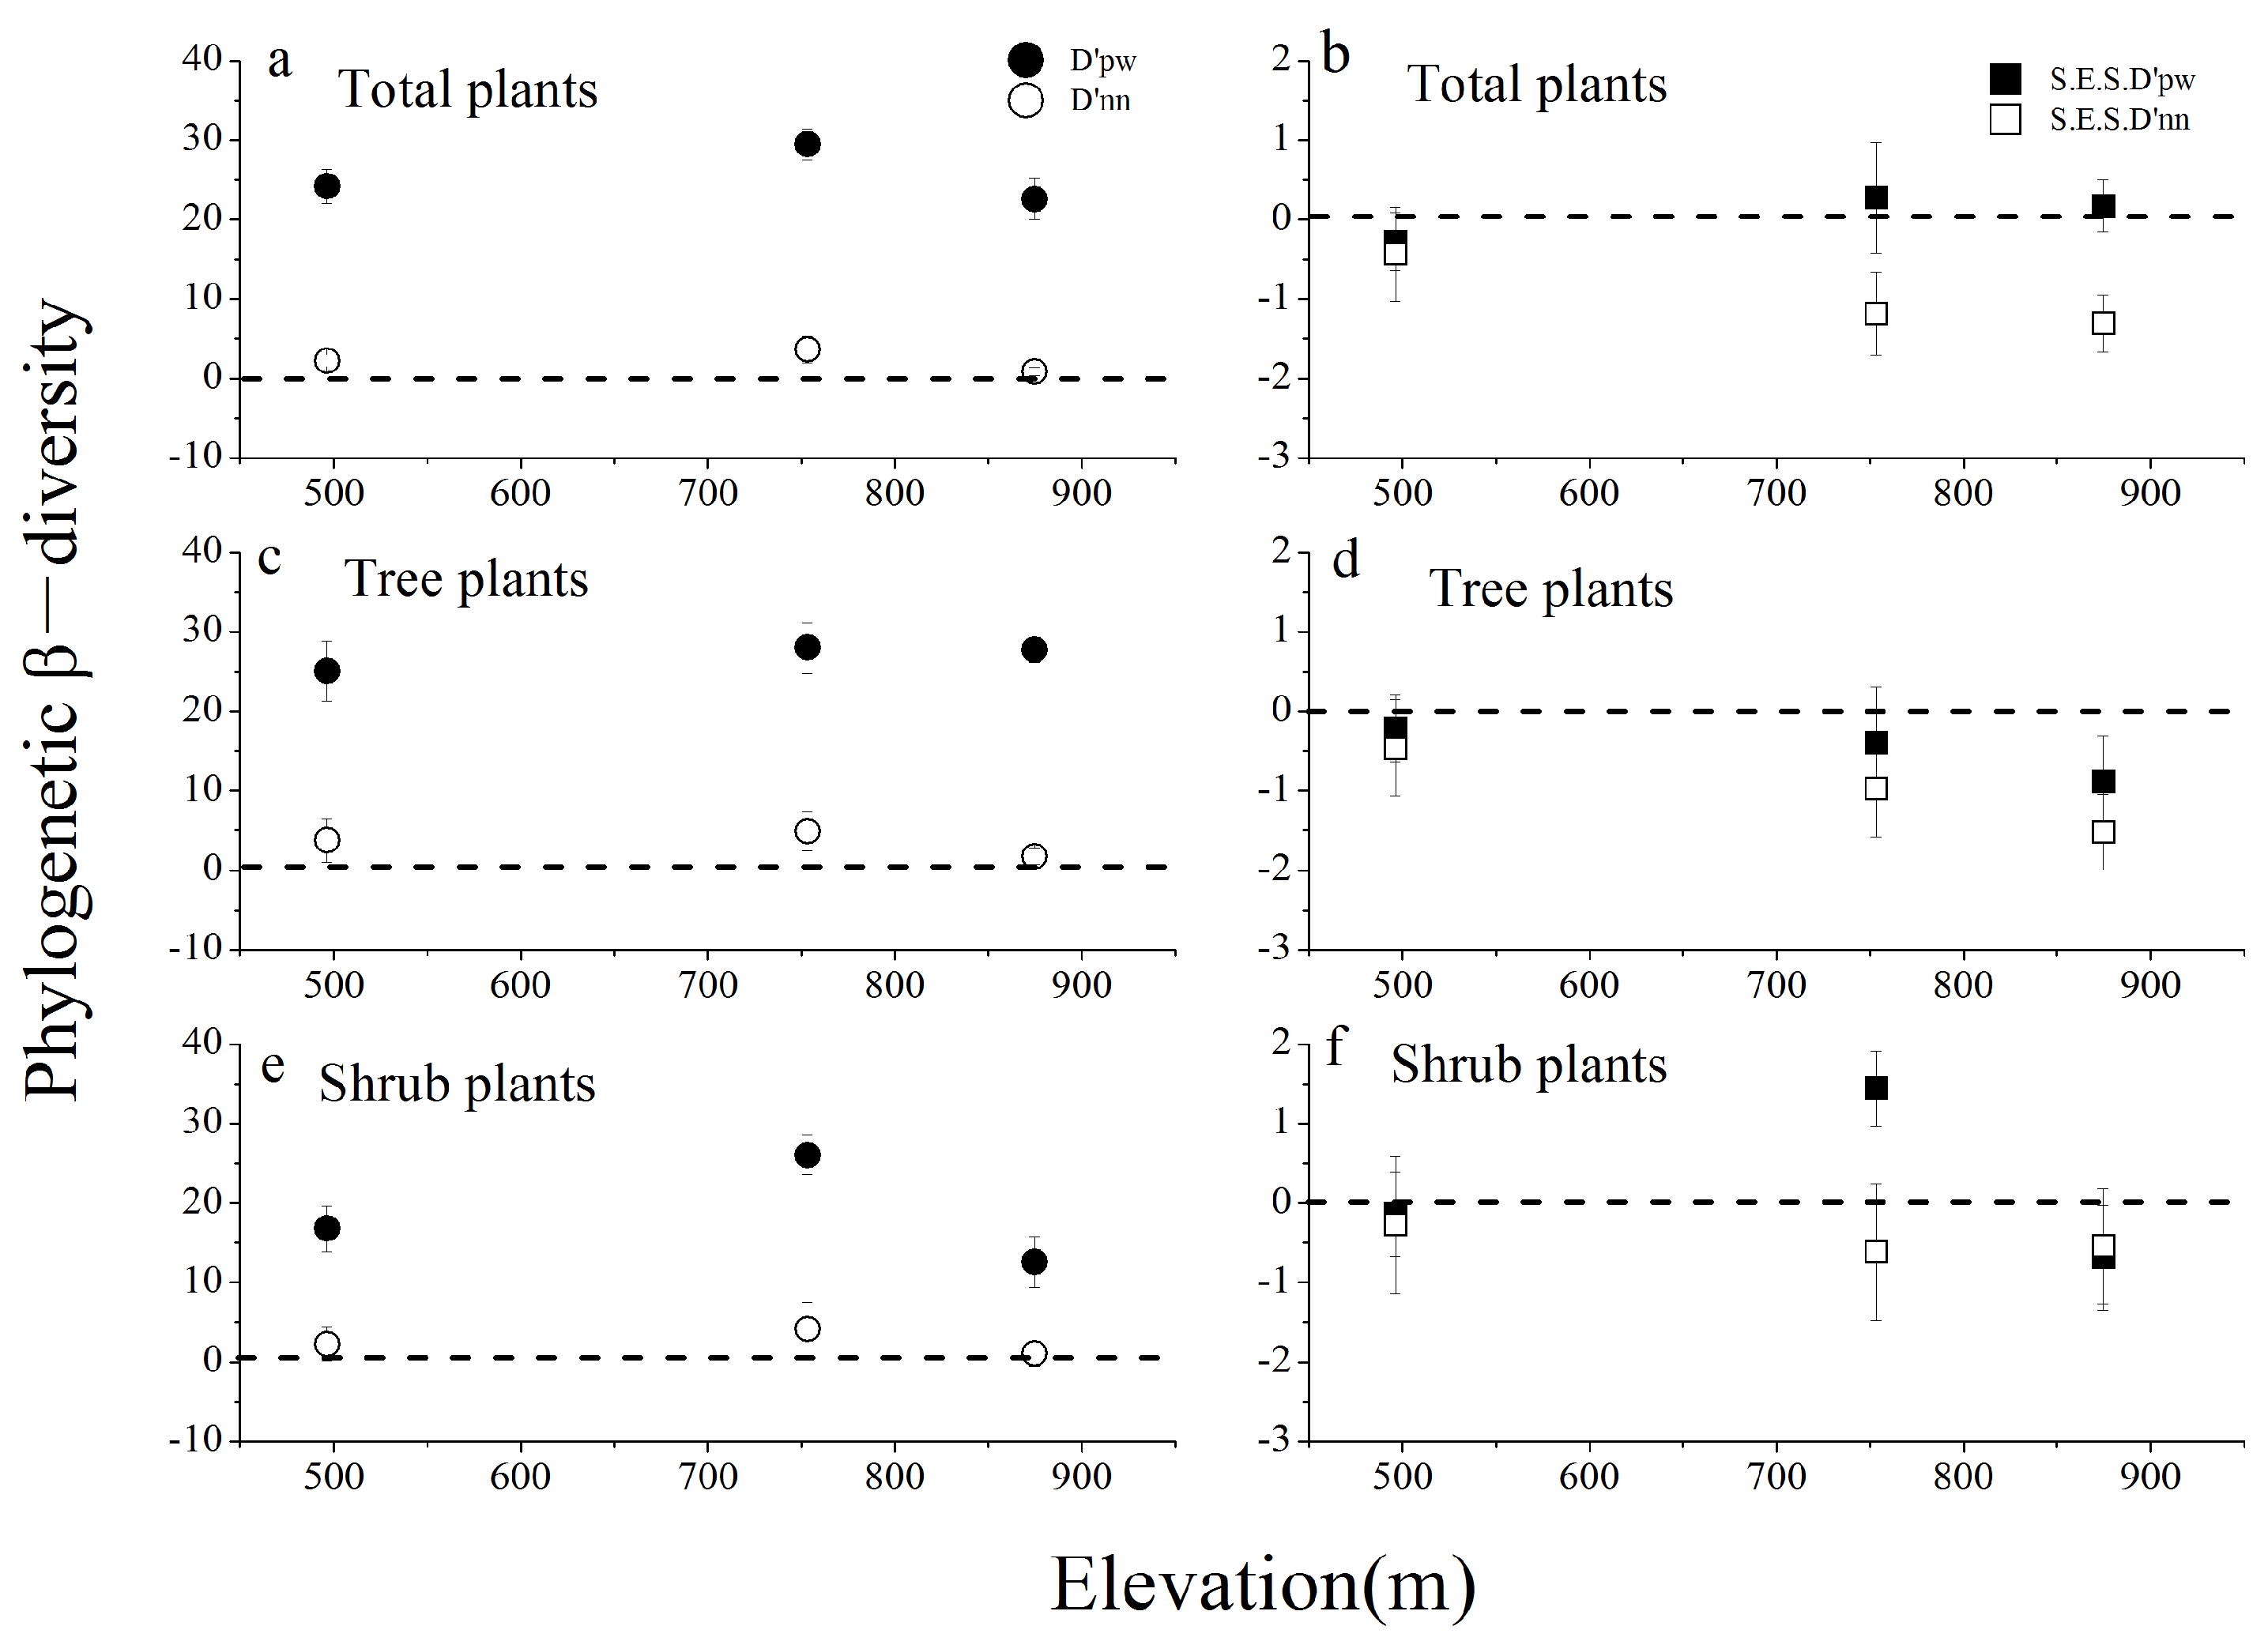
Pairwise phylogenetic metrics D’pw exhibited that there was a peak value at Community II for total and shrub plants (Figure 4a,e). The value of D’pw showed no statistically significant pattern among the three communities for tree layers (Figure 4c). Phylogenetic metrics based on D’nn showed a non-line pattern along altitude in total plants, trees, and shrubs. Null model analysis using mean pairwise distance (S.E.S.D’pw) and nearest neighbor distance (S.E.S.D’nn) showed a downward trend in the three plant groups. The negative values of S.E.S.D’pw and S.E.S.D’nn in Figure 4b,d,f showed that observed phylogenetic β-diversity was lower than expected for the three groups. However, at Community II, the value of S.E.S.D’pw was positive, and that of S.E.S.D’nn was negative, meaning that the phylogenetic β-diversity was unstable for total plants and shrubs.
D’nn was more strongly associated with environmental vectors than D’pw (Table 3). The pure effect of climatic variables was greater than those of the two other habitat variables. In addition, the pure explanatory rate of climatic factors was greater than 60% in the shrub layer. Topographic factors explained only about 10% of the variation in D’pw and for D’nn 20%. The MRM model explained up to 62% of the variation by combining spatial, topographic, and climatic factors for total plants; it explained 31% of the variation for trees and 62.4% for shrubs. Overall, the combined environmental factors explained a greater proportion of the variation in phylogenetic structure than each pure effect.

4. Discussion

The present research aimed to analyze phylogenetic structure and α- and β-diversityin the Huangshan Mountain (Anhui Province, China) in Community I (evergreen broadleaf forest), Community II (mixed evergreen and deciduous broadleaf forest), and Community III (mixed needleleaf and broadleaf forest) for total plants, trees, and shrubs. Here, we also evaluated the relationship between environmental variables and the phylogenetic diversity at a small spatial scale.

4.1. Assessment of DNA Barcodes for Community Construction

The ability to construct a well-resolved phylogenetic tree will assist with the development of DNA barcode libraries. The Bar.uncons tree constructed from DNA barcode sequences alone produced a better topology than that of APG IV [37]. However, in some families, such as Lauraceae, Styracaceae, Theaceae, and Hamamelidaceae, deeper topological structures were still not well resolved. The use of the Bar.cons tree solved this problem, increasing the high node support rate from 59.88% to 78.23% and also improving the other three-node support rates. An equally important reason for using the three DNA barcodes is to lessen the effect of idiosyncratic problems with the recovery of sequences for each barcode locus. This three-barcode method not only retained the higher species resolution of the terminal branches of the evolutionary tree but also resolved the phylogenetic relationships among families and species effectively, providing more accurate K2P distance (kimura-2-parameter distance, the intraspecific and interspecific genetic distance of species) for phylogenetic structure and diversity analysis [38].

4.2. Drivers of Phylogenetic Structure across Three Communities

Although most of these two indices showed negative values in three differentcommunities of Mt. Huangshan, the values of NRI in Community II and III were positive, and this indicated that total plants have clustered phylogenetic structures and tend to be phylogenetically clustered at higher elevations. The phenomenon of the inverse values of NRI and NTI may be explained by the low diversity of gymnosperms in the regions, which led to tree-wide phylogenetic clustering, whereas angiosperms had moderate diversity and were evenly distributed among many nodes in the phylogenetic trees [49,50]. While, in tree plants, the values of NRI and NTI were negative, indicating phylogenetic overdispersion. The NRI and NTI index of Community I showed no significant overdispersion. This case may also be caused by the combination of habitat filtering and competition exclusion. Their ancestors may be phylogenetically different from each other, which would have led to the nearly random phylogenetic patterns we find. The phylogenetic structure was more phylogenetically overdispersion at Community III, where it was mainly mixed needleleaf and broadleaf forest by Pinus taiwanensis, and was in a certain stage of succession balance and basically stable due to the influence of higher-elevation and climate. It is possible that some plant species (such as Cyclobalanopsis myrsinifolia, Lindera rubronervia, Phoebe sheareri, and Carpinus viminea) had already adapted to cold conditions and occupied higher-elevation habitat assemblages. There would then inevitably be fierce interspecific competition for limited resources, such that only species with different niches could remain in the community [11]. Subsequently, the advantages of negative interactions, such as competition and other density-dependent factors, can lead to a phylogenetic overdispersion because of the exclusion of close relatives [51,52].
With the change of vegetation communities, the phylogenetic structure of trees and shrubs showed different patterns. For shrub plants, there was a small peak value of NRI and NTI in Community II and showed a clustered phylogenetic structure. Community II was mainly mixed evergreen and deciduous broadleaf forest by Lindera rubronervia and Lindera glauca, which occupied a larger niche width and formed a competitive pattern. Closely related plants have similar characteristics that enable them to survive in harsh climates with mid-elevation, which could be one of the possible reasons for phylogenetic clustering in these regions. The filtering process of temperature or climate played a greater role in the community structure of tree plants [1,53]. Hence, a transition from the phylogenetic structure on Mt. Huangshan reflected the fact that community structure on small-scale elevational gradients was dominated by deterministic processes.
We clearly demonstrated that shrub plant assembly was affected by a combination of spatial, climatic, and topographic factors, whereas patterns of total plant and tree assemblage were affectedmainly by spatial and topographic factors. These results are supported by Huang [54]. Surprisingly, we found that the spatial distance was strongly related to their phylogenetic structure. These quadrats used in our analyses are distributed in the middle-higher altitude area where the difference of altitude is small. Thus, spatial distance is linearly related to environmental distance in the study system, thereby making it contribute to the phylogenetic structure. In addition, climatic factors (Bio 1, Bio 10, Bio 14, Bio 15) were less correlated with NRI. Qian [1] also found that community structures were less sensitive to climate. However, the phylogenetic structure of shrub communities on the Alexa Plateau, whichis an arid region, was affected by annual precipitation [55]. The NRI of community structure in Qaidam Basin was independent of annual precipitation because evaporation offset the impact of precipitation [56]. Therefore, phylogenetic clustering may be more common in wetter habitats. Temperature was also a strong filter for the survival of shrubs. The distribution of plants in Community II was greatly affected by temperature, leading to a larger number of coexisting species and greater phylogenetic clustering. Furthermore, topographic factors such as elevation and aspect played a greater role in structuring species in the total plant and shrub layers. This contrasts with the work of Zhou, who found that the community had climate-dominated niches [53]. Based on the abundance of species in each quadrat, there were more plants in the low-slope quadrats and fewer plants in the plots of the steeper quadrats, resulting in a different phylogenetic structure for each quadrat in the whole community.

4.3. Patterns and Determinants of Phylogenetic α- and β-Diversity in Three Communities

In terms of plant diversity, species richness and Faith’s phylogenetic diversity PD were highly correlated with each other for all plant groups, which was the same as that in a previous study by Zhou et al. [53]. We first quantify the degree to which the observed phylogenetic α-diversity differed from that expected given the observed α-diversity. Specifically, three layers plants had lower than expected phylogenetic α-diversity (S.E.S.PD). This pattern is consistent with previous studies of Yunlong Snow Mountain [44]. However, the increasing difference between observed and expected PD in the shrub layer may be related to both aboveground and belowground pressure. The phylogenetic β-diversity of Community I was higher, which was mainly an evergreen broad-leaved forest dominated by Castanopsis eyrei and Eurya nitida, and in which Castanopsis eyrei dominated and occupied a larger space. There were more understory seedlings, and the forest was in the early stage of secondary succession. Notably, Community II with mid-elevation hasthe highest phylogenetic diversity and higher thanthe expected value based on the positive S.E.S.D’pw for total and shrub plants, which might be due to more closely related species in our study. Specifically, we should also be concerned about Community III, which had lower phylogenetic diversity than expected for all plants (Figure 4). In this region, some endangered species are found to exist and need extensive protection because they are more likely to become extinct [57].These results indicated that niche-based deterministic processes played a more important role in tree community construction than neutral processes.
Although the present study has evaluated the role of environmental factors underlying patterns of phylogenetic structure, additional research is needed to evaluate whether the phylogenetic β-diversitywas related to their environmental factors. The key drivers for these diversity patterns were climatic factors. Because of the high humidity and precipitation in the subtropical monsoon climate zone of the Huangshan community, annual precipitation and annual mean temperature caused changes in microhabitat conditions such as soil moisture and light availability in the forest further increasing the spatial structure of the community. Spatial distance resulted in differences in species dispersal ability, which weakened interspecific competition to some extent and changed the spatial pattern of community β-diversity [58]. Topographic factors explained the lowest amount of phylogenetic β-diversity, perhaps due to the small size of the quadrats and the small change in topographic factors. Many studies have shown that topography factors only explain a small part of the variation in β-diversity [28,59]. Unmeasured spatially autocorrelated environmental variables, such as vertical light gradients or fine-scale soil nutrient gradients, may also influence phylogenetic diversity.

5. Conclusions

We analyzed the relationships of phylogenetic diversity and structure with three environmental variables for total plants, trees, and shrubs on three different vegetation plots at Mt. Huangshan and found the importance of the role of deterministic biotic interactions. We showed that (1) phylogenetic community structure was weak overdispersed at Community I, clustered at Community II, overdispersed at Community III. It was regulated by the positive effects of spatial and climatic factors across plant groups; (2) phylogenetic diversity was the highest in Community II and was regulated by a combination of environmental factors; (3) niche theory based on a deterministic process was dominant in driving phylogenetic patterns. These results provide new ideas for the niche and trait conservation of different types of communities in Mt. Huangshan. Therefore, understanding the phylogenetic structure of an ecological community can help us understand the relative importance of the different processes that make up the community.

Supplementary Materials

The following supporting information can be downloaded at: https://www.mdpi.com/article/10.3390/f13010133/s1, Figure S1: Total diversity of trees and shrubs from three plots measured by species richness (176 species), family richness (54 families), and the percentage of species in each family. Else (11.93%) means an aggregation of plant families represented by a single specie. The Angiospermae are classified based on APG IV (The Angiosperm Phylogeny Group, 2016), and the Gymnospermae are classified according to Flora of China; Figure S2: Community phylogenetic tree of 176 species at Mt. Huangshan constructed using APG IV as a constraint tree combined with a supermatrix of sequence data from three DNAbarcode loci (ITS2+ rbcL+ matK) of the 176 species. The numbers on the nodes of the circular dendrogram represent the support rate; Figure S3: Community phylogenetic tree of 176 species at Mt. Huangshan constructed with a supermatrix of sequence data from three DNAbarcode loci (ITS2+ rbcL+ matK) of the 176 species. The numbers on the nodes of the circular dendrogram represent the support rate; Figure S4: Community phylogenetic tree was constructed based on APG IV; Figure S5. Partitioning of variationin nearest taxa index (NTI) and net relatedness index (NRI) of different life forms; Table S1: PCR and sequencing results for 176 species collected in three plots at Mt. Huangshan; Table S2: Sequence accession numbers and species information from GenBank; Table S3: Spatial, climatic and topographic variables, which were selected by the forward selection procedure in the RDA, affected nerest taxon index (NTI) of communities for total, trees and shrubs at three different communities. PCNMs (principal coordinates of neighbor matrices) represents spatial predictors; Bio11 (Mean Temperature of Coldest Quarter), Bio9 (Mean Temperature of Driest Quarter); topographic factors include elevation, aspect, slope, and convexity. Table S4 Description of 19 bioclimatic variables.

Author Contributions

Conceptualization, T.L., N.W., Y.L. and Y.F. (Yanming Fang); data curation, R.Z. and Y.L.; formal analysis, N.W., S.C. and H.D.; funding acquisition, S.C. and Y.F. (Yanming Fang); investigation, N.W., L.X., R.Z. and Y.F. (Yueyao Feng); methodology, T.L., L.X., Y.F. (Yueyao Feng) and Y.F. (Yanming Fang); project administration, S.C. and H.D.; resources, R.Z. and Y.L.; Software, L.X.; Validation, R.Z.; writing—original draft, T.L.; writing—review and editing, L.X., Y.F. (Yueyao Feng) and Y.F. (Yanming Fang). All authors have read and agreed to the published version of the manuscript.

Funding

This work was supported by by Biodiversity Survey, and Observation and Assessment Programme of Ministry of Ecology and Environment of China (ZDGC2019-007-04); the China Postdoctoral Science Foundation (2020M681629); the Jiangsu Postdoctoral Research Funding Program (2021K038A).

Institutional Review Board Statement

Not applicable.

Informed Consent Statement

Not applicable.

Data Availability Statement

All data in this study are available in the Supplementary Materials.

Acknowledgments

We thank all reviewers who provided valuable comments for this paper. We are grateful to Wang Lu and Song Yanfeng for the identification of species. We also would like to thank Luo Yahuang, who had provided methods for analyzing data.

Conflicts of Interest

The authors declare no conflict of interest.

References

  1. Qian, H.; Hao, Z.; Zhang, J. Phylogenetic structure and phylogenetic diversity of angiosperm assemblages in forests along an elevational gradient in Changbaishan, China. J. Plant Ecol. 2014, 7, 154–165. [Google Scholar] [CrossRef] [Green Version]
  2. Zou, Y.; Sang, W.; Hausmann, A.; Axmacher, J.C. High phylogenetic diversity is preserved in species-poor high-elevation temperate moth assemblages. Sci. Rep. 2016, 6, 23045. [Google Scholar] [CrossRef] [PubMed] [Green Version]
  3. Cavender-Bares, J.; Kozak, K.H.; Fine, P.; Kembel, S. The merging of community ecology and phylogenetic biology. Ecol. Lett. 2009, 12, 693–715. [Google Scholar] [CrossRef]
  4. Tilman, D. Niche tradeoffs, neutrality, and community structure: A stochastic theory of resource competition, invasion, and community assembly. Proc. Natl. Acad. Sci. USA 2004, 101, 10854–10861. [Google Scholar] [CrossRef] [PubMed] [Green Version]
  5. Li, M.Y.; Huang, W.Q.; Liu, M. Construction of forest biodiversity monitoring network based on continuous forest inven-tory system: A case study in Hunan Province. For. Resour. Manag. 2012, 0, 51–58. [Google Scholar]
  6. Chun, J.-H.; Lee, C.-B. Diversity patterns and phylogenetic structure of vascular plants along elevational gradients in a mountain ecosystem, South Korea. J. Mt. Sci. 2018, 15, 280–295. [Google Scholar] [CrossRef]
  7. Hubbell, S.P. The Unified Neutral Theory of Biodiversity and Biogeography; Princeton University Press: Princeton, NJ, USA, 2001. [Google Scholar]
  8. Zheng, Y.; Dong, L.; Li, Z.; Zhang, J.; Li, Z.; Miao, B.; Jia, C.; Liang, C.; Wang, L.; Li, F.Y. Phylogenetic structure and formation mechanism of shrub communities in arid and semiarid areas of the Mongolian Plateau. Ecol. Evol. 2019, 9, 13320–13331. [Google Scholar] [CrossRef]
  9. Zu, K.; Luo, A.; Shrestha, N.; Liu, B.; Wang, Z.; Zhu, X. Altitudinal biodiversity patterns of seed plants along Gongga Mountain in the southeastern Qinghai–Tibetan Plateau. Ecol. Evol. 2019, 9, 9586–9596. [Google Scholar] [CrossRef] [PubMed] [Green Version]
  10. Niu, K.C.; Liu, Y.N.; Shen, Z.H.; He, F.; Fang, J. Community assembly: The relative importance of neutral theory and niche theory. Biodivers. Sci. 2009, 17, 579–593. [Google Scholar]
  11. Webb, C.O.; Ackerly, D.D.; McPeek, M.A.; Donoghue, M.J. Phylogenies and Community Ecology. Annu. Ecol. Syst. 2002, 33, 475–505. [Google Scholar] [CrossRef] [Green Version]
  12. Cao, K.; Rao, M.D.; Yu, J.Z.; Liu, X.; Chen, J. The phylogenetic signal of functional traits and their effects on community structure in an evergreen broad-leaved forest. Biodivers. Sci. 2013, 21, 564–571. [Google Scholar] [CrossRef]
  13. Lu, M.M.; Huang, X.C.; Ci, X.Q.; Yang, G.P.; Li, J. Phylogenetic community structure of subtropical forests along elevational gradients in Ailao Mountains of southwest China. Biodivers. Sci. 2014, 22, 438. [Google Scholar] [CrossRef]
  14. Bryant, J.A.; Lamanna, C.; Morlon, H.; Kerkhoff, A.J.; Enquist, B.; Green, J.L. Microbes on mountainsides: Contrasting elevational patterns of bacterial and plant diversity. Proc. Natl. Acad. Sci. USA 2008, 105, 11505–11511. [Google Scholar] [CrossRef] [PubMed] [Green Version]
  15. Graham, C.H.; Parra, J.L.; Rahbek, C.; McGuire, J.A. Phylogenetic structure in tropical hummingbird communities. Proc. Natl. Acad. Sci. USA 2009, 106, 19673–19678. [Google Scholar] [CrossRef] [Green Version]
  16. Yakimov, B.N.; Gerasimova, A.S.; Zhang, S.; Ma, K.; Zhang, Y. Phylogenetic α- and β-diversity elevational gradients reveal consistent patterns of temperate forest community structure. Acta Oecol. 2020, 109, 103657. [Google Scholar] [CrossRef]
  17. Faith, D.P. Phylogenetic Diversity and Conservation Evaluation: Perspectives on Multiple Values, Indices, and Scales of Application. In Phylogenetic Diversit: Applications and Challenges in Biodiversity Science; Scherson, R., Faith, D., Eds.; Springer: Cham, Switzerland; Berlin, Germany, 2018; pp. 1–26. [Google Scholar] [CrossRef]
  18. FitzJohn, R.G.; Pennell, M.W.; Zanne, A.E.; Stevens, P.F.; Tank, D.C.; Cornwell, W.K. How much of the world is woody? J. Ecol. 2014, 102, 1266–1272. [Google Scholar] [CrossRef]
  19. Feng, G.; Mi, X.C.; Bøcher, P.K.; Mao, L.F.; Sandel, B.; Cao, M.; Ye, W.H.; Hao, Z.Q.; Gong, H.D.; Zhang, Y.T.; et al. Relative roles of local disturbance, current climate and paleoclimate in determining phylogenetic and functional diversity in Chinese forests. Biogeosciences 2014, 11, 1361–1370. [Google Scholar] [CrossRef] [Green Version]
  20. Liu, M.; Che, Y.; Jiao, J.; Li, L.; Jiang, X. Exploring the community phylogenetic structure along the slope aspect of subalpine meadows in the eastern Qinghai-Tibetan Plateau, China. Ecol. Evol. 2019, 9, 5270–5280. [Google Scholar] [CrossRef] [PubMed]
  21. González-Caro, S.; Umaña, M.N.; Alvarez-Davila, E.; Stevenson, P.R.; Swenson, N.G. Phylogenetic alpha and beta diversity in tropical tree assemblages along regional-scale environmental gradients in northwest South America. J. Plant Ecol. 2014, 7, 145–153. [Google Scholar] [CrossRef]
  22. Kim, H.; Chun, J.; Lee, C. Plant Diversity and Phylogenetic Community Structure along Environmental Gradients in a Temperate Forest, South Korea. J. Anim. Plant Sci. 2020, 30, 958. [Google Scholar] [CrossRef] [Green Version]
  23. David, R.; Bomhard, B. Mapping Direct Human Influence on the World’s Mountain Areas. Mt. Res. Dev. 2012, 32, 197–202. [Google Scholar] [CrossRef]
  24. Culmsee, H.; Leuschner, C. Consistent patterns of elevational change in tree taxonomic and phylogenetic diversity across Malesian mountain forests. J. Biogeogr. 2013, 40, 1997–2010. [Google Scholar] [CrossRef]
  25. Letts, M.G.; Mulligan, M.; Rincon-Romero, M.E.; Bruijnzeelet, L.A. Environmental Controls on Photosynthetic Rates of Lower Montane Cloud Forest Vegetation in South-Western Colombia; Cambridge University Press: Cambridge, UK, 2010; pp. 465–478. [Google Scholar]
  26. Vamosi, S.M.; Queenborough, S.A. Breeding systems and phylogenetic diversity of seed plants along a large-scale elevational gradient. J. Biogeogr. 2010, 37, 465–476. [Google Scholar] [CrossRef]
  27. Rahbek, C. The role of spatial scale and the perception of large-scale species-richness patterns. Ecol. Lett. 2004, 8, 224–239. [Google Scholar] [CrossRef]
  28. Ding, H.; Fang, Y.; Yang, X.; Yuan, F.; He, L.; Yao, J.; Wu, J.; Chi, B.; Li, Y.; Chen, S.; et al. Community characteristics of a subtropical evergreen broad-leaved forest in Huangshan, Anhui Province, East China. Biodivers. Sci. 2016, 24, 875–887. [Google Scholar] [CrossRef]
  29. Yuan, J.F.; Hu, R.Y.; Shen, J.H.; Zhang, L.; Zhang, X.Y.; Yu, M.J. Comparison of species composition and diversity of four successional forest communities in Zhejiang Province, East China. Bull. Bot. Res. 2011, 31, 61–66. [Google Scholar] [CrossRef]
  30. Li, D.; Du, Y.; Xu, W.; Peng, D.; Primack, R.; Chen, G.; Mao, L.F.; Ma, K. Phylogenetic conservatism of fruit development time in Chinese angiosperms and the phylogenetic and climatic correlates. Glob. Ecol. Conserv. 2021, 27, e01543. [Google Scholar] [CrossRef]
  31. Ma, K.P. Large scale permanent plots: Important platform for long term research on biodiversity in forest ecosystem. Chin. J. Plant Ecol. 2008, 32, 237. [Google Scholar]
  32. Forest, F.; Grenyer, R.; Rouget, M.; Davies, T.J.; Cowling, R.M.; Faith, D.P.; Balmford, A.; Manning, J.C.; Procheş, Ş.; Van Der Bank, M.; et al. Preserving the evolutionary potential of floras in biodiversity hotspots. Nature 2007, 445, 757–760. [Google Scholar] [CrossRef]
  33. Sargent, R.D.; Ackerly, D. Plant–pollinator interactions and the assembly of plant communities. Trends Ecol. Evol. 2008, 23, 123–130. [Google Scholar] [CrossRef] [PubMed]
  34. APG-Angiosperm Phylogeny Group. An update of the Angiosperm Phylogeny Group classification for the orders and fam-ilies of flowering plants: APG IV. Bot. J. Linn. Soc. 2016, 181, 1–20. [Google Scholar] [CrossRef] [Green Version]
  35. Pashirzad, M.; Ejtehadi, H.; Vaezi, J.; Shefferson, R.P. Spatial scale-dependent phylogenetic signal in species distributions along geographic and elevation gradients in a mountainous rangeland. Ecol. Evol. 2018, 8, 10364–10373. [Google Scholar] [CrossRef] [PubMed]
  36. Joly, S.; Davies, T.J.; Archambault, A.; Bruneau, A.; Derry, A.; Kembel, S.W.; Peres-Neto, P.; Vamosi, J.; Wheeler, T.A. Ecology in the age of DNA barcoding: The resource, the promise and the challenges ahead. Mol. Ecol. Resour. 2013, 14, 221–232. [Google Scholar] [CrossRef]
  37. Kress, W.J.; Erickson, D.L.; Jones, F.A.; Swenson, N.G.; Perez, R.; Sanjur, O.; Bermingham, E. Plant DNA barcodes and a community phylogeny of a tropical forest dynamics plot in Panama. Proc. Natl. Acad. Sci. USA 2009, 106, 18621–18626. [Google Scholar] [CrossRef] [PubMed] [Green Version]
  38. Pei, N.C.; Chen, B.F. DNA barcoding of life: A classification of uses according to function and scale after ten years of development. Biodivers. Sci. 2013, 21, 616–627. [Google Scholar] [CrossRef]
  39. Stamatakis, A. RAxML-VI-HPC: Maximum likelihood-based phylogenetic analyses with thousands of taxa and mixed models. Bioinformatics 2006, 22, 2688–2690. [Google Scholar] [CrossRef] [PubMed]
  40. Swenson, N.G.; Enquist, B.; Thompson, J.; Zimmerman, J.K. The Influence of Spatial and Size Scale on Phylogenetic Relatedness in Tropical Forest Communities. Ecology 2007, 88, 1770–1780. [Google Scholar] [CrossRef] [PubMed] [Green Version]
  41. Kraft, N.J.B.; Cornwell, W.; Webb, C.; Ackerly, D. Trait Evolution, Community Assembly, and the Phylogenetic Structure of Ecological Communities. Am. Nat. 2007, 170, 271–283. [Google Scholar] [CrossRef]
  42. Chai, Y.F.; Yue, M. Research advances in plant community assembly mechanisms. Acta Ecol. Sin. 2016, 36, 4557–4572. [Google Scholar] [CrossRef]
  43. Gotelli, N.J.; Entsminger, G.L. Swap algorithms in null model analysis. Ecology 2003, 84, 532–535. [Google Scholar] [CrossRef]
  44. Luo, Y.H. Community Assembly and Turnover Mechanisms Subalpine Forests along Elevational Gradient in Yulong Mountains in Northwest Yunnan, China; Yunnan University: Kunming, China, 2016. [Google Scholar]
  45. Dray, S.; Legendre, P.; Neto, P.P. Spatial modelling: A comprehensive framework for principal coordinate analysis of neighbour matrices (PCNM). Ecol. Model. 2006, 196, 483–493. [Google Scholar] [CrossRef]
  46. Legendre, P.; Mi, X.; Ren, H.; Ma, K.; Yu, M.; Sun, I.-F.; He, F. Partitioning beta diversity in a subtropical broad-leaved forest of China. Ecology 2009, 90, 663–674. [Google Scholar] [CrossRef] [PubMed] [Green Version]
  47. Kembel, S.W.; Cowan, P.D.; Helmus, M.R.; Cornwell, W.K.; Morlon, H.; Ackerly, D.D.; Blomberg, S.P.; Webb, C.O. Picante: R tools for integrating phylogenies and ecology. Bioinformatics 2010, 26, 1463–1464. [Google Scholar] [CrossRef] [PubMed] [Green Version]
  48. Lichstein, J.W. Multiple regression on distance matrices: A multivariate spatial analysis tool. Plant Ecol. 2007, 188, 117–131. [Google Scholar] [CrossRef]
  49. Potter, K.M. From Genes to Ecosystems: Measuring Evolutionary Diversity and Community Structure with Forest Inventory and Analysis (FIA) Data. USDA For. Serv. Proc. 2009, 56, 49–64. Available online: https://www.researchgate.net/publication/228509453 (accessed on 10 January 2009).
  50. Mayfield, M.M.; Levine, J.M. Opposing effects of competitive exclusion on the phylogenetic structure of communities. Ecol. Lett. 2010, 13, 1085–1093. [Google Scholar] [CrossRef] [PubMed]
  51. Li, X.-H.; Zhu, X.-X.; Niu, Y.; Sun, H. Phylogenetic clustering and overdispersion for alpine plants along elevational gradient in the Hengduan Mountains Region, southwest China. J. Syst. Evol. 2014, 52, 280–288. [Google Scholar] [CrossRef]
  52. Gastauer, M.; Saporetti-Junior, A.W.; Valladares, F.; Meira-Neto, J.A.A. Phylogenetic community structure reveals differences in plant community assembly of an oligotrophic white-sand ecosystem from the Brazilian Atlantic Forest. Acta Bot. Bras. 2017, 31, 531–538. [Google Scholar] [CrossRef] [Green Version]
  53. Zhou, Y.; Chen, S.; Hu, G.; Mwachala, G.; Yan, X.; Wang, Q. Species richness and phylogenetic diversity of seed plants across vegetation zones of Mount Kenya, East Africa. Ecol. Evol. 2018, 8, 8930–8939. [Google Scholar] [CrossRef]
  54. Huang, J.X.; Ye, W.H.; Lian, J.Y.; Cao, H.L. Detecting the influence of phylogenetic structure, environmental factors and PCNM factors in population dynamics in a subtropical forest community in Guangdong, China. Chin. Sci. Bull. 2014, 59, 3471–3478. [Google Scholar] [CrossRef]
  55. Yuan, Z.L.; Chen, Y.; Wei, B.L.; Zhang, B.Q.; Wang, D.Y.; Ye, Y.Z. Species habitat correlation analysis in temper-ate-subtropical ecological transition zone. Acta Ecol. Sin. 2013, 33, 7819–7826. [Google Scholar]
  56. Xiao, Y.; Yang, L.; Nie, X.; Li, C.; Xiong, F.; Wang, L.; Zhou, G. Examining differences in phylogenetic composition enhances understanding of the phylogenetic structure of the shrub community in the northeastern Qinghai-Tibetan Plateau. Ecol. Evol. 2020, 10, 6723–6731. [Google Scholar] [CrossRef]
  57. Arponen, A. Prioritizing species for conservation planning. Biodivers. Conserv. 2012, 21, 875–893. [Google Scholar] [CrossRef]
  58. Yang, J.; Swenson, N.G.; Zhang, G.; Ci, X.; Cao, M.; Sha, L.; Li, J.; Slik, J.W.F.; Lin, L. Local-scale Partitioning of Functional and Phylogenetic Beta Diversity in a Tropical Tree Assemblage. Sci. Rep. 2015, 5, 12731. [Google Scholar] [CrossRef]
  59. Wei, W.; Luo, Z.R.; Zhou, R.F.; Wang, W.; Luo, Z.R.; Zhou, R.F. Habitat associations of woody plant species in Baishanzu subtropical broad-leaved evergreen forest. Biodivers. Sci. 2011, 19, 134–142. [Google Scholar] [CrossRef]
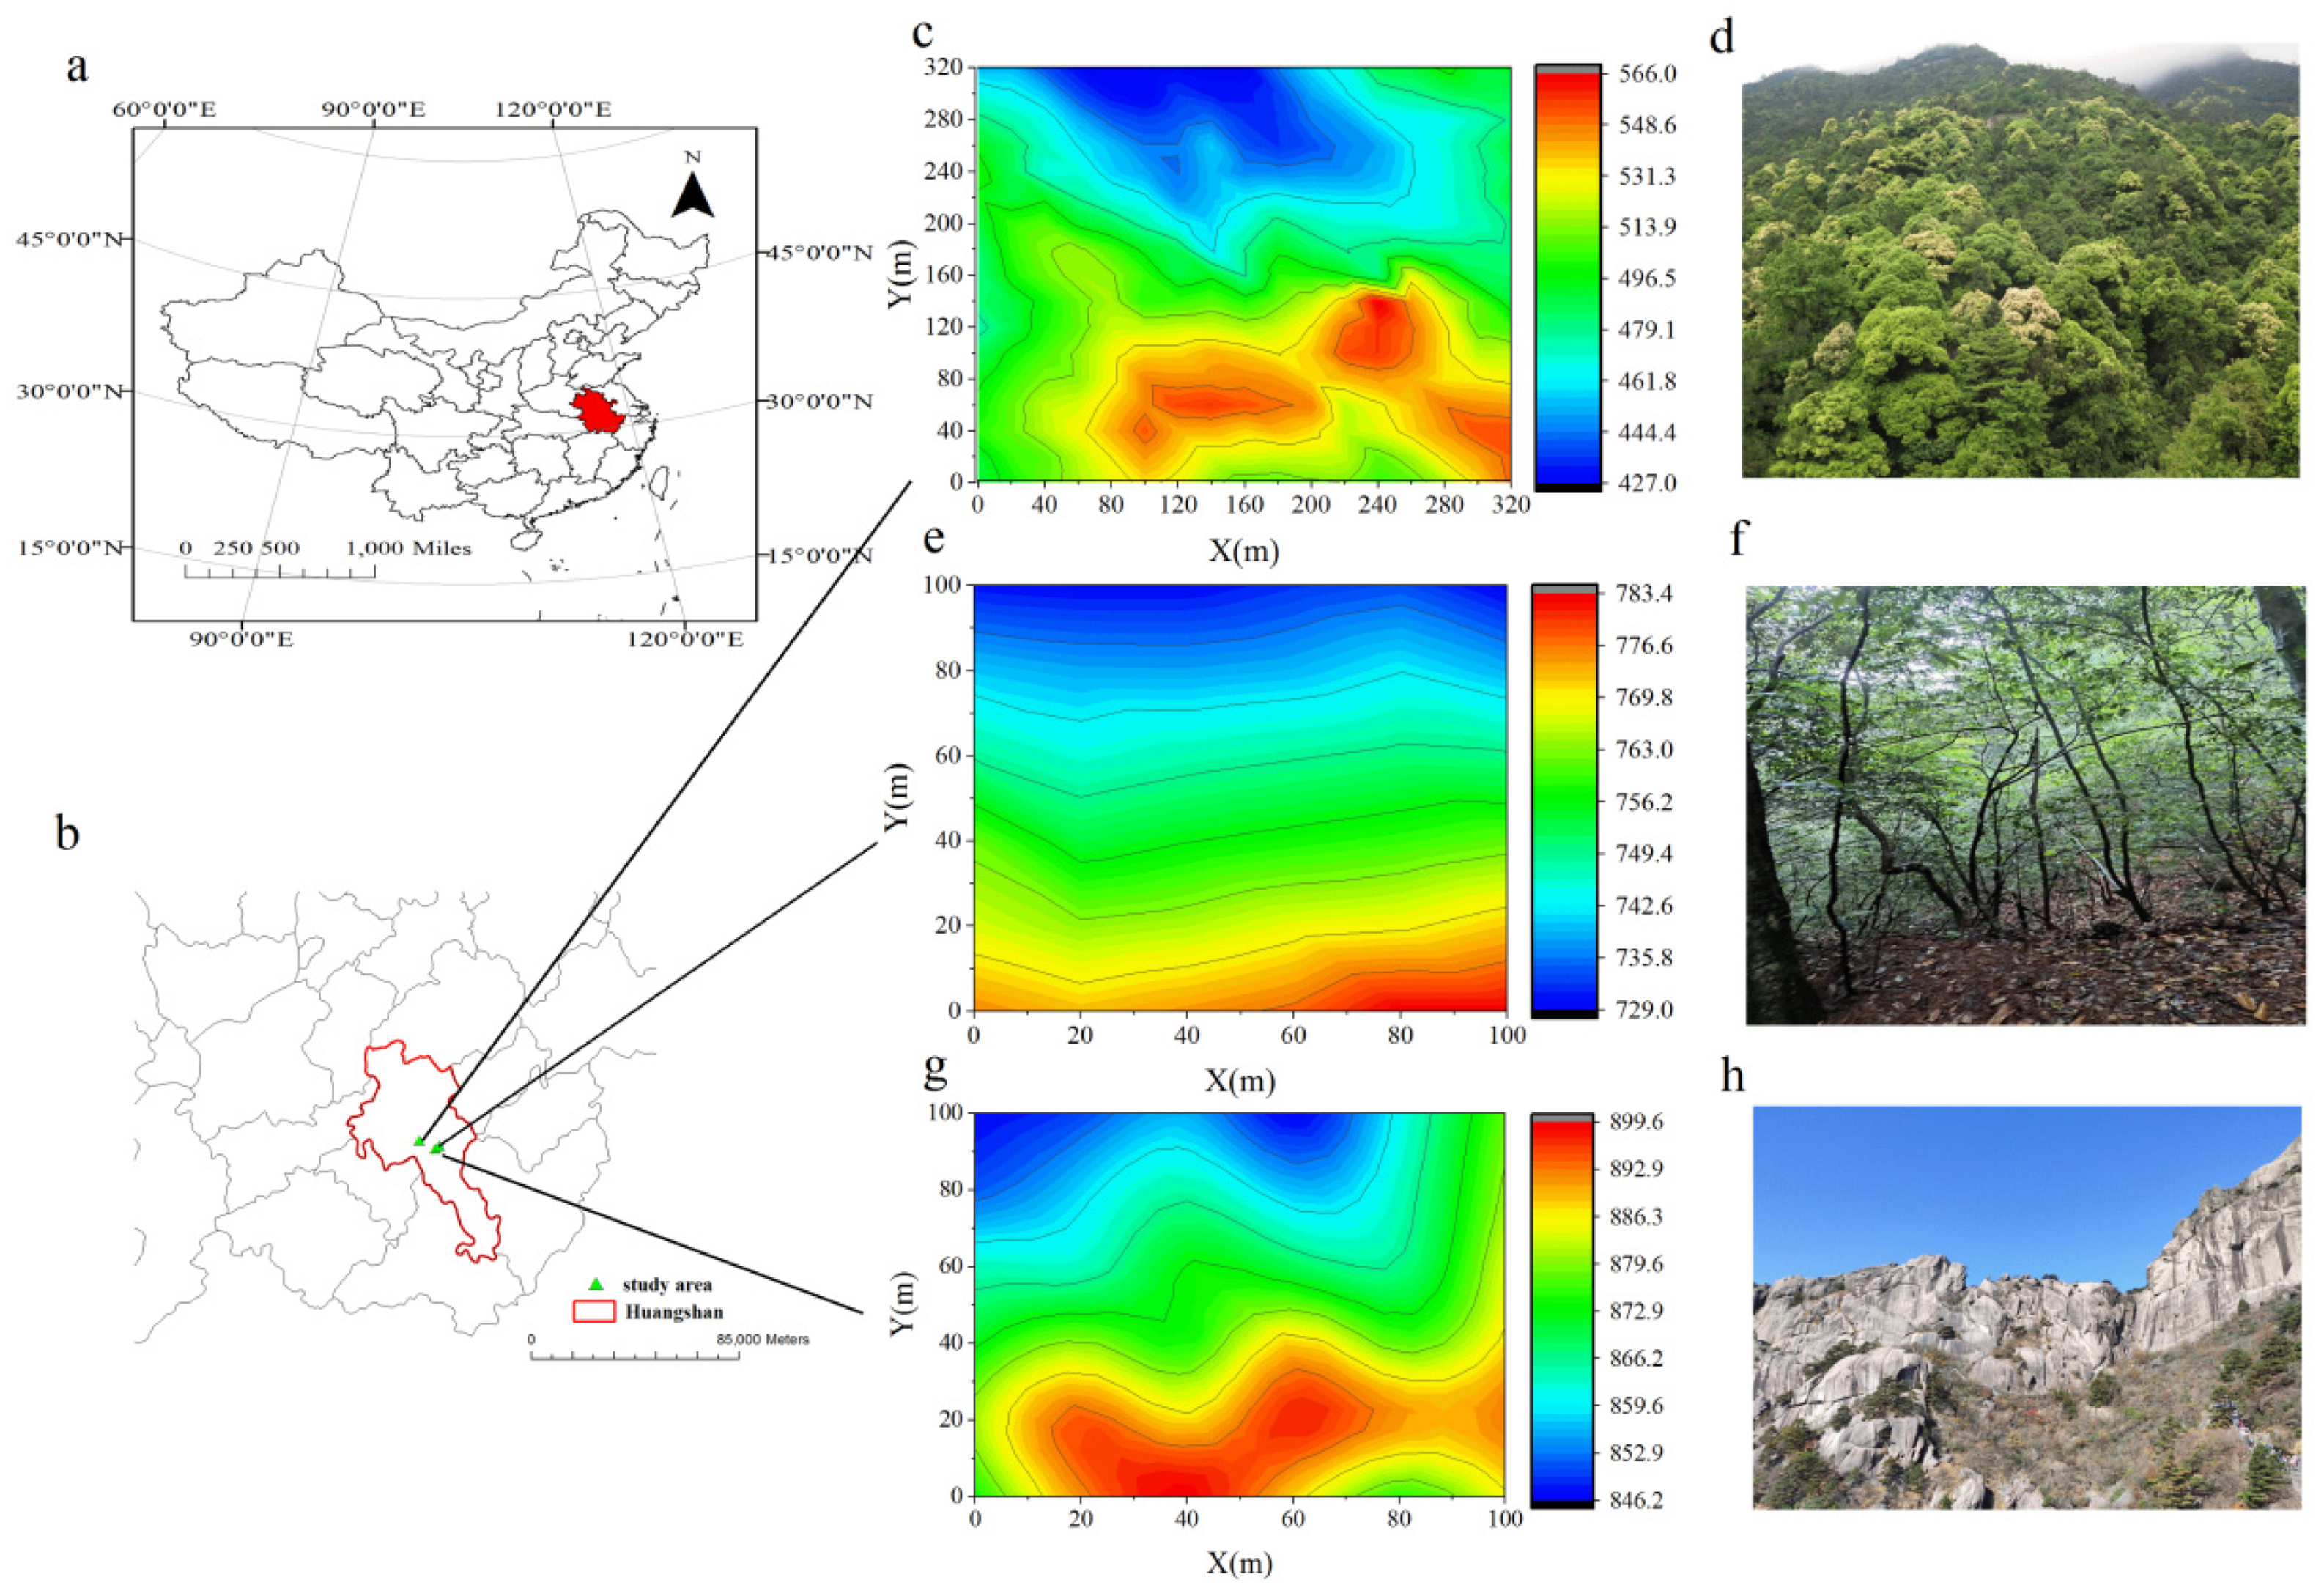
Figure 1. Location and distribution of three surveyed communities, at Mt. Huangshan (b), Anhui Province (a), East China. (c) Contour lines(427–566 m above sea level) and vegetation zone (d) of plot I. (e) Contour lines(729–783 m above sea level) and vegetation zone (f) of plot II. (g) Contour lines(846–899 m above sea level) and vegetation zone (h) of plot III.
Forests 13 00133 g001
Figure 2. Variation of the nearest taxa index (NTI) and net relatedness index (NRI) in three vegetation communities for total plants, trees, and shrubs at Mt. Huangshan.
Forests 13 00133 g002
Figure 3. Relationships between phylogenetic α-diversity and species diversity and elevation. (a) Faith’s phylogenetic α-diversity (PD) and phylogeneticα-diversity based on the null model (S.E.S.PD) vs. species richness (SR) for totals; (b) PD and S.E.S.PD vs. elevation for totals; (c) PD and S.E.S.PD vs. SR for trees; (d) PD and S.E.S.PD vs. elevation for trees; (e) PD and S.E.S.PD vs. SR for shrubs; (f) PD and S.E.S.PD vs. elevation for shrubs.
Forests 13 00133 g003
Figure 4. The patterns of phylogenetic βdiversity were assessed by computing the mean pairwise phylogenetic distance (D’pw) and the nearest neighbor distance (D’nn) for total plants (a), trees (c), and shrubs (e). The change in standardized mean pairwise phylogenetic distance (S.E.S.D’pw) and the nearest neighbor distance (S.E.S.D’nn) of phylogenetic β-diversity for total plants (b), trees (d), and shrubs (f).
Forests 13 00133 g004
Table 1. Statistical results of ratchet support values for all nodes of each phylogenetic tree constructed with DNA sequence data.
MethodsSupport Values (%)
Strong Ratchet (≥85%)Moderate Ratchet (>75%–85%)Weak Ratchet (>50%–75%)Weak Ratchet (<50%)
APGIV ----
Barcode tree without constraint59.88(110)13.77(23)15.57(26)10.78(18)
Barcode tree with constraint78.23(134)4.7(10)11.76(20)5.29(9)
Table 2. Spatial, climatic, and topographic variables, which were selected by the forward selection procedure in the RDA, affected net relatedness index (NRI) of communities for total, trees, and shrubs at three different communities. PCNMs(principal coordinates of neighbor matrices) represents spatial predictors; Bio1(annual mean temperature), Bio10(mean temperature of warmest quarter), Bio14(Precipitation of Driest Month), Bio15(precipitation seasonality); topographic factors include elevation, aspect, slope, and convexity.
FactorGroupVariablesAdjR2CumFp
SpaceTotalPCNM10.2181.560.001
PCNM30.226.210.012
PCNM300.245.250.024
PCNM280.254.290.034
PCNM160.264.240.038
TreesPCNM150.026.830.0071
PCNM290.035.390.0189
PCNM40.055.010.0261
PCNM270.064.110.0423
PCNM130.064.020.0413
ShrubsPCNM30.36178.870.001
PCNM10.4866.370.001
PCNM40.4910.160.004
PCNM110.508.020.013
PCNM80.518.070.006
PCNM50.525.960.017
ClimateTotalBio 150.2178.590.0001
Bio 100.2622.690.0001
TreesBio 140.027.310.0077
ShrubsBio 10.49303.690.0001
TopographyTotalElevation0.1763.100.0004
Aspect0.2011.190.0008
TreesElevation0.014.180.043
ShrubsAspect0.1136.480.0004
Elevation0.127.430.0078
Table 3. Variation in phylogenetic β-diversity was analyzed in relation to spatial, climatic, and topographic factors for total plants, trees, and shrubs using the multiple regression on distance matrix (MRM) test.
Total PlantsTree PlantsShrub Plants
R2pR2pR2p
D’pwSpace0.3790.0010.2910.0010.3190.001
Topography0.0940.0010.1750.0010.0560.001
Climate0.5490.0010.2500.0010.5360.001
Space + Topography + Climate0.6290.0010.3110.0010.6240.001
D’nnSpace0.4530.0010.4180.0010.4130.001
Topography0.2040.0010.2750.0010.1490.001
Climate0.6470.0010.4660.0010.6500.001
Space + Topography + Climate0.6720.0010.4900.0010.6770.001
Publisher’s Note: MDPI stays neutral with regard to jurisdictional claims in published maps and institutional affiliations.