Article

Canopy Solar-Induced Chlorophyll Fluorescence and Its Link to Transpiration in a Temperate Evergreen Needleleaf Forest during the Fall Transition

1
College of Agronomy, Shenyang Agricultural University, Shenyang 110161, China
2
Institute of Desertification Studies, Chinese Academy of Forestry, Beijing 100091, China
*
Author to whom correspondence should be addressed.
Forests 2022, 13(1), 74; https://doi.org/10.3390/f13010074
Submission received: 27 November 2021 / Revised: 27 December 2021 / Accepted: 30 December 2021 / Published: 6 January 2022
(This article belongs to the Section Forest Ecophysiology and Biology)

Abstract

:
Northern hemisphere evergreen needleleaf forest (ENF) contributes a significant fraction of global water exchange but regional transpiration (T) observation in ENF ecosystems is still challenging. Traditional remote sensing techniques and terrestrial biosphere models reproduce the transpiration seasonality with difficulty, and with large uncertainties. Solar-induced chlorophyll fluorescence (SIF) emission from vegetation correlates to photosynthesis at multiple spatial and temporal scales. However, how SIF links to transpiration of evergreen forest during seasonal transition is unclear. Here, we explored the relationship between canopy SIF and T retrieved from ground observation towers in ENF. We also examined the role of meteorological and soil factors on the relationship between SIF and T. A slow decrease of SIF and T with a fast reduction in photosynthetically active radiation (PAR), air temperature, vapor pressure deficit (VPD), soil temperature and soil water content (SWC) were found in the ENF during the fall transition. The correlation between SIF and T at hourly and daily scales varied significantly among different months (Pearson correlation coefficient = 0.29–0.68, p < 0.01). SIF and T were significantly linearly correlated at hourly (R2 = 0.53, p < 0.001) and daily (R2 = 0.67, p < 0.001) timescales in the October. Air temperature and PAR were the major moderating factors for the relationship between SIF and T in the fall transition. Soil water content (SWC) influenced the SIF-T relationship at an hourly scale. Soil temperature and VPD’s effect on the SIF-T relationship was evident at a daily scale. This study can help extend the possibility of constraining ecosystem T by SIF at an unprecedented spatiotemporal resolution during season transitions.

1. Introduction

Evergreen needleleaf forest (ENF) accounts for one third of the world’s forest [1], and is an important and highly dynamic component of the terrestrial ecosystem water cycle [2,3]. However, ENF transpiration (T) estimation is still imprecise with the currently used empirical/semi-empirical models (e.g., Penman Monteith (PM) equation) and ecohydrological remote sensing models which rely on meteorological factors and remote-sensing vegetation parameters (e.g., NDVI and LAI) [4,5]. This is because ENF canopy structure and green needle leaf area show no significant change during season transitions [6], but photosynthetic activity and water exchange undergo seasonal shifts in evergreen ecosystems [7,8]. Previous studies showed that land surface models (LSM) underestimated daily evapotranspiration (ET) by up to 20% in the fall and by approximately 25% across the entire season for evergreen needleleaf forest [9].
Solar-induced chlorophyll fluorescence (SIF) is a small light fraction emitted during plant photosynthetic reactions and can signal photosynthetic activity changes across temporal and spatial scales [10,11]. SIF has been applied to constraining ecosystem transpiration in models based on the assumption of carbon and water cycles coupling at weekly and monthly time scales [12,13,14]. However, stomatal conductance and SIF respond to environmental changes at an instantaneous time scale. Therefore, mean daily or weekly SIF and T provide little information about how environmental conditions mediate the dynamic relationship between SIF and T [10,15]. Analysis of the SIF-T relationships in grassland, broadleaf forest and wheat has shed light on the effects of environmental condition changes on water fluxes and has helped quantify water balance at hourly and daily scales [16,17,18]. To improve estimates of T, SIF and its link to T at higher temporal resolution requires refining in ENF. The impacts of meteorological and soil factors on the SIF-T relationship in the seasonal transition of evergreen forest ecosystems require further investigation [19].
Using canopy SIF observations and T separated by synchronous half-hour eddy flux ET of ENF, we (i) investigated the dynamics of T, SIF, meteorological and soil factors in the fall transition, (ii) quantified the SIF and T correlation at hourly and daily scales during the fall transition, and (iii) investigated the effects of meteorological and soil factors on the canopy SIF-T relationship. Our results will extend the possibility of constraining ecosystem T by SIF during seasonal transitions and prompt more precise T estimations at an unprecedented spatiotemporal resolution.

2. Materials and Methods
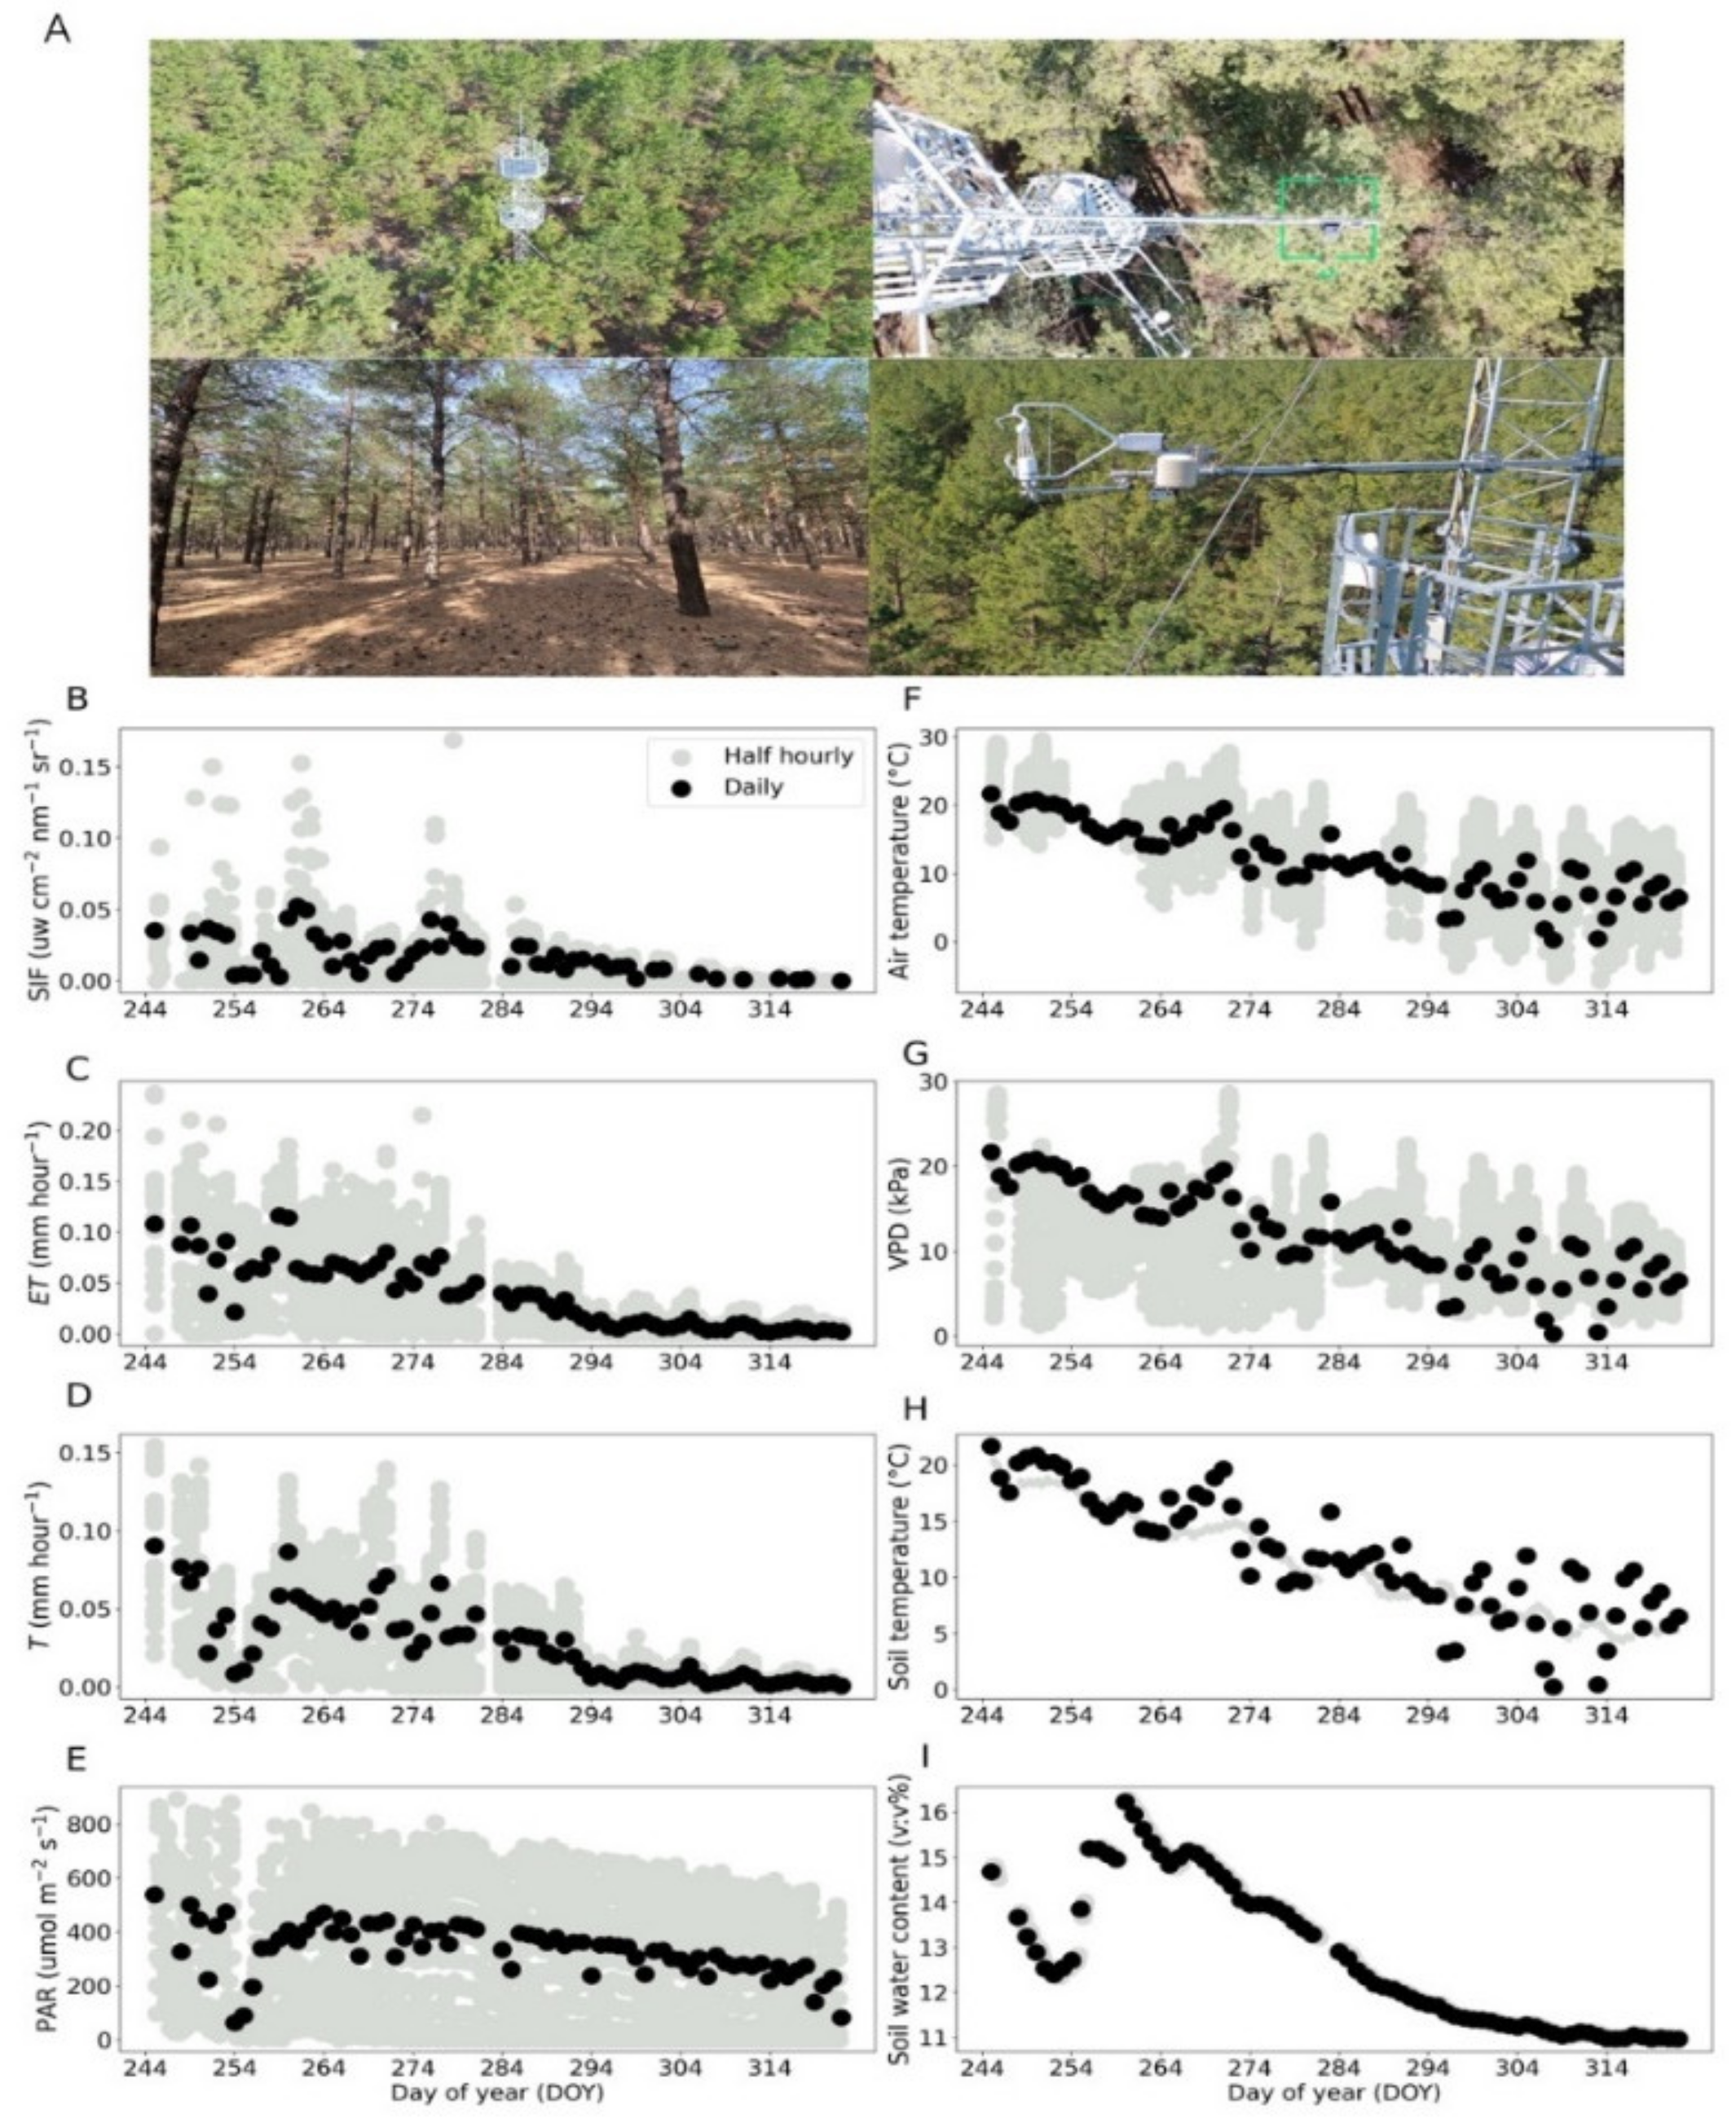
2.1. Study Location

This study was conducted in a Mongolian Scots pine (Pinus sylvestris var. mongolica) forest in Jianping county, Northeast China (41.97° N, 119.42° E, 496 m elevation) over the period from 1 September 2020 to 17 November 2020 (Figure 1A). The study site has a mid-temperate continental monsoon climate with annual mean temperature of 7.6 °C, annual precipitation of 450 mm and annual mean sunshine duration of 2765.5 h. The Mongolian Scots pine forest was planted in 1990. The mean diameter at breast height (DBH, 1.3 m) was 12.2 cm and the mean tree height was 12 m in 2020. The stem density of the Mongolian pine plantation was 1389 trees ha−1.

2.2. Tower Solar-Induced Chlorophyll Fluorescence Measurement

A named “AUTOSIF” system (Bergson Spectrum Science Limited; Beijing, China) was installed to retrieve canopy SIF. The core of the AUTOSIF tower system consisted of a thermally stabilized hyperspectral spectrometer (QE-Pro, Ocean Optics Inc.; Dunedin, FL, USA) maintained in a temperature-regulated enclosure which covered the 730–784 nm spectral range and had a spectral resolution of ~0.17 nm, spectral sampling interval of ~0.07 nm and signal-to-noise ratio (SNR) > 1000. Two optical fibers were connected to the spectrometer using a Y-shaped component with electronic shutters to take the measurements in sequence. A cosine corrector (CC3-3-UV-S, Ocean Optics, Inc.) was attached to the upper fiber to collect the downwelling solar irradiance. The upwelling radiance was collected using a bare fiber with a field of view (FOV) of 25° and view zenith angle of 25° to avoid the influence of the tower body. The fibers, produced by Ocean Optics, were mounted 5 m above the forest canopy, with 600 μm core diameter. Calibration of downwelling solar irradiance used an Ocean Insight light source (HL-3 plus, Ocean Optics, USA), and for upwelling radiance used a photometric integrating sphere optical spectrum analyzer (LightFluxColor LFC-illumia Plus2, Labsphere, North Sutton, NH, USA). SIF signals were extracted from calibrated downward measurements obtained from the QE Pro instrument by the spectral fitting methods (SFM) method [20,21], and was averaged across half-hourly intervals. The mean daily SIF was calculated as the average of half-hourly values within a day.

2.3. Fluxes, Meteorological and Soil Parameters Observation

Ecosystem-scale CO2, water vapor, energy fluxes and meteorological parameters were measured based on an EC flux tower. The 20 m tower has been in continuous operation since 2017 and is equipped with an open-path infrared gas analyzer (IRGA; LI-7500, Li-COR, Lincoln, NE, USA), three-dimensional sonic anemometer (CSAT 3, Campbell Scientific, Logan, UT, USA) and sensors measuring photosynthetically active radiation (PAR) (LI-190, LI-COR, Lincoln, NE, USA), air temperature and relative humidity (RR-10TH, RAINROOT, Beijing, China). In addition, soil temperature and soil water content (SWC) were measured continuously using soil moisture (EC5, METER, Pullman, WA, USA) and temperature sensors (RR10T; Rainroot, China) buried at 10 cm, 20 cm and 30 cm depth beneath the soil surface to the east, north, and south of the tower. The average soil temperature and SWC of the three depths were used for analysis. The observed values of fluxes, meteorology, SWC and soil temperature were averaged at half-hourly scale and daily scale for statistical analysis.

2.4. Water Flux Partitioning

The flux data were evaluated to determine an appropriate friction velocity threshold to remove periods of low turbulence, then the flux and meteorological data were gap-filled. For the flux and soil data, the percent data recovery after bad data removal and before gap-filling were 94% and 97%, respectively. Canopy gross primary production (GPP) was partitioned from net ecosystem exchange following the night time partitioning method of Reichstein et al. [22]. All the calculations were conducted using the R package, REddyProc [23].
Ecosystem transpiration (T) was separated from eddy covariance (EC) water flux data by the uWUE method [24]. The potential uWUE (uWUEp) and the apparent uWUE (uWUEa) were calculated for half-hourly data GPP⋅ VPD and ET. uWUEp was assumed to be constant throughout a year; T/ET was then estimated as the ratio of uWUEa and uWUEp [24]. The uWUE method is robust to systematic errors in GPP estimate, for example, the errors between night time and day time partitioning method to estimate GPP [24].

2.5. Statistical Analysis

Fluxes, meteorological and soil half-hourly and daily averaged values were synchronized with the SIF data between 6:00 A.M. and 6:30 P.M. The relationships between observed factors were analyzed by Pearson correlations, and linear and hyperbolic regression functions at the same temporal scale. The coefficient of determination (R2), RMSE and the slope of the regression were calculated.
To understand the main factors controlling the relationship between SIF and T, a least absolute shrinkage and selection operator (LASSO) regression analysis [25] was conducted with T as target variable, and observed meteorological and soil data (PAR, VPD, air temperature, SWC and soil temperature) and SIF as input variables. The LASSO regression model was fitted on the pooled data of hourly and daily scales separately. Each dataset was split into training and test samples. The training sample consisted of the first 85% dataset of each site, while the test sample consisted of the remaining 15%. All variables were normalized by the max-min method with the original data reflected to [0,1] and the data structure retained. Extreme outliers (values beyond ±3 standard deviations) in inputs and outputs were removed. The regularization parameter lambda in the LASSO regression was determined using a 10-fold cross-validation within the training set. The selected lambda was the largest value and the mean squared error (MSE) lay within one standard error of the minimum MSE [13].

3. Results

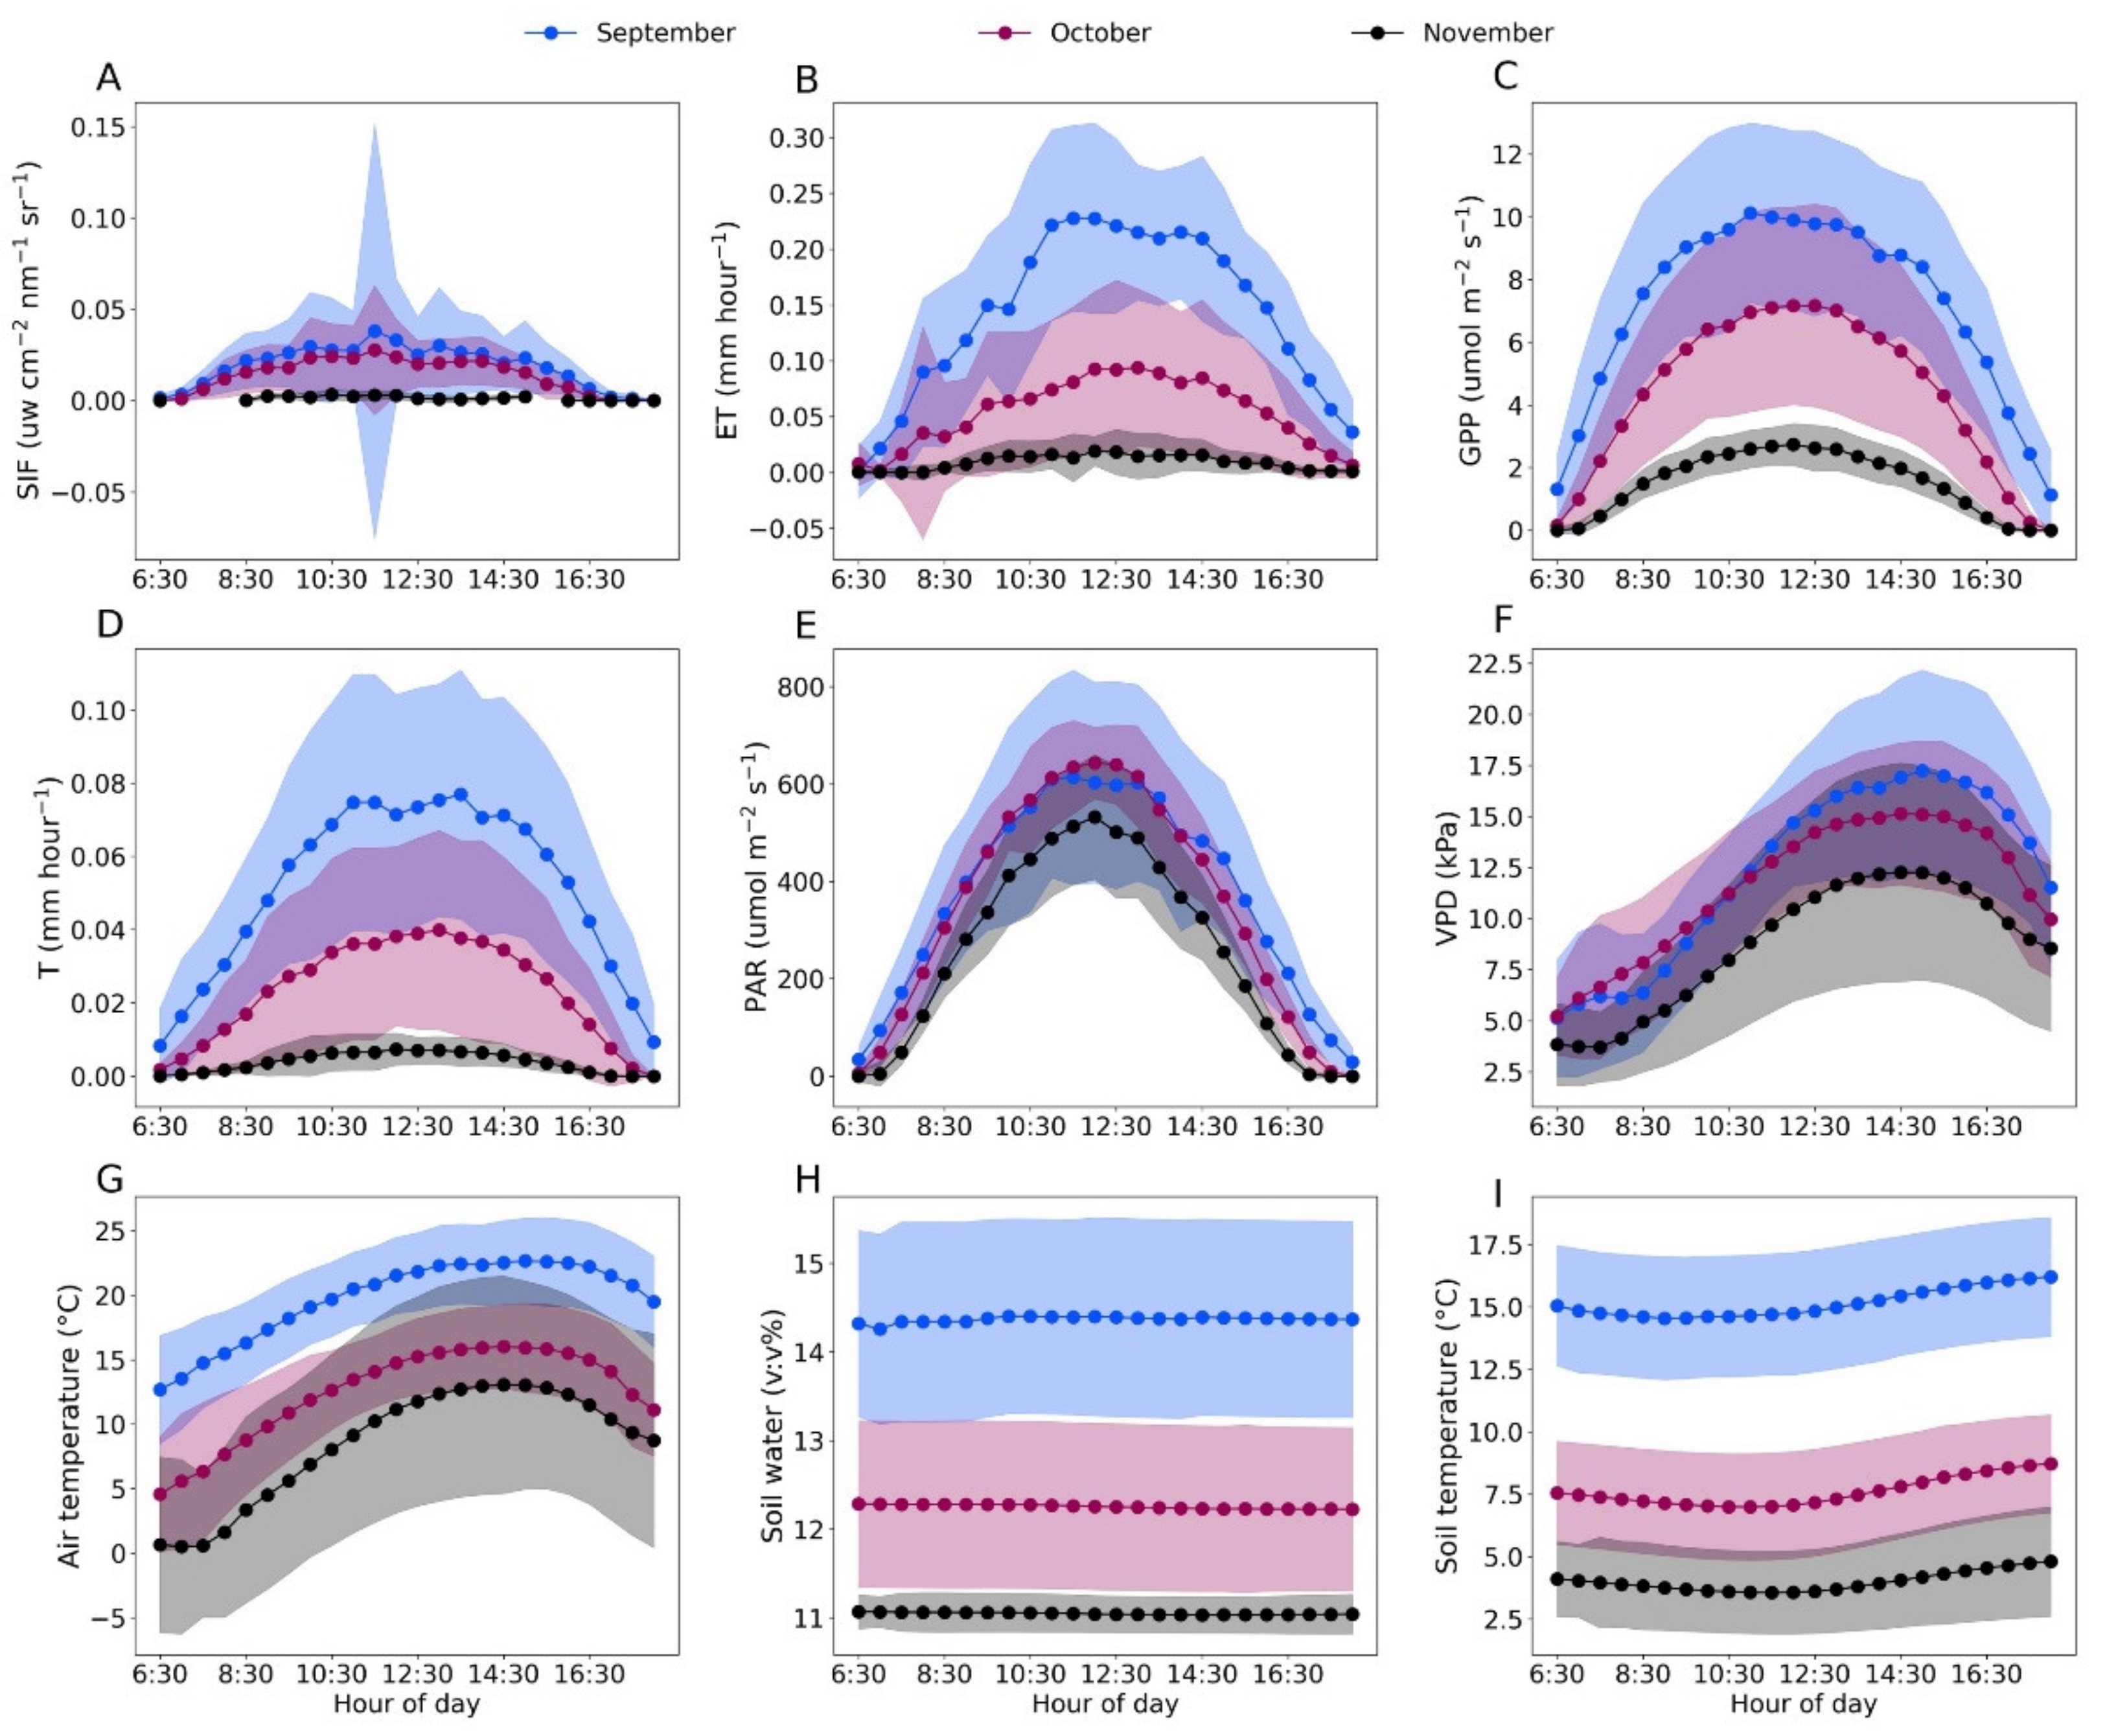
3.1. Dynamics of SIF, T, Meteorological and Soil Factors in Fall Transition

The ENF canopy SIF, ET and T showed conspicuous seasonal variations together (Figure 1B–I), which were due to the seasonal evolution of meteorological factors. SIF showed a nearly five-fold decrease during the fall transition (Figure 1B). We found a slow decrease of ET and T in fall (Figure 1C,D), in agreement with previous studies in ENF [24,26]. This indicates that ENF experience significant physiological shifts in the fall. During the same period, we observed a significant reduction in PAR, air temperature, VPD, soil temperature and SWC (Figure 1E–I). During the fall transition period, SIF showed changes closely varying with T and ET at daily scale. We also observed a significant decrease in SIF, ET, T and SWC from DOY 244 to 254, which could have been due to water transport blocking and stomatal closing caused by soil water reduction [27].
Averages of half-hourly data among different months were shown to highlight the dynamic nature of T, ET, SIF, GPP, meteorological and soil factors in the fall (Figure 2). We found that SIF changed with T, ET and GPP at hourly scale. Among all the meteorological and soil factors, SIF corresponded more closely to changes in air temperature, PAR and VPD than SWC and soil temperature in September and October. In September, SIF showed a spike at 11:30–12:00 AM compared with that in October and November (Figure 2E) and the solar radiation showed the highest standard errors in the same time period (Figure 2A), indicating the dependency of SIF on PAR at hourly scale. In November, SIF, T and ET did not show the dynamic changes observed for PAR, air temperature and VPD at hourly scale, indicating that the growth of Pinus Sylvestris var. Monglica entered the dormancy period in November.

3.2. Correlations between SIF and T at Hourly and Daily Timescales

Heatmaps for hourly and daily correlations of SIF and T, ET are shown in Figure 3. We found that SIF corresponded more closely to changes in T and ET at daily (Pearson correlation coefficient = 0.63, p < 0.01) compared to hourly (Pearson correlation coefficient = 0.53, p < 0.01) scales (Figure 3). The correlation between SIF and T varied significantly among different months (Pearson correlation coefficient = 0.29–0.68, p < 0.01; Figure 3). Both hourly and daily correlations were highest in October with a slight decrease in September and November (Figure 3). Previous studies have shown that the ENF canopy GPP yields a hyperbolic linear relationship with SIF in the fall transition [28,29]. In this study, as GPP and T correlated with carbon and water cycle coupling at multiple time scales, SIF and T were fitted by linear and hyperbolic regression. The results showed that SIF and T in the canopy were correlated at hourly and daily scales (Figure 4 and Figure 5). Compared to linear regression (hourly: p < 0.001, R2 = 0.37, RMSE = 3%; daily: p < 0.001, R2 = 0.39, RMSE = 2%), hyperbolic regression yielded a slightly lower R2 and similar RMSE (p < 0.05, R2 = 0.35, RMSE = 3%) at hourly scale and a similar R2 and RMSE (p < 0.05, R2 = 0.37, RMSE = 2%) at daily scale in the fall. SIF and T were significantly linearly correlated at hourly (R2 = 0.53, p < 0.001) and daily (R2 = 0.67, p < 0.001) timescales in the October.

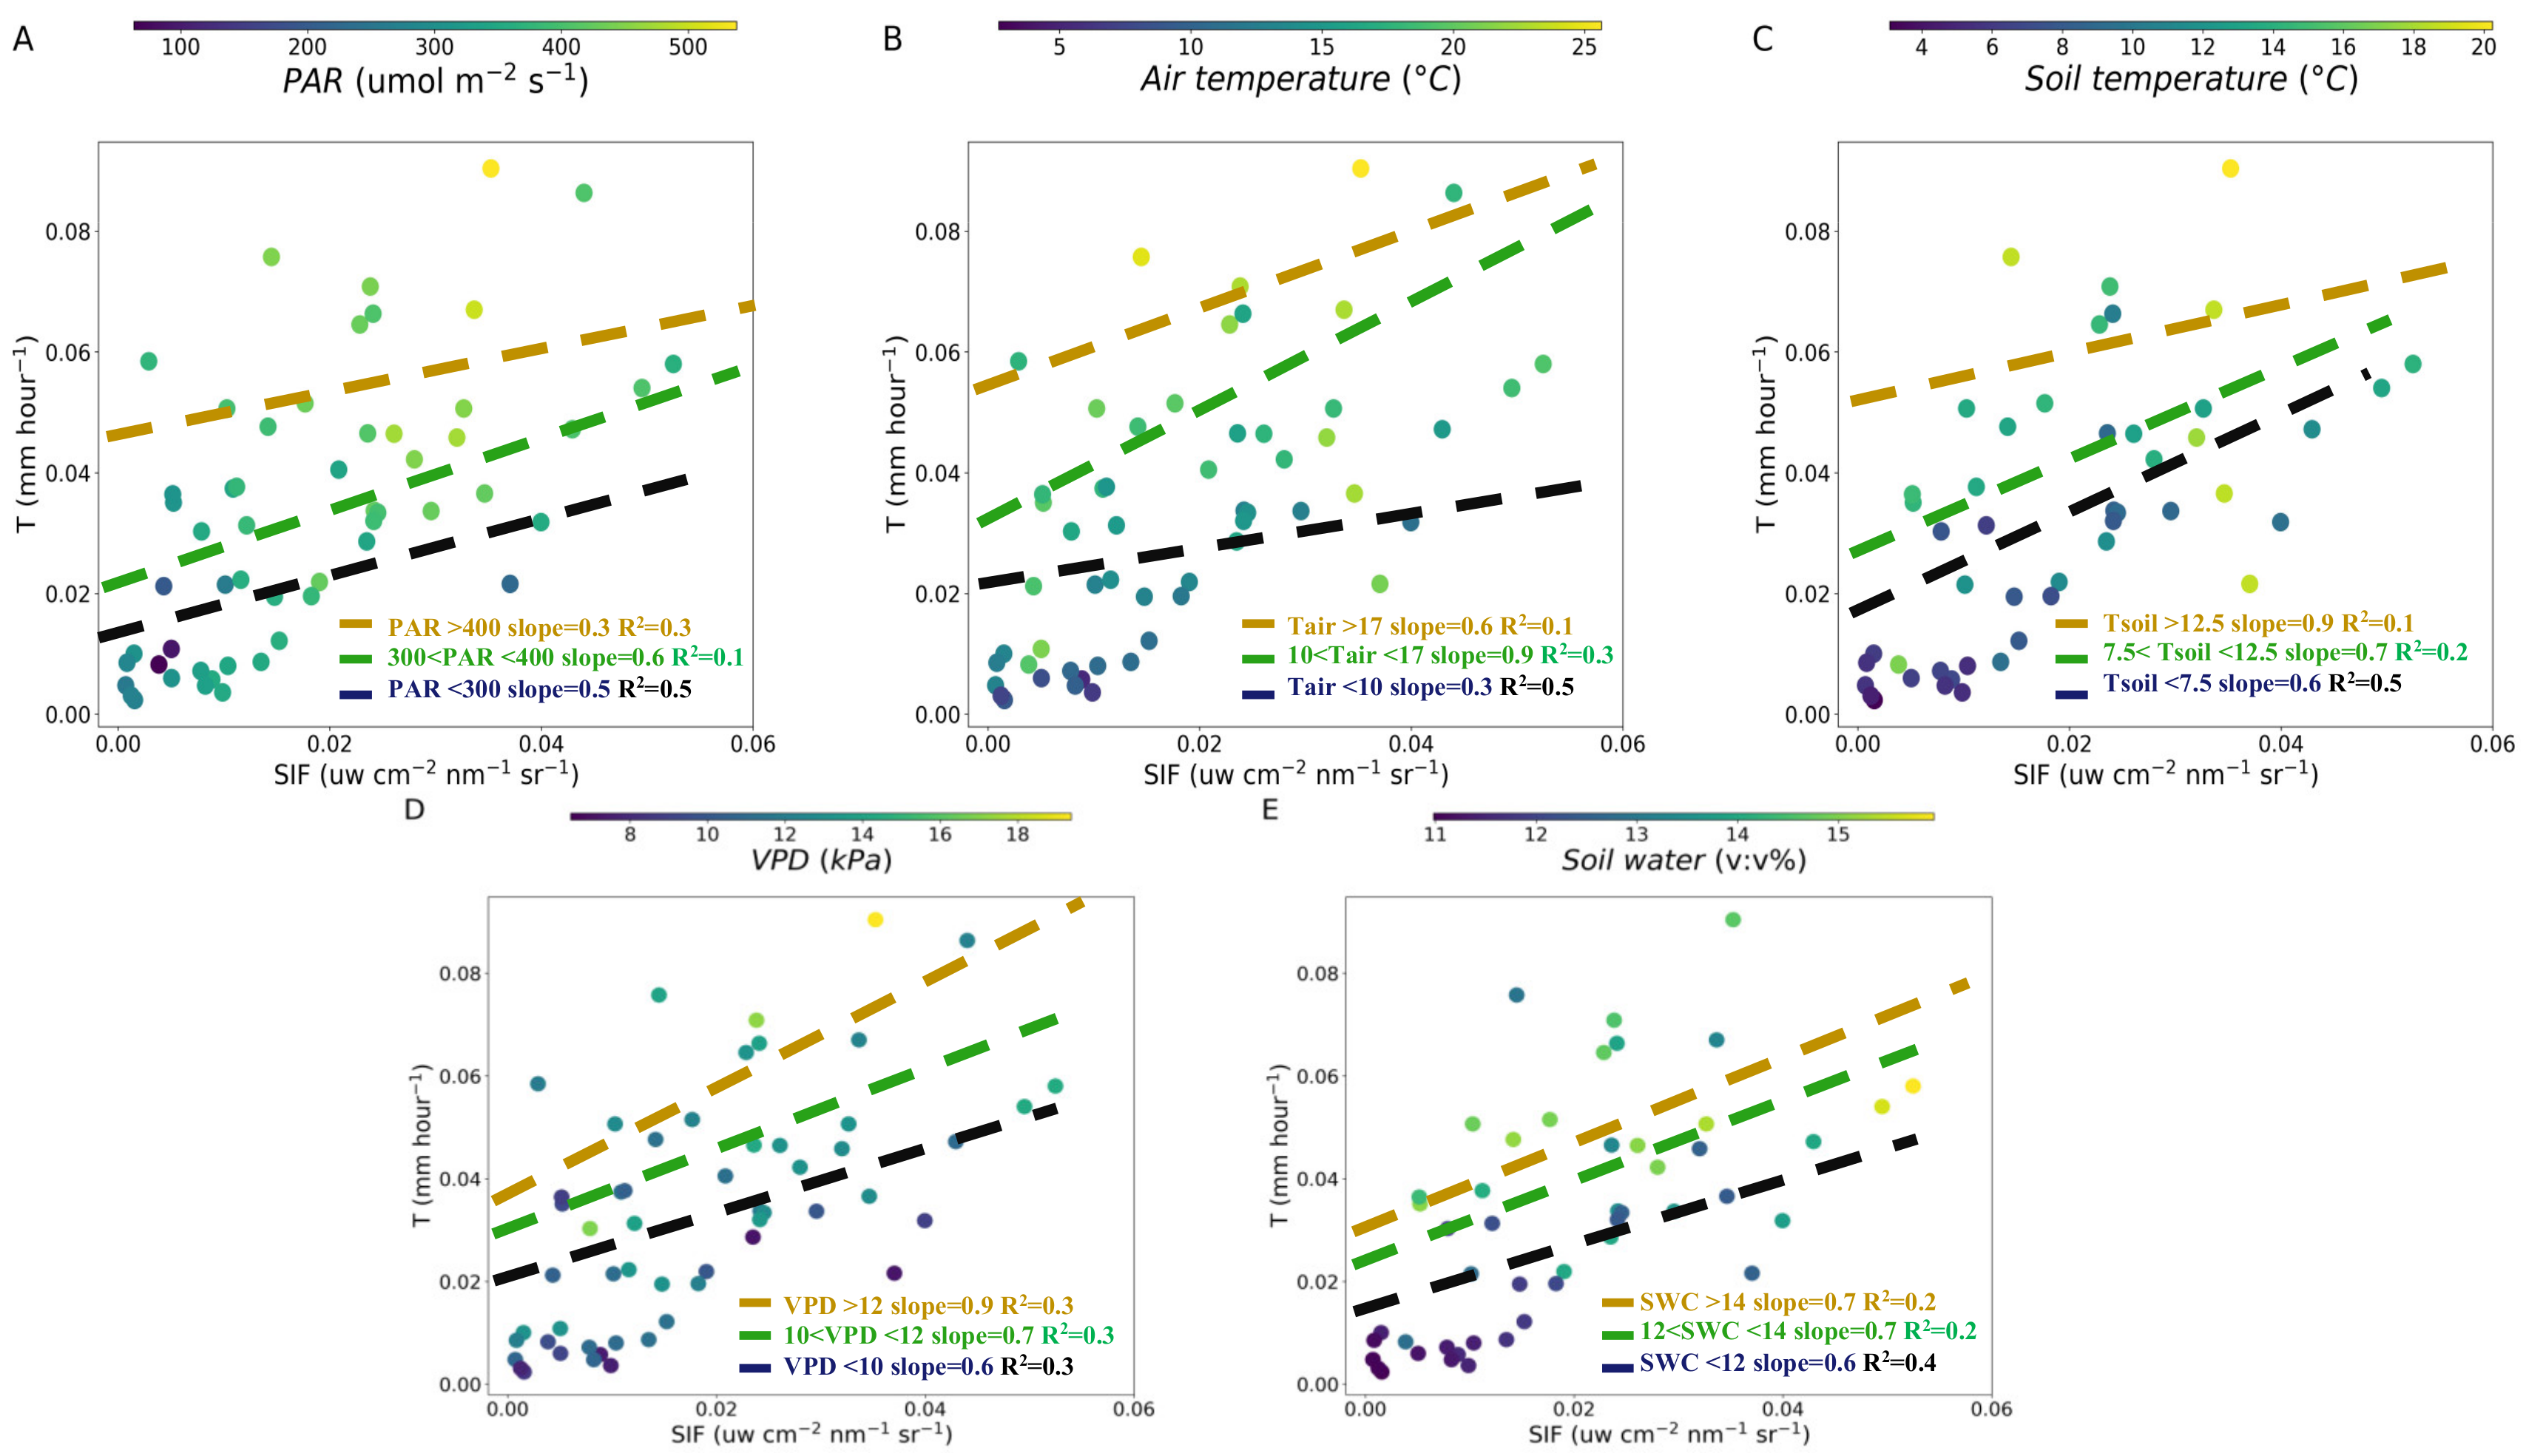
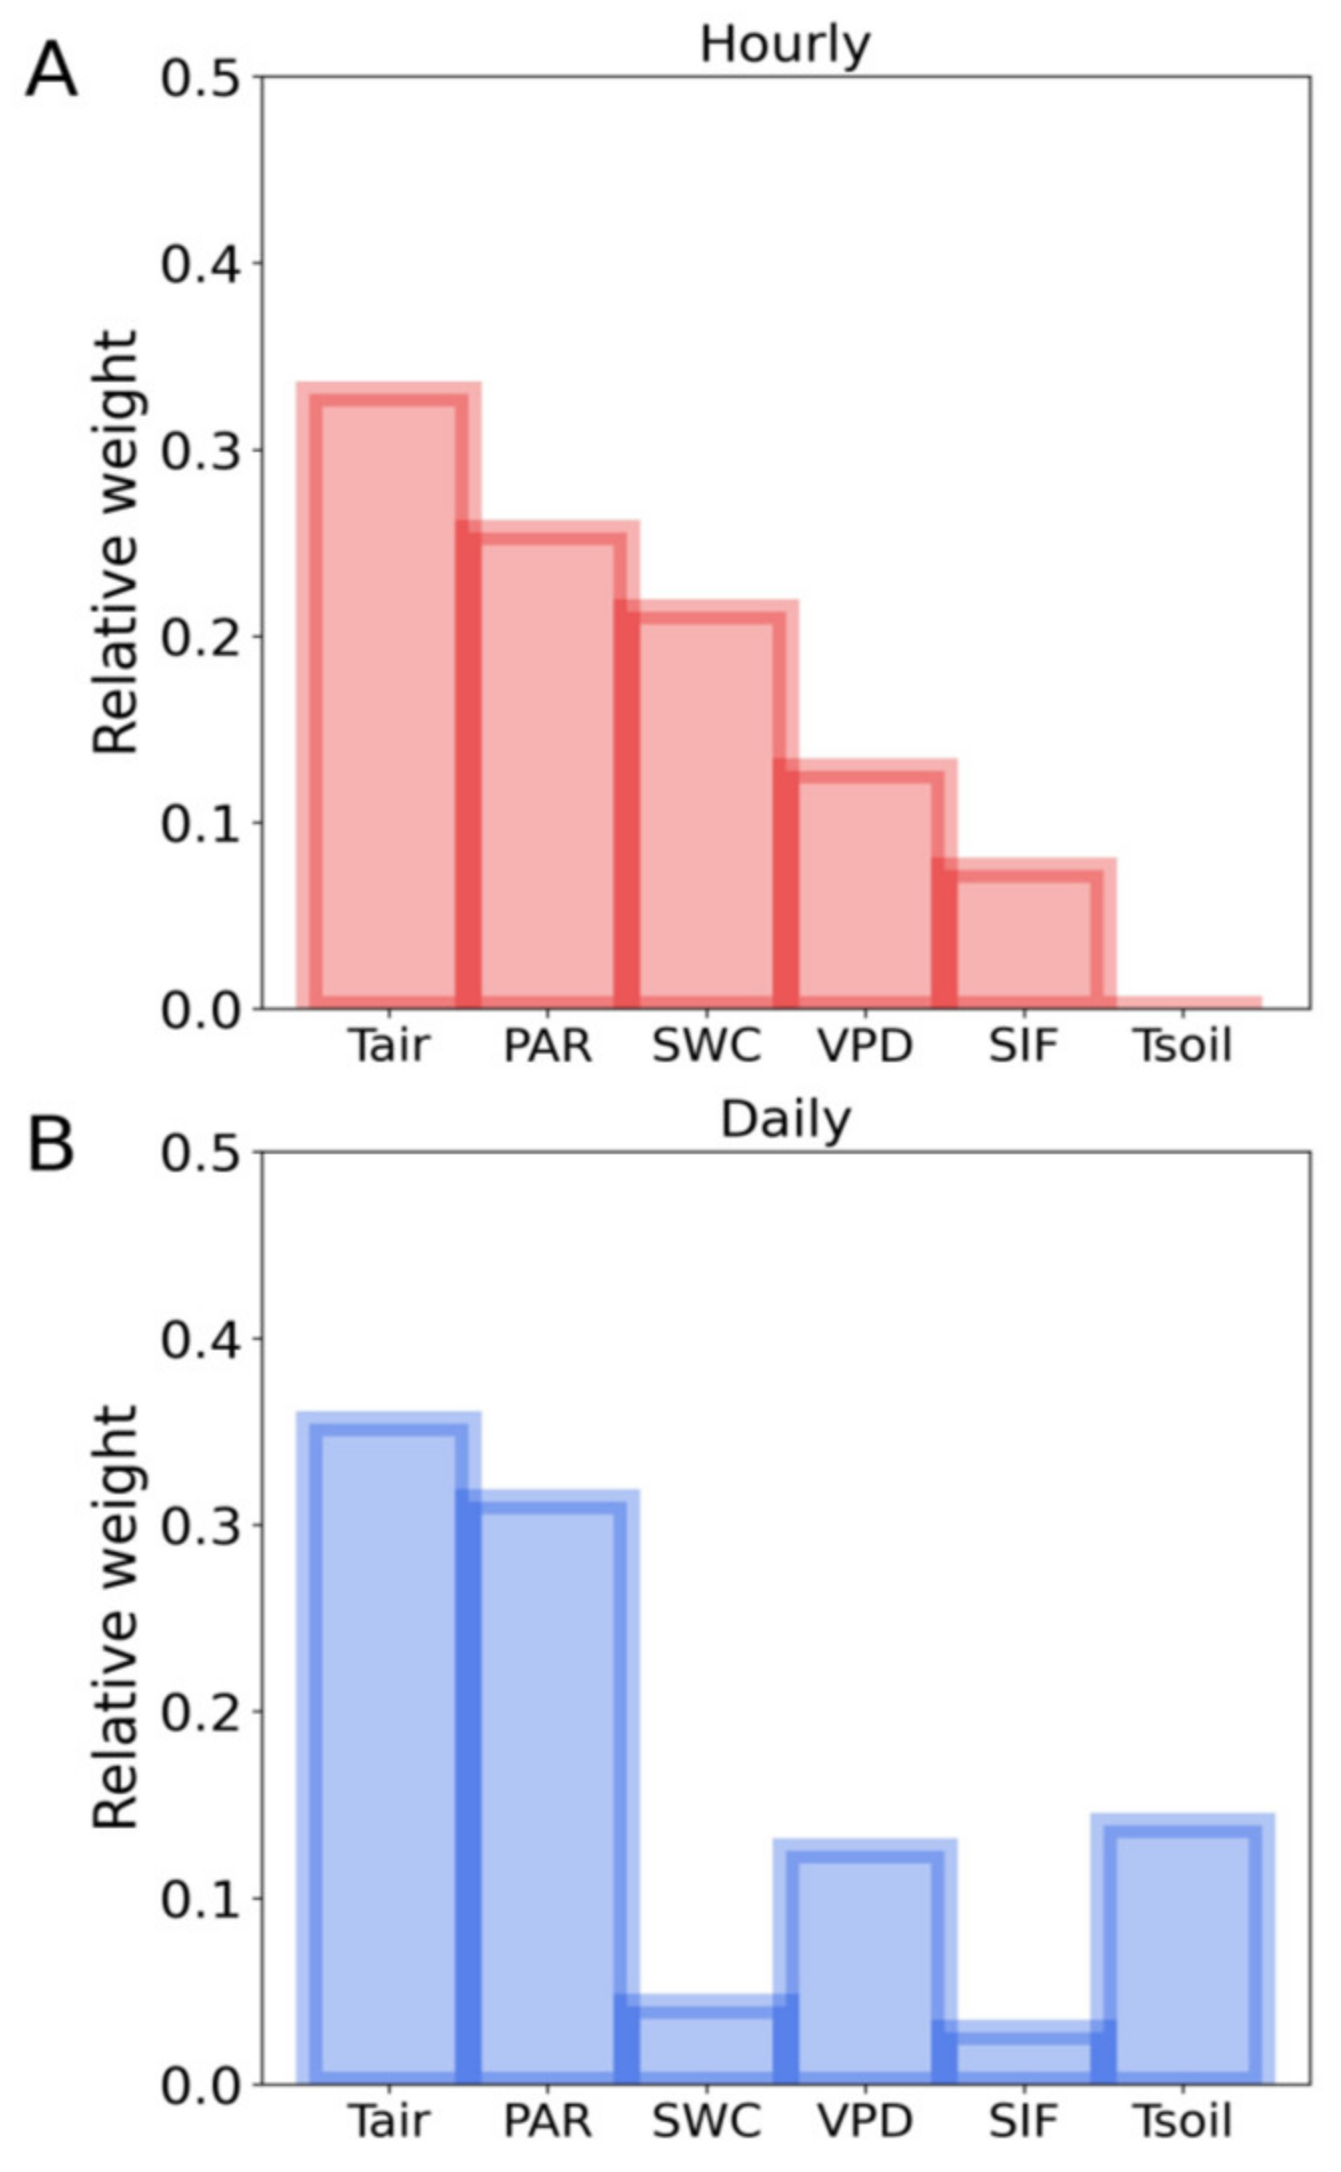
3.3. Influences of Meteorological and Soil Factors on the T-SIF Relationship

To clarify the influences of meteorological and soil factors on the T-SIF relationship, we conducted an SIF-T linear regression for different variables value intervals: the lowest, <33%, medium, 33%–66% and highest, >66% at hourly and daily scales, respectively (Figure 4 and Figure 5). The higher slope of SIF-T was 0.7 in PAR (>400 μmol m−2 s−1) and 0.9 in PAR (<200 μmol m−2 s−1) (Figure 4A). The lowest slope of the SIF-T was 0.2 in PAR (200–400 μmol m−2 s−1) at hourly scale (Figure 4A). At high air temperature (>22 °C), the slope of the SIF-T was the lowest at 0.4. As the temperature decreased, the slope of the SIF-T became higher (14–22 °C, slope was 0.7; <14 °C, slope was 0.6) (Figure 4B). The higher slopes of 0.7 and 0.9 for SIF-T were found in SWC (>14%) and SWC (<12%) (Figure 4C). The lowest slope 0.4 of the SIF-T was in SWC (12%–14%) (Figure 4C). At higher and lower VPD (>19 kPa and <10 kPa), the slope of the SIF-T was the same (0.8). The slope of the SIF-T was 0.7 at VPD (10–19 kPa) (Figure 4D). For the soil temperature, the slope of the SIF-T was 0.6–0.7 for different soil temperature intervals (Figure 4E). Our results indicated that the slopes between ENF canopy SIF and T significantly changed with the PAR, air temperature, SWC and slightly changed with VPD and soil temperature at hourly scale in the fall (Figure 4).
The slope of SIF-T was analyzed for different meteorological and soil factors intervals at daily scale. We found that the higher slope of SIF-T was 0.6 in PAR (300–400 μmol m−2 s−1) and 0.5 in PAR (<300 μmol m−2 s−1) (Figure 5A). The lowest slope 0.3 of the SIF-T was in PAR (>400 μmol m−2 s−1) at daily scale (Figure 5A). The higher slopes 0.6 and 0.9 of SIF-T were found in air temperature > 17 °C and 10–17 °C and the lowest slope 0.3 of the SIF-T was in air temperature < 10 °C (Figure 5B). As the soil temperature decreased, the slope of the SIF-T became lower (>12.5 °C, slope was 0.9; 7.5–12.5 °C, slope was 0.7; <7.5 °C, slope was 0.6) (Figure 5C). The slopes of the SIF-T decreased with VPD reduction (>12 kPa, slope was 0.9; 10–12 kPa, slope was 0.7; <10 kPa, slope was 0.6) (Figure 5D). For the SWC, the slopes of the SIF-T in the three SWC intervals were 0.6–0.7 (Figure 5E). Our results indicated that the slopes between SIF and T significantly changed with PAR, air temperature, soil temperature and VPD at daily scale (Figure 5).
To verify the key factors influencing the SIF-T relationship, we conducted LASSO regression at the hourly and daily scales with PAR, air temperature, VPD, soil temperature, SWC and SIF as input variables and T as target values. The LASSO accuracy assessments for training data results were: hourly: R2 = 0.73, RMSE = 12%; daily: R2 = 0.81, RMSE = 8%; and for the test data result was: hourly: R2 = 0.72, RMSE = 12% and daily: R2 = 0.75, RMSE = 10%. Among all the input variables, air temperature and PAR had the highest and second highest weights across hourly and daily scales. SWC showed higher weight on the T prediction at hourly scale than daily scale in our study (Figure 6). Our results clearly confirmed that PAR and air temperature were the key factors that regulated the relationship between SIF and T in ENF during the fall transition. Soil water content (SWC) influenced the SIF-T relationship at hourly scale. Soil temperature and VPD’s effect on the SIF-T relationship showed at the daily scale.

4. Discussion

Our results provided field-based evidence to complement findings that SIF and T are linearly correlated at hourly and daily scales in the fall transition. Moreover, the SIF-T correlation varied significantly among different months. Air temperature and PAR were the major moderating factors for the relationship between SIF and T at hourly and daily scales in the fall transition. SWC influenced the SIF-T relationship at hourly scale and soil temperature influenced the SIF-T relationship at daily scale, respectively.

4.1. Dynamic SIF-T Relationships in Temperate ENF during the Fall Transition

A number of recent studies have demonstrated that SIF and T share a strong positive relationship at multiple spatial scales [12,14,17,30,31]. We collected ENF canopy SIF and T at high temporal resolution during the fall in 2020 and observed correlations between SIF and T. However, the relationships of SIF and T varied across different months both at hourly and daily scales. SIF and T showed significant linear correlation in October. These dynamic relationships between SIF and T indicated that current satellite SIF products averaged at a weekly and monthly time resolution are not yet adequate to characterize the SIF-T relationship in the fall transition. It is necessary to incorporate the dynamic relationships between SIF and T at an unprecedented spatiotemporal resolution into the SIF-based T estimations during season transition.
Several factors influence the SIF-T relationship in the season transition, such as the vegetation biochemistry (e.g., leaf pigments, water and dry matter), physiological status (e.g., canopy structure), environmental conditions [15,32], and observation angles [33]. Canopy structure, including canopy LAI and leaf orientation influence the SIF scattering and re-absorption [34]. Evergreens hold relative constant canopy structure during the season transition [6,7]. To shed more absorbed energy as nonphotochemical quenching (NPQ) over winter months, ENF gradually changes pigment ratios of carotenoids and chlorophyll with meteorological shifts in season transition [35,36,37,38]. Solar radiation, air temperature and VPD triggered plant photosynthesis and transpiration recovery and reduction in the season transition [39,40,41]. Therefore, meteorological conditions are the first-order driving factor that influences SIF and T relationships of ENF in season transition. Our results showed the significant influence of SWC on the SIF-T relationship at hourly scale in November. This was probably caused by short-term meteorological droughts; soil water dominates dryness stress on ecosystem transpiration [42] and becomes the major factor influencing the SIF-T relationship.
In this study, we investigated the SIF-T relationship based on the T value estimated by the uWUE separation method. It involved uncertainty in T estimation [24,32] and thus in the analysis of the SIF-T relationship. T values estimated from field observation (e.g., sap flow) are needed to verify our results in further research. We reported slightly higher linear relationships between SIF and T compared with hyperbolic relationships at hourly and daily timescales without considering clear and diffuse sky conditions. This would probably weaken the linear relationship between SIF and T because canopy photosynthesis and transpiration can be enhanced under cloudy conditions [43] but SIF reduces under cloudy conditions [18].

4.2. Implication of SIF and Meteorological Factors Observation at Finer Temporal Scales

Current canopy transpiration models are mostly driven by empirical relationships among observed meteorological factors [44]. The transpiration estimated under water stress has used an empirical factor based on the soil moisture and stomatal conductance, net photosynthesis, mesophyll conductance and/or carboxylation rate relationships [45,46]. These empirical relationships in models introduce uncertainties to the finer scale evapotranspiration estimates. Previous studies have shown that LSM underestimates daily ET by up to 20% in the fall and about 25% across the entire season for evergreen needleleaf forest [9]. To improve T prediction, SIF has been applied for constraining ecosystem transpiration in models under the assumption of carbon and water cycle coupling at weekly and monthly time scales [12,13,14]. Maes’s research also showed that SIF explained the most variance of T at daily scale based on the SCOPE model [13]. However, our results showed that the relationships of SIF and T varied across different months with SIF and T being significantly linearly correlated at hourly and daily timescales only in the October. SIF explained lower variance compared with the air temperature and PAR across hourly and daily scales in the fall. This probably occurred as SIF from the light reaction is not synchronous with the T regulated by stomatal conductance and carbon assimilation when ENF undergo physiological dynamics and light-use efficiency shifts in the fall. Future research is needed to fully understand the response lag between SIF and T and the related mechanisms at both hourly and daily scales in season transition of ENF.
Our results underscore the dynamics of the SIF-T relationship in the fall transition at hourly and daily scales and the effect of meteorological and soil factors on the SIF-T relationship. This implies that when constraining T by SIF at an unprecedented temporal resolution, meteorological and soil factors should be involved. Continuous tower-based measurements of SIF combined with meteorological factors, especially soil moisture and soil temperature observation, are expected to improve the T estimates at finer spatiotemporal scales for forest ecosystems [47].

5. Conclusions

In this study, we found that SIF changed with T, ET and GPP at hourly and daily scales. Among all the meteorological and soil factors, SIF corresponded more closely to changes in air temperature, PAR and VPD than SWC and soil temperature in September and October. In November, SIF, T and ET did not show dynamic changes with PAR, air temperature and VPD variation at hourly scale. The correlation between SIF and T at hourly and daily scales varied significantly among different months. A linear relationship between SIF and T was found for ENF at hourly and daily temporal resolution over the October. Air temperature and PAR were the major factors influencing the SIF-T relationship across hourly and daily scales. Importantly, our results showed that the SWC is one of the major factors influencing the relationship between canopy SIF and T at hourly scale. Soil temperature and VPD influenced the SIF-T relationship at daily scale. Our observation-based findings can help strengthen the estimation of vegetation T by canopy SIF in season transition. Additional measurements for canopy T for different vegetation types are necessary to fully understand the SIF-T dynamic relationships in season transition when applying this relationship in T estimates.

Author Contributions

F.W. and W.C. designed this study. K.Y. investigated in the field. W.C. performed data collection, analysis and interpretation. W.C. drafted the manuscript. W.C. and F.W. contributed to reviewing and editing. All authors contributed ideas for analyses, critical revisions, and comments. All authors have read and agreed to the published version of the manuscript.

Funding

This work was supported by Fundamental Research Funds of Chinese Academy of Forestry (Grants CAFYBB2020QD002), and the National Natural Science Foundation of China (Grants 32001371 and 32171875).

Institutional Review Board Statement

Not applicable.

Conflicts of Interest

The authors declare that they have no conflicts of interest.

References

  1. Chen, Y.; Xia, J.Z.; Liang, S.L.; Feng, J.; Fisher, J.M.; Fisher, J.B.; Li, X.; Li, X.L.; Liu, S.G.; Ma, Z.G.; et al. Comparison of satellite-based evapotranspiration models over terrestrial ecosystems in China. Remote Sens. Environ. 2014, 140, 279–293. [Google Scholar] [CrossRef]
  2. Bonan, G.B. Forests and Climate Change: Forcings, Feedbacks, and the Climate Benefits of Forests. Science 2008, 320, 1444–1449. [Google Scholar] [CrossRef] [PubMed] [Green Version]
  3. Wang, R.; Chen, J.M.; Luo, X.; Black, A.; Arain, A. Seasonality of leaf area index and photosynthetic capacity for better estimation of carbon and water fluxes in evergreen conifer forests. Agric. For. Meteorol. 2019, 279, 107708. [Google Scholar] [CrossRef]
  4. Wang, L.; Good, S.P.; Caylor, K.K. Global synthesis of vegetation control on evapotranspiration partitioning. Geophys. Res. Lett. 2014, 41, 6753–6757. [Google Scholar] [CrossRef]
  5. Zhang, K.; Kimball, J.S.; Running, S.W. A review of remote sensing based actual evapotranspiration estimation. WIREs Water 2016, 3, 834–853. [Google Scholar] [CrossRef]
  6. Yin, G.; Verger, A.; Filella, I.; Descals, A.; Peñuelas, J. Divergent Estimates of Forest Photosynthetic Phenology Using Structural and Physiological Vegetation Indices. Geophys. Res. Lett. 2020, 47, e2020GL089167. [Google Scholar] [CrossRef]
  7. Magney, T.S.; Bowling, D.R.; Logan, B.A.; Grossmann, K.; Stutz, J.; Blanken, P.D.; Burns, S.P.; Cheng, R.; Garcia, M.A.; Köhler, P.; et al. Mechanistic evidence for tracking the seasonality of photosynthesis with solar-induced fluorescence. Proc. Natl. Acad. Sci. USA 2019, 116, 11640–11645. [Google Scholar] [CrossRef] [Green Version]
  8. Yang, Q.; Blanco, N.E.; Hermida-Carrera, C.; Lehotai, N.; Hurry, V.; Strand, Å. Two dominant boreal conifers use contrasting mechanisms to reactivate photosynthesis in the spring. Nat. Commun. 2020, 11, 128. [Google Scholar] [CrossRef]
  9. Xia, Y.; Hobbins, M.T.; Mu, Q.; Ek, M.B. Evaluation of NLDAS-2 evapotranspiration against tower flux site observations. Hydrol. Process. 2015, 29, 1757–1771. [Google Scholar] [CrossRef]
  10. Gu, L.; Han, J.; Wood, J.D.; Chang, C.Y.-Y.; Sun, Y. Sun-induced Chl fluorescence and its importance for biophysical modeling of photosynthesis based on light reactions. New Phytol. 2019, 223, 1179–1191. [Google Scholar] [CrossRef] [Green Version]
  11. Guanter, L.; Frankenberg, C.; Dudhia, A.; Lewis, P.E.; Gómez-Dans, J.; Kuze, A.; Suto, H.; Grainger, R.G. Retrieval and global assessment of terrestrial chlorophyll fluorescence from GOSAT space measurements. Remote Sens. Environ. 2012, 121, 236–251. [Google Scholar] [CrossRef]
  12. Alemohammad, S.H.; Fang, B.; Konings, A.G.; Aires, F.; Green, J.K.; Kolassa, J.; Miralles, D.; Prigent, C.; Gentine, P. Water, Energy, and Carbon with Artificial Neural Networks (WECANN): A statistically based estimate of global surface turbulent fluxes and gross primary productivity using solar-induced fluorescence. Biogeosciences 2017, 14, 4101–4124. [Google Scholar] [CrossRef] [Green Version]
  13. Maes, W.H.; Pagán, B.R.; Martens, B.; Gentine, P.; Guanter, L.; Steppe, K.; Verhoest, N.E.C.; Dorigo, W.; Li, X.; Xiao, J.; et al. Sun-induced fluorescence closely linked to ecosystem transpiration as evidenced by satellite data and radiative transfer models. Remote Sens. Environ. 2020, 249, 112030. [Google Scholar] [CrossRef]
  14. Pagán, B.R.; Maes, W.H.; Gentine, P.; Martens, B.; Miralles, D.G. Exploring the Potential of Satellite Solar-Induced Fluorescence to Constrain Global Transpiration Estimates. Remote Sens. 2019, 11, 413. [Google Scholar] [CrossRef] [Green Version]
  15. Verma, M.; Schimel, D.; Evans, B.; Frankenberg, C.; Beringer, J.; Drewry, D.T.; Magney, T.; Marang, I.; Hutley, L.; Moore, C.; et al. Effect of environmental conditions on the relationship between solar-induced fluorescence and gross primary productivity at an OzFlux grassland site. J. Geophys. Res. Biogeosci. 2017, 122, 2016JG003580. [Google Scholar] [CrossRef] [Green Version]
  16. Lu, X.; Liu, Z.; An, S.; Miralles, D.G.; Maes, W.; Liu, Y.; Tang, J. Potential of solar-induced chlorophyll fluorescence to estimate transpiration in a temperate forest. Agric. For. Meteorol. 2018, 252, 75–87. [Google Scholar] [CrossRef]
  17. Shan, N.; Zhang, Y.; Chen, J.M.; Ju, W.; Migliavacca, M.; Peñuelas, J.; Yang, X.; Zhang, Z.; Nelson, J.A.; Goulas, Y. A model for estimating transpiration from remotely sensed solar-induced chlorophyll fluorescence. Remote Sens. Environ. 2021, 252, 112134. [Google Scholar] [CrossRef]
  18. Shan, N.; Ju, W.; Migliavacca, M.; Martini, D.; Guanter, L.; Chen, J.; Goulas, Y.; Zhang, Y. Modeling canopy conductance and transpiration from solar-induced chlorophyll fluorescence. Agric. For. Meteorol. 2019, 268, 189–201. [Google Scholar] [CrossRef]
  19. Parazoo, N.C.; Arneth, A.; Pugh, T.A.M.; Smith, B.; Steiner, N.; Luus, K.; Commane, R.; Benmergui, J.; Stofferahn, E.; Liu, J.; et al. Spring photosynthetic onset and net CO2 uptake in Alaska triggered by landscape thawing. Glob. Change Biol. 2018, 24, 3416–3435. [Google Scholar] [CrossRef] [PubMed]
  20. Chang, C.Y.; Guanter, L.; Frankenberg, C.; Köhler, P.; Gu, L.; Magney, T.S.; Grossmann, K.; Sun, Y. Systematic Assessment of Retrieval Methods for Canopy Far-Red Solar-Induced Chlorophyll Fluorescence Using High-Frequency Automated Field Spectroscopy. J. Geophys. Res. Biogeosci. 2020, 125, e2019JG005533. [Google Scholar] [CrossRef]
  21. Meroni, M.; Busetto, L.; Colombo, R.; Guanter, L.; Moreno, J.; Verhoef, W. Performance of Spectral Fitting Methods for vegetation fluorescence quantification. Remote Sens. Environ. 2010, 114, 363–374. [Google Scholar] [CrossRef]
  22. Reichstein, M.; Falge, E.; Baldocchi, D.; Papale, D.; Aubinet, M.; Berbigier, P.; Bernhofer, C.; Buchmann, N.; Gilmanov, T.; Granier, A.; et al. On the separation of net ecosystem exchange into assimilation and ecosystem respiration: Review and improved algorithm. Glob. Change Biol. 2005, 11, 1424–1439. [Google Scholar] [CrossRef]
  23. Wutzler, T.; Lucas-Moffat, A.; Migliavacca, M.; Knauer, J.; Sickel, K.; Šigut, L.; Menzer, O.; Reichstein, M. Basic and extensible post-processing of eddy covariance flux data with REddyProc. Biogeosciences 2018, 15, 5015–5030. [Google Scholar] [CrossRef] [Green Version]
  24. Nelson, J.A.; Pérez-Priego, O.; Zhou, S.; Poyatos, R.; Zhang, Y.; Blanken, P.D.; Gimeno, T.E.; Wohlfahrt, G.; Desai, A.R.; Gioli, B.; et al. Ecosystem transpiration and evaporation: Insights from three water flux partitioning methods across FLUXNET sites. Glob. Change Biol. 2020, 26, 6916–6930. [Google Scholar] [CrossRef]
  25. Tibshirani, R. Regression Shrinkage and Selection Via the Lasso. J. R. Stat. Soc. Ser. B Methodol. 1996, 58, 267–288. [Google Scholar] [CrossRef]
  26. Song, L.; Zhu, J.; Zheng, X.; Wang, K.; Lü, L.; Zhang, X.; Hao, G. Transpiration and canopy conductance dynamics of Pinus sylvestris var. mongolica in its natural range and in an introduced region in the sandy plains of Northern China. Agric. For. Meteorol. 2020, 281, 107830. [Google Scholar] [CrossRef]
  27. Sun, X.; Wang, M.; Li, G.; Wang, J.; Fan, Z. Divergent Sensitivities of Spaceborne Solar-Induced Chlorophyll Fluorescence to Drought among Different Seasons and Regions. Isprs Int. J. Geo-Inf. 2020, 9, 542. [Google Scholar] [CrossRef]
  28. Kim, J.; Ryu, Y.; Dechant, B.; Lee, H.; Kim, H.S.; Kornfeld, A.; Berry, J.A. Solar-induced chlorophyll fluorescence is non-linearly related to canopy photosynthesis in a temperate evergreen needleleaf forest during the fall transition. Remote Sens. Environ. 2021, 258, 112362. [Google Scholar] [CrossRef]
  29. Maguire, A.J.; Eitel, J.U.H.; Griffin, K.L.; Magney, T.S.; Long, R.A.; Vierling, L.A.; Schmiege, S.C.; Jennewein, J.S.; Weygint, W.A.; Boelman, N.T.; et al. On the Functional Relationship Between Fluorescence and Photochemical Yields in Complex Evergreen Needleleaf Canopies. Geophys. Res. Lett. 2020, 47, e2020GL087858. [Google Scholar] [CrossRef]
  30. Damm, A.; Haghighi, E.; Paul-Limoges, E.; van der Tol, C. On the seasonal relation of sun-induced chlorophyll fluorescence and transpiration in a temperate mixed forest. Agric. For. Meteorol. 2021, 304–305, 108386. [Google Scholar] [CrossRef]
  31. Rigden, A.J.; Salvucci, G.D.; Entekhabi, D.; Gianotti, D.J.S. Partitioning Evapotranspiration Over the Continental United States Using Weather Station Data. Geophys. Res. Lett. 2018, 45, 9605–9613. [Google Scholar] [CrossRef]
  32. Miao, G.; Guan, K.; Yang, X.; Bernacchi, C.J.; Berry, J.A.; DeLucia, E.H.; Wu, J.; Moore, C.E.; Meacham, K.; Cai, Y.; et al. Sun-Induced Chlorophyll Fluorescence, Photosynthesis, and Light Use Efficiency of a Soybean Field from Seasonally Continuous Measurements. J. Geophys. Res. Biogeosci. 2018, 123, 610–623. [Google Scholar] [CrossRef]
  33. Liu, L.; Liu, X.; Wang, Z.; Zhang, B. Measurement and Analysis of Bidirectional SIF Emissions in Wheat Canopies. IEEE Trans. Geosci. Remote Sens. 2016, 54, 2640–2651. [Google Scholar] [CrossRef]
  34. Verrelst, J.; Rivera, J.P.; van der Tol, C.; Magnani, F.; Mohammed, G.; Moreno, J. Global sensitivity analysis of the SCOPE model: What drives simulated canopy-leaving sun-induced fluorescence? Remote Sens. Environ. 2015, 166, 8–21. [Google Scholar] [CrossRef]
  35. Demmig-Adams, B.; Koh, S.-C.; Cohu, C.M.; Muller, O.; Stewart, J.J.; Adams, W.W. Non-Photochemical Fluorescence Quenching in Contrasting Plant Species and Environments. In Non-Photochemical Quenching and Energy Dissipation in Plants, Algae and Cyanobacteria, Advances in Photosynthesis and Respiration; Demmig-Adams, B., Garab, G., Adams, W., III, Govindjee, Eds.; Springer: Dordrecht, The Netherlands, 2014; pp. 531–552. [Google Scholar] [CrossRef]
  36. Müller, P.; Li, X.-P.; Niyogi, K.K. Non-Photochemical Quenching. A Response to Excess Light Energy1. Plant Physiol. 2001, 125, 1558–1566. [Google Scholar] [CrossRef] [PubMed] [Green Version]
  37. Porcar-Castell, A. A high-resolution portrait of the annual dynamics of photochemical and non-photochemical quenching in needles of Pinus sylvestris. Physiol. Plant. 2011, 143, 139–153. [Google Scholar] [CrossRef] [PubMed]
  38. Wong, C.Y.S.; Gamon, J.A. The photochemical reflectance index provides an optical indicator of spring photosynthetic activation in evergreen conifers. New Phytol. 2015, 206, 196–208. [Google Scholar] [CrossRef]
  39. Chen, Z.; Zhang, X.; Cui, M.; He, X.; Ding, W.; Peng, J. Tree-ring based precipitation reconstruction for the forest–steppe ecotone in northern Inner Mongolia, China and its linkages to the Pacific Ocean variability. Glob. Planet. Change 2012, 86–87, 45–56. [Google Scholar] [CrossRef]
  40. Tie, Q.; Hu, H.; Tian, F.; Guan, H.; Lin, H. Environmental and physiological controls on sap flow in a subhumid mountainous catchment in North China. Agric. For. Meteorol. 2017, 240–241, 46–57. [Google Scholar] [CrossRef]
  41. Tognetti, R.; Giovannelli, A.; Lavini, A.; Morelli, G.; Fragnito, F.; d’Andria, R. Assessing environmental controls over conductances through the soil–plant–atmosphere continuum in an experimental olive tree plantation of southern Italy. Agric. For. Meteorol. 2009, 149, 1229–1243. [Google Scholar] [CrossRef]
  42. Shen, Q.; Liu, L.; Zhao, W.; Yang, J.; Han, X.; Tian, F.; Wu, J. Relationship of surface soil moisture with solar-induced chlorophyll fluorescence and normalized difference vegetation index in different phenological stages: A case study of Northeast China. Environ. Res. Lett. 2021, 16, 024039. [Google Scholar] [CrossRef]
  43. Gu, L.; Baldocchi, D.; Verma, S.B.; Black, T.A.; Vesala, T.; Falge, E.M.; Dowty, P.R. Advantages of diffuse radiation for terrestrial ecosystem productivity. J. Geophys. Res. Atmos. 2002, 107, ACL 2-1-ACL 2-23. [Google Scholar] [CrossRef] [Green Version]
  44. Ball, J.T.; Woodrow, I.E.; Berry, J.A. A Model Predicting Stomatal Conductance and its Contribution to the Control of Photosynthesis under Different Environmental Conditions. In Progress in Photosynthesis Research; Biggins, J., Ed.; Springer: Dordrecht, The Netherlands, 1987; Volume 4, pp. 221–224. [Google Scholar] [CrossRef]
  45. Calvet, J.-C.; Rivalland, V.; Picon-Cochard, C.; Guehl, J.-M. Modelling forest transpiration and CO2 fluxes—Response to soil moisture stress. Agric. For. Meteorol. 2004, 124, 143–156. [Google Scholar] [CrossRef]
  46. Verhoef, A.; Egea, G. Modeling plant transpiration under limited soil water: Comparison of different plant and soil hydraulic parameterizations and preliminary implications for their use in land surface models. Agric. For. Meteorol. 2014, 191, 22–32. [Google Scholar] [CrossRef] [Green Version]
  47. Jonard, F.; De Cannière, S.; Brüggemann, N.; Gentine, P.; Short Gianotti, D.J.; Lobet, G.; Miralles, D.G.; Montzka, C.; Pagán, B.R.; Rascher, U.; et al. Value of sun-induced chlorophyll fluorescence for quantifying hydrological states and fluxes: Current status and challenges. Agric. For. Meteorol. 2020, 291, 108088. [Google Scholar] [CrossRef]
Figure 1. Images of the fluxes site where the canopy data were collected in fall season (A). Canopy-observed SIF, ET, T, PAR, air temperature, VPD, soil temperature and soil water content (BI). Grey circles indicate half-hourly data, whereas black circles represent daily mean values.
Forests 13 00074 g001
Figure 2. Hourly averages of far-red SIF, ET, GPP, T, PAR, VPD, air temperature, soil water and soil temperature (AI) in September (blue), October (purple) and November (black). Shaded regions represent SE of the hourly mean.
Forests 13 00074 g002
Figure 3. The Pearson correlation coefficients between SIF and ET, T at hourly and daily scales for different months in the fall season.
Forests 13 00074 g003
Figure 4. Relationship between SIF and T over PAR (A), air temperature (B), soil water content (C), VPD (D) and soil temperature (E) at hourly scale. The dashed lines are linear regression fitted to the SIF and T for different variables value interval: the lowest (black, <33%), medium (green, 33%–66%) and highest (yellow, >66%) at hourly scale, respectively.
Forests 13 00074 g004
Figure 5. Relationship between SIF and T over PAR (A), air temperature (B), soil temperature (C), VPD (D) and soil water content (E) at daily scale. The dashed lines are linear regression fitted to the SIF and T under different variables value interval: the lowest (black, <33%), medium (green, 33%–66%) and highest (yellow, >66%) at daily scale, respectively.
Forests 13 00074 g005
Figure 6. Relative weight of the LASSO regression predicting T using PAR, air temperature (Tair), VPD, soil temperature (Tsoil), soil water content (SWC) and SIF as input variables at hourly (A) and daily scales (B).
Forests 13 00074 g006
Publisher’s Note: MDPI stays neutral with regard to jurisdictional claims in published maps and institutional affiliations.

