
Fatigue Performance of Natural and Synthetic Rattan Strips Subjected to Cyclic Tensile Loading

Abstract
:1. Introduction
2. Materials and Methods
2.1. Approach
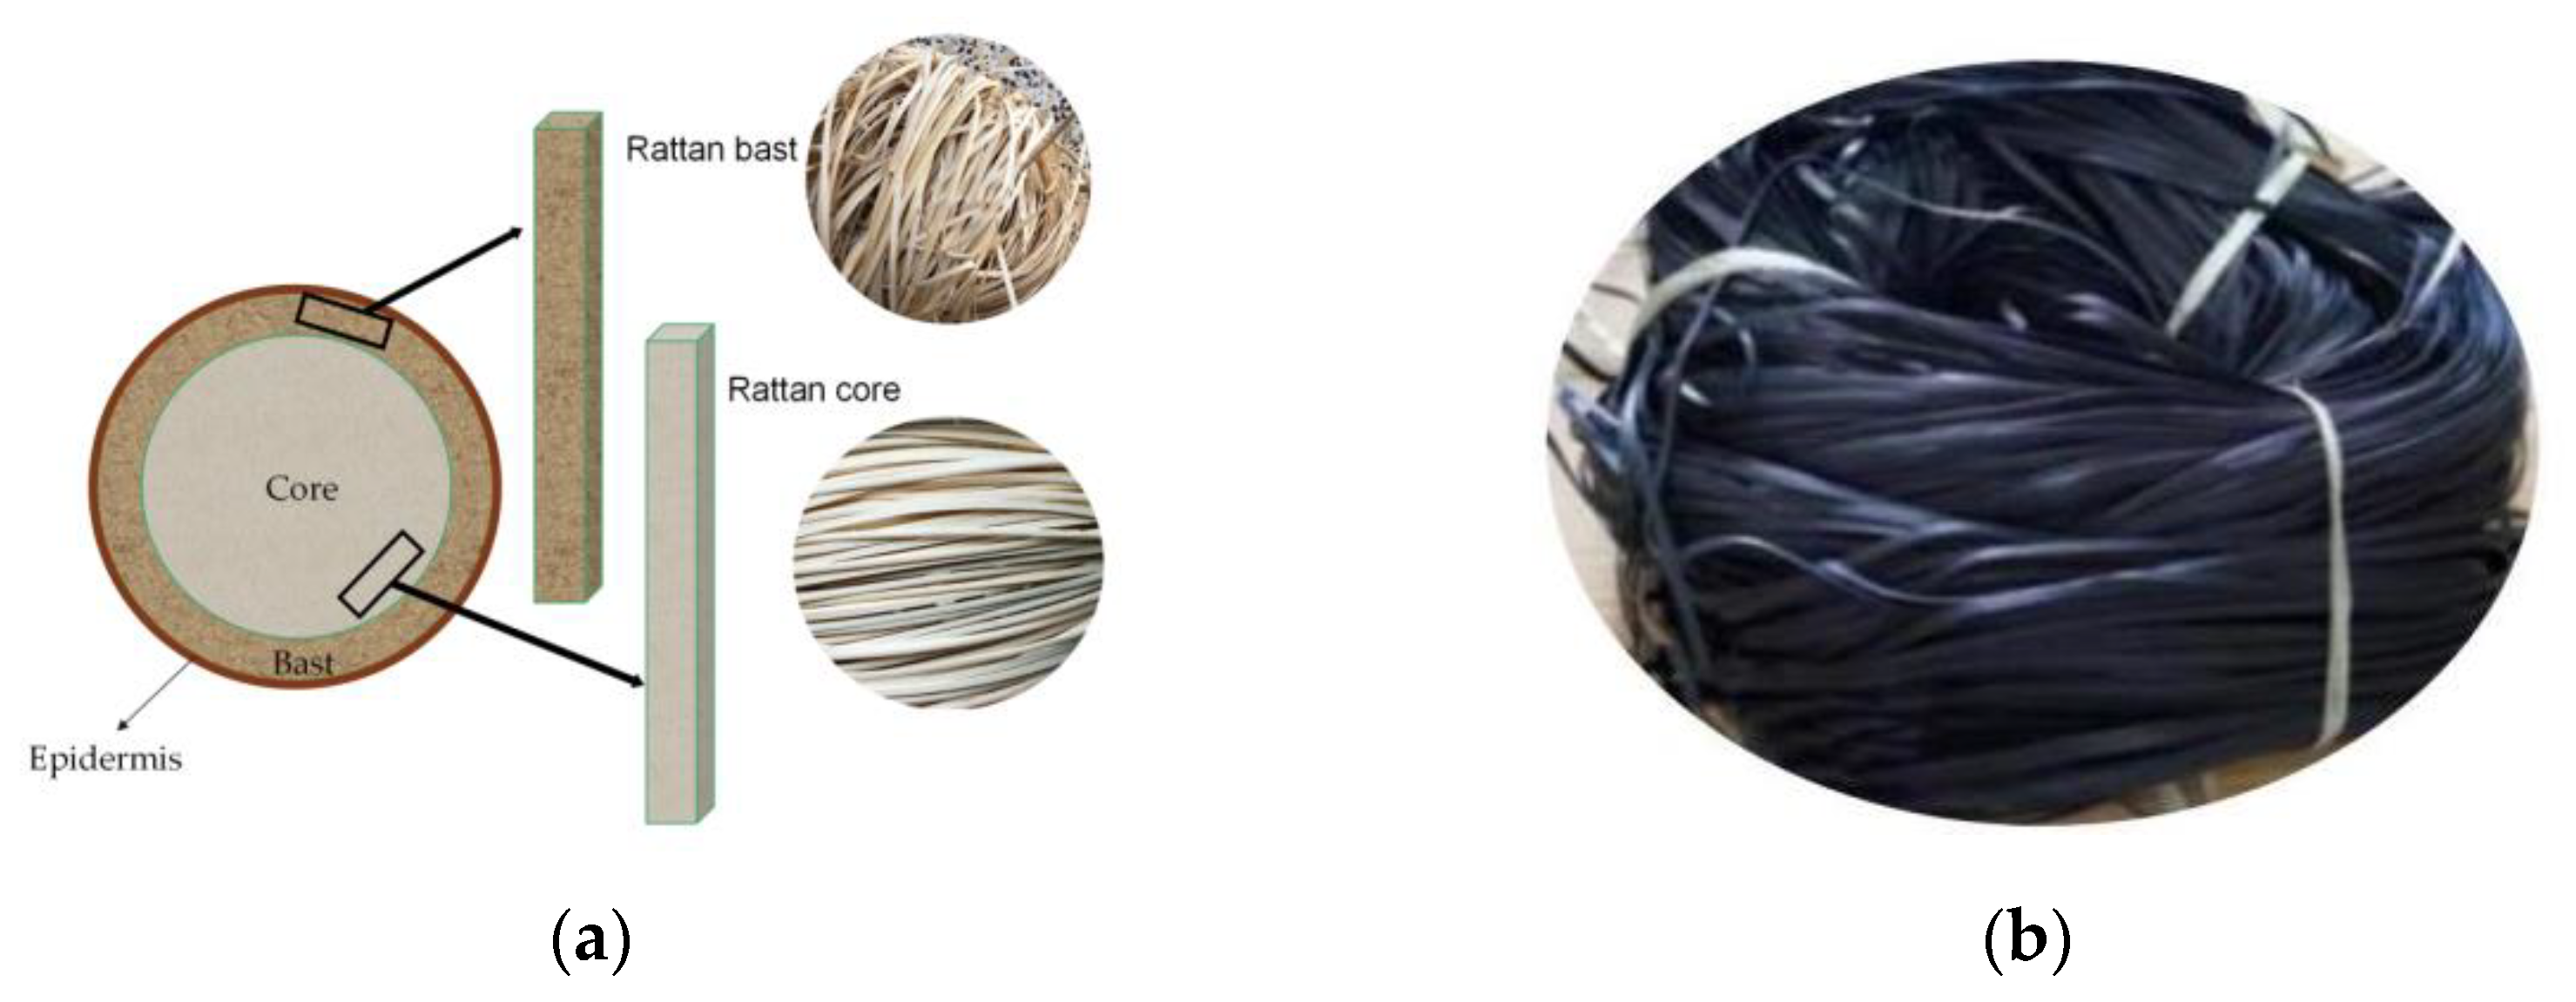
2.2. Materials
2.3. Experimental Design
2.4. Experimental Preparation and Testing
2.4.1. Static Test
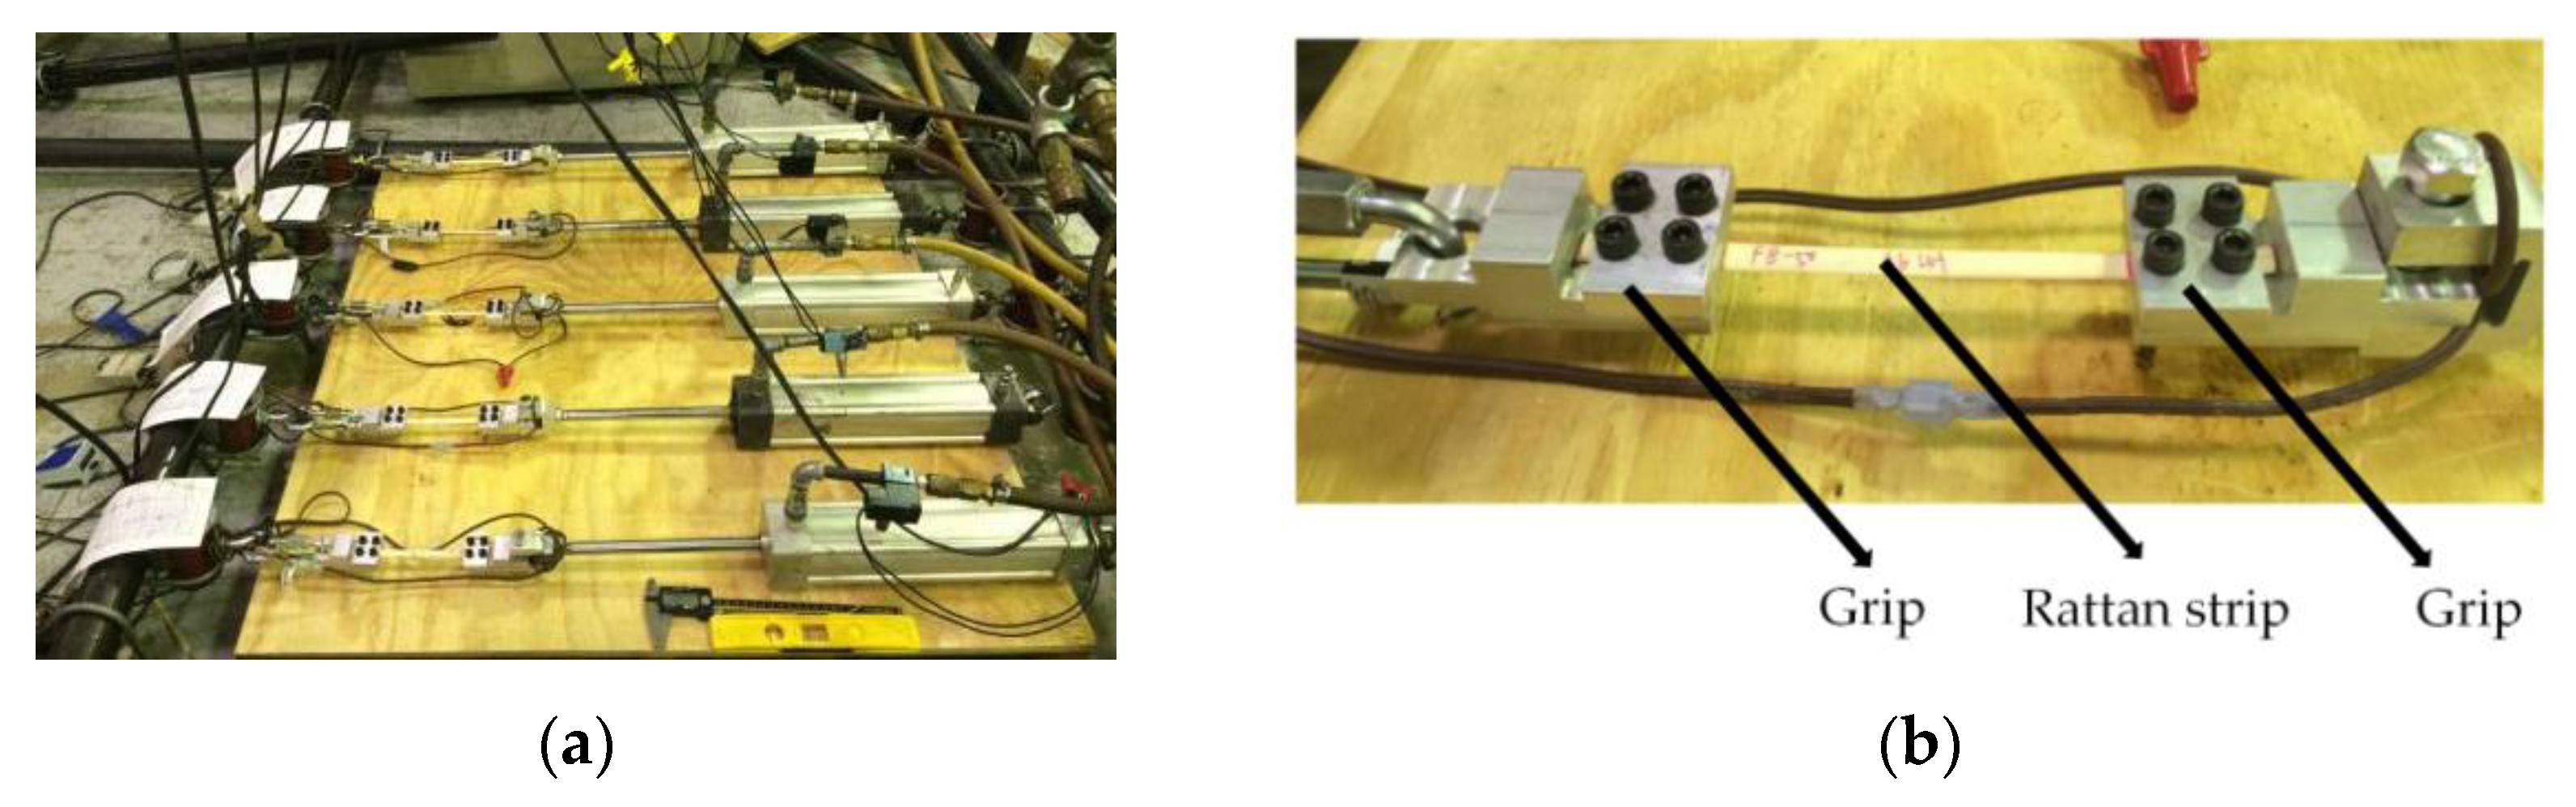
2.4.2. Fatigue Test
3. Results and Discussion
3.1. Static Tests
3.2. Fatigue Tests
4. Conclusions
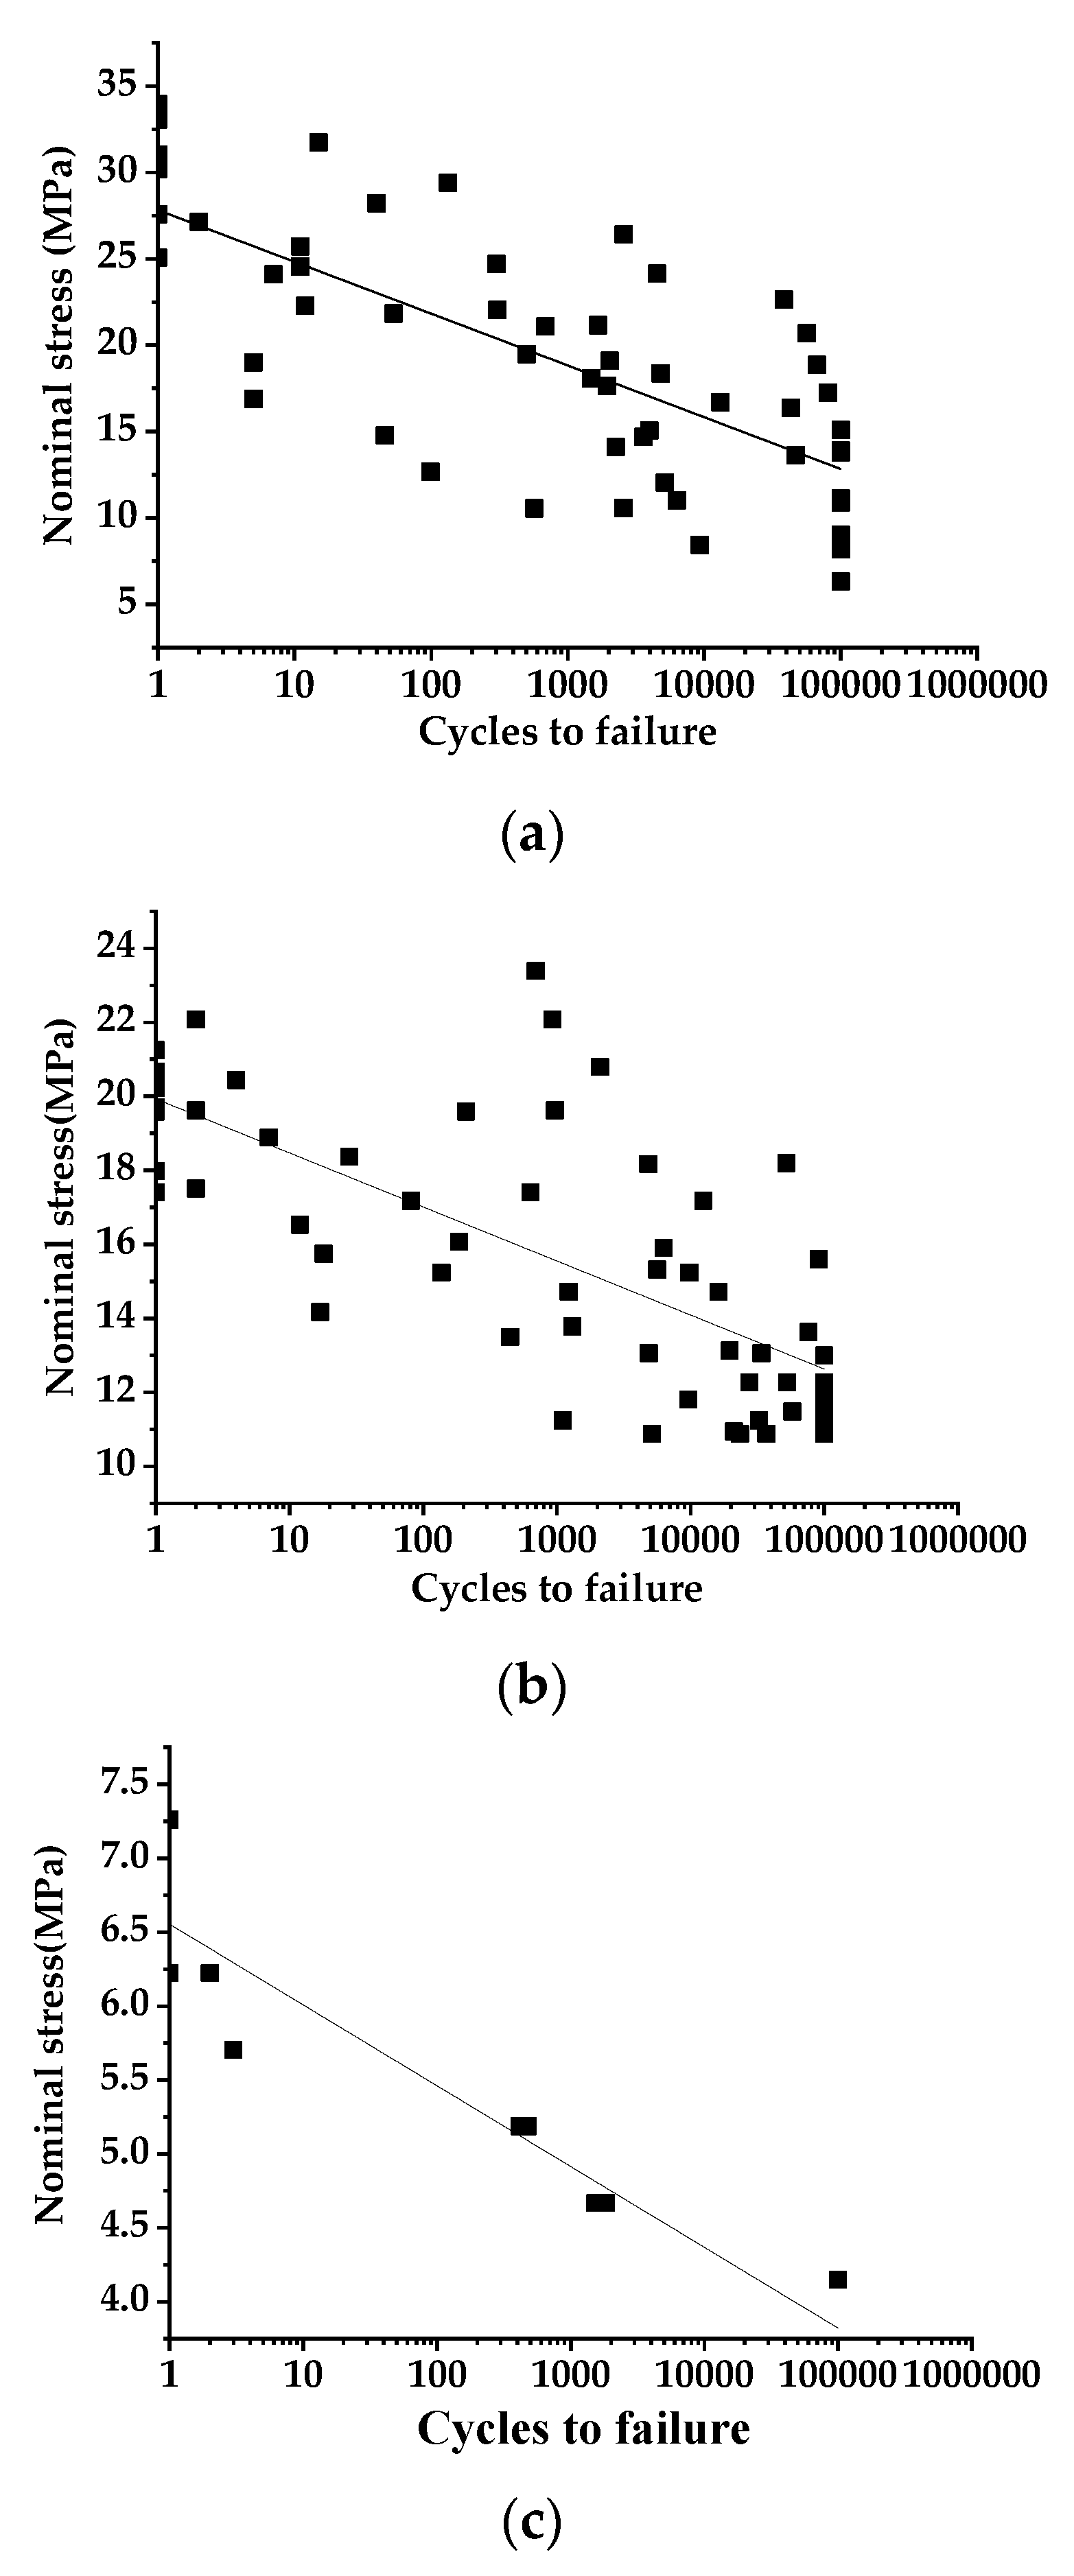
- A fatigue life of 25,000 cycles started at the stress level of 50% of UTS values for the natural rattan strips evaluated. Rattan core strips started its fatigue life of 100,000 cycles at the stress level of 30% of its UTS value, while rattan bast strips could start its fatigue life of 100,000 cycles at a stress level below 30% of its UTS value. SRSs didn’t reach its fatigue life of 25,000 cycles until the stress level reduced to 40% of its UTS value and reached its fatigue life of 100,000 cycles at the stress level of 40% of its UTS value.
- The CVs of fatigue life averaged 113, 116, and 7% for bast strips, core strips, and SRSs, respectively. The CVs in tested NRSs tended to decrease as applied stress level decreased.
- The functional relationship between the fatigue stress and the log number of cycles to failure can be expressed with the linear equation for rattan strips evaluated in this study. By incorporating the average UTS value of each of the evaluated rattan strips, it was found that the S-N curves of NRSs could be approximated by , reflecting the relationship between natural rattan material static strength and fatigue life. The constant H values in the equation were 0.10 and 0.08 for bast and core materials, respectively.
- These experimental results and functional relationships derived are limited to the rattan materials investigated in this study. The conclusions are limited to theoretical development stage and not ready for practical design usage yet. General conclusions than can be applied for practical application usage should be made when a comprehensive study on all types of rattan materials has completed. It is believed that our systematic research effort on the investigation of static, fatigue, and creep properties of rattan materials as furniture frame construction materials will provide a knowledge base that eventually can help furniture designers in their product design process with the consideration of material strength factors.
- Future studies should be considered in the direction of investigating fatigue life of rattan materials subjected to nominal stress level that is lower than 30% of their materials’ UTS values. Furthermore, the effects of the size of material building blocks and other factors such as bonding performance among material building blocks on the constants in the functional relationship between fatigue stress level and fatigue life of natural fiber-based composites should be further investigated.
Author Contributions
Funding
Institutional Review Board Statement
Informed Consent Statement
Data Availability Statement
Acknowledgments
Conflicts of Interest
References
- Gu, Y.T.; Wu, Z.H.; Zhang, Z.L. Load-deflection behavior of rattan chair seats. Wood Fiber Sci. 2016, 48, 1–12. [Google Scholar]
- Gu, Y.T.; Wu, Z.H.; Zhang, Z.L. Tensile and Bending Moment Resistances of T-Shaped Joints in Rattan Chairs. Wood Fiber Sci. 2013, 45, 429–441. [Google Scholar]
- Desmond, P.C. The Rattan Plant. In Manual on the Production of Rattan Furniture; United National Industrial Development Organization: New York, NY, USA, 1983; pp. 5–6. [Google Scholar]
- Miller, B.W.; Widess, J. The Caner’s Handbook; Lark Books: New York, NY, USA, 1991; pp. 13–20. [Google Scholar]
- Widess, J. The Complete Guide to Chair Caning: Restoring Cane, Rush, Split, Wicker, and Rattan Furniture; Sterling Publishing: New York, NY, USA, 2006; pp. 6–15. [Google Scholar]
- Gu, Y.T.; Zhang, Z.L. Tensile Properties of Natural and Synthetic Rattan Strips Used as Furniture Woven Materials. Forests 2020, 11, 1299. [Google Scholar] [CrossRef]
- Forest Products Laboratory. Wood Handbook––Wood as an Engineering Material. General Technical Report FPL-GTR-282; U.S. Department of Agriculture, Forest Service, Forest Products Laboratory: Madison, WI, USA, 2021; 543p.
- Dowling, N.E. Mechanical Behavior of Materials; Prentice Hall: Hoboken, NJ, USA, 1999; pp. 401–411. [Google Scholar]
- Bao, Z.; Eckelman, C.A. Fatigue life and design stresses for wood composites used in furniture. Forest Prod. J. 1995, 45, 59–63. [Google Scholar]
- Zhang, J.L.; Chen, B.Z.; Daniewicz, S.R. Fatigue performance of wood-based composites as upholstered furniture frame stock. Forest Prod. J. 2005, 55, 53–59. [Google Scholar]
- Dai, L.; Zhang, J.L. Fatigue performance of wood composites subjected to edgewise bending stress. Forest Prod. J. 2007, 57, 44–51. [Google Scholar]
- Adkins, D.W.; Kander, R.G. Fatigue performance of glass reinforced thermoplastics. Paper No.8808-010. In Proceedings of the 4th International Conference on Advanced Composite Materials in Bridges and Structures, Calgary, AB, Canada, 20–23 July 2004; ASM International: Russell Township, OH, USA, 1988. [Google Scholar]
- GB/T 1938-2009Method of Testing in Tensile Strength Parallel to Grain of Wood, China National Standard: Beijing, China, 2009.
- GB/T 15780-1995Testing Methods of Physical and Mechanical Properties of Bamboos, China National Standard: Beijing, China, 1995.
- ASTM D882-2012Standard Test Method for Tensile Properties of Thin Plastic Sheeting, American Society for Testing and Materials: West Consholocken, PA, USA, 2012.
- FNAE-80-214AUpholstered Furniture Test Method, Furniture Commodity Center, Federal Supply Services, General Service Administration: Washington, DC, USA, 1998.
- GB/T 10357.3–1989Test of Mechanical Properties of Furniture Strength and Durability of Chairs and Stools, China National Standard: Beijing, China, 1989.
- Wang, Y.B. Studies on Wood Properties of Plantation Rattan. Master’s Thesis, Nanjing Forestry University, Nanjing, China, 1 June 2006. [Google Scholar]


| Material Type | Adkins | Reference | |
|---|---|---|---|
| E | H | ||
| Plywood | 0.9 | 0.05 | Zhang et al., 2005 [9] |
| Particleboard | 1 | 0.09 | Zhang et al., 2005 [9] |
| OSB#1 | 0.9 | 0.07 | Zhang et al., 2005 [9] |
| OSB#2 | 1 | 0.07 | Dai et al., 2007 [10] |
| OSB#3 | 0.9 | 0.06 | Dai et al., 2007 [10] |
| OSB#4 | 0.9 | 0.06 | Dai et al., 2007 [10] |
| P | Cumulative Cycles | Service Acceptance Level |
|---|---|---|
| 950N | 25,000 | Light duty service |
| 950N | 50,000 | Medium duty service |
| 950N | 100,000 | Heavy duty service |
| Rattan Type. | Group # | ||||||||||
|---|---|---|---|---|---|---|---|---|---|---|---|
| 1 | 2 | 3 | 4 | 5 | 6 | 7 | 8 | 9 | 10 | Overall Avg. (σou) | |
| ------------ (MPa) ---------- | |||||||||||
| Bast | 27.29 (2) a | 34.48 (16) | 21.12 (12) | 21.17 (12) | 30.13 (12) | 36.74 (1) | 37.73 (3) | 49.37 (6) | 27.85 (0) | 35.27 (14) | 32.12 |
| Core | 21.88 (3) | 25.99 (8) | 22.71 (11) | 22.48 (8) | 21.76 (6) | 21.76 (6) | 24.53 (8) | 24.53 (8) | 23.61 (6) | 22.96 (4) | 23.22 |
| Test | Rattan Type | Percentage Distribution of Failure Modes (%) | ||
|---|---|---|---|---|
| Splintering | Brash | Combination | ||
| Static | Bast | 35 | 57 | 8 |
| Core | 7 | 80 | 13 | |
| Fatigue | Bast | 27 | 69 | 4 |
| Core | 18 | 68 | 14 | |
| Stress Levels | Rattan Type | |||||
|---|---|---|---|---|---|---|
| Bast | Core | |||||
| Range | Mean | CV | Range | Mean | CV | |
| (%) | (Cycles) | (Cycles) | (%) | (Cycles) | (Cycles) | (%) |
| 90 | 1–15 | 5 | 118 | 1–925 | 184 | 185 |
| 80 | 1–133 | 32 | 144 | 1–4819 | 856 | 181 |
| 70 | 11–4525 | 1336 | 119 | 18–52,017 | 8658 | 184 |
| 60 | 99–56,556 | 19,357 | 119 | 447–90,881 | 24,486 | 136 |
| 50 | 568–100,000 | 38,170 | 106 | 1104–100,000 | 41,170 | 88 |
| 40 | 2245–100,000 | 52,536 | 97 | 23,419–100,000 | 85,594 | 36 |
| 30 | 2561–100,000 | 61,772 | 85 | 100,000 | 100,000 | 0 |
| Avg. | 113 | 116 | ||||
| Stress Levels | Range | Mean | CV |
|---|---|---|---|
| (%) | (Cycles) | (Cycles) | (%) |
| 70 | 1 | 1 | 0 |
| 60 | 1–2 | 2 | 25 |
| 55 | 3 | 3 | 0 |
| 50 | 415–476 | 460 | 6 |
| 45 | 1533–1839 | 1678 | 9 |
| 40 | 100,000 | 100,000 | 0 |
| Avg. | 7 |
| Rattan Type | σou (MPa) | Linear Regression | |||||
|---|---|---|---|---|---|---|---|
| C | D | r | r2 | E | H | ||
| Bast | 32.12 (27) a | 27.82 | 2.99 | −0.93 | 0.87 | 0.9 | 0.1 |
| Core | 23.22 (6) | 19.93 | 1.46 | −0.94 | 0.88 | 0.9 | 0.08 |
| Synthetic | 10.37 (5) | 6.55 | 0.55 | −0.88 | 0.76 | 0.6 | 0.05 |
Publisher’s Note: MDPI stays neutral with regard to jurisdictional claims in published maps and institutional affiliations. |
© 2022 by the authors. Licensee MDPI, Basel, Switzerland. This article is an open access article distributed under the terms and conditions of the Creative Commons Attribution (CC BY) license (https://creativecommons.org/licenses/by/4.0/).
Share and Cite
Gu, Y.; Zhang, J. Fatigue Performance of Natural and Synthetic Rattan Strips Subjected to Cyclic Tensile Loading. Forests 2022, 13, 76. https://doi.org/10.3390/f13010076
Gu Y, Zhang J. Fatigue Performance of Natural and Synthetic Rattan Strips Subjected to Cyclic Tensile Loading. Forests. 2022; 13(1):76. https://doi.org/10.3390/f13010076
Chicago/Turabian StyleGu, Yanting, and Jilei Zhang. 2022. "Fatigue Performance of Natural and Synthetic Rattan Strips Subjected to Cyclic Tensile Loading" Forests 13, no. 1: 76. https://doi.org/10.3390/f13010076
APA StyleGu, Y., & Zhang, J. (2022). Fatigue Performance of Natural and Synthetic Rattan Strips Subjected to Cyclic Tensile Loading. Forests, 13(1), 76. https://doi.org/10.3390/f13010076