Article

Vertical Distribution and Controlling Factors of Soil Inorganic Carbon in Poplar Plantations of Coastal Eastern China

Co-Innovation Center for Sustainable Forestry in Southern China, College of Biology and the Environment, Nanjing Forestry University, Nanjing 210037, China
*
Author to whom correspondence should be addressed.
Forests 2022, 13(1), 83; https://doi.org/10.3390/f13010083
Submission received: 4 December 2021 / Revised: 4 January 2022 / Accepted: 5 January 2022 / Published: 7 January 2022
(This article belongs to the Section Forest Soil)

Abstract

:
Afforestation is a strategy to protect croplands and to sequestrate carbon in coastal areas. In addition, inorganic carbon is a considerable constitute of the coastal soil carbon pool. However, the vertical distribution and controlling factors of soil inorganic carbon (SIC) in plantations of coastal areas have been rarely studied. We analyzed the SIC content as well as physiochemical properties along soil profiles (0–100 cm) in young (YP) and mature (MP) poplar plantations in coastal eastern China. The soil profile was divided into six layers (0–10, 11–20, 21–40, 41–60, 61–80 and 81–100 cm) and a total of 36 soil samples were formed. The SIC content first increased from 0–10 cm (0.74%) to 11–20 cm (0.92%) and then fluctuated in the YP. In contrast, the SIC content increased with increasing soil depth until 40 cm and then leveled off, and the minimum and maximum appeared at 0–10 cm (0.54%) and 81–100 cm (0.98%) respectively in the MP. The soil inorganic carbon density was 12.05 and 12.93 kg m−2 within 0–100 cm in the YP and MP, respectively. Contrary to SIC, soil organic carbon (SOC) first decreased then levelled off within the soil profiles. Compared with the YP, the SIC content decreased 27.8% at 0–10 cm but increased 13.2% at 21–40 cm, meanwhile the SOC content in MP decreased 70.6% and 46.7% at 21–40 cm and 61–80 cm, respectively. The water-soluble Ca2+ and Mg2+ gradually decreased and increased, respectively within the soil profiles. The soil water-soluble Ca2+ increased 18.3% within 41–100 cm; however, the soil water-soluble Mg2+ decreased 32.7% within 21–100 cm in the MP when compared to the YP. Correlation analysis showed that SIC was negatively correlated with SOC, but positively correlated with soil pH and water-soluble Mg2+. Furthermore, structural equation modeling (SEM) indicated that SOC was the most important factor influencing the SIC content in the studied poplar plantations, indicating SOC sequestration promoted the dissolution of SIC. Therefore, our study highlights the trade-off between SIC and SOC in poplar plantations of coastal Eastern China.

1. Introduction

Soil carbon consists of organic carbon and inorganic carbon. Soil inorganic carbon (SIC) mainly refers to the soil mineral carbonates produced by the weathering of soil parent material, which includes lithogenic inorganic carbon and pedogenic inorganic carbon [1,2]. Globally, the amount of total soil carbon pool was approximately 2157–2293 Pg C in the upper 100 cm, while SIC accounted for about one third of total soil carbon [3]
The soils in arid, semi-arid, semi-humid, and coastal areas usually contain a relatively high content of inorganic carbon. Previous studies have reported that the variation of SIC content with soil depth in arid and semi-arid regions, and it can be categorized into three types: increase [4,5,6], increase followed by decrease [7,8,9], and no difference in the vertical direction [10]. Recently, Yang et al. [11] reported the SIC first increased then decreased with the increase of soil depth in Spartina alterniflora (Loisel.) wetlands in the east-central China coast, however, the opposite vertical distribution was reported by Zhang et al. [12], who studied the same ecosystem type in the Yellow River Estuary, China. Therefore, the vertical distribution of SIC is complicated and varied with different soils and areas.
It was suggested that the intrinsic soil properties, rainfall runoff, and different land management practices impacted soil carbonate in semi-arid regions [13]. Soil moisture could affect the distribution of SIC in soil profiles through leaching and infiltration [14,15]. The soil bulk density affects soil porosity, and higher bulk density is generally accompanied by lower soil porosity, which could increase the partial pressure of carbon dioxide (pCO2) and promote the formation of soil carbonate [16]. SIC is mainly composed of carbonate (such as CaCO3 and MgCO3). High soil pH was more conducive to SIC preservation because it could consume H+, which could dissolve and decrease SIC [17,18]. Land-use change also affected SIC storage. Compared with the cropland, forest has a higher amount of aboveground litter, fine root biomass and soil organic carbon (SOC) stocks, which could promote the dissolution and leaching of SIC, and thus affected the vertical distribution of SIC [19]. However, the controlling factor on SIC content are still controversial [17,20,21,22]. For example, Tong et al. [23] reported that sand content played an important role in predicting SIC in erosional and depositional sites in Chinese Loess Plateau. Similarly, a recent work showed that the relative content of silt, clay, and sand was the most vital factor affecting the accumulation of SIC in tidal flats [21]. In contrast, Zhang et al. [24] found CaO was the predominant factor controlling SIC content in reclaimed coastal tidal flats. Therefore, it is necessary to study the key factors affecting the accumulation of SIC in different soils.
Afforestation in coastal areas is one of the important land use types in coastal areas [25]. Poplar is characterized by fast growth, high yield and easy renewal. The plantation area and timber volume of poplar in Jiangsu Province ranked first in China [26]. However, the vertical distribution of SIC content and the key factors affecting SIC content in poplar plantations in this area have not been reported. Dongtai Plantation Farm, located at north of Jiangsu Province, is the largest coastal protective plantation. In this study, we measured SIC and various soil physiochemical properties, such as pH, EC, SOC, soil water-soluble Ca2+ and Mg2+ along 0–100 cm soil profiles in two poplar plantations of different ages. Therefore, this study aimed to (1) analyze the vertical distribution of SIC; (2) determine the controlling factors influencing SIC content in the poplar plantations. This study will increase the knowledge of SIC in poplar plantations in coastal areas.

2. Materials and Methods

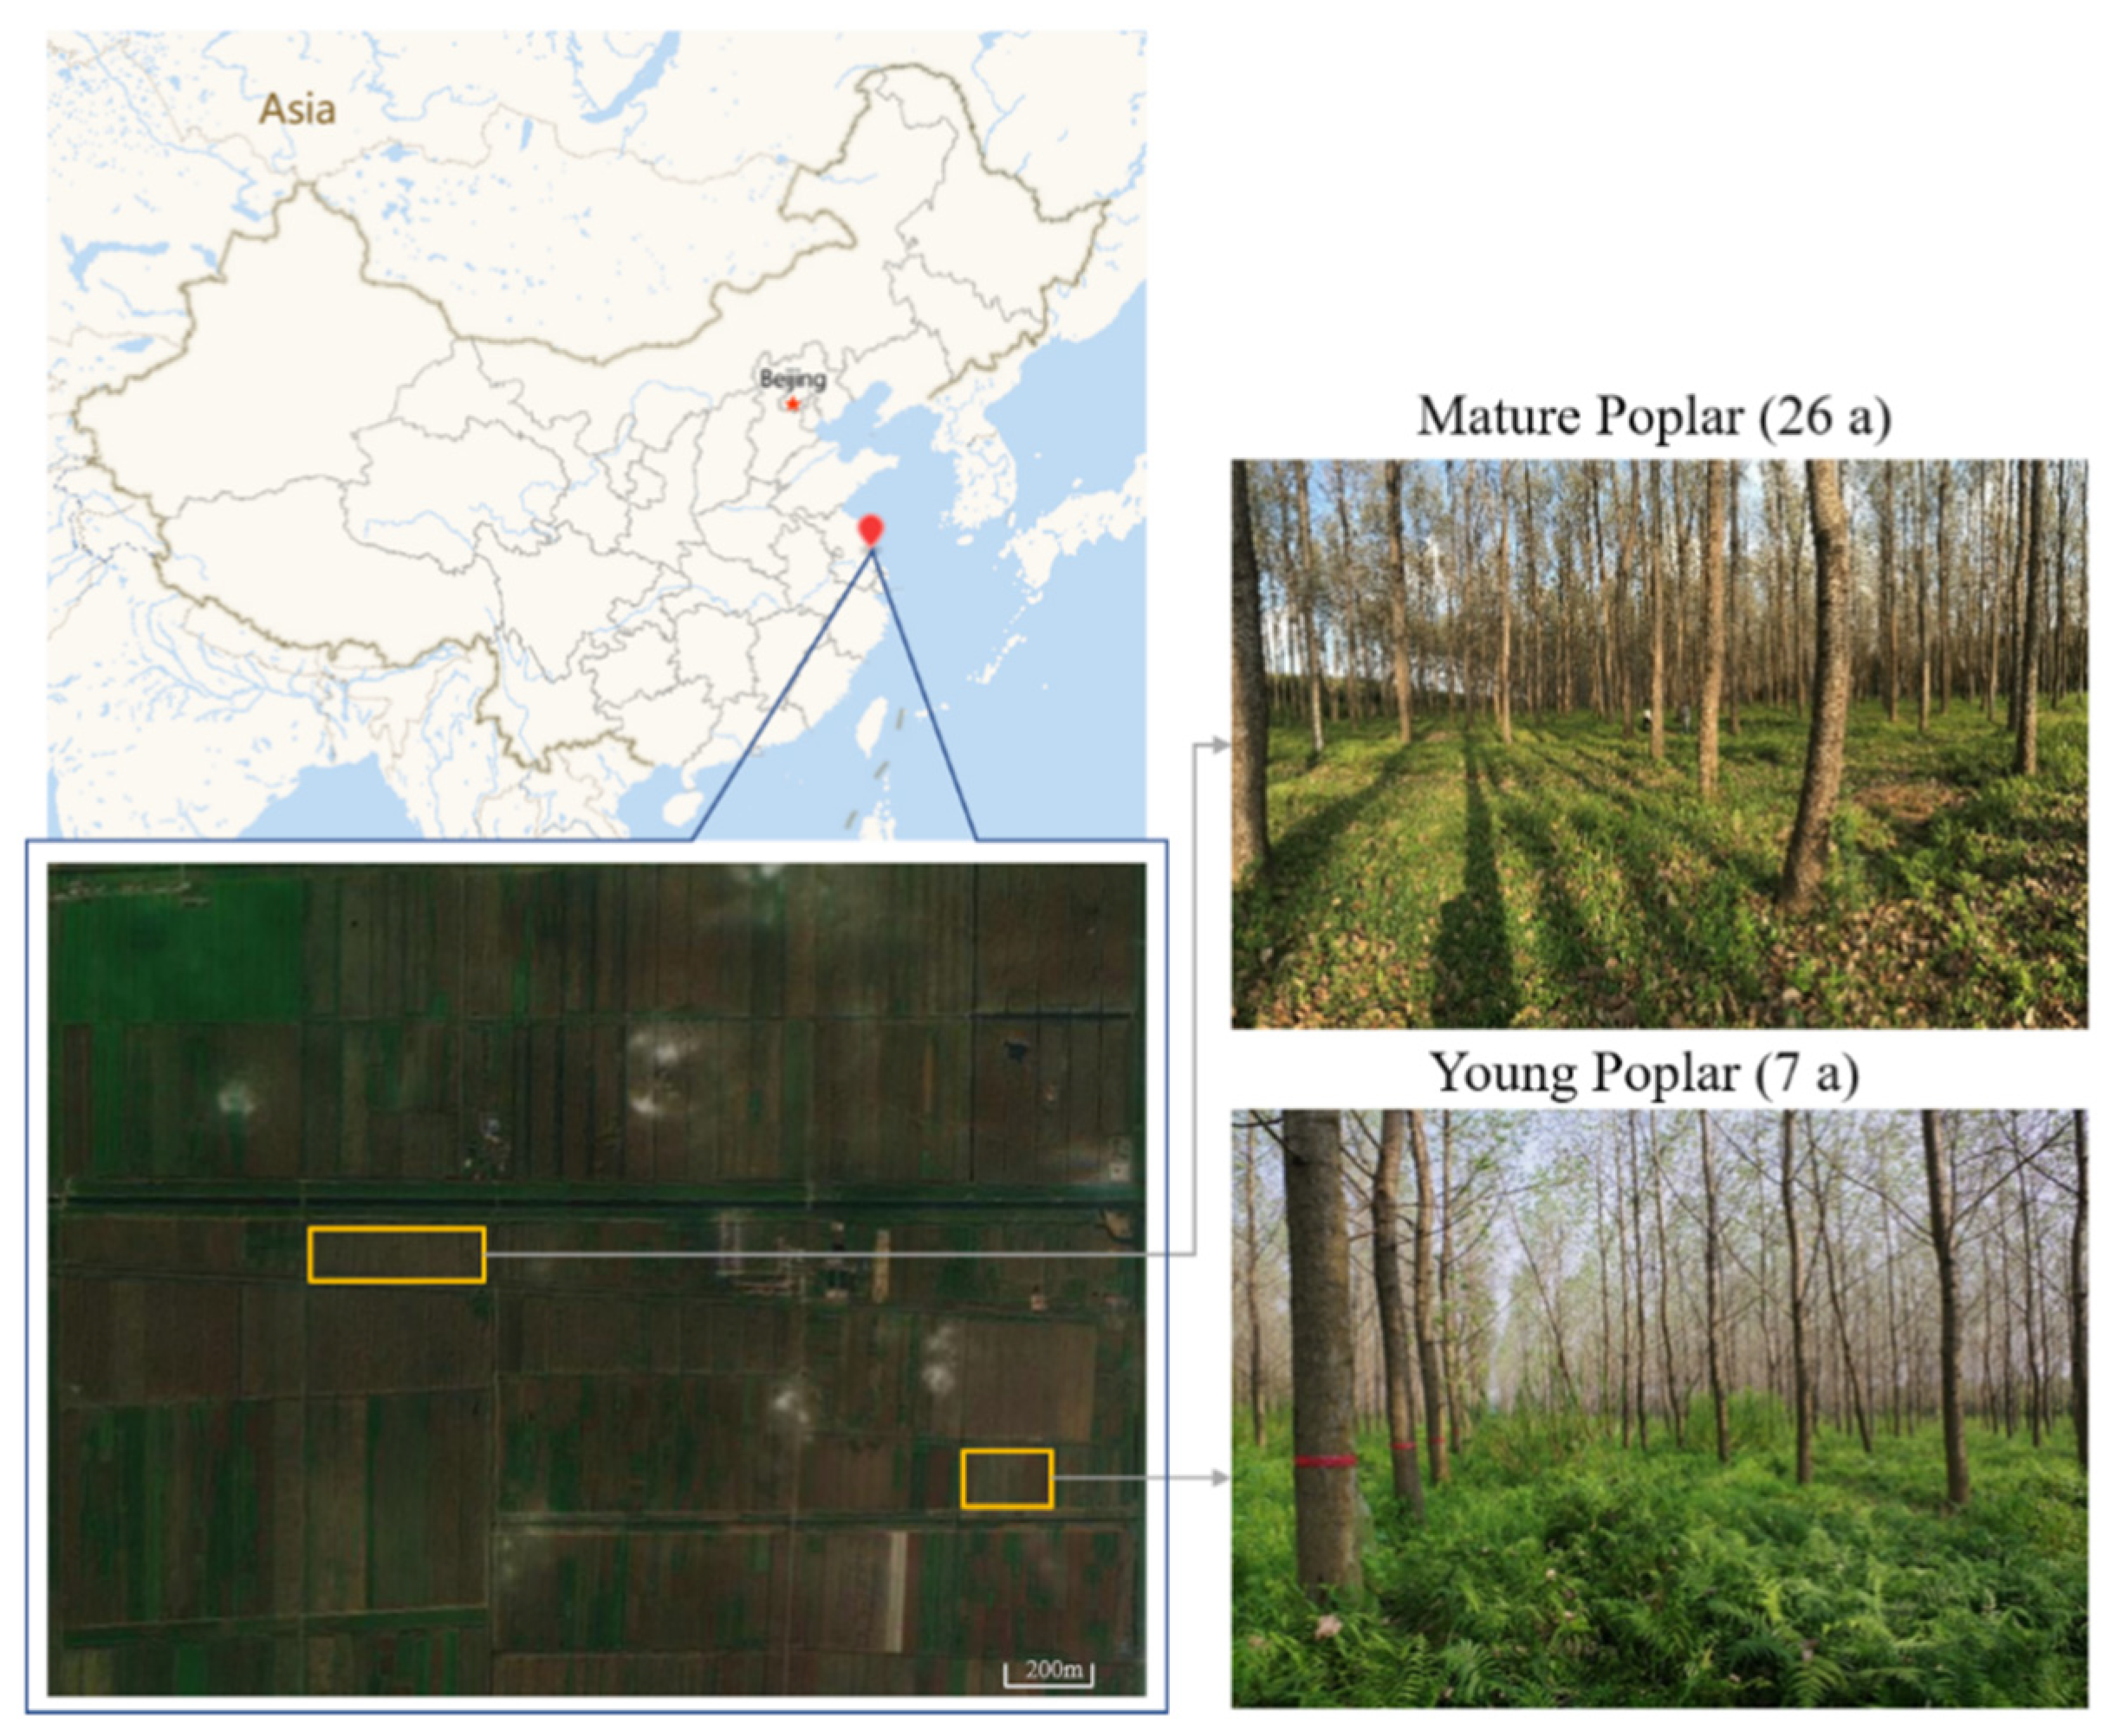
2.1. Site Description

The soils were sampled in Dongtai Plantation Farm, Yancheng City, Jiangsu Province (120°49′ E, 32°52′ N). This area has a marine monsoon climate. The annual average temperature, rainfall and relative humidity is 14.6 °C, 1050 mm and 88.3%, respectively, and the annual average frost-free period and sunlight duration is 220 d and 2200 h, respectively. The soil parent material is marine alluvial deposits, and the soil type belongs to desalting meadow soil with the texture of sandy loam.
Dongtai Plantation Farm has a total area of 2867 ha with the forest area of 2187 ha. The forest coverage and total timber volume of Dongtai Plantation Farm is about 85% and 50,000 m3, respectively. The main tree species are Populus deltoids L. cv. I-72, Populus deltoids L. cv. I-69, Populus deltoids L. cv. I-35, Metaseguoia glyptostroboides Hu & W. C. Cheng et al. The herbaceous species include Apocynum venetum L., Humulus scandens (Lour.) Merr., Rosa multiflora Thunb., and ferns.

2.2. Soil Sampling

The poplar plantations selected in this study were planted with Populus deltoids L. cv. I-35 in 2012 and Populus deltoids L. cv. I-69 in 1993, respectively. Therefore, the forest age was 7 and 26 years (a) by 2019 and they were young (YP) and mature poplar (MP) plantations, respectively (Figure 1). The total plantation area is 5.7 ha for YP and 9.3 ha for MP, and the stand characteristics were shown in Table 1.
Three replicate plots (20 m × 20 m) were established in each site. Five soil profiles of 0–100 cm were excavated along a “S” curve in each plot. Each soil profile was divided into six layers (i.e., 0–10, 11–20, 21–40, 41–60, 61–80 and 81–100 cm). Five soil samples of the same layer in each plot were mixed to produce one composite sample. In total, 36 composite soil samples were formed. Visible roots and other debris were removed from soil samples, and then the moist soil samples were taken to the laboratory.

2.3. Soil Physicochemical Analysis

The ring knife (100 cm3) samples from the field were brought to the laboratory, and oven dried at 105 °C until constant weight to measure the soil bulk density (BD). Soil pH and electrical conductivity (EC) were measured in the soil:water (m/m 1:5) mixture using a compound pH electrode and a conductivity electrode, respectively. To determine the content of soil water-soluble Ca2+ and Mg2+, the soil was first extracted with the distilled water (m/m 1:5), and then measured by atomic absorption spectrophotometer (AA900T, Perkin Elmer, Waltham, MA, USA). Soil total carbon (TC) was determined by elemental analyzer (PE2400, Pekin Elmer, Waltham, MA, USA). SOC was measured by the K2Cr2O7–H2SO4 oxidation method. SIC was calculated as the difference between TC and SOC.

2.4. Calculations

The calculation of SICD (Ci, kg m−2) of soil layer i was as follows:
C i = S I C i × D i × H i / 10
where SICi is the SIC content of soil layer i (%); Di is the bulk density of soil layer i (g cm−3); Hi is the thickness of soil layer i (cm); and 10 is the unit conversion factor.

2.5. Statistical Analysis

One-way analysis of variance (ANOVA) was conducted to test the significance of differences of SIC content and other soil properties among different soil layers within a poplar plantation. Further, the least significant difference (LSD) was used for post-hoc multiple comparisons. An independent sample t-test was employed to examine the differences in SIC content and other soil properties between the two poplar plantations. The relationship between SIC content and soil physicochemical properties was analyzed by the Pearson correlation analysis. The statistical significance was set at p < 0.05. Structural equation modeling (SEM) was used to investigate direct and indirect effects of soil physicochemical properties on SIC. The model was tested with Chi-squared tests (χ2 tests), the comparative fit index (CFI), the goodness-of-fit statistic (GFI) and the root mean square error of approximation (RMSEA). The acceptance criteria of SEM model was as follows: χ2 > 0.05, GFI > 0.90, CFI > 0.95 and RMSEA < 0.05 [27]. SEM model was performed by Lavaan package in R software (v 4.1.1). All other statistical analyses were performed with SPSS 22.0 for Windows (SPSS Inc., Chicago, IL, USA).

3. Results

3.1. Soil Water Content and Soil Bulk Density

Soil water content gradually increased with the increase of soil depth in the YP, and the maximum (29.0%) at 81–100 cm was nearly two times of the minimum at 0–10 cm (15.6%) (Figure 2). However, soil water content was rather constant along soil profiles in the MP, and the maximum (29.6%) appeared at 81–100 cm (Figure 2). Compared with the YP, the soil water content was obviously higher within 0–60 cm in the MP (Figure 2). The averaged soil water content across 0–100 cm in the MP (27.9%) was higher than that in the YP (23.79%). There was no significant difference in soil bulk density between YP and MP, but soil BD of MP was 7.2% higher compared to YP within 0–60 cm, instead, the soil BD of YP was slightly higher than MP within 61–100 cm. The averaged soil BD across the profiles was 1.42 and 1.37 g cm−3 in the MP and YP, respectively.

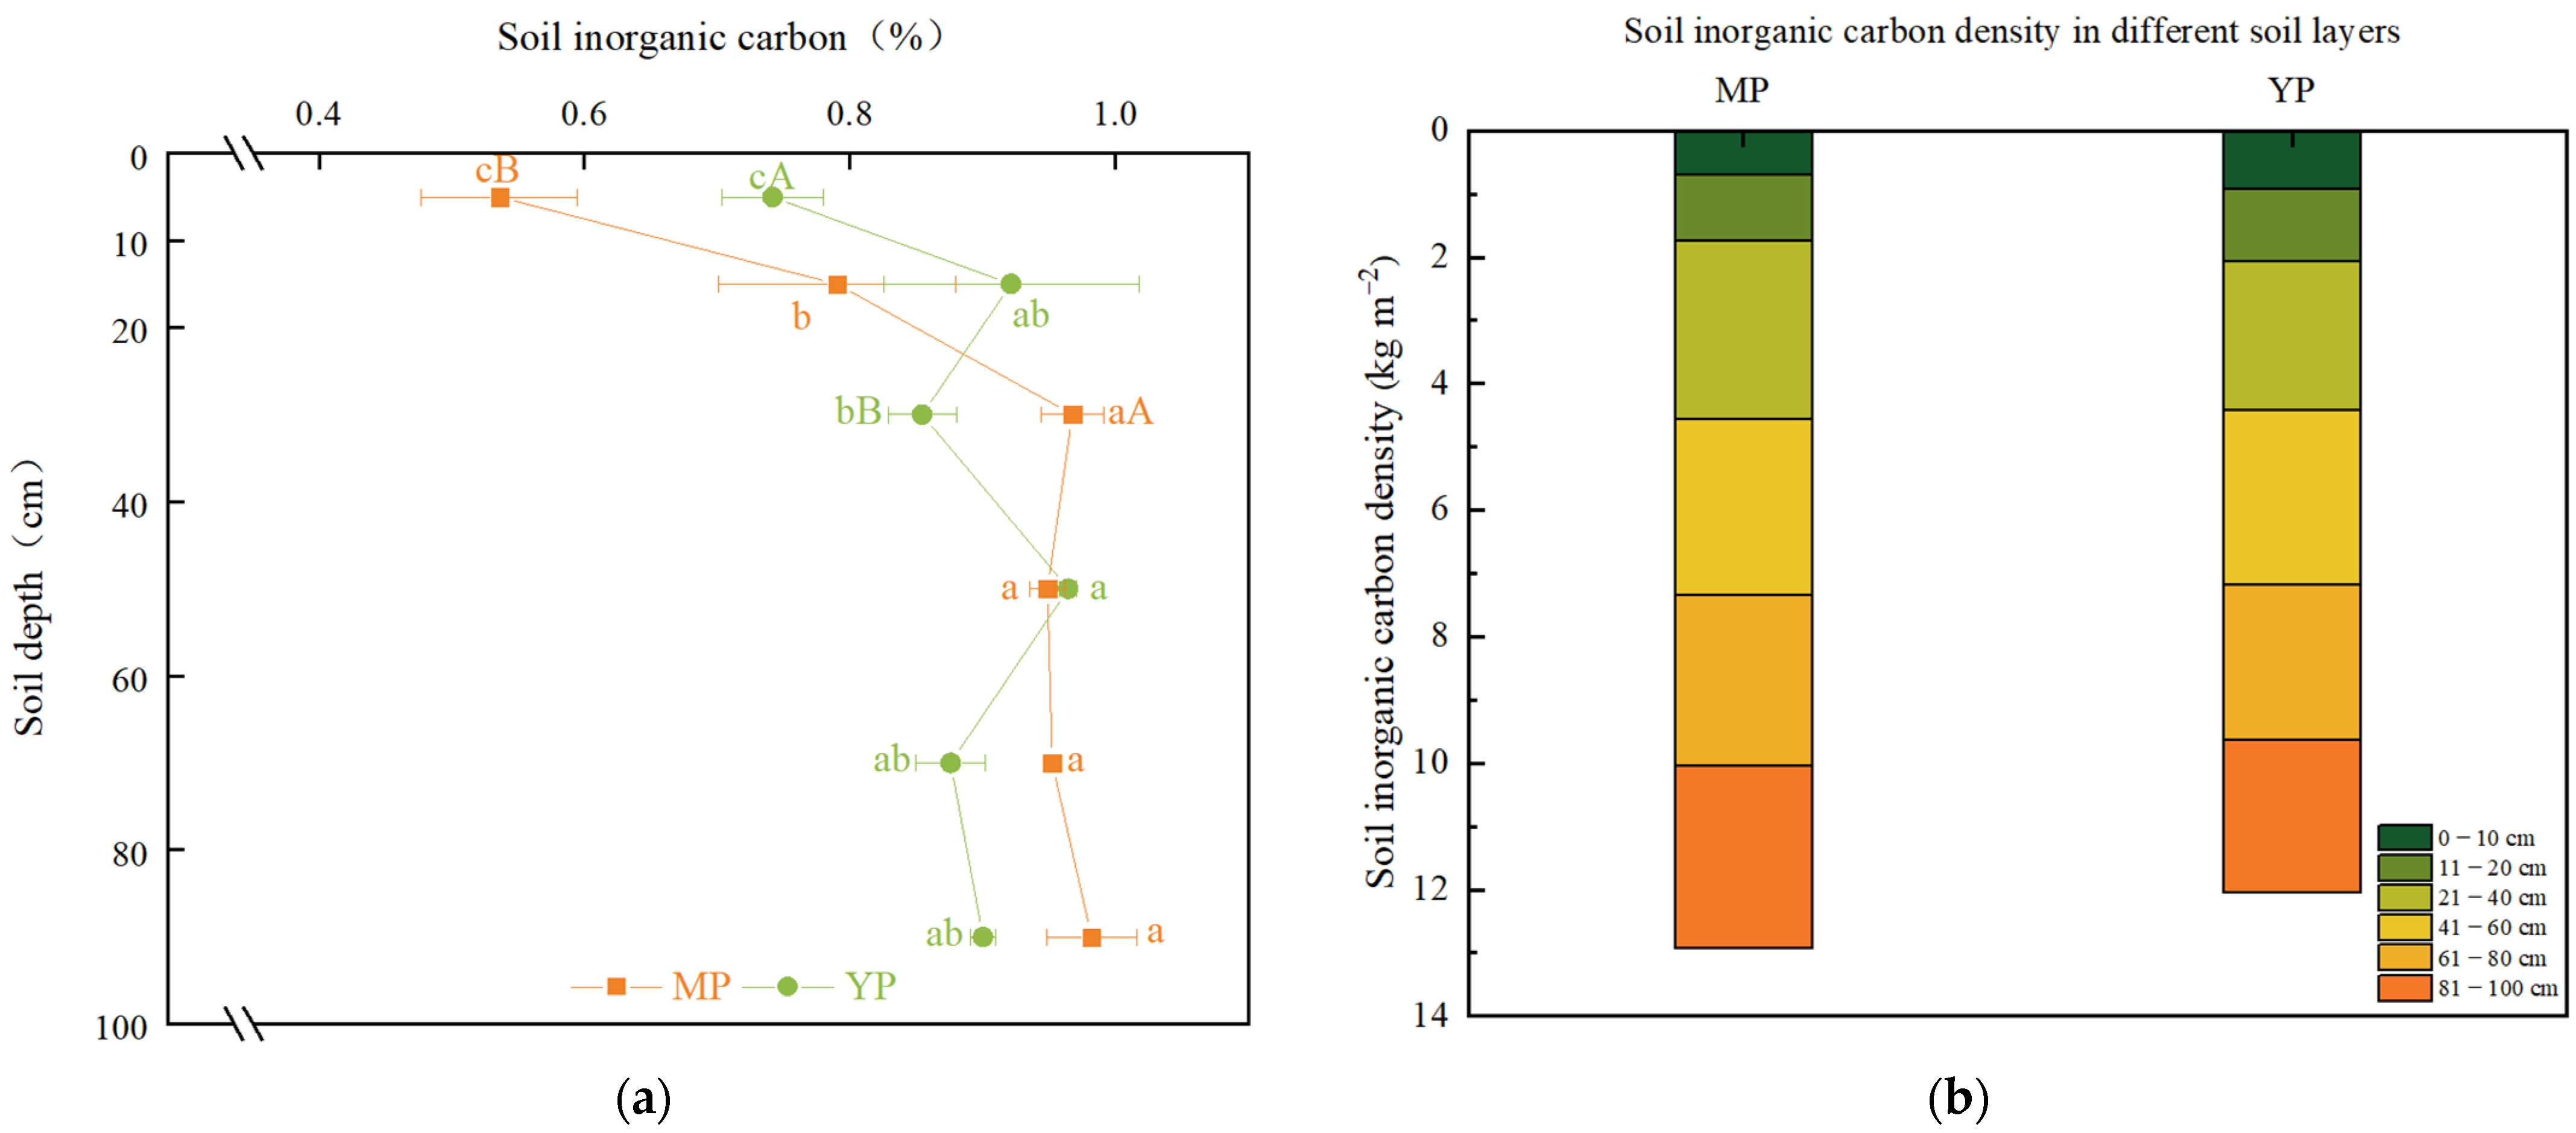
3.2. Soil Inorganic Carbon

The SIC content increased with the increase of soil depth until 40 cm and then leveled off, and the maximum appeared at 81–100 cm (0.98%) in the MP (Figure 3a). The SIC content first increased from 0–10 to 11–20 cm and then displayed a fluctuating trend along the soil profiles, and the maximum appeared at 40–60 cm (0.97%) in the YP (Figure 3a). The minimum SIC both appeared at 0–10 cm, which was 0.54% and 0.74% in the MP and YP, respectively (Figure 3a). When compared to the YP, the SIC content decreased 27.8% at 0–10 cm while it increased 13.2% at 21–40 cm in the MP (Figure 3a). When averaged across soil profiles, there was no difference in SIC content in YP and MP, which was 0.88% and 0.86%, respectively. The variation of SICD with soil depth was similar with that of SIC content (Figure 3b). The SICD within 0–100 cm in the MP (12.93 kg m−2) was higher than that in the YP (12.05 kg m−2) (Figure 3b), primarily due to the higher soil bulk density in the MP (1.42 vs. 1.37 g cm−3).

3.3. Soil Organic Carbon

Contrary to SIC, the SOC content first decreased then levelled off along soil profiles in both plantations (Figure 4). Specifically, the SOC decreased 83.6% from 0.73% at 0–10 cm to 0.12% at 41–60 cm in the YP, while it decreased 87.5% from 0.80% at 0–10 cm to 0.10% at 21–40 cm in the MP (Figure 4). Compared to the YP, the SOC content at 21–40 cm and 61–80 cm decreased 70.6% and 46.7%, respectively in the MP (Figure 4). When averaged across soil profiles, the SOC content was 0.33% and 0.25% in the YP and MP, respectively.

3.4. Soil pH and Electrical Conductivity

The soil pH showed an increasing trend with the increase of soil depth in both plantations (Figure 5a). The soil pH increased from 8.03 to 9.16 and from 8.01 to 9.05 in the YP and MP, respectively (Figure 5a). However, the soil EC was rather constant with the increase of soil depth (Figure 5b). The averaged soil EC across soil profiles was 57.1 and 58.7 ms cm−1 in YP and MP, respectively.

3.5. Soil Water-Soluble Ca2+ and Mg2+

The soil water-soluble Ca2+ content generally decreased with the increase of soil depth in both plantations (Figure 6a). The averaged soil water-soluble Ca2+ across 0–100 cm was 62.0 and 66.5 mg kg−1 in the YP and MP, respectively. The vertical distribution of soil water-soluble Mg2+ was exactly contrary to that of the water-soluble Ca2+ in both plantations (Figure 6b). Compared to the YP, the soil water-soluble Ca2+ increased 18.3% at 41–100 cm (Figure 6a); however, the soil water-soluble Mg2+ decreased 32.7% at 21–100 cm in the MP (Figure 6b). The averaged soil water-soluble Mg2+ across 0–100 cm was 9.27 and 6.87 mg kg−1 in the YP and MP, respectively.

3.6. Factors Influencing Soil Inorganic Carbon Content

Correlation analysis showed that SIC was negatively correlated with SOC and positively correlated with soil pH and water-soluble Mg2+ (Table 2). SEM showed that SOC was the controlling factor of SIC (Figure 7a). Soil water-soluble Ca2+ could indirectly influence SIC, i.e., soil water-soluble Ca2+ → soil pH / SOC → SIC (Figure 7a). The total effect of SOC on SIC was the highest (−0.97), followed by soil pH (0.79), water-soluble Mg2+ (0.53) and water-soluble Ca2+ (−0.60) (Figure 7b).

4. Discussion

4.1. Vertical Distribution of Soil Inorganic Carbon Content and Density

In our study, the SIC content first increased then levelled off with the increase of soil depth, ranging from 0.54% to 0.98% in the studied plantations (Figure 3a). The vertical distribution of SIC within 0–100 cm was consistent with Wang et al. [28] who studied the saline soil in the southern Gurbantongute desert. Gao et al. [29] reported that SIC content was 2.64–5.24 g kg−1 in poplar plantations aged 8–30 a in Northwest China. Lu et al. [30] found that the SIC content ranged from 10.25 to 12.38 g kg−1 in the cropland under wheat-maize rotation in Loess Plateau. Recently, Yang et al. [21] reported that the SIC and SOC content were in the range of 6.43–13.93 g kg−1 and 1.62–14.43 g kg−1 in coastal wetlands of Northern Jiangsu. The SOC content first decreased then levelled off along 0–100 cm soil profiles, and it ranged from 0.08–0.80% (Figure 4). Wang et al. [31] reported that the SOC content were significantly decreased under 20 cm which was almost less than 1 g kg−1 (20–100 cm) in two of the sample plots in Laizhou Bay. Therefore, the SIC and SOC contents in our study fell within previously reported contents. Yang et al. [11] reported the SICD in the Jiangsu Yancheng Wetland National Reserve-Rare Birds was 12.52 kg m−2 within 0–100 cm, which was similar in our study (12.05 and 12.93 kg m−2, Figure 3b).
The accumulation of SIC in deep soils mainly involved the following two reactions. The CO2 produced by SOC decomposition and root respiration would dissolve in soil moisture (Equation (2)). Furthermore, deep soils usually had high bulk density and low soil porosity, which could increase the pCO2. The high pCO2 would promote the formation of carbonates precipitation (Equation (3)) [32,33,34], thus the SIC content increased in deep soils.
CO2 + H2O ⇌ HCO3 + H+
Ca2+ + HCO3 ⇌ CaCO3 + H+

4.2. The Effect of SOC on SIC

There was a negative relationship between SIC and SOC (Table 2). The finding was in line with previous findings [11,35,36]. Contrary to our finding, some studies found SOC and SIC were positively correlated [21,37,38]. This indicated that the processes involved in organic and inorganic carbon transformations were different in different soil environments. On one hand, the surface soil with high SOC content was rich in vegetation litter and soil microorganisms, which could decompose soil organic matter to produce more H+. The higher H+ would drive the (Equation (4)) to the right direction, leading to the dissolution of SIC [16]. On the other hand, high SOC content was usually accompanied by loose soil structure and high soil permeability, which could increase carbonate dissolution and leaching [13,23,39].
CaCO3 + H+ ⇌ Ca2+ + CO2 + H2O
It is notable that SIC content in the YP was higher than that in the MP at the surface layers (0–10 and 11–20 cm), and it was the opposite at the deep layers (61–80 and 81–100 cm) (Figure 3a). Compared with YP, MP had a higher amount of SOC content in the topsoil (Figure 4). The organic acids produced during the process of SOC decomposition could promote the dissolution of SIC [18]. In addition, the soil water content in the MP was higher than that in the YP (Figure 2a). It was probable that the water-soluble SIC was more prone to leaching along soil profiles and resulted in the lower SIC at surface soils and the higher SIC at the deep soils in the MP.

4.3. The Effect of Soil pH on SIC

Our data indicated that the soil pH increased with the increase of soil depth (Figure 5a). Similar patterns were obtained in previous studies [11,13,29,40]. This might be due to that the soil soluble metal ions, such as Ca2+, Mg2+ were transferred from surface to the deep soil layers due to leaching [13,40]. Our results showed that pH was the second important factor influencing SIC content, and they were positively correlated (Figure 7b, Table 2). On one hand, the accumulation process of SIC led to enhancement of soil pH by consuming H+ [16]. On the other hand, greater alkalinity of the soil has higher buffer capacity for H+, which inhibited the dissolution of soil carbonate and allowed the accumulation of SIC in the deep soils [6,15,41].

4.4. The Effect of Soil Water-Soluble Ca2+ and Mg2+ on SIC

In our study, we found that the soil water-soluble Ca2+ and Mg2+ gradually decreased and increased with the increase of soil depth, respectively (Figure 6). Our result was consistent with a recent study in reed wetlands in the middle-lower Yellow River Delta, China by Guo et al. [42]. The rivers and groundwater could influence the movement of soil water-soluble Ca2+ and Mg2+, thus affected their distribution in the soil profile [43]. Because the water solubility of Mg2+ was higher than that of Ca2+, the soil water-soluble Mg2+ was easier to migrate from the top to the deep layers along the soil profiles. Therefore, soil water-soluble Mg2+ accumulated in the deep soil layers. We found the soil water-soluble Mg2+ decreased 32.7% at 21–100 cm in the MP compared to the YP (Figure 6b). Gao et al. [37] also found that the soil water-soluble Mg2+ in a 8 a poplar plantation was slightly higher than that in a 20 a poplar plantation. This was probably due to that some soil water-soluble Mg2+ was transformed into soil carbonate in the deep soils in the MP (Figure 3a).
Correlation analysis showed that SIC was positively correlated with soil water-soluble Mg2+ rather than soil water-soluble Ca2+ (Table 2). Our result was partially consistent with Shi et al. [6], who found neither the relationship between SIC stock and water-soluble Ca2+ nor that between SIC stock and water-soluble Mg2+ was significant in the wheat-maize croplands of the North China Plain. However, Guo et al. [41] found that SIC was positively correlated with both soil water-soluble Ca2+ and Mg2+ in the croplands of upper Yellow River Delta, China. Water-soluble Ca2+ and Mg2+ not only participated in the accumulation of carbonate, they would be absorbed and utilized by plants, or might be consumed in the leaching process [44]. Recently, Zhang et al. [12] found that soil Ca was the vital factor controlling SIC under different Spartina alterniflora invasion periods in a salt marsh ecosystem. Similarly, Zhang et al. [24] proposed that soil CaO was the factor with the highest importance in controlling SIC dynamic in reclaimed lands. Therefore, the different forms of Ca2+, such as total, water-soluble and exchangeable Ca2+ might impose different effects on SIC content, which could be studied in the future.

5. Conclusions

The vertical distribution and controlling factor of SIC in coastal poplar plantations was first reported in this study. The SIC content first increased from 0–10 cm (0.74%) to 11–20 cm (0.92%) and then displayed a fluctuating trend along soil profiles in the YP. In contrast, the SIC content increased with the increase of soil depth until 40 cm and then leveled off, and the minimum and maximum appeared at 0–10 cm (0.54%) and 81–100 cm (0.98%), respectively, in the MP. SOC content first decreased then levelled off along the soil profiles. The soil water content, bulk density, pH, and water-soluble Mg2+ gradually increased while soil water-soluble Ca2+ gradually decreased along the soil profiles. Correlation analysis showed that SIC was negatively correlated with SOC, but positively correlated with soil pH and water-soluble Mg2+. Both the correlation analysis and SEM showed that the SOC was the most important factor affecting the SIC content in the studied poplar plantations, and there was a trade-off between them. This was probably due to the CO2 which was generated from SOC decomposition promoted the dissolution of SIC.

Author Contributions

Conceptualization, W.L.; methodology, W.L. and S.W.; software, F.Z. and S.W.; validation, W.L., S.W. and F.Z.; formal analysis, W.L. and S.W.; investigation, W.L., S.W. and F.Z.; resources, S.W.; data curation, S.W.; writing—original draft preparation, S.W.; writing—review and editing, W.L.; supervision, W.L.; project administration, W.L.; funding acquisition, W.L. All authors have read and agreed to the published version of the manuscript.

Funding

This research was funded by Natural Science Foundation of Huaian City, Jiangsu Province of China, grant number (HAB202164), and Innovation Foundation of Nanjing Forestry University, grant number (CX2017023).

Institutional Review Board Statement

Not applicable.

Informed Consent Statement

Not applicable.

Data Availability Statement

Dataset and associated codes used in the main results are available upon reasonable request to the corresponding author.

Conflicts of Interest

The authors declare no conflict of interest.

References

  1. Asgari, N.; Ayoubi, S.; Demattê, J.A.M.; Dotto, A.C. Carbonates and organic matter in soils characterized by reflected energy from 350–25,000 nm wavelength. J. Mt. Sci. 2020, 17, 1636–1651. [Google Scholar] [CrossRef]
  2. Yousefifard, M.; Ayoubi, S.; Poch, R.M.; Jalalian, A.; Khademi, H.; Khormali, F. Clay transformation and pedogenic calcite formation on a lithosequence of igneous rocks in northwestern Iran. Catena 2015, 133, 186–197. [Google Scholar] [CrossRef]
  3. Batjes, N.H. Total carbon and nitrogen in the soils of the world. Eur. J. Soil Sci. 2014, 65, 10–21. [Google Scholar] [CrossRef]
  4. Civeira, G. Distribution of Soil Organic and Inorganic Carbon by Soil Taxa in the Central Eastern Pampas of Buenos Aires. Soil Sci. 2013, 178, 120–127. [Google Scholar] [CrossRef]
  5. Yu, P.; Li, Q.; Jia, H.; Li, G.; Zheng, W.; Shen, X.; Diabate, B.; Zhou, D. Effect of Cultivation on Dynamics of Organic and Inorganic Carbon Stocks in Songnen Plain. Agron. J. 2014, 106, 1574–1582. [Google Scholar] [CrossRef]
  6. Shi, H.J.; Zhao, Y.J.; Xu, M.G.; Li, D.W.; Wang, X.J.; Guo, Y. Relationship between soil inorganic carbon and organic carbon in the wheat-maize cropland of the North China Plain. Plant Soil 2017, 418, 423–436. [Google Scholar] [CrossRef]
  7. Mao, N.; Huang, L.; Shao, M. Vertical distribution of soil organic and inorganic carbon under different vegetation covers in two toposequences of the Liudaogou watershed on the Loess Plateau, China. J. Soil Water Conserv. 2018, 73, 479–491. [Google Scholar] [CrossRef] [Green Version]
  8. Yan, A.; Li, B.; Huang, F.; Zhang, W.; Jiang, P.; Sheng, J. Distribution and storage of soil organic and inorganic carbon under different ecological zones in Xinjiang, China. Int. J. Agric. Biol. Eng. 2019, 12, 116–125. [Google Scholar] [CrossRef] [Green Version]
  9. You, M.; Han, X.; Hu, N.; Du, S.; Doane, T.A.; Li, L.-J. Profile storage and vertical distribution (0–150 cm) of soil inorganic carbon in croplands in northeast China. Catena 2020, 185, 104302. [Google Scholar] [CrossRef]
  10. Yu, X.; Zhou, W.; Chen, Y.; Wang, Y.; Cheng, P.; Hou, Y.; Wang, Y.; Xiong, X.; Yang, L. Spatial variation of soil properties and carbon under different land use types on the Chinese Loess Plateau. Sci. Total Environ. 2020, 703, 134946. [Google Scholar] [CrossRef]
  11. Yang, R.; Yang, F. Impacts of Spartina alterniflora invasion on soil inorganic carbon in coastal wetlands in China. Soil Sci. Soc. Am. J. 2020, 84, 844–855. [Google Scholar] [CrossRef]
  12. Zhang, G.; Bai, J.; Zhao, Q.; Jia, J.; Wang, X.; Wang, W.; Wang, X. Soil carbon storage and carbon sources under different Spartina alterniflora invasion periods in a salt marsh ecosystem. Catena 2021, 196, 104831. [Google Scholar] [CrossRef]
  13. Ayoubi, S.; Mokhtari, J.; Mosaddeghi, M.R.; Zeraatpisheh, M. Erodibility of calcareous soils as influenced by land use and intrinsic soil properties in a semiarid region of central Iran. Environ. Monit. Assess. 2018, 190, 192. [Google Scholar] [CrossRef]
  14. Han, X.; Gao, G.; Chang, R.; Li, Z.; Ma, Y.; Wang, S.; Wang, C.; Lü, Y.; Fu, B. Changes in soil organic and inorganic carbon stocks in deep profiles following cropland abandonment along a precipitation gradient across the Loess Plateau of China. Agric. Ecosyst. Environ. 2018, 258, 1–13. [Google Scholar] [CrossRef]
  15. Kim, J.H.; Jobbágy, E.G.; Richter, D.D.; Trumbore, S.E.; Jackson, R.B. Agricultural acceleration of soil carbonate weathering. Glob. Chang. Biol. 2020, 26, 5988–6002. [Google Scholar] [CrossRef] [PubMed]
  16. Zamanian, K.; Pustovoytov, K.; Kuzyakov, Y. Pedogenic carbonates: Forms and formation processes. Earth Sci. Rev. 2016, 157, 1–17. [Google Scholar] [CrossRef]
  17. Ji, C.-J.; Yang, Y.-H.; Han, W.-X.; He, Y.-F.; Smith, J.; Smith, P. Climatic and Edaphic Controls on Soil pH in Alpine Grasslands on the Tibetan Plateau, China: A Quantitative Analysis. Pedosphere 2014, 24, 39–44. [Google Scholar] [CrossRef]
  18. Obear, G.R.; Soldat, D. Soil Inorganic Carbon Accumulation in Sand Putting Green Soils: I. Field Relationships among Climate, Irrigation Water Quality, and Soil Properties. Crop. Sci. 2016, 56, 452–462. [Google Scholar] [CrossRef]
  19. Chang, R.; Fu, B.; Liu, G.; Wang, S.; Yao, X. The effects of afforestation on soil organic and inorganic carbon: A case study of the Loess Plateau of China. Catena 2012, 95, 145–152. [Google Scholar] [CrossRef]
  20. Li, J.H.; Hou, Y.L.; Zhang, S.X.; Li, W.J.; Xu, D.H.; Shi, X.M.; Knops, J.M. Fertilization with nitrogen and/or phosphorus lowers soil organic carbon sequestration in alpine meadows. Land Degrad. Dev. 2018, 29, 1634–1641. [Google Scholar] [CrossRef]
  21. Yang, P.; Shu, Q.; Liu, Q.; Hu, Z.; Zhang, S.; Ma, Y. Distribution and factors influencing organic and inorganic carbon in surface sediments of tidal flats in northern Jiangsu, China. Ecol. Indic. 2021, 126, 107633. [Google Scholar] [CrossRef]
  22. Li, J.; Awasthi, M.K.; Zhu, Q.; Chen, X.; Wu, F.; Wu, F.; Tong, X. Modified soil physicochemical properties promoted sequestration of organic and inorganic carbon synergistically during revegetation in desertified land. J. Environ. Chem. Eng. 2021, 9, 106331. [Google Scholar] [CrossRef]
  23. Tong, L.; Fang, N.; Xiao, H.; Shi, Z. Sediment deposition changes the relationship between soil organic and inorganic carbon: Evidence from the Chinese Loess Plateau. Agric. Ecosyst. Environ. 2020, 302, 107076. [Google Scholar] [CrossRef]
  24. Zhang, H.; Yin, A.; Yang, X.; Wu, P.; Fan, M.; Wu, J.; Zhang, M.; Gao, C. Changes in surface soil organic/inorganic carbon concentrations and their driving forces in reclaimed coastal tidal flats. Geoderma 2019, 352, 150–159. [Google Scholar] [CrossRef]
  25. Liao, X.L.; Chen, Y.J.; Ruan, H.H.; Malghani, S. Incapability of biochar to mitigate biogas slurry induced N2O emissions: Field investigations after 7 years of biochar application in a poplar plantation. Sci. Total Environ. 2021, 794, 148572. [Google Scholar] [CrossRef]
  26. Tian, Z.F. Carbon Pool of Poplar Industry in Northern Jiangsu and the Assessment of Its Carbon Value; Nanjing Forestry University Press: Nanjing, China, 2017. [Google Scholar]
  27. Wei, C.; Yu, Q.; Bai, E.; Lu, X.; Li, Q.; Xia, J.; Kardol, P.; Liang, W.; Wang, Z.; Han, X. Nitrogen deposition weakens plant-microbe interactions in grassland ecosystems. Glob. Chang. Biol. 2013, 19, 3688–3697. [Google Scholar] [CrossRef]
  28. Wang, Y.; Wang, Z.; Li, Y. Storage/Turnover Rate of Inorganic Carbon and Its Dissolvable Part in the Profile of Saline/Alkaline Soils. PLoS ONE 2013, 8, e82029. [Google Scholar] [CrossRef] [PubMed]
  29. Gao, Y.; Dang, P.; Zhao, Q.; Liu, J.; Liu, J. Effects of vegetation rehabilitation on soil organic and inorganic carbon stocks in the Mu Us Desert, northwest China. Land Degrad. Dev. 2018, 29, 1031–1040. [Google Scholar] [CrossRef]
  30. Lu, T.; Wang, X.; Zhang, W. Total and dissolved soil organic and inorganic carbon and their relationships in typical loess cropland of Fengu Basin. Geosci. Lett. 2020, 7, 1–13. [Google Scholar] [CrossRef]
  31. Wang, Q.; Song, J.; Cao, L.; Li, X.; Yuan, H.; Li, N. Distribution and storage of soil organic carbon in a coastal wetland under the pressure of human activities. J. Soils Sediments 2017, 17, 11–22. [Google Scholar] [CrossRef]
  32. Zhao, W.; Zhang, R.; Cao, H.; Tan, W. Factor contribution to soil organic and inorganic carbon accumulation in the Loess Plateau: Structural equation modeling. Geoderma 2019, 352, 116–125. [Google Scholar] [CrossRef]
  33. Carmia, I.; Kronfelda, J.; Murray, M. Sequestration of atmospheric carbon dioxide as inorganic carbon in the unsaturated zone under semi-arid forests. Catena 2019, 173, 93–98. [Google Scholar] [CrossRef] [Green Version]
  34. Lu, W.; Zhang, Y.; Yao, Y.; Wu, Y.; Chen, H.; Zhang, H.; Yu, J.; Shen, C.; Liu, Q.; Ruan, H. Biochar-Induced Priming Effects in Young and Old Poplar Plantation Soils. Phyton 2020, 89, 13–26. [Google Scholar] [CrossRef]
  35. Liu, Y.; Dang, Z.-Q.; Tian, F.-P.; Wang, D.; Wu, G.-L. Soil Organic Carbon and Inorganic Carbon Accumulation Along a 30-year Grassland Restoration Chronosequence in Semi-arid Regions (China). Land Degrad. Dev. 2016, 28, 189–198. [Google Scholar] [CrossRef] [Green Version]
  36. Zuo, Y.; Li, J.; Zeng, H.; Wang, W. Vertical pattern and its driving factors in soil extracellular enzyme activity and stoichiometry along mountain grassland belts. Biogeochemistry 2018, 141, 23–39. [Google Scholar] [CrossRef]
  37. Gao, Y.; Dang, P.; Zhao, Z. Effects of afforestation on soil carbon and its fractions: A case study from the Loess Plateau, China. J. For. Res. 2018, 29, 1291–1297. [Google Scholar] [CrossRef]
  38. Li, Y.; Fu, C.; Zeng, L.; Zhou, Q.; Zhang, H.; Tu, C.; Wei, J.; Li, L.; Luo, Y. Carbon accumulation in the red clay layer of the subsoil in a major river delta: Contribution of secondary carbonate. Catena 2020, 186, 104391. [Google Scholar] [CrossRef]
  39. Lu, W.; Zha, Q.; Zhang, H.; Chen, H.Y.; Yu, J.; Tu, F.; Ruan, H. Changes in soil microbial communities and priming effects induced by rice straw pyrogenic organic matter produced at two temperatures. Geoderma 2021, 400, 115217. [Google Scholar] [CrossRef]
  40. Cemek, B.; Güler, M.; Kiliç, K.; Demir, Y.; Arslan, H. Assessment of spatial variability in some soil properties as related to soil salinity and alkalinity in Bafra plain in northern Turkey. Environ. Monit. Assess. 2006, 124, 223–234. [Google Scholar] [CrossRef] [PubMed]
  41. Guo, Y.; Wang, X.; Li, X.; Wang, J.; Xu, M.; Li, D. Dynamics of soil organic and inorganic carbon in the cropland of upper Yellow River Delta, China. Sci. Rep. 2016, 6, 36105. [Google Scholar] [CrossRef]
  42. Guo, Y.; Wang, X.; Li, X.; Xu, M.; Li, Y.; Zheng, H.; Luo, Y.; Smith, P. Impacts of land use and salinization on soil inorganic and organic carbon in the middle-lower Yellow River Delta. Pedosphere 2021, 31, 839–848. [Google Scholar] [CrossRef]
  43. Monger, H.C.; Kraimer, R.A.; Khresat, S.; Cole, D.R.; Wang, X.; Wang, J. Sequestration of inorganic carbon in soil and groundwater. Geology 2015, 43, 375–378. [Google Scholar] [CrossRef]
  44. West, T.O.; McBride, A.C. The contribution of agricultural lime to carbon dioxide emissions in the United States: Dissolution, transport, and net emissions. Agric. Ecosyst. Environ. 2005, 108, 145–154. [Google Scholar] [CrossRef]
Figure 1. Study location in the eastern coast of China, the satellite image was obtained from 1:4 million China soil type map.
Forests 13 00083 g001
Figure 2. Changes of soil water content (a) and soil bulk density (b) along 0−100 cm soil profiles in the mature (MP) and young poplar (YP) plantations. Different lowercase letters denote significant differences among different depths within the same plantation; while different uppercase letters denote significant differences between different plantations within the same soil depth (p < 0.05).
Forests 13 00083 g002
Figure 3. Changes of soil inorganic carbon (a) and soil inorganic carbon density (b) along 0–100 cm soil profiles in the mature (MP) and young poplar (YP) plantations. Different lowercase letters denote significant differences among different depths within the same plantation; while different uppercase letters denote significant differences between different plantations within the same soil depth (p < 0.05).
Forests 13 00083 g003
Figure 4. Changes of soil organic carbon along 0−100 cm soil profiles in the mature (MP) and young poplar (YP) plantations. Different lowercase letters denote significant differences among different depths within the same plantation; while different uppercase letters denote significant differences between different plantations within the same soil depth (p < 0.05).
Forests 13 00083 g004
Figure 5. Changes of soil pH (a) and soil electrical conductivity (b) along 0−100 cm soil profiles in the mature (MP) and young poplar (YP) plantations. Different lowercase letters denote significant differences among different depths within the same plantation; while different uppercase letters denote significant differences between different plantations within the same soil depth (p < 0.05).
Forests 13 00083 g005
Figure 6. Changes of soil water-soluble Ca2 + (a) and Mg2 + (b) along 0−100 cm soil profiles in the mature (MP) and young poplar (YP) plantations. Different lowercase letters denote significant differences among different depths within the same plantation; while different uppercase letters denote significant differences between different plantations within the same soil depth (p < 0.05).
Forests 13 00083 g006
Figure 7. SEM model analysis of SIC and soil physicochemical properties in poplar plantations (a) and the standardized total effects (b). SEM model analysis (a) explains the direct or indirect effects of soil physicochemical properties on SIC content; the SEM model was used to calculate the standardized total effect (direct effect + indirect effect) (b). Gray dashed arrows are negative correlations and blue solid arrows are positive correlations; the numbers next to the lines represent the standardized path coefficients and the arrow widths are proportional to the magnitude of the path coefficients. Red numbers represent significant differences (** p < 0.01).
Forests 13 00083 g007
Table 1. The stand characteristics in the young (YP) and mature poplar (MP) plantations.
Age of Plantation
(a)
Stand Density (Plants ha−1)Row Spacing
(m × m)
Mean Height (m)Mean DBH *
(cm)
Canopy Density
(%)
74174 × 619.618.985
261086 × 829.835.660
*: DBH means diameter at breast height.
Table 2. Correlation analysis between soil inorganic carbon content and physiochemical properties (n = 36).
IndicatorsSICSOCpHECWater-Soluble Ca2+Water-Soluble Mg2+Soil Water
Content
SIC1
SOC−0.860 **1
pH0.772 **−0.920 **1
EC−0.122−0.1260.2071
Water-soluble Ca2+−0.3030.404 *−0.498 **−0.1281
Water-soluble Mg2+0.334 *−0.382 *0.433 **0.073−0.852 **1
Soil water content0.2050.574 **0.593 **0.457 **−0.368 *0.3181
Note: * p < 0.05, ** p < 0.01.
Publisher’s Note: MDPI stays neutral with regard to jurisdictional claims in published maps and institutional affiliations.

