Abstract
Karst rocky desertification control through the conversion of cropland to economic forest is vital for vegetation recovery and the alleviation of distinct contradiction between ecological conservation and economic development. To evaluate the sustainability of orchard systems from the perspectives of ecosystem and economic services, we employed emergy analysis for the comprehensive and quantitative assessment of two orchard system types: (1) mango monoculture (MM) and macadamia monoculture (NM) and (2) mango Vicia angustifolia intercropping (MVI) and macadamia Desmodium intortum intercropping (NDI). In the past, these areas were converted from a maize field (MF) in the southwest karst area of China. Our results showed that, compared to the MF, the total emergy input in monoculture orchards (NM and NM) decreased by 8.99% and 35.25%, and the economic profit (EP) increased by 20,406.57 and 114,406.32 RMB·ha−1, respectively. However, the non-renewable environmental input (energy loss of soil, SOM reduction, and irrigation water) still accounted for 43.25% and 62.01% in the total emergy input. After conversion to orchard legume herb intercropping (MVI and NDI), purchased resource inputs accounted for 86.36% and 68.20% of the total emergy input. Orchard legume herb intercropping further increased the EP, while improving ecosystem services and providing the capability for groundwater recharge, soil conservation, and soil carbon sequestration. The intercropping orchards were relatively sustainable from the view of economic and ecosystem services (EISD > 3.18), due to lower environmental loading ratios (ELR < 1.15), higher emergy yield ratio (EYR > 0.89), and economic output/input ratio (O/I ratio > 2.41). The integrated pest management simulations indicated that, compared to intercropping systems, the renewable percent (R%) and emergy sustainability index (ESI) of the scenario simulations (MVI-O and NDI-O) increased by 17.61% and 10.51%, respectively. These results suggest that integrated pest management is an effective method to improve the short-term sustainability of the orchard system. Therefore, the management of intercropped legume herb within an orchard system is an effective way to achieve sustainable development.
1. Introduction
The karst system is a highly fragile and sensitive ecosystem, which accounts for approximately 1/3 of the land area in China and is mainly distributed in the southwestern region [1]. Over the past few decades, the karst ecosystem has experienced degradation, with considerable soil erosion, owing to the destruction of natural vegetation and intensive agricultural activities, which led to serious karst rocky desertification in southwestern China [2]. The rocky desertification covers 6.07 × 10⁴ km2 in the Yunnan–Guizhou–Guangxi area, accounting for 60.3% of rocky desertification area of China, and is most prominent in the Guizhou province, the largest of the three provinces [3]. Rocky desertification has caused the loss of agricultural production, economic production from fruits and herbs, and tourism resources, which has made the already-difficult living conditions of farmers even worse [4]. Moreover, the southwestern karst area in China is the source of the Pearl River, an important water replenishment region of the Yangtze River and a water resource district of the South–North Water Transfer Project [5]. The control of karst rocky desertification in southwestern China would not only directly affect the sustainable development in the region itself, but also indirectly affect the sustainable development in the downstream region, such as the water-receiving area of the South–North Water Transfer Project. An effective strategy is urgently needed to prevent ecosystem degeneration and increase vegetation coverage in the Yangtze River and the Pearl River basin, and to maintain ecological security in this area [6]. Therefore, the comprehensive control of karst rocky desertification in southwest China is essential for the sustainable development of the local society, economy, and ecology.
It is well known that the establishment of sustainability is fundamental to preserving the social, cultural, and economic life of an agroecological system [7]. The sustainable development of fragile ecosystems is the foremost of human concerns, mainly due to the imbalance between a large population and the limited availability of natural resources, especially given the considerable ecosystem degeneration of the karst region [8]. The distinct contradiction between the natural environment and economic development dimensions could be alleviated via the comprehensive control of rocky desertification. The contribution of rocky desertification control to ecological restoration, poverty reduction, and increased sustainability could be assessed by analyzing the interaction between energy and the environment [9]. Emergy is a type of energy analysis that provides an approach to link environmental resources and economic capital [10,11], as a means to measure the overall ecosystem performance and sustainability [12]. Compared to material flow analysis [13,14], substance flow analysis [15,16], ecological footprint [17,18], and life cycle assessment [19,20], emergy analysis could quantify the value of environmental, economic, and social “goods and services” via the normalization of inputs into uniform solar emergy and reveal the complex interactive relationships between the natural environment and economic systems [12,21].
Currently, emergy analysis has been extensively used to evaluate different kinds of agroecological systems, such as cropping systems [22,23,24], rearing systems [25,26,27], livestock systems [28,29], agroforestry systems [30], silvo-pastoral systems [31,32], and circular agricultural systems [33,34]. Asgharipour et al. [22] and Amiri et al. [12] estimated the sustainability rates of different greenhouse vegetable production ecosystems and shallot production systems, respectively, by combining emergy evaluation and economic analysis, and identified the best agricultural management model. Based on a comprehensive quantitative evaluation, Liu et al. [23] noted that corn–soybean rotation systems were not sustainable, due to their high environmental loads and low production yields. Nan et al. [24] applied emergy analysis to demonstrate that optimized irrigation and fertilization can enhance the sustainability of agroecological systems, as evidenced by scenario simulation. Additionally, emergy analysis was also used to analyze the functional orientation of agricultural systems [34] and decision-making in complex multifunctional farming systems from the perspective of resource circulation [32].
Specifically, some researchers have used the concept of emergy to evaluate the ecological–economic benefits of rocky desertification control. Cheng et al. [9] studied the emergy and economic characteristics of three typical rocky desertification control systems in karst areas of Guizhou Province, China, and clarified that the addition of a biogas subsystem could improve the economic benefit density and partially decrease environmental loading. Zou et al. [30] performed scenario analysis by integrating emergy and economic evaluation, showing that both the local government and farmers can adjust the structure of agroforestry ecosystems to enjoy better ecological and economic benefits. In addition, Zhan et al. [35] proposed an approach that combined emergy analysis and eco-hydrological modeling to predict the sustainable development of a karst forest ecosystem after undergoing a series of ecological projects. However, most of the existing research on rocky desertification control measures did not simultaneously consider the value of ecosystem services (water regulation, soil conservation, and carbon sequestration). Therefore, it is necessary to comprehensively evaluate the value and performance of emergy, economy, and ecosystem services after the comprehensive control of rocky desertification.
To implement ecological restoration and poverty reduction strategies in the karst region, the Guizhou provincial government implemented several rocky desertification control projects through the conversion of annual, low-economic-benefit, and large-disturbance maize fields to perennial, high-economic-benefit, and small-disturbance tropical fruit tree orchards (Mangifera indica and Macadamia ternifolia), as of 2013 [3]. More than 8430 ha of maize field in Guizhou province was transformed into Mangifera indica and Macadamia ternifolia orchards by the end of 2020, which are widely distributed in the Beipan River basin and the Nanpan River basin, with the largest area located in the Qianxinan autonomous prefecture. After over 7 years of rocky desertification control and construction, these two river basin formed monoculture and intercropping systems in orchards, i.e., mango (Mangifera indica) monoculture (MM), macadamia (Macadamia ternifolia) monoculture (NM), mango-vetch (Vicia angustifolia, cultivar for legume herb) intercropping (MVI), and macadimia Desmodium intortum (cultivar for legume herb) intercropping (NDI), which were representative of the rocky desertification control modes in these areas. Although all these orchard systems were economically viable, the ability to provide ecosystem services and comprehensive ecological economic characteristics remains unclear, which are fundamental references for devising strategies of regional land use under serious integrated ecological and economic pressure. The objectives of our research were: (1) to compare comprehensive performance by quantifying emergy and ecosystem services and the economic benefit of the two orchard system types (monoculture and intercropping) after conversion from the MF; (2) to assess the sustainability of two types of orchard systems; and (3) to propose optimization strategies for the orchard systems, as well as maximize effective rocky desertification control and sustainable ecological and economic development in the southwest karst region of China.
2. Materials and Methods
2.1. Study Area and Description of the Orchard Systems
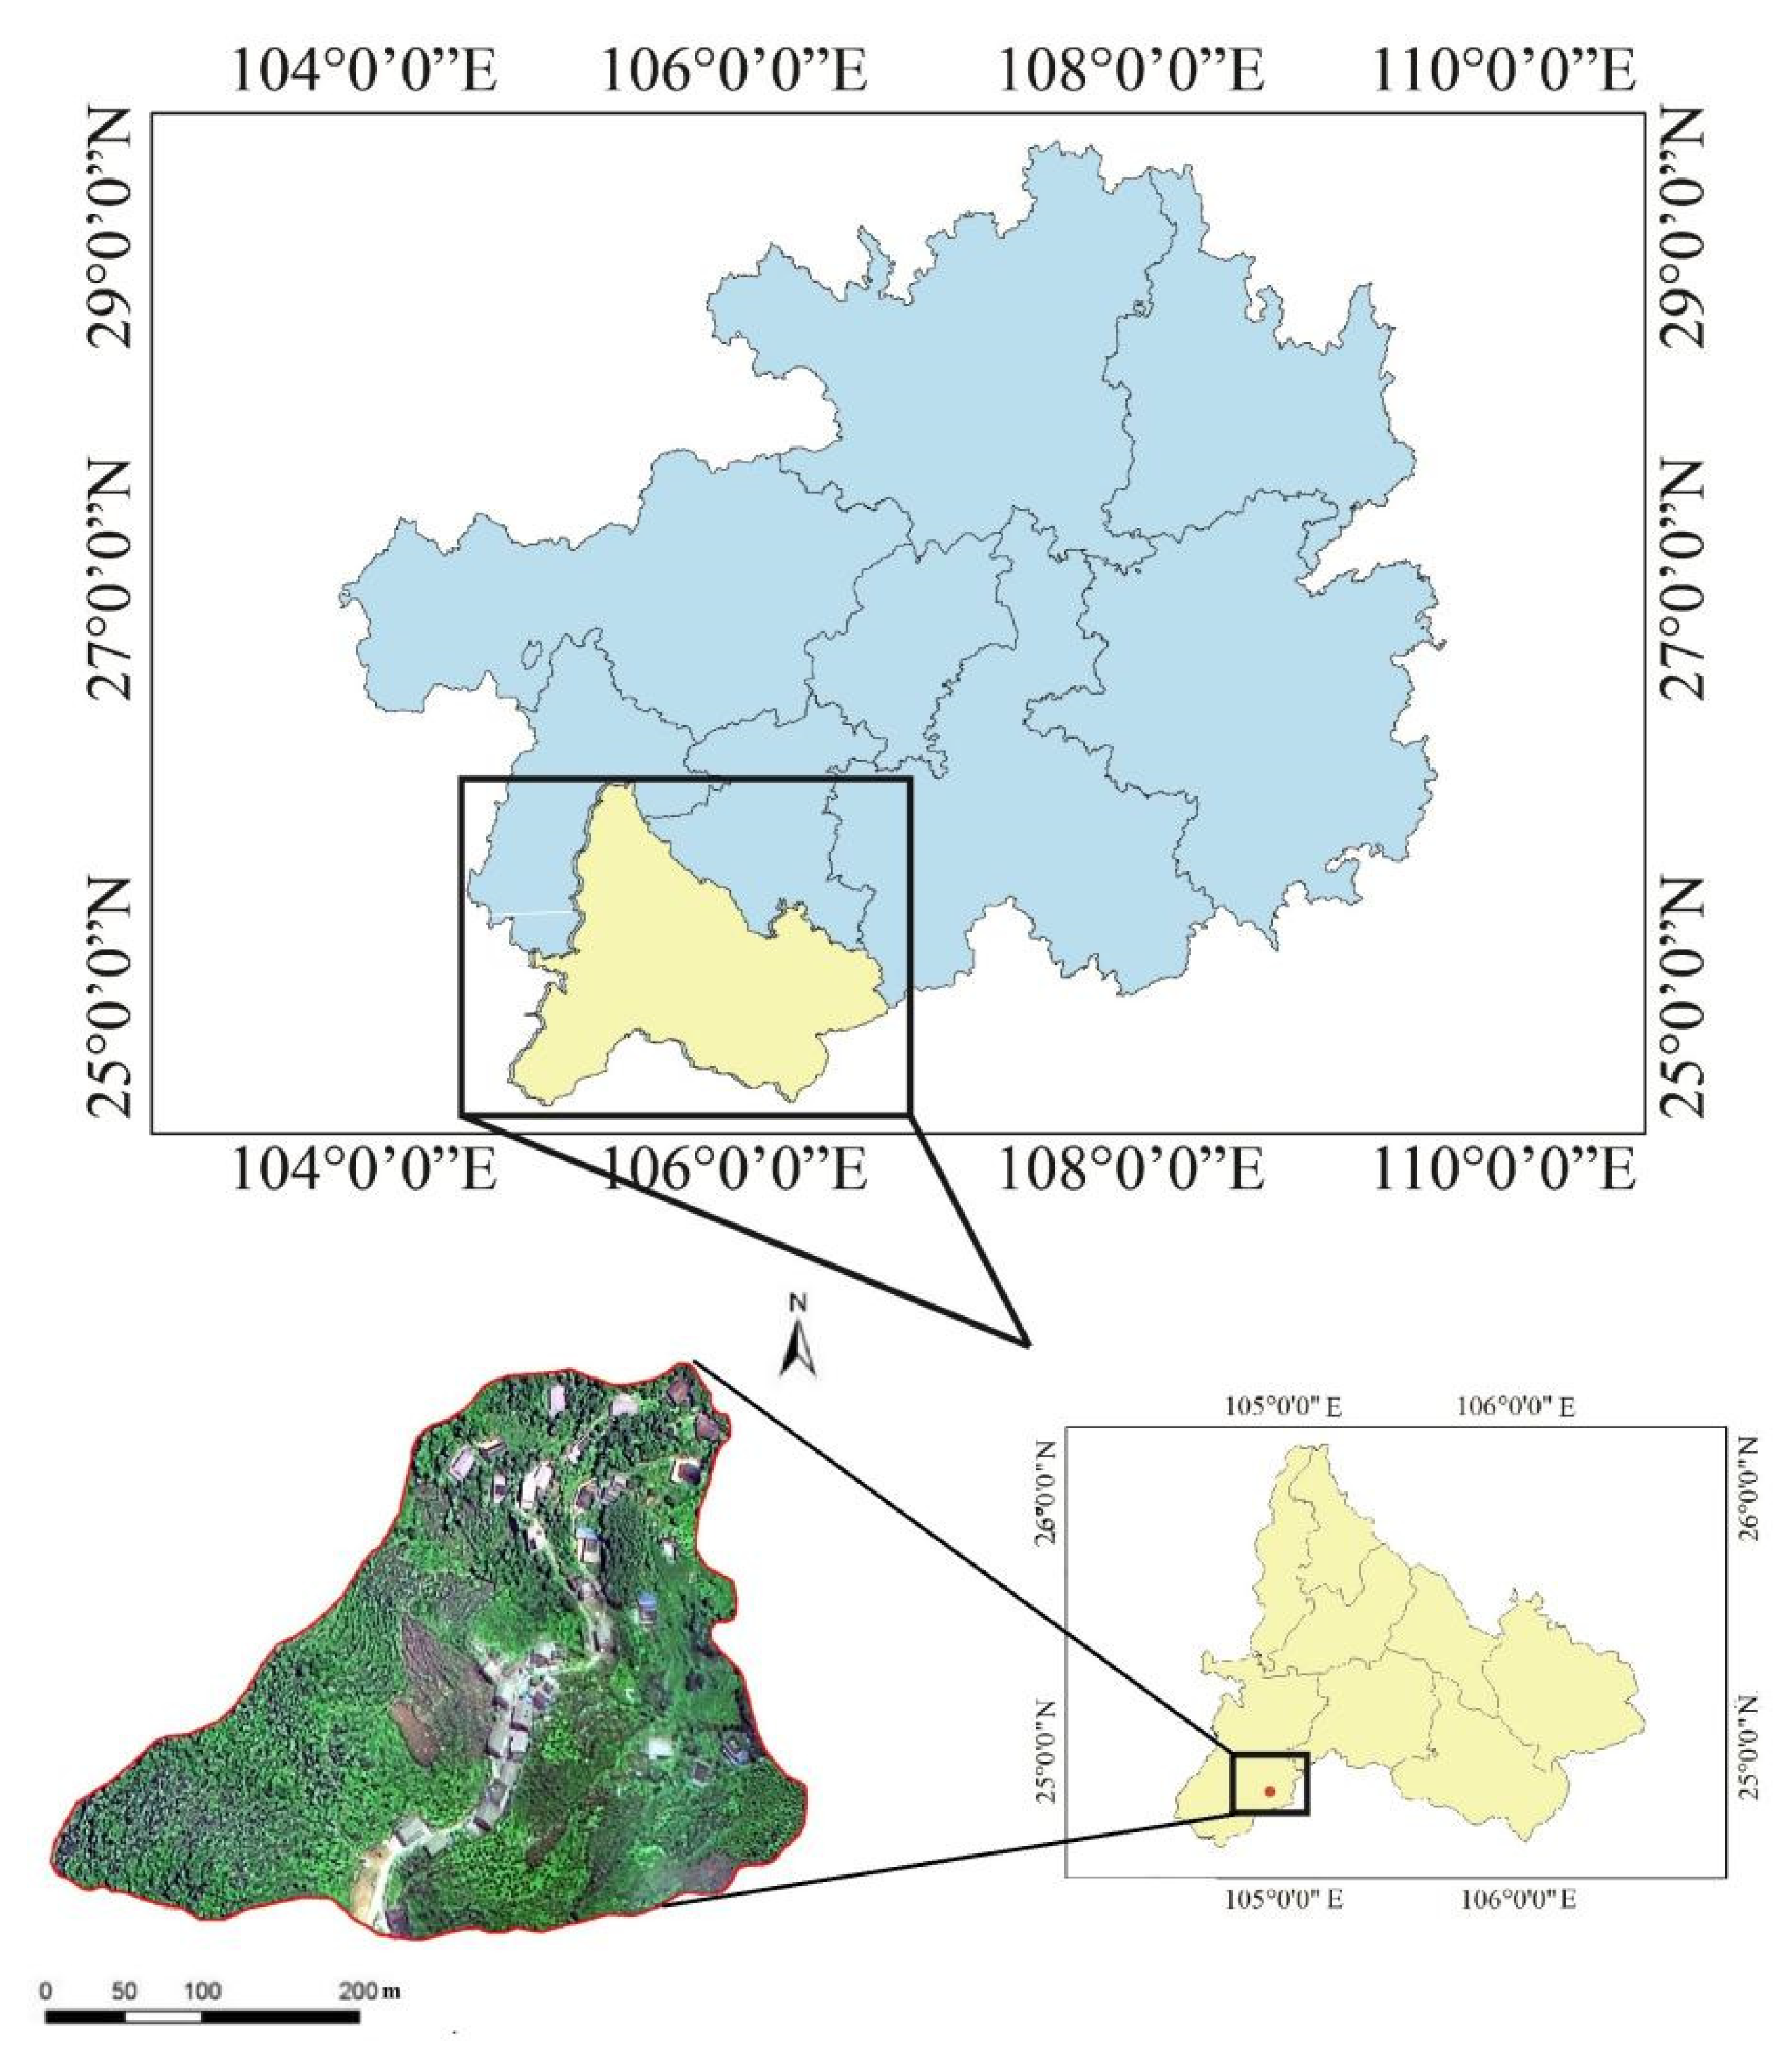
The study site is located in Nanpanjiang Town, Xingyi City, Guizhou Province in China, near the central area of the junction of Guangxi, Yunnan, and Guizhou provinces (113°12′40″ E, 24°52′10″ N). The terrain is high in the northwest and low in the southeast, with a slope of 30°~40° and typical karst geomorphic features. The elevation is 700~1300 m, meaning that it belongs to a zone of low latitude and high elevation, with a subtropical monsoon climate. The annual average temperature is approximately 20.25 °C, and the frost-free period is ~300 days. The annual precipitation is 1000~1500 mm, and the received average solar radiation is about 3.77 × 10⁹ J·m−2 every year. The location of the study area is shown in Figure 1. The soil in the study area was limestone soil with a high rock exposure ratio.
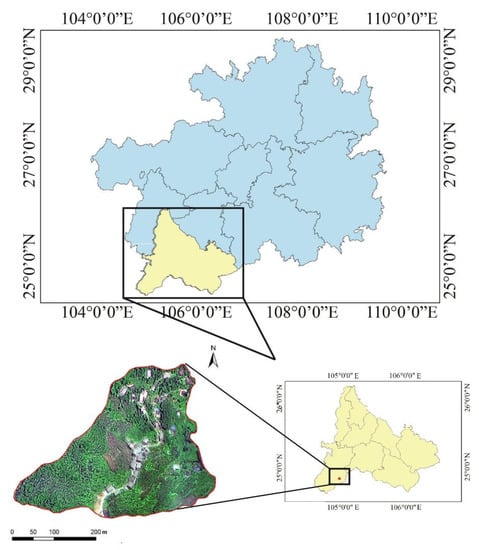
Figure 1.
Location of the study and experimental plots within the Guizhou Province.
The maize field (MF) was the conventional and primary planting system of the local area before rocky desertification control in 2013. Maize, as the primary food crop, required the application of large amounts of compound fertilizer and urea for steady crop productivity. The MF was the control system of this study, with orchard monoculture and orchard legume herb intercropping replacing most of the MF after 2013. Descriptions of the orchard systems are as follows:
In the mango (Mangifera indica) monoculture system (MM), fruit trees were planted directly on sloping land. Mango seedlings were planted at a density of 670~820 tree ha−1 and did not fruit until 4 years after planting. They bloom from February to April each year, and fruits are subsequently harvested from July to August.
Macadamia (Macadamia ternifolia) monoculture (NM) was another orchard system that developed in the study area. Macadamia seedlings were planted at a density of 400~492 tree ha−1 and did not fruit until 4 years after planting. The annual flowering period spans from March to April every year, and fruits are subsequently harvested from September to October.
The mango Vicia angustifolia intercropping system (MVI) was developed from the MM system. The legume herb management of V. angustifolia was sown 3 years after the transplantation of the mango seedlings, in September and October, at a depth of 10 cm and a sowing rate of 5.5 kg ha−1. There was no subsequent demand for weeding in the orchard, due to the V. angustifolia crop smothering all other understory plants in the orchard. The legume was cut once or twice per year, depending on the growth rate. Plant litters were evenly distributed on the soil surface.
The macadamia Desmodium intortum intercropping system (NDI) was developed from the NM system. The D. intortum seeds were sown 3 years after the transplantation after macadamia seedlings were transplanted, in September and October, at a depth of 10 cm and a sowing rate of 5.5 kg ha−1. Like the MVI system, the legume herb (D. intortum) was also used as green manure and returned to the orchard soil the following April.
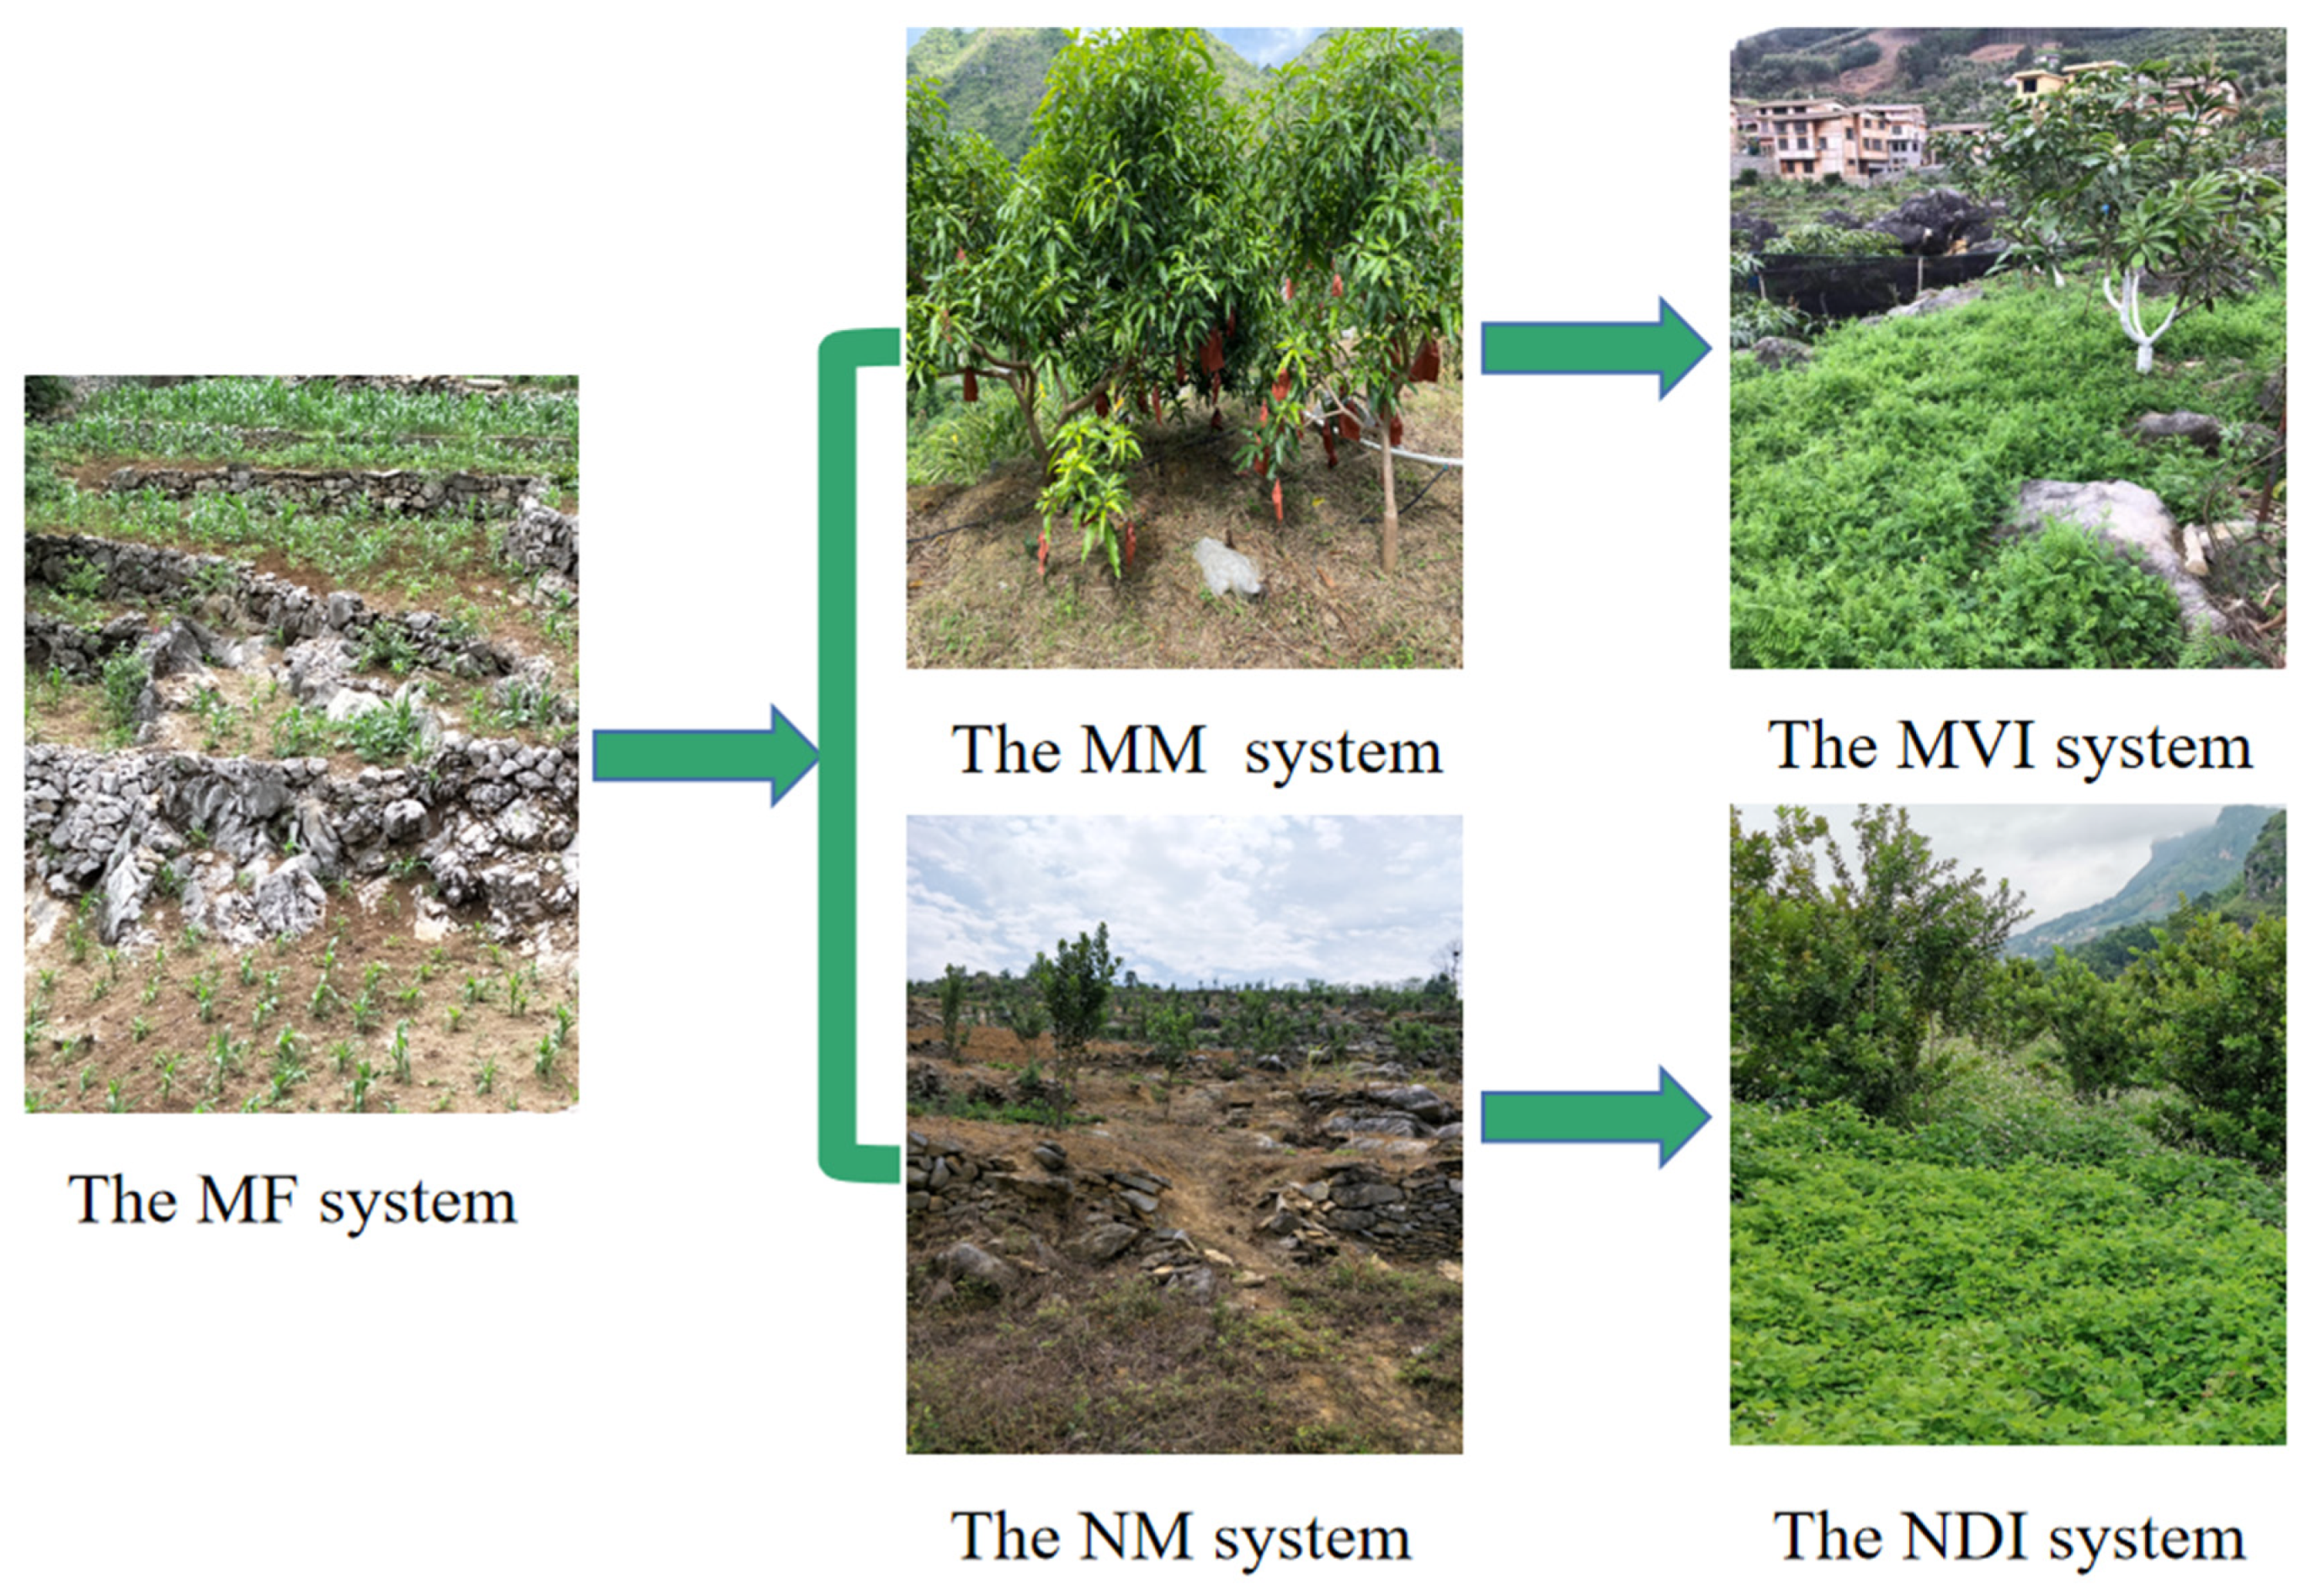
The production management details are shown in Table 1, and the study plots of the five planting systems are shown in Figure 2.

Table 1.
Details of the basic production operations in five planting systems.
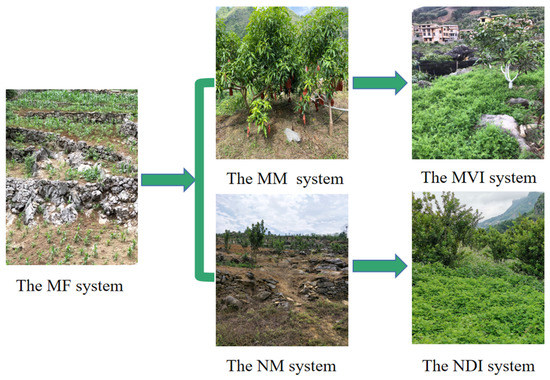
Figure 2.
The five planting systems in karst rocky desertification areas.
2.2. Collection of Data
Meteorological data (solar radiation and precipitation, etc.) of the study area were retrieved from the National Weather Service of China. The soil physicochemical properties (SOC, TN, TP, and TK) of the five planting systems were obtained from measurements made during the study. The SOC content was quantified by wet digestion with K2Cr2O7 oxidation. The TN was analyzed using the Kjeldahl method. The TP was determined using the molybdenum blue colorimetric method after digestion with H2SO4-HClO4. The TK was determined by NaOH alkali fusion-flame photometry. The soil samples were collected with a soil auger, from five points along an S linear transect within each plot (20 × 20 m), from 0–20 cm depth, and each plot had 3 replicates. The air-dried samples were ground gently, sieved through a 2 mm mesh, and gently homogenized. Recognizable gravel, debris, crop residues, and soil macrofauna were removed manually. The soils were stored at 4 ℃, until their physicochemical properties were analyzed. The excessive use of arable land for cultivation has resulted in considerable ecosystem degeneration in the karst region, including soil SOM, soil, and runoff losses. Thus, it was necessary to calculate these losses to evaluate the sustainability of the karst systems. On March 10 of 2019 and March 10 of 2020, soil samples were taken from the five planting systems to determine the changes in SOM content. In our study area, we selected cultivated slopes of the five systems. The five slopes had a width of 6 m and a length of 25. These five slopes were established in 2014 to simulate soil erosion and runoff loss in cultivated slopes. Table 2 describes the soil physicochemical properties; vegetation coverage; and the changes in SOM content, soil loss, and runoff loss for each planting system. The inputs and outputs of the systems (such as machinery and human labor, etc.) were determined through field investigation and measurement in the study area. All management and market information of the systems was acquired by interviewing the farmers.

Table 2.
The soil physicochemical properties, vegetation coverage, soil erosion, and runoff loss for different planting systems.
2.3. Emergy Analysis
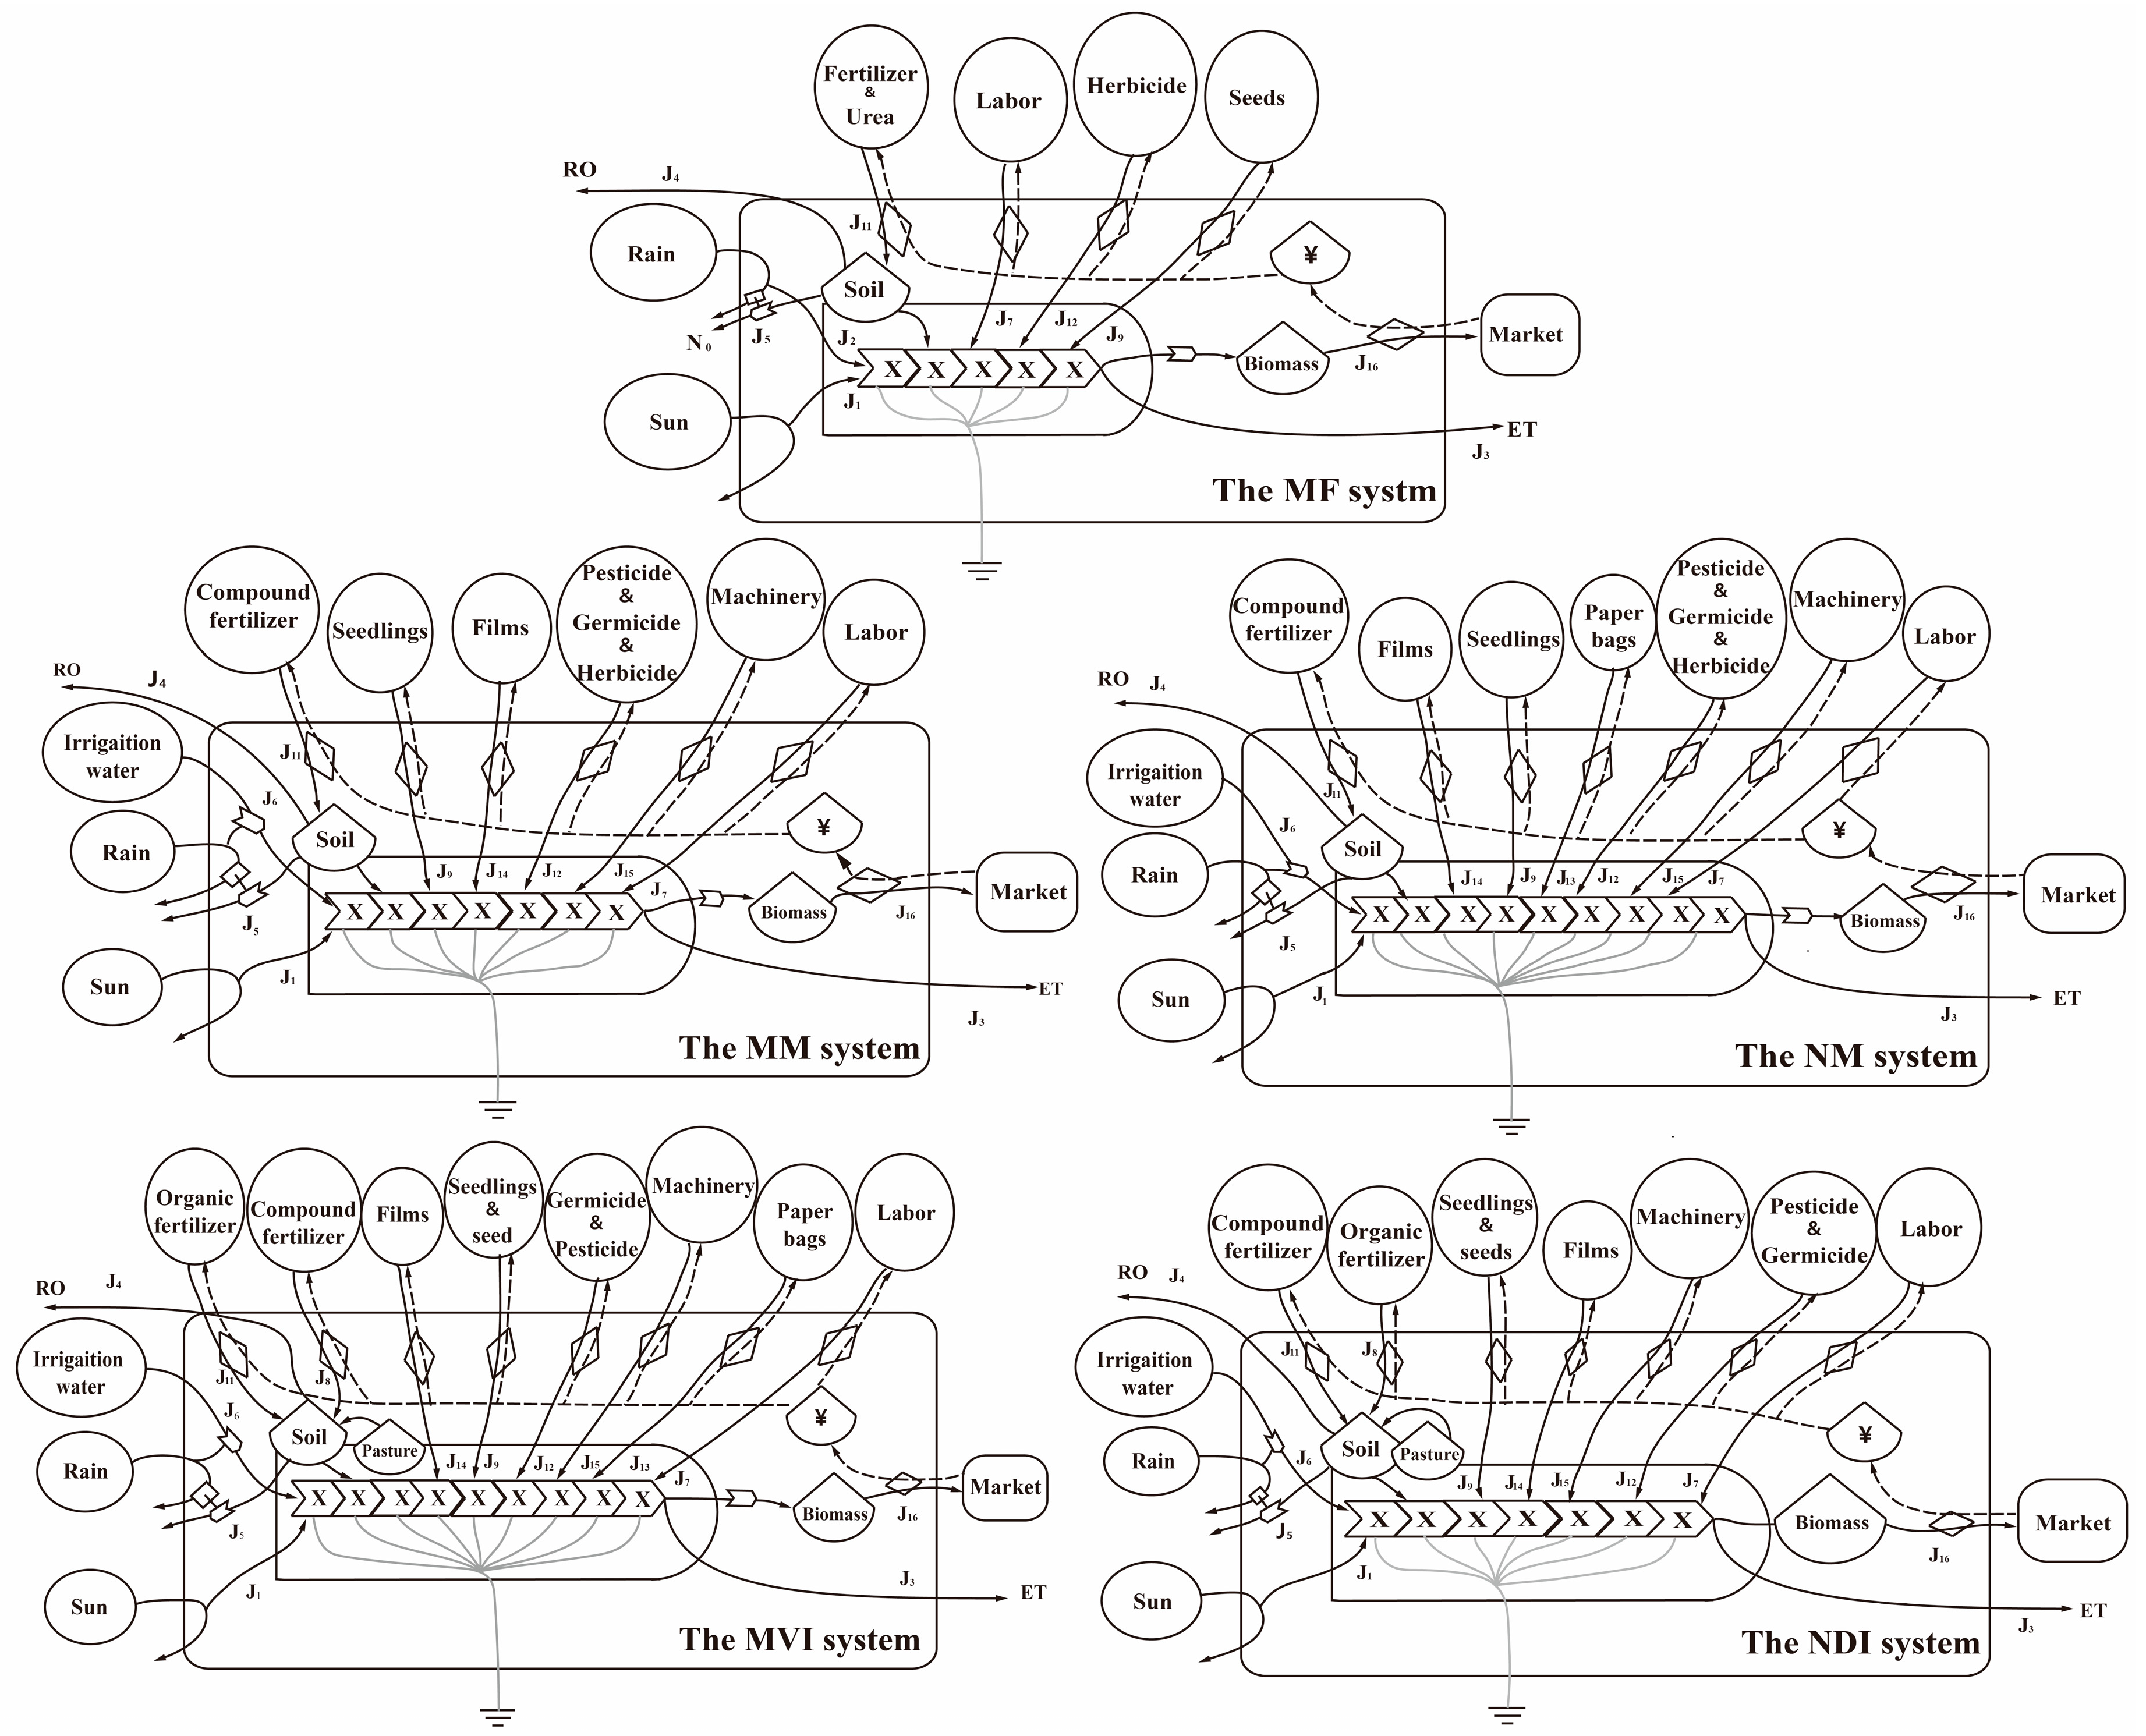
After the concept of emergy was first proposed by Odum [36], Ulgiati [37] and Campbell et al. [38] continued to refine the calculation process of the emergy method. The first step was to define the boundary of the systems. The boundary and emergy flow diagrams of the five planting systems are shown in Figure 3. A scientific and reasonable system boundary is beneficial to achieve an objective and accurate evaluation of the ecosystem.
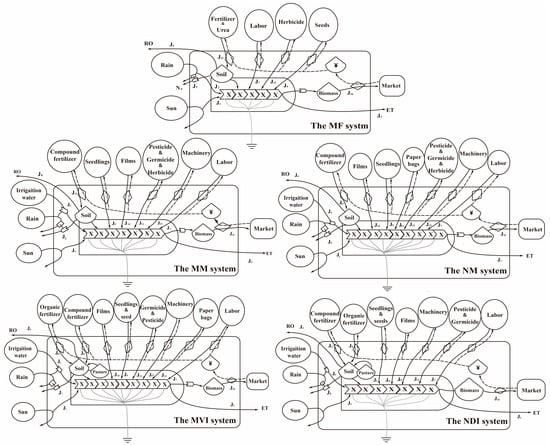
Figure 3.
Emergy system diagrams for the five planting systems.
The second step was to calculate the inputs and outputs of the systems. The raw data were classified into renewable environment resources (R), non-renewable environment resources (No), and purchased resources. Finally, the emergy flow diagrams of the systems were designed according to the distinct inputs and outputs. The use of energy system language (ESL) not only distinctly implies the basic structure of the systems, but also reflects the relationship between what is inside and outside the systems, and the main direction of the emergy flows.
The purchased resources were further classified into renewable purchased resources (FR) and non-renewable purchased resources (FN) using renewability factors (RNFs), wherein the RNFs of human labor, organic fertilizers, seedlings, and seeds (legume herb) were attached at 10%, 80%, 25%, and 25%, respectively, as described by Asgharipour et al. [39] and Ulgiati et al. [37] The non-renewable purchased resources (FN) included pesticides, chemical fertilizers, 90% of human labor, 20% of organic fertilizers, 75% of seedlings, and 75% of seeds. Table 3 show the various inputs and outputs flows based on physical units of the five planting systems. Table 4 represents the emergy values for all products and services, which was obtained by multiplying the inputs in Table 3 by the unit energy values (sej·g−1, sej·J−1, or sej ¥−1). Eventually, an emergy evaluation indicator system suitable for this research was determined. These indicators are ordinarily applicable to evaluating the sustainability of agricultural systems [40,41,42]. The integrated formula and expression of indicators are given in Table 5. The global emergy baseline was 12 × 1024 sej·yr−1 in this study [43].

Table 3.
Natural and economic flows of various planting systems in unit: ha−1. The renewable factors of input flows and the symbols in this table correspond to Figure 3.

Table 4.
The emergy input of various planting systems (emergy unit: sej·ha−1).

Table 5.
Specifications and expressions of emergy and economic indicators used to evaluate planting systems.
2.4. Ecosystem Services Based on Emergy Analysis
Emergy analysis can assess the changes and processes of ecosystem services by analyzing material transfer and energy flow within a system [44]. The conversion of crop field to forest plantation can bring great ecological benefits [45], e.g., soil erosion mitigation, flood regulation, carbon sequestration, and climate regulation. In addition, diverse agricultural systems have various vegetation coverage characteristics, and the systems produce different ecological service values. The degradation of environmental quality is induced by a gap between ecological supply services and social demand. Therefore, understanding the ecosystem services of studies can help people comprehend the embodied value of system transformation and decision making within system management. Soil erosion and surface runoff were serious in the study area and represented the primary factors which cause rocky desertification. Thus, this study selected indicators which reflect the ecosystem service of the study area, such as groundwater recharge, soil conservation, and soil carbon sequestration, to be incorporated into the evaluation framework and put forward the resulting formula. A detailed calculation method of ecosystem services is referred to in works by Yang et al. [46] and Yang et al. [47].
2.4.1. Groundwater Recharge
The irrigation water in the study area was primarily derived from precipitation, and the presence of vegetation resulted in an increase in groundwater. However, the orchard monoculture and intercropping systems differed from the MF, which had little water resources consumption in the early stages. The recharging of groundwater is one of the important ecosystem services provided by agricultural systems, and was calculated by the following formula:
where EIUW is the energy of recharging groundwater (sej), S is the planting system area (m2), ρ is the density of water (kg·m−3), and P is the precipitation and water resource consumption in the study area (m). UEVgw is the transformity of groundwater (sej·g−1); the factor 1000 is an adjusting coefficient. κT is the water infiltration coefficient from the surface to ground, measured with the water balance method [48]. The κT of MF, NM, NM, MVI, and NDI were 0.645, 0.785, 0.774, 0.952, and 0.978, respectively.
EIUW = S × P × ρ × κT × UEVgw × 1000
2.4.2. Soil Conservation
In karst regions, vegetation restoration assists soil conservation. The effects on erosion control could be indicated by a difference between the actual erosion of the control system and orchard systems. The formula is as follows:
Emg = S × G × 106 × UEVg
G = GC − GR
Emg is the soil and water conservation energy (sej), S is the planting system area (m2), G is the annual total soil conservation (t·year−1), the factor 106 is an adjusting coefficient, UEVg is the soil transformity (sej·g−1), GC is the soil erosion of the control system, MF (t·m−2·year−1), and GR is the actual soil erosion of the orchard systems under study during the same period (t·m−2·year−1).
2.4.3. Soil Carbon Sequestration
Litter (biomass) enters the soil and enhanced soil organic matter. Soil carbon sequestration was mainly reflected by measuring its increase at a cycle per system (a cycle represents the period from the sowing of seeds to the harvest). The added emergy of soil organic matter was calculated as follows:
ESCS = S × ∆YSOM × UEVSOM
ESCS is the emergy of soil carbon sequestration, S is the planting system area (m2), ∆YSOM is the SOM changes in a periodic system (J·m−2), and UEVSOM is the transformity of SOM (sej·J−1).
2.5. Calculation of Emergy Indices
Emergy indices were calculated based on the different percentages of renewable energy in the input flows. Different indices can reflect the environmental, social, and economic characteristics of the system. This study selected the basic indices of ecosystem emergy evaluation [10,41,51], such as the emergy exchange rate (EER), the emergy investment rate (EIR), the renewable fraction (R%), and the emergy power density (EPD). The environmental loading ratio (ELR) and emergy yield ratio (EYR) can apparently and intuitively represent the environmental pressure level of the system. The emergy sustainability index (ESI) was proposed by Brown and Ulgiati (1998) as an indicator of long-term sustainability without considering the effects of economic marking variation. Given that the systems in this study are ecologically and economically complex systems subject to human activities, the emergy index of sustainable development (EISD) was also selected, which was an extension of ESI by bringing into consideration the effects of market exchanging fairness [52]. The specifications and formulas for calculating the emergy indices used in this study are presented in Table 5.
2.6. Economic Analysis
In this study, the prices of inputs and outputs in the system were determined by the market in the study area. The human labor cost was confirmed by the average wage of farmers in the market. The maize produced was sold directly to the market. The fruit produced by the orchard systems was graded, screened, and then sold to the market. The legume herb produced in MVI and NDI was returned to soil after harvesting as a free green fertilizer in the system. The economic indices included the net economic profit (EP) of the system and explained the actual economic benefits brought by the system. The economic output–input ratio (O/I ratio) was also calculated to measure the economic efficiency of the systems under study. The detailed formulas and meanings of the above emergy and economic indices are given in Table 5.
2.7. Integrated Pest Management Scenario Simulation Analysis
In general, the sustainability of the system could be increased by reducing the amounts of non-renewable resources or increasing the fraction of renewable resources. Given the uncontrollability of environment resource inputs in the system, improving the system sustainability by optimizing the purchased resources inputs is more feasible. The intercropping systems in this study optimized fertilization management by substituting 20% of chemical fertilizer with organic manure. In our study, we performed sensitivity analysis to identify the major contributors in the five systems and found that pest management control purchased inputs were the main contributors to the system emergy input. In order to further explore the possibility of sustainable development in planting management, the study considered the environmental risks of pesticides and their possible residues in agricultural products based on the concept of green agricultural development. Integrated pest management systems, which have little harm on the environment and present an apparent prevention effect, were evaluated by investigating the damage degree of pests and an acceptable risk to environment. Finally, the solar insecticide lamp, sticky cards, and predatory mites were proposed to replace most of the pesticide inputs. Assuming that other inputs remained unchanged, the integrated pest management scenario simulation of orchard legume herb intercropping systems was applied. Based on emergy indicators analysis, the resource utilization ratios and system sustainability of the simulated systems (MVI-O and NDI-O) were evaluated.
3. Results
3.1. Structure of Emergy
The emergy input structure of the monoculture (MM and NM) and intercropping orchard systems (MVI and NDI) were analyzed, with the MF system as a control. Table 3 represents the input flows of the five systems (unit: g or J).
3.1.1. Renewable Environmental Flows (R)
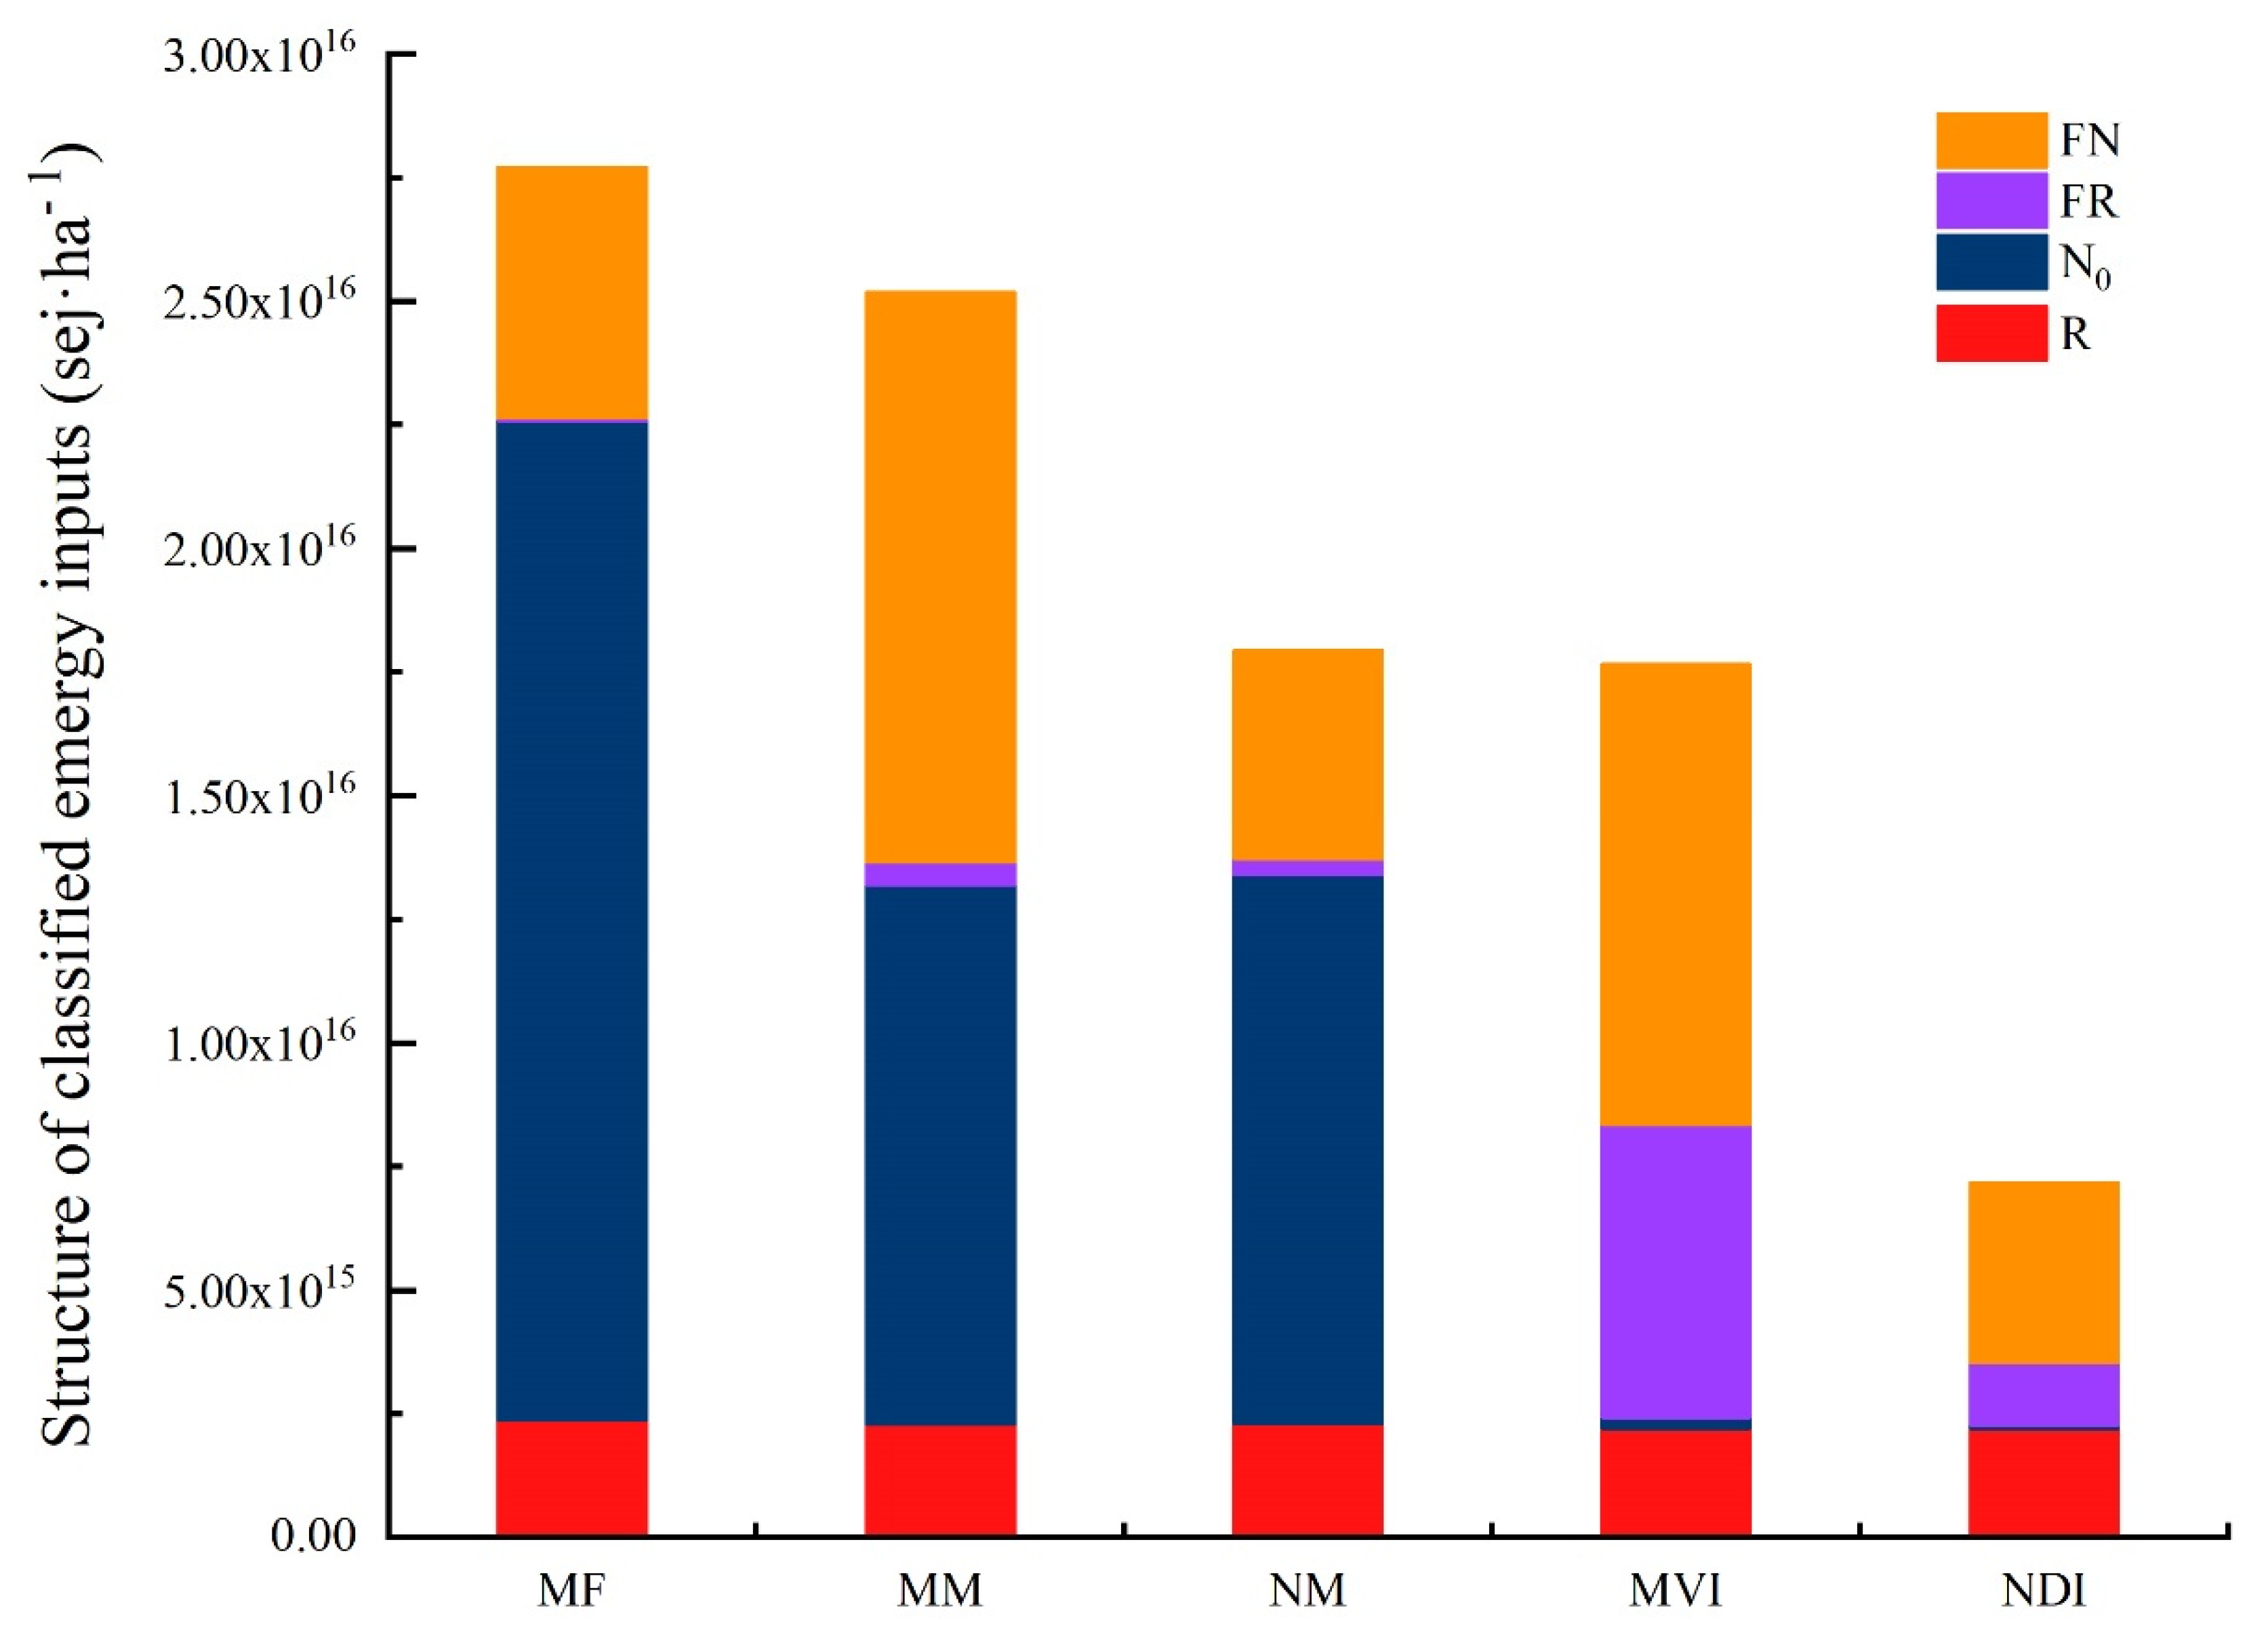
The MF had the highest renewable resource input density (2.38 × 10¹⁵ sej·ha−1), followed by the monoculture orchards (MM and NM), and then the intercropping orchards (MVI and NDI). R included solar radiation, precipitation, evapotranspiration, and runoff (Table 4). To avoid double-counting, rain and river were considered to be the renewable environmental flows. The conversion of MF to orchard systems triggered changes in runoff loss, wherein the MF (2.50 × 10¹⁴ sej·ha−1) had the highest runoff loss. Compared to the MF, the runoff loss in MM and NM decreased by 32.91% and 31.56%, respectively. Similarly, MVI and NDI decreased by 67.09% and 72.07%, respectively.
3.1.2. Non-Renewable Environmental Flows (No)
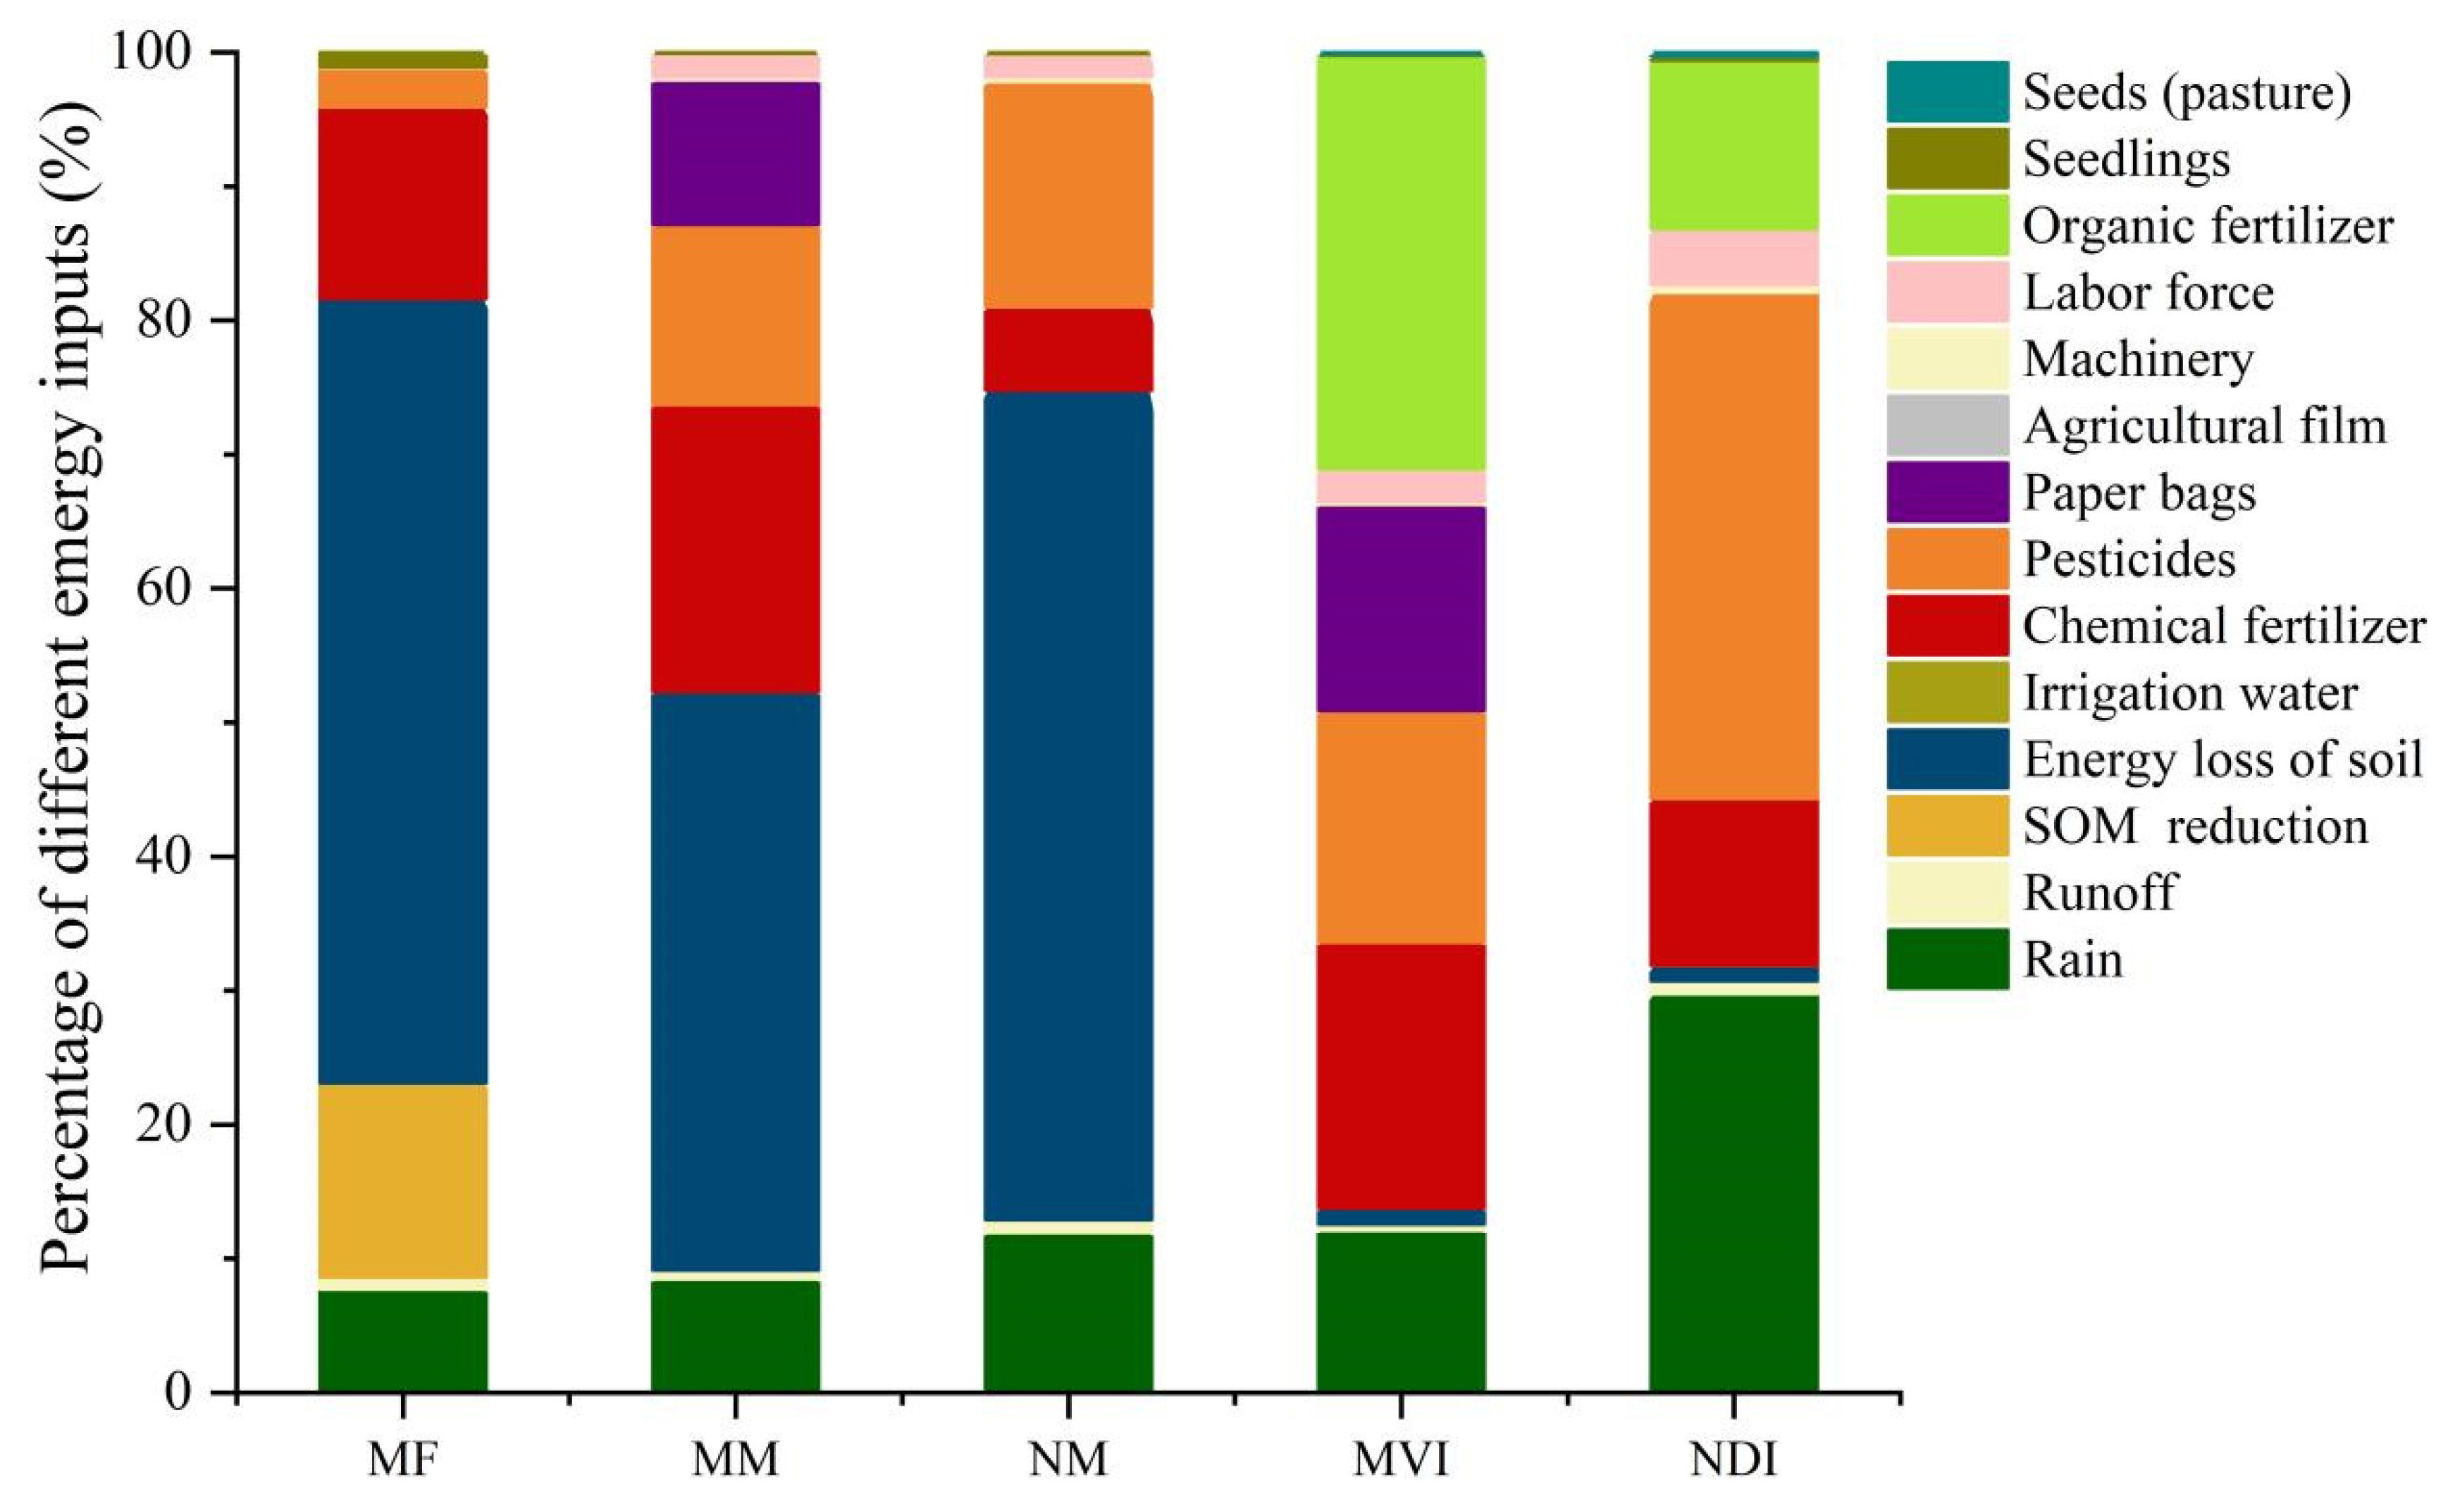
The non-renewable environmental inputs in the MF were 2.02 × 10¹⁶ sej·ha−1 (Table 4 and Table 6), accounting for 71.63% of the total emergy. The No in the MF was 1.86 and 1.82 times that of MM and NM, and 94.42 and 247.50 times that of MVI and NDI, respectively. Irrigation water, SOM reduction, and soil erosion were the main components of No (Table 4). Orchard monoculture and intercropping systems required artificial irrigation for 15 days after transplanting. However, the emergy input of irrigation water could be relatively weak and negligible, accounting for less than 0.01% in No. The data showed that soil erosion accounted for the largest proportion in No (Figure 4). Emergy for soil erosion followed the trend (highest to lowest) of MF > monoculture (NM and MM) > intercropping (MVI and NDI) (Table 4). A SOM loss of 4.00 × 10¹⁵ sej·ha−1 was calculated for the MF, while the SOM losses of the others were 0.

Table 6.
Emergy flow structure of various planting systems (emergy unit: sej·ha−1).
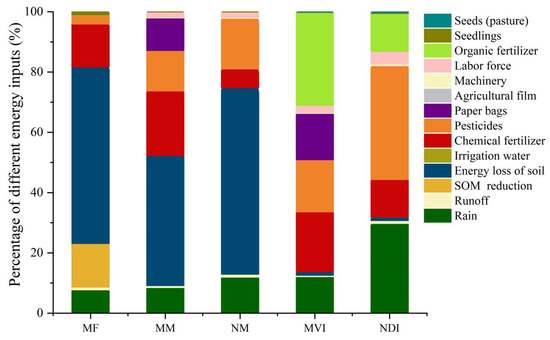
Figure 4.
The emergy input structure of the five planting systems.
3.1.3. Purchased Input Flows (FN and FR)
Our results revealed that the purchased emergy inputs in mango orchards (MM and MVI) were higher than those of other systems, with differences occurring among the purchased input structures of the five systems (Table 6). In the MF system, the emergy of compound fertilizer and urea accounted for 73.24% in purchased inputs. The local farmers used large amounts of fertilizer to satisfy an increased food demand, including 650 kg·ha−1 of compound fertilizer and 1200 kg·ha−1 of urea (Appendix A). Pesticide, labor, and seed accounted for 14.34%, 4.25%, and 5.50% of purchased inputs in the MF system, respectively. As shown in Figure 4, in addition to soil erosion, chemical fertilizer and pesticide were the major emergy inputs. Fertilizer emergy in the MF was 0.73~3.53 and 1.13~4.42 times that of the monoculture and intercropping orchards, respectively, wherein fertilizer inputs of MM accounted for the highest proportion (Table 3 and Table 4). The emergy inputs of pesticide in orchard systems were higher than those of the MF, wherein the emergy inputs of pesticide in monoculture orchards (MM and NM) were 4.21 and 3.75 times those of the MF, respectively. The pesticide emergy inputs to the intercropping orchards (MVI and NDI) were 3.79 and 3.37 times those of the MF, respectively. Additionally, the MF had the lowest labor emergy input (2.38 × 10¹⁴ sej·ha−1) (Table 4). The human labor emergy inputs of the monoculture orchards (MM and NM) were 1.28 and 1.84 times those of the MF, respectively, and the labor emergy inputs of the intercropping orchards (MVI and NDI) were 1.25 and 1.82 times those of the MF. Only the mango orchards had the emergy input of paper bags. The machinery and agricultural film emergy input to the four orchard systems accounted for 0.27%~1.36% in the total purchased inputs. The FN in the five systems accounted for 74.70%~96.18% in the purchased inputs, suggesting that the five systems heavily relied on the purchased non-renewable resources (Table 6).
3.1.4. The Performance and Total Flow of Emergy (U)
The total emergy input of five systems revealed that the MF had the highest emergy input density, followed by the monoculture orchards (MM and NM), leaving the intercropping orchards (MVI and NDI) with the lowest emergy input density (Table 6 and Figure 5). Compared to the MF, the total emergy input of monoculture orchards (MM and NM) decreased by 9.03% and 35.38%, and intercropping orchards (MVI and NDI) decreased by 36.46% and 74.12%.
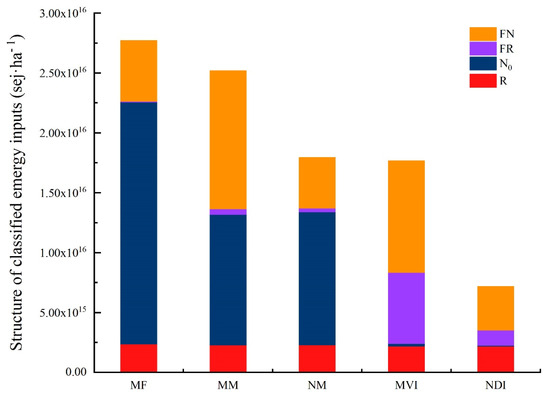
Figure 5.
The total emergy inputs of the five planting systems. FN is the purchased non-renewable input; FR is the purchased renewable inputs; No is the non-renewable environmental inputs; and R is the renewable environmental inputs.
3.2. Emergy Yield
The conversion of MF to orchard increased the total emergy outputs (Table 4). The emergy outputs in monoculture orchards (NM and NM) were 7.06% and 18.73% higher than MF outputs, and similarly the outputs of intercropping orchards (NM and NDI) were 38.66% and 42.67% higher than the MF outputs. The main emergy outputs of MF, MM, and NM were maize, mango, and macadamia, respectively. The emergy outputs of MVI were mango and Vicia angustifolia. The emergy outputs of NDI were macadamia and Desmodium intortum, whereby Vicia angustifolia and Desmodium intortum were used as a green manure or fodder and reinvested in other agricultural production or breeding industries.
3.3. Emergy Indices
To thoroughly assess the sustainability of the monoculture and intercropping orchards, the emergy indices were calculated (Table 7). Our results showed that the EPD and ELR values for the five systems displayed the same order of: MF > monoculture orchards > intercropping orchards, whereas the EIR values for the five systems displayed the opposite pattern. Compared to the monoculture orchards and MF, intercropping orchards had a higher R%. These differences were mainly seen because the conversion of MF to orchard systems decreased the environmental emergy consumption (soil erosion, runoff, and soil SOM loss), especially in the intercropping orchards. The EERs of all orchard systems were more than 1.79, indicating that orchard systems obtained extra benefits from the market, wherein the intercropping orchards had the highest EER. The EYR values in mango systems were the smallest because mango production requires high levels of purchased resource investment, such as high inputs of fertilizer, pesticides, paper bags, machinery, and human labor. The purchased emergy inputs of the mango orchards (MM and MVI) were 2.67 and 2.90 times those of the MF, respectively. The intercropping orchards (MVI and NDI) had the highest ESIs, which were 8.44 and 7.03 times those of the monoculture orchards (MM and NM), as a result of the highest EYR, and the lowest ELR among the five systems under study. The EISD of the five systems followed a pattern similar to R%. The intercropping orchards (MVI and NDI) had the highest EISD (3.18 and 60.53), which reflected the higher short-term sustainability of these systems. Overall, the emergy indices showed that the intercropping orchards were the most sustainable of all the five systems studied.

Table 7.
The emergy, economic, and ecosystem service indices of various planting systems. Recharging groundwater, soil conservation, and soil carbon sequestration refer to the amount of change based on a one-year cycle.
3.4. Emergy Value of Ecosystem Services
Based on the emergy method, the conversion of MF to orchard systems increased groundwater recharge, soil conservation, and carbon sequestration (Table 7). Compared to the MF, the groundwater recharge of orchard monoculture systems (MM and NM) increased by 3.55 × 10¹⁵ sej and 3.50 × 10¹⁵ sej, which were 1.94 and 1.92 times those of the MF. Meanwhile, the groundwater recharge of intercropping systems (MVI and NDI) increased by 4.30 × 10¹⁵ sej and 4.42 × 10¹⁵ sej, which were 2.36 and 2.42 times those of the MF. For soil conservation, the conversion to monoculture orchards (MM and NM) showed increases of 5.55 × 10¹⁵ sej and 5.13 × 10¹⁵ sej and the conversion to intercropping systems (MVI and NDI) showed increases of 1.60 × 10¹⁶ sej and 1.62 × 10¹⁶ sej. For carbon sequestration, conversion to monoculture and intercropping orchards showed increases of 1.51 × 10¹¹~1.28 × 10¹² sej.
3.5. Economic Analysis
Economic evaluation was based on the total cost (TC), total income (TI), economic profit (EP), and economic output–input ratio (O/I ratio) of the five systems (Table 7). A detailed cost calculation process of the systems is provided in Appendix A.
3.5.1. Economic Input Structure for Systems
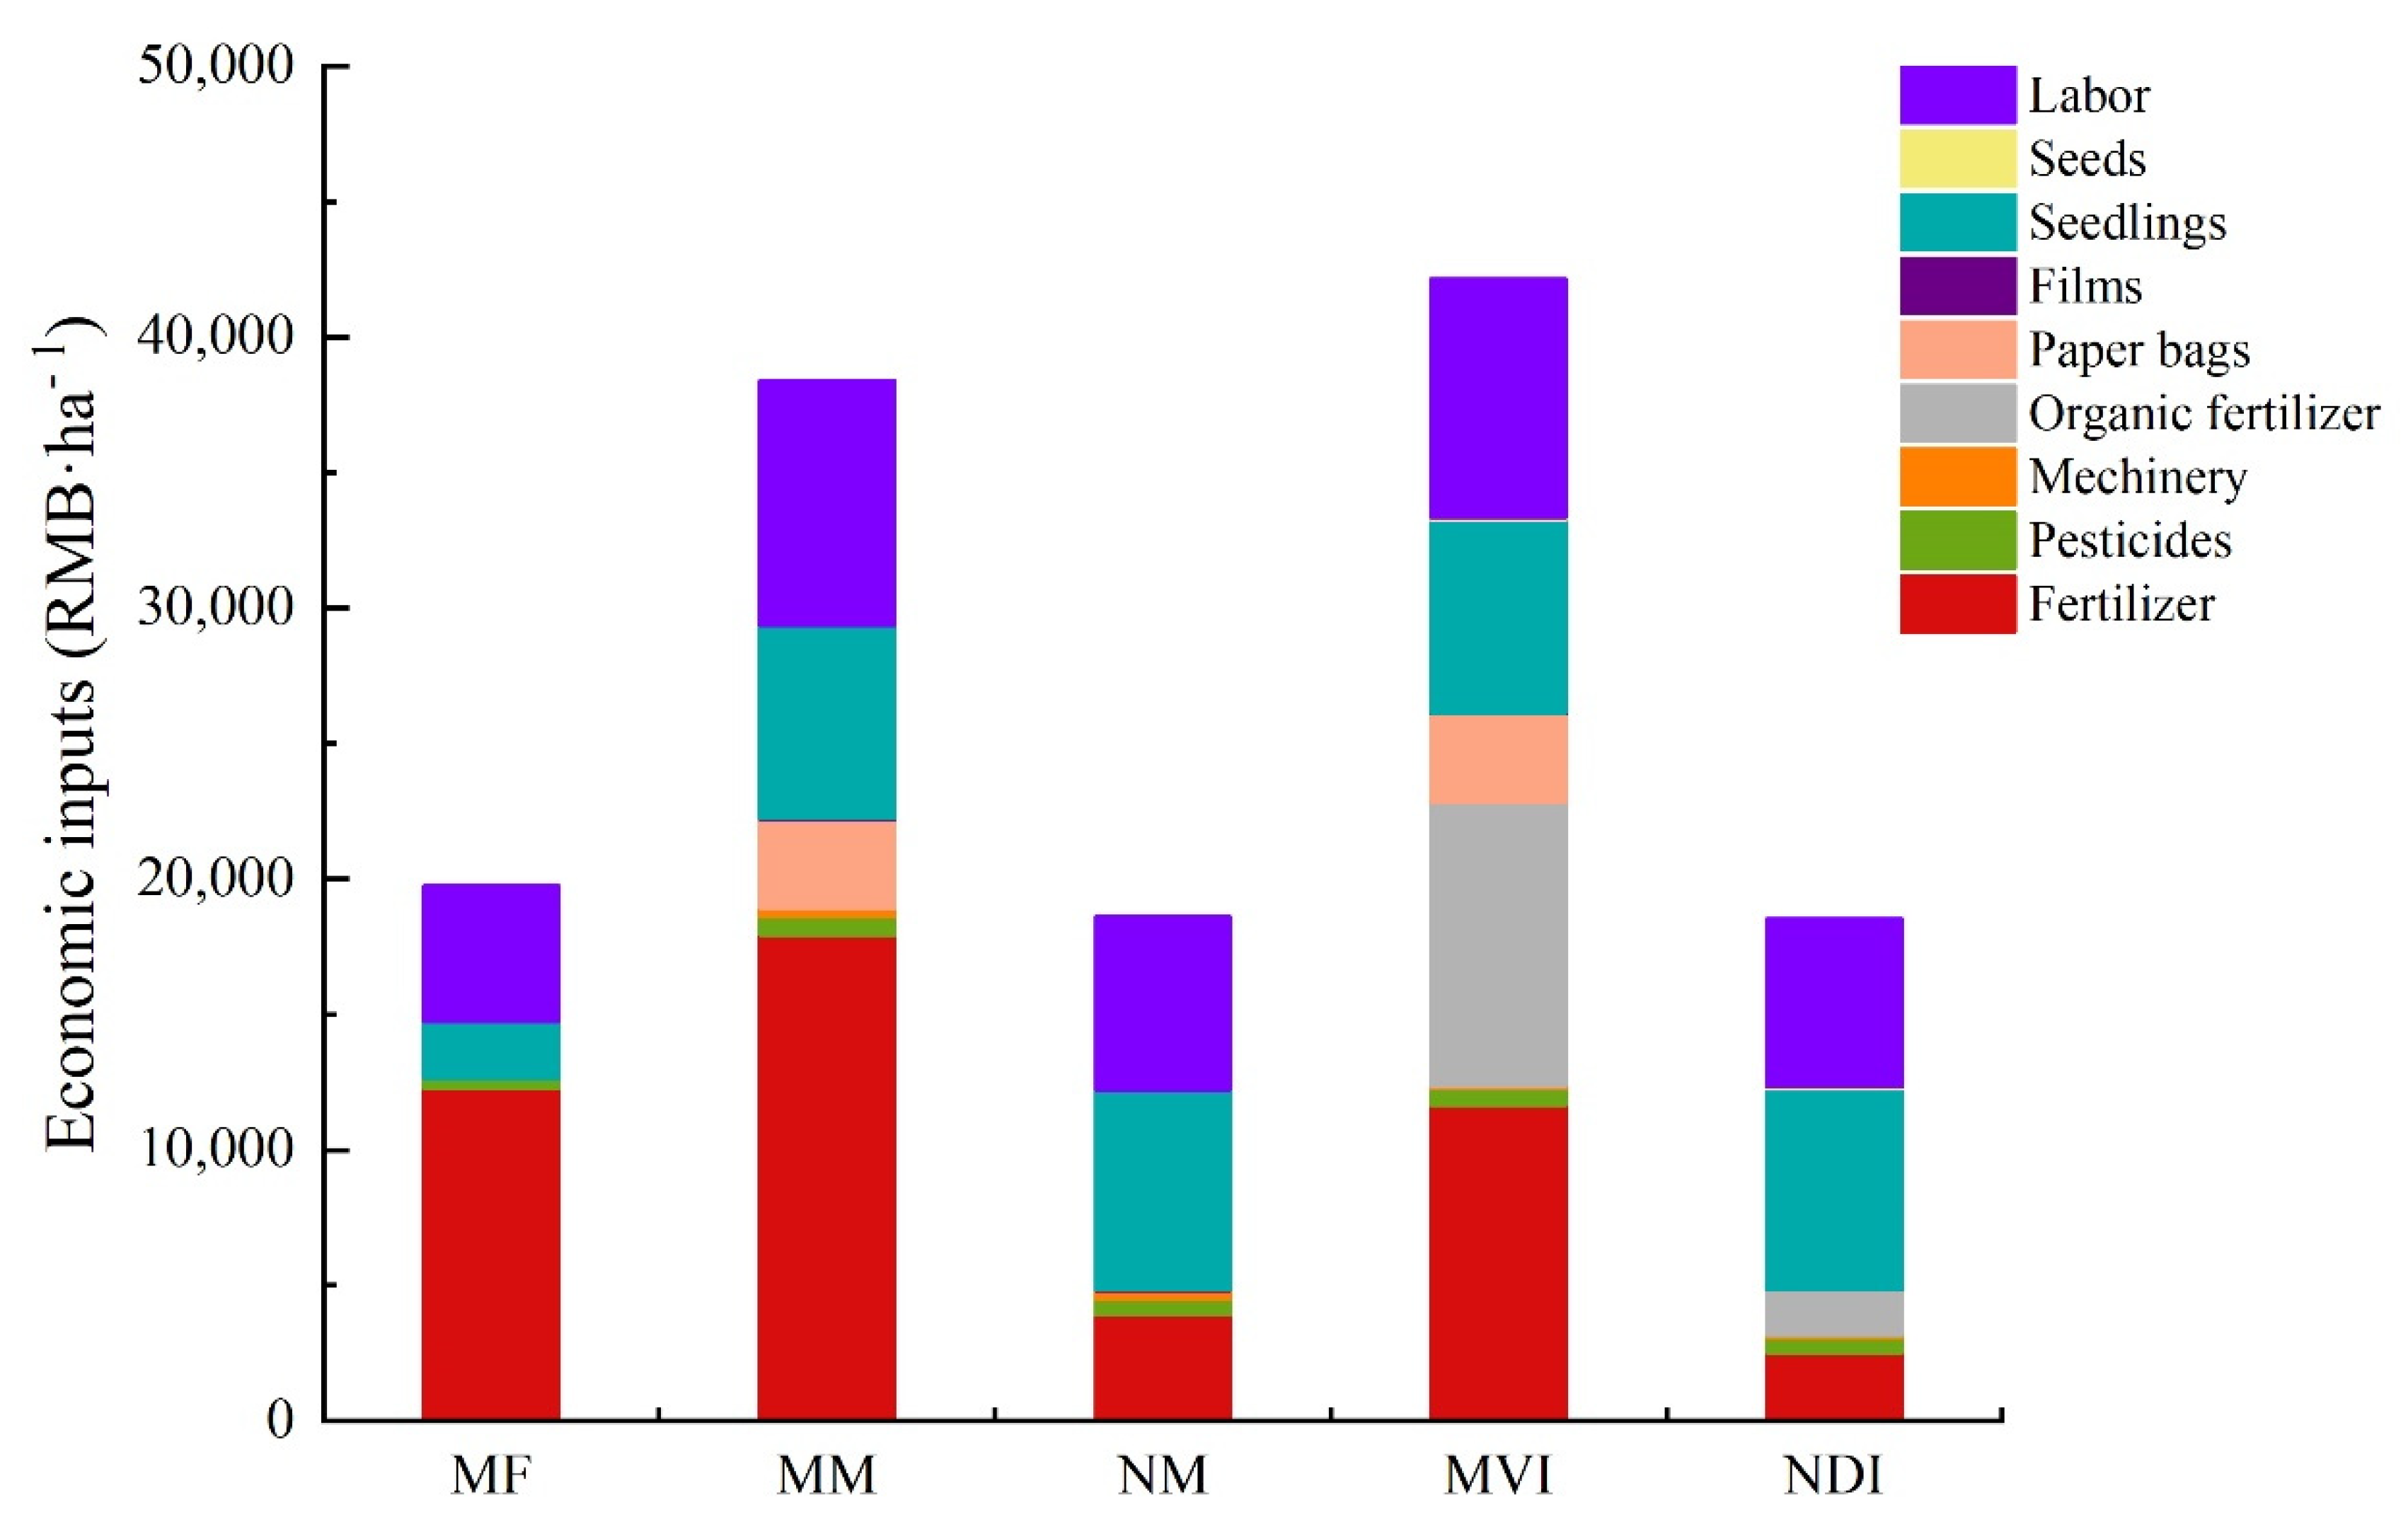
Mango orchards had the highest TC, whereas the MF had the lowest TC (Table 7). The details of economic inputs of the five systems are shown in Figure 6, wherein chemical fertilizer and human labor costs were the major economic inputs. The cost of chemical fertilizer in the MF accounted for 62.16% of the TC. The chemical fertilizer cost of the MF was 68.22% higher than that of NM, and 46.21% lower than that of MM. Similarly, the chemical fertilizer costs of the MF were 4.96% and 79.34% higher than those of MVI and NDI systems, respectively. In addition, the organic fertilizer cost of MVI and NDI modes accounted for 8.78% and 56.11% of the TC. The other economic costs of the monoculture and intercropping orchards were both higher than those of the MF, such as pesticides, seeds (fruit tree seedlings and legume herb seeds), and human labor costs. The machinery and agricultural film costs of the monoculture and intercropping orchards accounted for 0.29%~1.77% of the TC. Only the mango orchards (MM and MVI) had the costs for paper bags, which accounted for 7.72% and 8.56% of the TC, respectively.
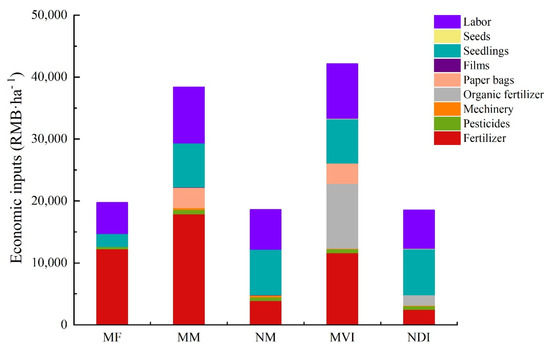
Figure 6.
The total economic input structure of the five planting systems.
3.5.2. Economic Profit
The macadamia orchards had the best EP, whereas the MF had the worst EP (Table 7). If the labor costs were not included in the TC, then the MF would have had a positive EP. The results indicated that the NDI had the best O/I ratio. The O/I ratio of the five systems followed the order of MF system < mango systems (MM and MVI) < macadamia systems (NM and NDI).
3.6. Integrated Pest Management Scenario Simulation for Orchard Legume Herb Intercropping Systems
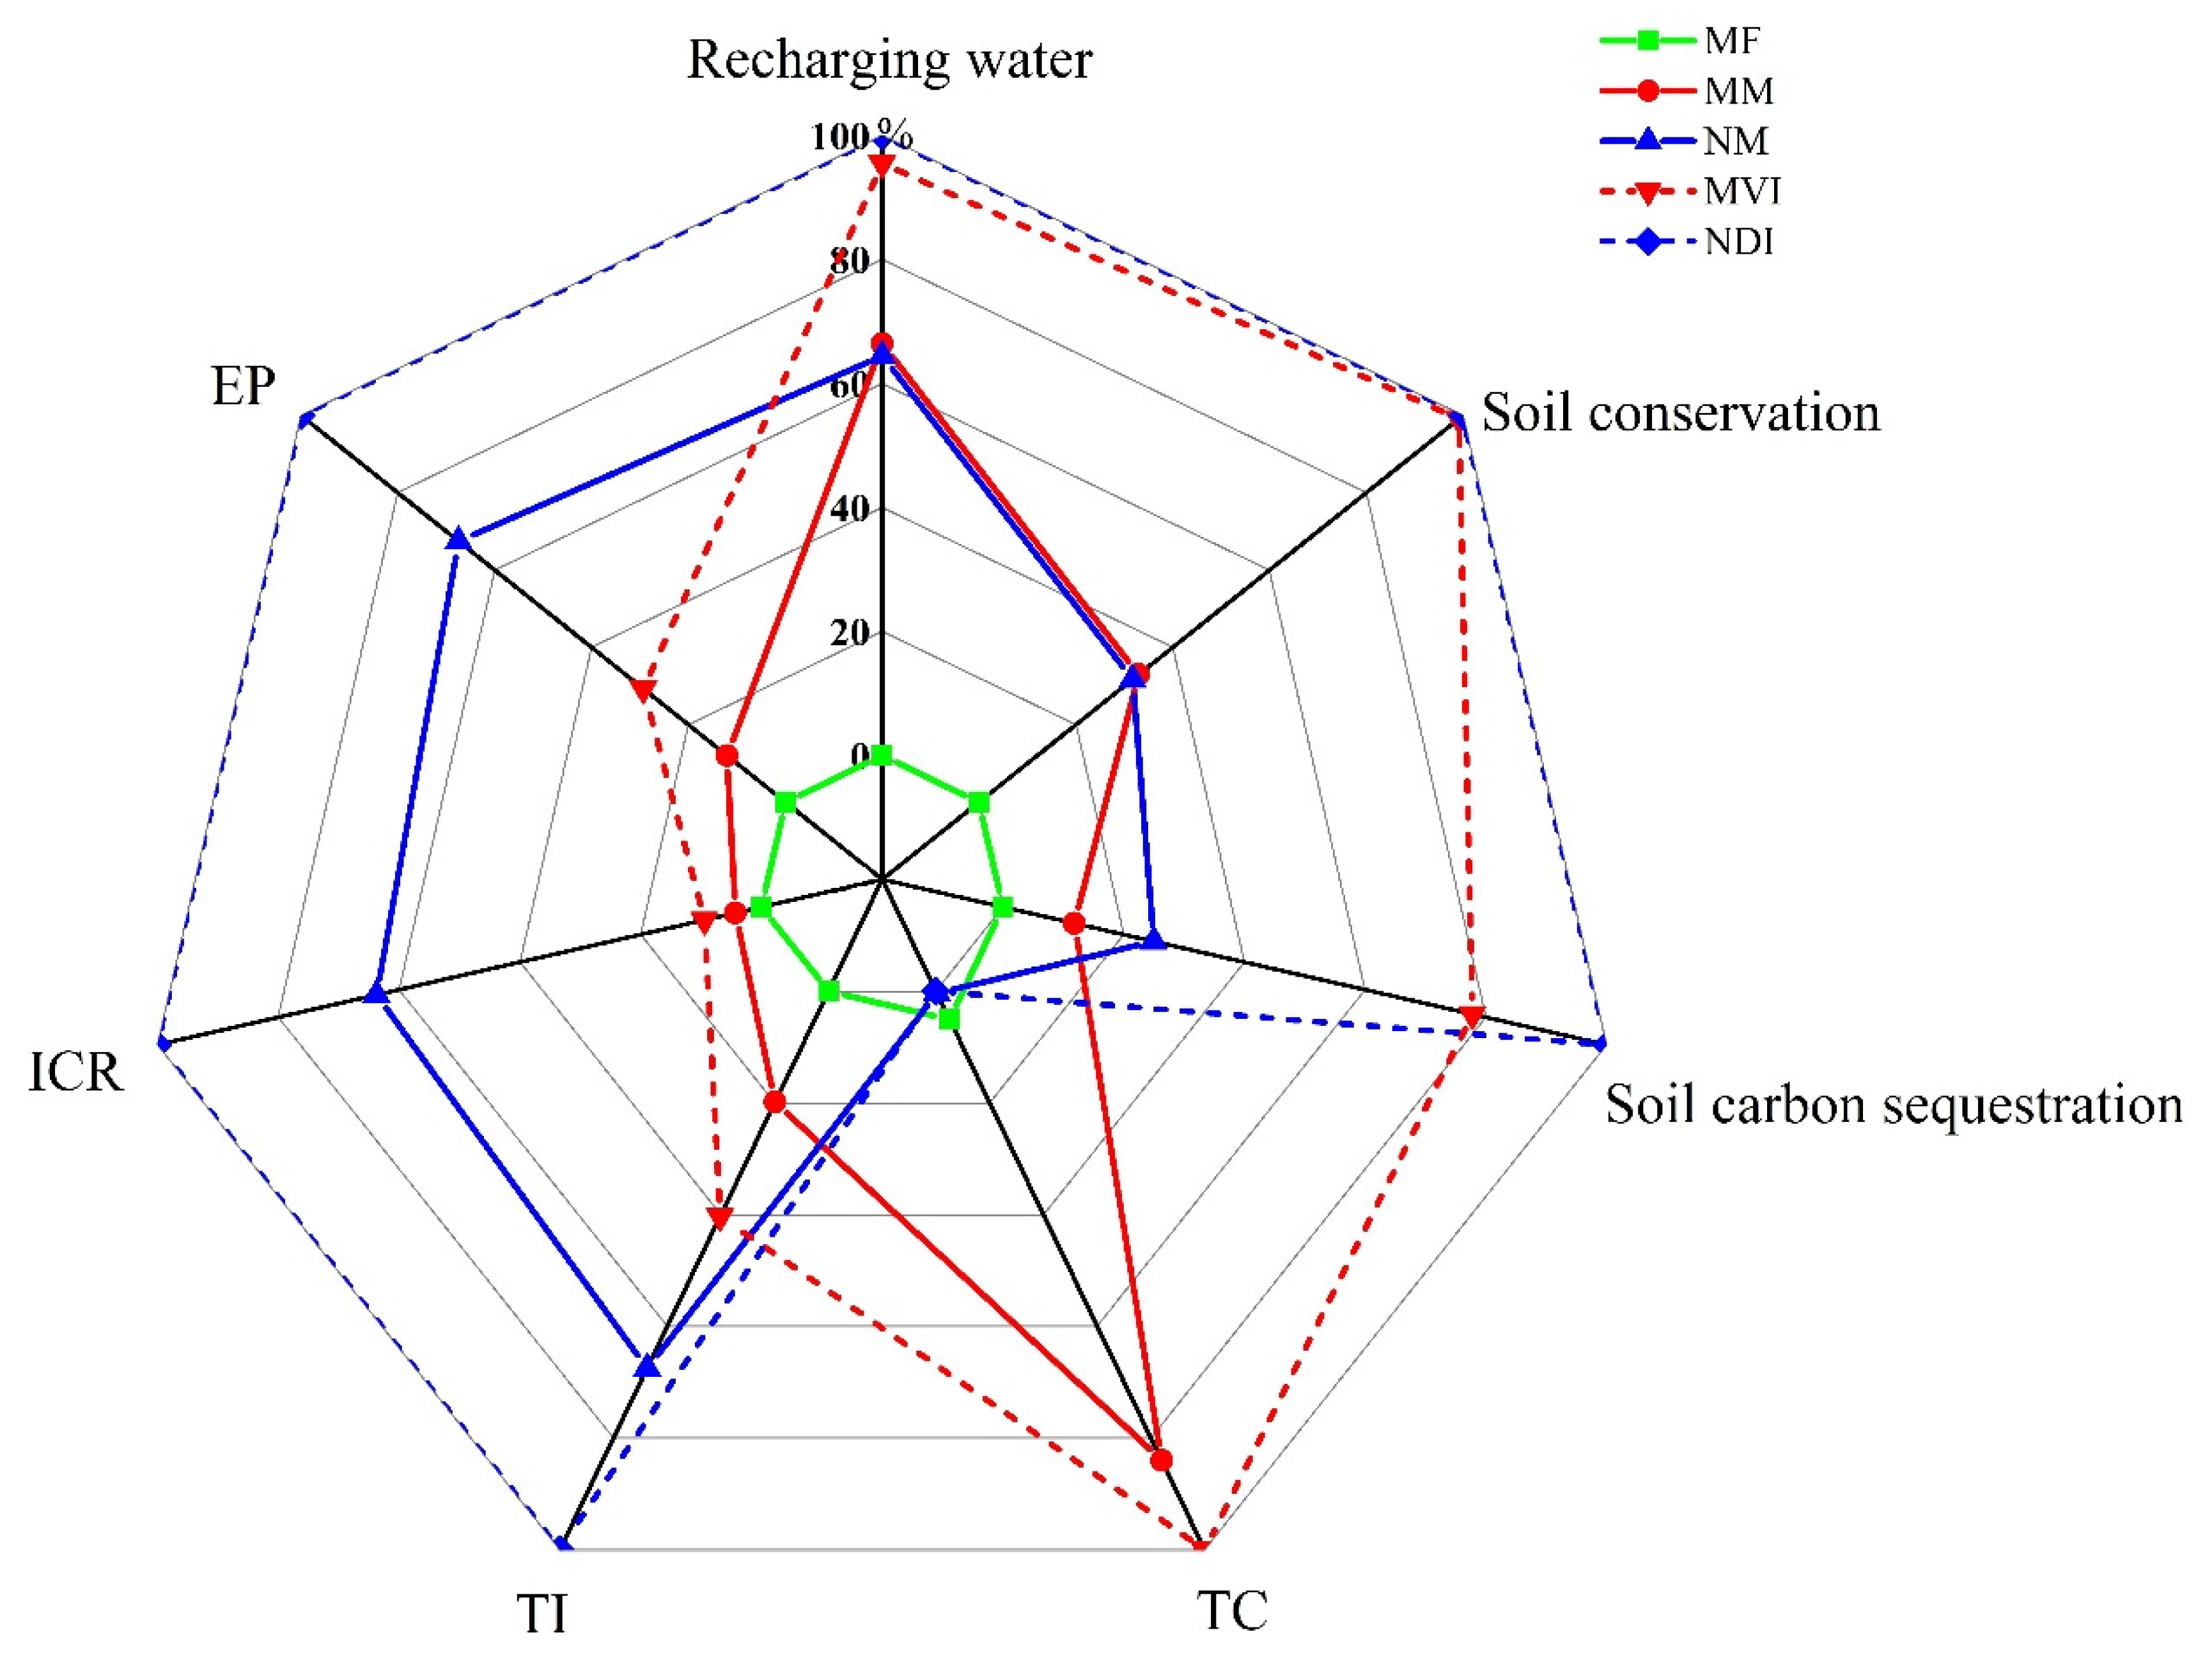
According to the emergy and economic analysis of orchard systems, seven indicators related to economic and ecosystem services, including groundwater recharge, soil carbon sequestration, soil conservation, TI, TC, EP, and the O/I ratio of each system, were selected and normalized to explore the performance of economic and ecosystem services in the investigated systems. The size of the area in the radar diagram represents a measure of the overall performance of the economic and ecosystem services associated with each system (Figure 7). The areas of radar diagrams for intercropping systems were larger than the monoculture and MF systems, indicating that the overall performance of the intercropping systems was better than the others. However, the intercropping systems still had optimization potential for pesticide emergy from the perspective of an emergy input structure (Table S1 and Figure 4). The study assumed that the quantity of other inputs remained the same in the intercropping systems and converted the conventional chemical controls to integrated pest management.
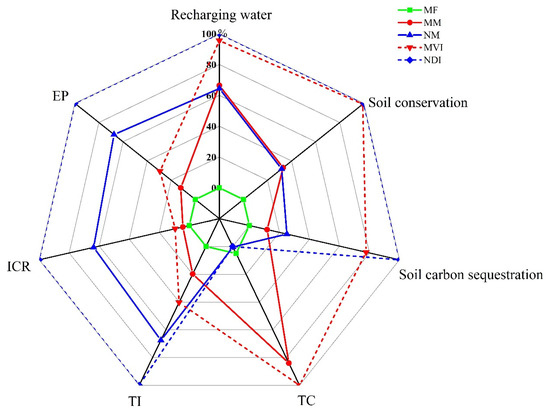
Figure 7.
Integrated analysis based on economic and ecosystem services of the five planting systems.
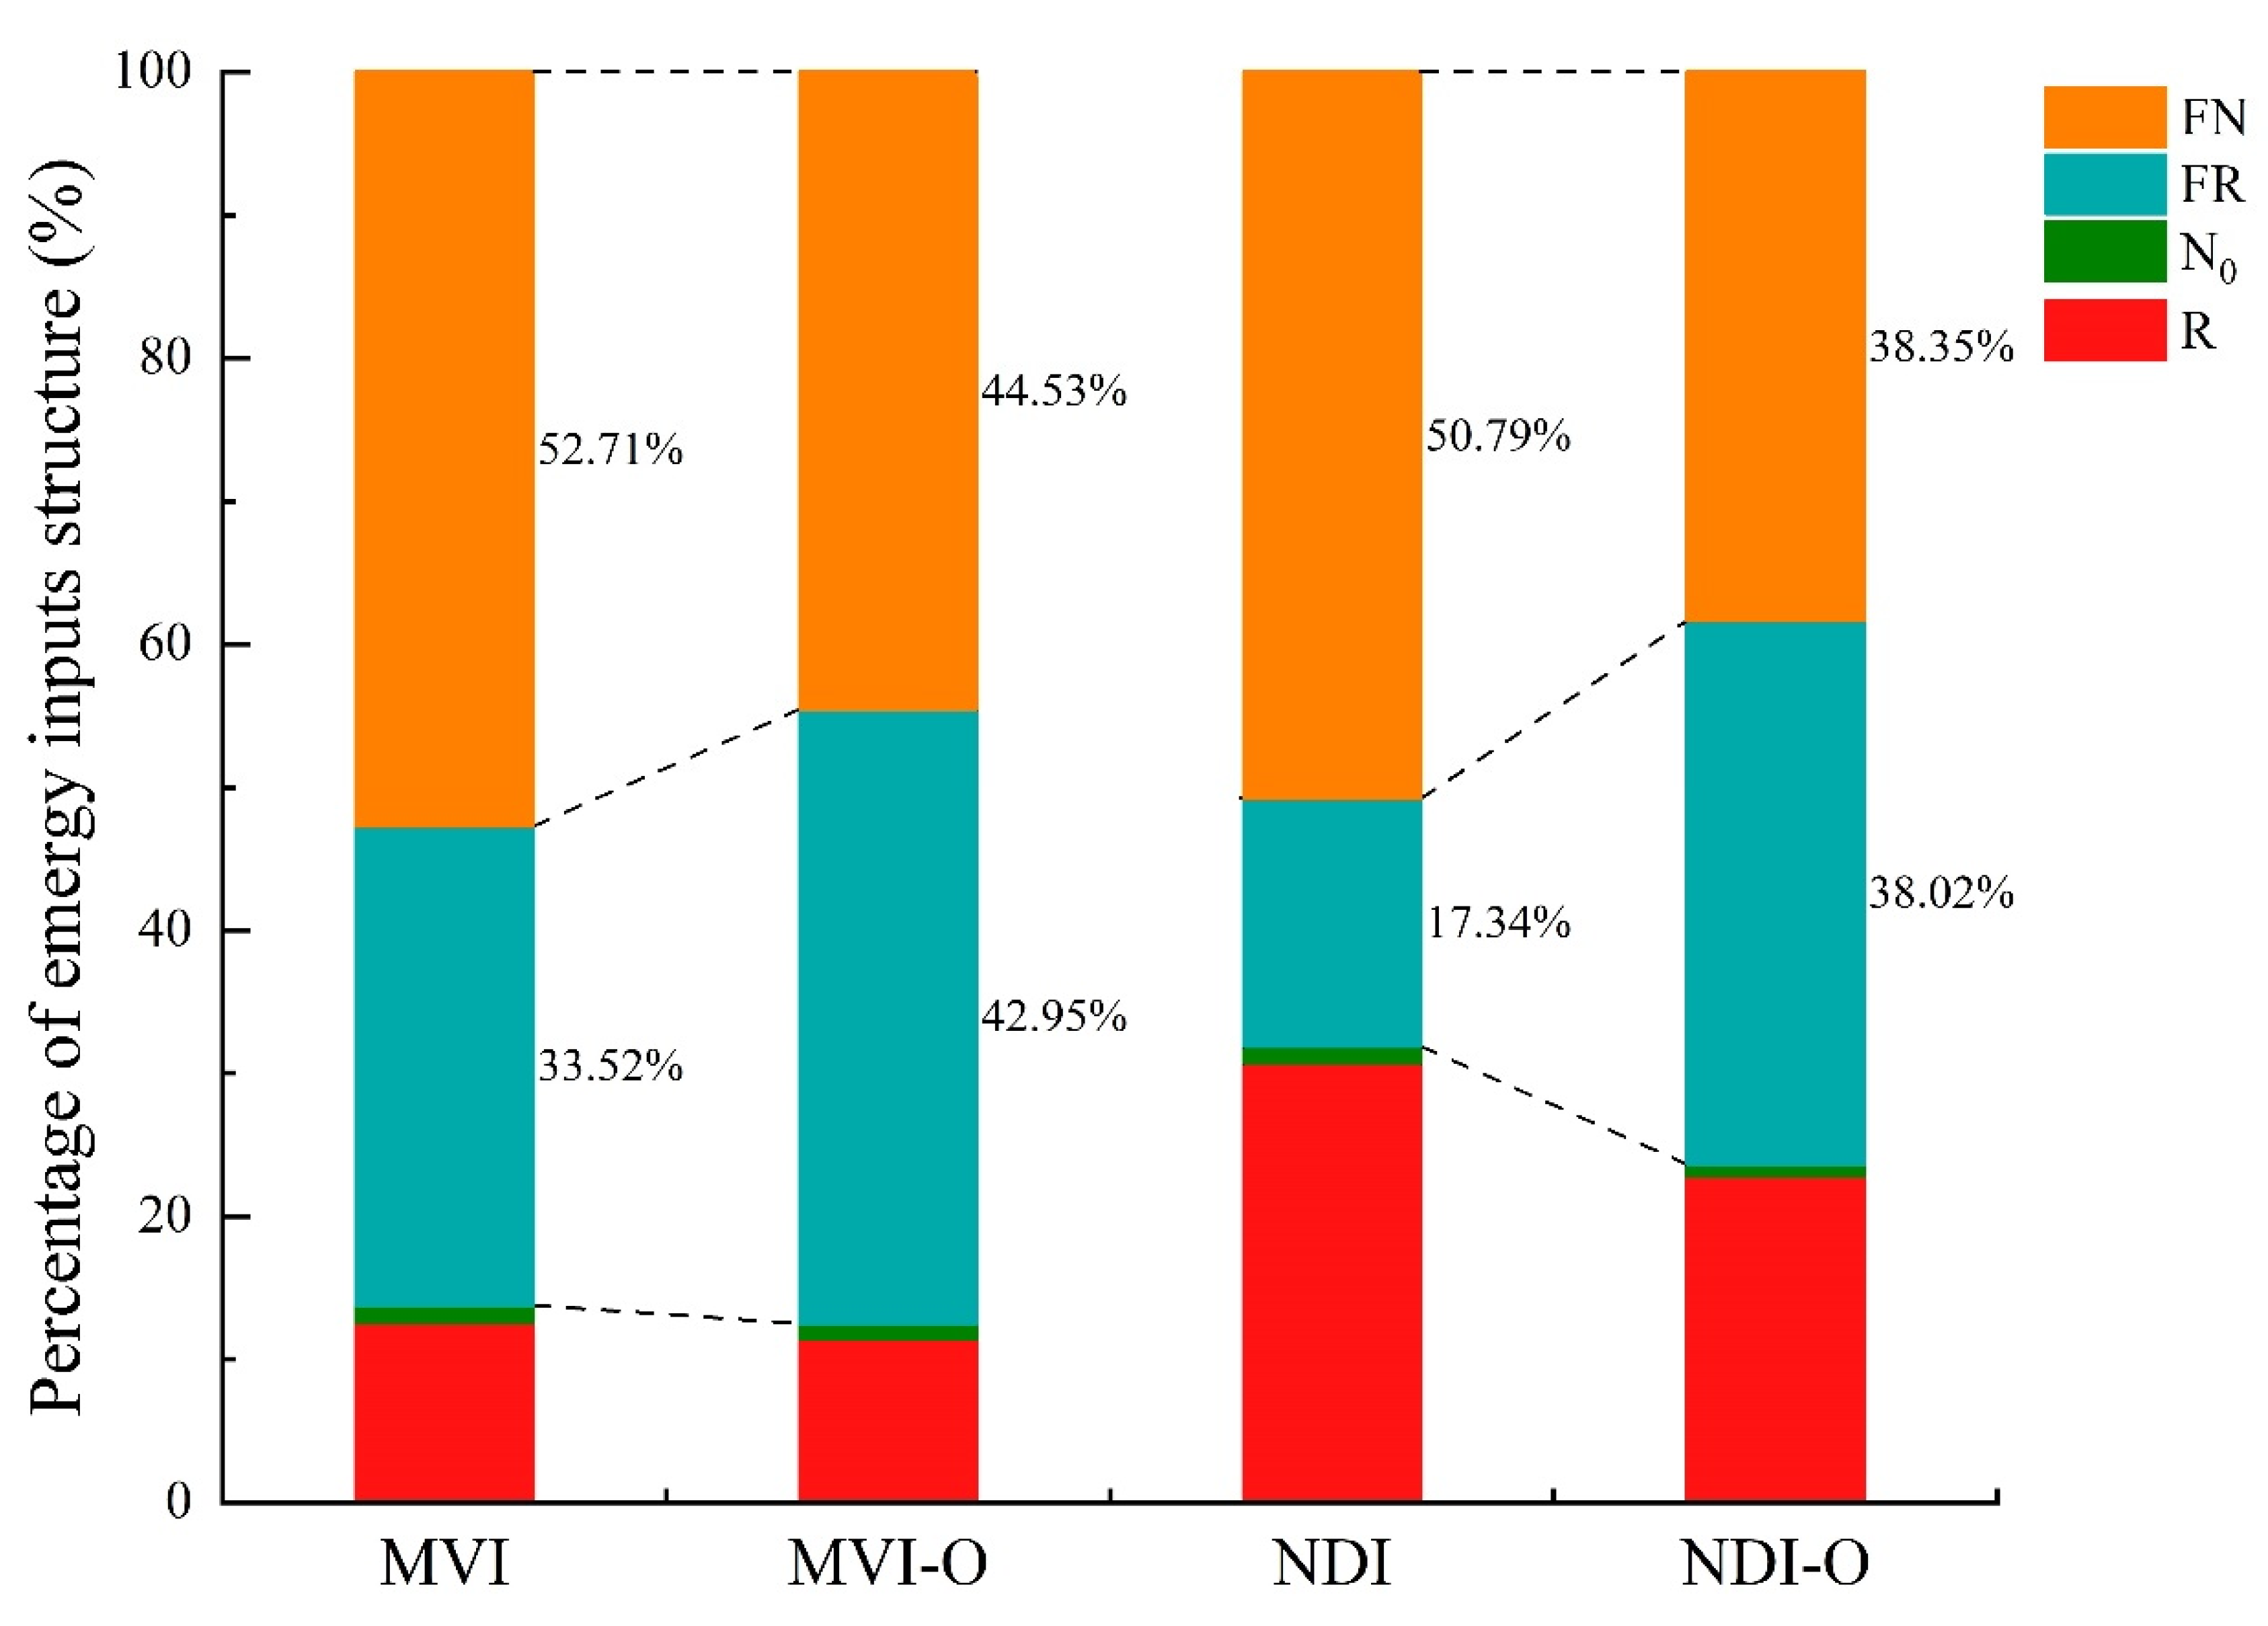
The integrated pest management systems (MVI-O and NDI-O) increased the purchased flow (FR + FN) and changed the proportion of FR and FN in the total emergy input (Table S2 and Figure 8). Compared to the intercropping orchards (MVI and NDI), the FR in the integrated pest management (MVI-O and NDI-O) systems increased by 10.40% and 21.11%, while FN decreased by 9.15% and 12.79% (Figure 8). In addition, the structure of purchased emergy inputs changes in MVI-O and NDI-O induced an increase in R% and EIR (Table 8). The R% of the MVI-O and NDI-O were 17.61% and 26.19% higher than those of the MVI and NDI, respectively. The EIRs of the MVI-O and NDI-O were 11.61% and 51.43% higher than those of the MVI and NDI, respectively. Nonetheless, the EYR in MVI-O and NDI-O systems decreased by 10.23% and 33.78%, suggesting that the implementation of integrated pest management decreased the product competitiveness in market. Compared to MVI and NDI, the ELR of MVI-O and NDI-O decreased by 27.87% and 40.19%, resulting in less pressure on the environment. Meanwhile, the ESI of MVI-O and NDI-O, with a slight increase, revealed that this improvement in the management approach enhanced the environmental sustainability. The EISD of MVI-O increased by 13.27%, indicating that the sustainable development ability of the MVI-O system was superior to MVI. However, it was worth noting that the EISD of NDI-O decreased by 17.98%, which means that the sustainability of NDI-O was not better than that of NDI.
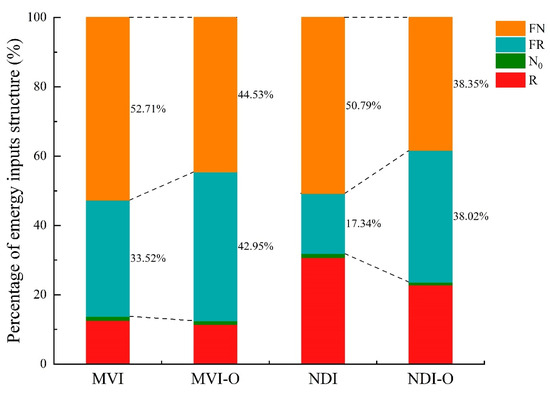
Figure 8.
The total emergy input structure of the scenario simulation.

Table 8.
The emergy-based indices of orchard intercropping systems (MVI and NDI) and integrated pest management scenario simulation (MVI-O and NDI-O).
4. Discussion
4.1. Emergy and Sustainability Effects of Orchard Monoculture and Intercropping Orchards Transitioning from Maize Field
The conversion to monoculture orchard form MF was not sustainable when system efficiency and environmental pressure were considered, as evidenced by less than 0.4 ESI of the monoculture orchards. This does not align with the requirement of realizing agriculturally sustainable development in a karst area. Previous studies have also shown that the most rocky desertification control systems still have high environmental pressure and low sustainability in the production systems [9,30], such as the ESI of pepper planting (0.6), pitaya cultivation (0.26), apple planting (0.22), pear planting (0.18), and pomegranate planting (0.18), which were all less than 1. Nevertheless, the intercropping orchards in this study had high ESI values (ESI > 0.76) because the legume herb increased renewable resource use while decreasing non-renewable resource consumption, ultimately leading to low environmental pressure. Our findings were consistent with those of Amiri et al. [12] and Agostinho et al. [52], who suggested that conservation agriculture and ecological management rely on less non-renewable resources and more renewable resources to increase the sustainability potential.
The EER is used to link emergy and economic assessments [53]. The EER in the MF was less than 1, indicating that the producers suffered emergy economic losses from the market exchange [23]. It has been well established that the maize system is ecologically and economically unsustainable in ecologically fragile regions of China, and farmers suffer ecological and economic losses when selling maize on the market, such as in the Loess Plateau region [23] and rocky desertification regions [9,30]. The EER significantly increased after conversion to orchard systems from the MF, with the farmers turning losses into gains. This was mainly attributed to higher buying power and the economic value of the yield, as well as lower total emergy inputs of mango and macadamia systems, especially in the orchard intercropping system. By considering the system’s social economic benefits and the natural environmental impact at the same time, the intercropping orchards (MVI and NDI) had higher social economic benefit per unit environmental impact than monoculture orchards (MM and NM), as evidenced by the high EISD in intercropping orchards. Thus, from the aspect of ESI and EISD indices, orchard intercropping systems could improve the sustainability of agro-ecosystems in karst areas.
4.2. Economic and Ecosystem Services Effects of Orchard Monoculture and Intercropping Orchards Transitioning from Maize Field
Rocky desertification and poverty are intertwined in the karst regions of southwestern China, which is the bottleneck for regional social and economic sustainable development [5,54]. Our results indicated that mango and macadamia systems provided higher economic benefits than in the MF (Table 7), which is similar to the results from seven typical agroforestry planting patterns [30] and three typical rocky desertification control systems in karst areas [9]. Although the intercropping systems had higher TCs than the monoculture systems due to the higher economic input of organic fertilizer than chemical fertilizer, a higher unit price and EP of agricultural products, as compared to the monoculture systems, were still observed in intercropping systems (Table 1 and Table 7). Our results are supported by a previous similar finding that the EP in maize–wheat rotation production increased over 17% under the substitution of manure for chemical fertilizers [55]. Additionally, the TI and O/I ratios of the intercropping orchards (MVI and NDI) were 44.00~64.10% and 46.29%~47.28% higher than those of the monoculture orchards (MM and NM), respectively. Previous studies have shown that the low pesticide application and partial substitution of chemical fertilizer using organic manure could alter soil physicochemical properties and improve the yield and quality of agricultural products [56,57]. This strategy meant taking into account both an improvement in the economy and ecosystem services as an effective method to control karst rocky desertification [58]. Groundwater recharge, soil conservation, and carbon sequestration are valuable indicators for quantifying karst ecosystem services [59]. This study conducted emergy analysis to evaluate the ecosystem services supplied by the conversion of a maize system to orchard systems. The results showed that the conversion to orchard systems from the MF significantly increased groundwater recharge, soil conservation, and carbon sequestration (Table 7). Owing to the considerable ecosystem degeneration, soils in this karst region are easy to erode through human disturbances, particularly in croplands [60]. Maize harvest causes seasonal low vegetation coverage (Table 2), which increases the water erosion of soils. Moreover, an excessive tillage effect on the size distribution and stability of soil aggregates [61]. Although the conversion of croplands to orchard planting could improve ecosystem services, the soil erosion and runoff flows of monoculture orchards were still high (Table 2). This was due to the fact that clean cultivation management reduces biodiversity and increases soil erodibility [62]. Compared to monoculture orchards, ecosystem services in intercropping orchards increased by 21.13%~558.94%. These variations were attributed to the protection of the orchard ground surface, the mitigation of erosion, and the loss of soil organic matter (SOM) and other nutrient sources using legume herb. This result is consistent with a previous study of long-term intercropping herb mulch in an apple orchard [63,64]. The inclusion of cover crops in cropping systems can improve soil quality, reduce agricultural inputs, and improve environmental sustainability [65]. Integrated analysis, based on the radar diagram, further implied that the intercropping orchards had greater viability within economic and ecosystem services (Figure 7). Overall, the development of tropical characteristic orchards, particularly for orchards intercropped with legume herb, could promote the development of economic and ecosystem services in rocky desertification areas.
4.3. Integrated Pest Management Scenario Simulation
Annual yield losses caused by pests and pathogens have been estimated to be 20%~40% of global agricultural production [66]. With this background, the use of pesticides is fundamental for the nutrition of the global population. However, the negative effects of pesticide application on water and soil contamination [67], as well as the potential risk of pesticide residues in plant and animal commodities on human health [68], cannot be ignored. There is therefore a need to implement integrated pest approaches, including biological control [69], biopesticides, and bio-stimulants [70], and to lower dependence on synthetic pesticides [71].
If integrated pest management was implemented (scenario), the FR would increase while the FN would decrease in MVI-O and NDI-O systems, respectively (Figure 8). Simultaneously, the R%, EIR, and ESI would increase by more than 17.73%, 11.54%, and 11.08%, respectively (Table 8), primarily due to the omission of pesticides and partial labor force and an increase in the purchase emergy input for integrated pest management. Therefore, our results reveal that integrated pest management is a resilient and sustainable approach. It was previously shown that an encouragement of integrated pest management and reduced reliance on chemical controls is an effective way to improve the sustainability of agricultural systems [71]. However, due to a high purchase of emergy inputs (solar insecticide lamps, sticky cards and predatory mites) in MVI-O and NDI-O systems, the EPD would increase by more than 10.02%, and EYR would decrease by more than 10.41%. This showed that systematic transformation would face a great challenge because the high cost of economic input for these methods suppressed farmers’ intentions to use integrated pest management. In our survey of 100 producers in the karst region of southwest China, 83% of mango and macadamia producers would be more receptive to the adoption and use of conventional pesticides rather than integrated pest control. Thus, it is difficult to further promote eco-friendly and cleaner agricultural practices via the adoption of integrated pest management practices in the near future.
Based on the above considerations, we offer a number of management guidelines and general policies to address these issues. (I) There is a need to increase the guaranteed price of organic food (mango and macadamia nut) through market regulation and government guidance, and further increase farmers’ intentions and initiatives to use integrated pest management. Baker proposed to expand the outreach and collaboration between integrated pest management and organic proponents, with compensation to farmers who provide ecosystem services [71]. (II) Financial support should also be subsidized to farmers for the purchase of agricultural materials of integrated pest management to decrease purchase input and risks of producers. (III) The education and extension of producers is a valuable component to improve the adoption of integrated pest management and further increase awareness of the risks associated with negative health and environmental impacts caused by modern chemical technology. As a result, appropriate training education offered to stakeholders is closely related to maintaining sustainability in agriculture [72]. (IV) Novel technologies for integrated pest management complementary decrease the purchase input per unit area to achieve profit maximization of the producers.
5. Conclusions
In summary, our results demonstrated that although there are significant increases in economic benefits after the conversion of MF into monoculture orchards (MM and NM), the proportion of local non-renewable resources in the total emergy input was still higher than 43.25%, leading to no significant improvement in the value of ecosystem services. The orchard legume herb intercropping systems (MVI and NDI) increased the value of ecosystem services to a greater degree as compared to the orchard monoculture systems (MM and NM). Additionally, the orchard legume herb intercropping systems also promoted the economic viability of orchards. Emergy analysis further indicated that the intercropping orchards (MVI and NDI) were superior choices for maintaining sustainability and promoting a strategy for karst rocky desertification control. Integrated pest management can further improve the long-term sustainability of intercropping systems in karst rocky desertification areas. However, owing to high EER values, the short-term sustainability of macadamia legume herb intercropping (NDI-O) decreased. Finally, our results indicate that the conversion of cropland to orchard is an effective method used to control karst rocky desertification and promote vegetation recovery, as well as economic and sustainable development in general. The findings of this study are informative for implementing karst rocky desertification control and sustainable development in the southwest karst area of China. This has implications for accelerating the extension of orchard intercropping systems in karst rocky desertification areas.
Supplementary Materials
The following supporting information can be downloaded at: https://www.mdpi.com/article/10.3390/f13101536/s1, Table S1. The emergy input of simulated systems (emergy unit: sej·ha−1). Table S2. Emergy flow structure of simulated systems (emergy unit: sej·ha−1).
Author Contributions
Conceptualization, methodology, investigation, formal analysis, writing—original draft, and writing—review and editing, H.C.; methodology, software, formal analysis, and writing—original draft, W.H.; conceptualization, formal analysis, and project administration, X.Z. (Xiaohui Zhou); investigation, supervision, and project administration, R.D.; conceptualization, validation, resources, and project administration, G.L.; conceptualization, validation, writing—review and editing, resources, and project administration, Q.L.; conceptualization, validation, and project administration, X.Z. (Xian Zhang). All authors have read and agreed to the published version of the manuscript.
Funding
This study was supported by integrated demonstration of key techniques for the industrial development of featured crops in rocky desertification areas of Yunnan–Guangxi–Guizhou provinces (SMH2019-2021), Central Public Interest Scientific Institution Basal Research Fund for the Chinese Academy of Tropical Agricultural Sciences (Nos. 1630042022003 and 1630032022011), and the Hainan Provincial Natural Science Foundation of China (421RC658).
Data Availability Statement
The data analyses in this study are available on request from Hanting Cheng.
Conflicts of Interest
The authors declare that they have no known competing financial interests or personal relationships that could have appeared to influence the work reported in this paper.
Appendix A. The Emergy Calculation Process of Five Planting Systems
1. Solar energy (J·ha−1): (1 ha) × (area, 10,000 m2·ha−1) × (annual solar radiation, 4.71 × 10⁹ J·m−2 yr−1) × (1 yr) × (1- albedo, 0.8) = 3.77 × 10¹³ J·ha−1
2. Rain chemical energy (J·ha−1): (1 ha) × (area, 10,000 m2·ha−1) × (annual rainfall, 1 m) × (density, 1000 kg·m−3) × (Gibbs free energy, 4940 J·kg−1) = 4.94 × 10¹⁰ J·ha−1
3. Rain potential energy (J·ha−1): (1 ha) × (area, 10,000 m2·ha−1) × (annual rainfall, 1 m) × (gravity, 9.8 m·s−2) × (average altitude, 1200 m) = 1.18 × 10¹¹ J·ha−1
4. Evapotranspiration energy (J·ha−1): (1 ha) × (area, 10,000 m2·ha−1) × (1- vegetation coverage, 54.54%) × (transpiration, 0.102 m·year−1) × (density, 1000 kg·m−3) × (Gibbs free energy, 4740 J kg−1) = 2.75 × 10⁹ J·ha−1
5. Runoff chemical energy (J·ha−1): (the runoff flow, 979.46 m3·ha−1) × (density, 1000 kg·m−3) × (Gibbs free energy, 4940 J·kg−1) = 4.84 × 10⁹ J·ha−1
6. Runoff geopotential energy (J·ha−1): (the runoff flow, 979.46 m3·ha−1) × (density, 1000 kg·m−3) × (average altitude, 1200 m) × (gravity, 9.8 m·s−2) = 1.15 × 10¹⁰ J·ha−1
7.SOM reduction energy (J·ha−1): (1 ha) × (area, 10,000 m2·ha−1) × (soil layer, 0.3 m) × (soil bulk density, 1400 kg·m−3) × (SOM reduction weight, 0.45 g·kg−1) × (SOM energy, 5, 400 kcal·kg−1) × (SOM coefficient, 4186 J·kcal−1) = 4.27 × 10¹⁰ J·ha−1
8. Soil erosion (g·ha−1): (1 ha) × (soil erosion, 12,793.55 kg·ha−1·yr−1) × (1000 g·kg−1) = 1.27 × 10⁷ g·ha−1
9. Labor energy (J·ha−1)
Sowing: (person, 18) × (work time, 8 h·per−1)
Fertilizer: (person, 18) × (work time, 8 h·per−1)
Pest control and weeding: (person, 3) × (work time, 8 h·per−1)
Harvest: (person, 11) × (work time, 8 h·per−1)
Labor energy (J·ha−1) = Σ (person × work time) × (labor coefficient, 3.80 × 10⁵ J·h−1) = 1.89 × 10⁷ J·ha−1
Mango monoculture sysyem (MM)
1. Solar energy (J·ha−1): (1 ha) × (area, 10,000 m2·ha−1) × (annual solar radiation, 4.71 × 10⁹ J·m−2·yr−1) × (1 yr) × (1-albedo, 0.8) = 3.77 × 10¹³ J·ha−1
2. Rain chemical energy (J·ha−1): (1 ha) × (area, 10,000 m2·ha−1) × (annual rainfall, 1 m) × (density, 1000 kg·m−3) × (Gibbs free energy, 4940 J·kg−1) = 4.94 × 10¹⁰ J·ha−1
3. Rain potential energy (J·ha−1): (1 ha) × (area, 10,000 m2·ha−1) × (annual rainfall, 1 m) × (gravity, 9.8 m·s−2) × (average altitude, 1200 m) = 1.18 × 10¹¹ J·ha−1
4. Evapotranspiration energy (J·ha−1): (1 ha) × (area, 10,000 m2·ha−1) × (1-vegetation coverage, 44.00%) × (transpiration, 0.102 m·year−1) × (density, 1000 kg m−3) × (Gibbs free energy, 4740 J kg−1) = 2.22 × 10⁹ J·ha−1
5. Runoff chemical energy (J·ha−1): (the runoff flow, 657.12 m3·ha−1) × (density, 1000 kg·m−3) × (Gibbs free energy, 4940 J·kg−1) = 3.24 × 10⁹ J·ha−1
6. Runoff geopotential energy (J·ha−1): (the runoff flow, 657.12 m3·ha−1) × (density, 1000 kg·m−3) × (average altitude, 1200 m) × (gravity, 9.8 m·s−2) = 7.73 × 10⁹ J·ha−1
7.SOM reduction energy (J·ha−1): (1 ha) × (area, 10,000 m2·ha−1) × (soil layer, 0.3 m) × (soil bulk density, 1400 kg·m−3) × (SOM reduction weight, 0 g·kg−1) × (SOM energy, 5400 kcal·kg−1) × (SOM coefficient, 4186 J·kcal−1) = 0.00 J·ha−1
8.Soil erosion (g·ha−1): (1 ha) × (soil erosion, 8598.65 kg·ha−1·yr−1) × (1000 g·kg−1) = 8.55 × 10⁶ g·ha−1
9. Labor energy (J·ha−1)
Fertilizer: (person, 16) × (work time, 8 h·per−1)
Pest control and weeding: (person, 8) × (work time, 8 h·per−1)
Pruning: (person, 44) × (work time, 8 h·per−1)
Fruits bagged: (person, 14) × (work time, 8 h·per−1)
Harvest: (person, 8) × (work time, 8 h·per−1)
Labor energy (J·ha−1) = Σ (person × work time) × (labor coefficient, 3.80 × 10⁵ J·h−1) = 3.48 × 10⁷ J·ha−1
Macadamia monoculture sysyem (NM)
1. Solar energy (J·ha−1): (1 ha) × (area, 10,000 m2·ha−1) × (annual solar radiation, 4.71 × 10⁹ J·m−2·yr−1) × (1 yr) × (1-albedo, 0.8) = 3.77 × 10¹³ J·ha−1
2. Rain chemical energy (J·ha−1): (1 ha) × (area, 10,000 m2·ha−1) × (annual rainfall, 1 m) × (density, 1000 kg·m−3) × (Gibbs free energy, 4940 J·kg−1) = 4.94 × 10¹⁰ J·ha−1
3. Rain potential energy (J·ha−1): (1 ha) × (area, 10,000 m2·ha−1) × (annual rainfall, 1 m) × (gravity, 9.8 m·s−2) × (average altitude, 1200 m) = 1.18 × 10¹¹ J·ha−1
4. Evapotranspiration energy (J·ha−1): (1 ha) × (area, 10,000 m2·ha−1) × (1-vegetation coverage, 50.00%) × (transpiration, 0.102 m·year−1) × (density, 1000 kg·m−3) × (Gibbs free energy, 4740 J kg−1) = 2.52 × 10⁹ J·ha−1
5. Runoff chemical energy (J·ha−1): (the runoff flow, 670.31 m3·ha−1) × (density, 1000 kg·m−3) × (Gibbs free energy, 4940 J·kg−1) = 3.31 × 10⁹ J·ha−1
6. Runoff geopotential energy (J·ha−1): (the runoff flow, 670.31 m3·ha−1) × (density, 1000 kg·m−3) × (average altitude, 1200 m) × (gravity, 9.8 m·s−2) = 7.89 × 10⁹ J·ha−1
7.SOM reduction energy (J·ha−1): (1 ha) × (area, 10,000 m2·ha−1) × (soil layer, 0.3 m) × (soil bulk density, 1400 kg m−3) × (SOM reduction weight, 0 g·kg−1) × (SOM energy, 5400 kcal·kg−1) × (SOM coefficient, 4186 J·kcal−1) = 0.00 J·ha−1
8. Soil erosion (g·ha−1): (1 ha) × (soil erosion, 8754.57 kg·ha−1·yr−1) × (1000 g·kg−1) = 8.72 × 10⁶ g·ha−1
9. Labor energy (J·ha−1)
Fertilizer: (person, 13) × (work time, 8 h·per−1)
Pest control and weeding: (person, 7) × (work time, 8 h·per−1)
Pruning: (person, 37per) × (work time, 8 h·per−1)
Harvest: (person, 7per) × (work time, 8 h·per−1)
Labor energy (J·ha−1) = Σ (person × work time) × (labor coefficient, 3.80 × 10⁵ J·h−1) = 2.42 × 10⁷ J·ha−1
Mango-Vicia angustifolia intercropping sysyem (MVI)
1. Solar energy (J·ha−1): (1 ha) × (area, 10,000 m2·ha−1) × (annual solar radiation, 4.71 × 10⁹ J·m−2·yr−1) × (1 yr) × (1-albedo, 0.8) = 3.77 × 10¹³ J·ha−1
2. Rain chemical energy (J·ha−1): (1 ha) × (area, 10,000 m2·ha−1) × (annual rainfall, 1 m) × (density, 1000 kg·m−3) × (Gibbs free energy, 4940 J·kg−1) = 4.94 × 10¹⁰ J·ha−1
3. Rain potential energy (J·ha−1): (1 ha) × (area, 10,000 m2·ha−1) × (annual rainfall, 1 m) × (gravity, 9.8 m·s−2) × (average altitude, 1200 m) = 1.18 × 10¹¹ J·ha−1
4. Evapotranspiration energy (J·ha−1): (1 ha) × (area, 10,000 m2·ha−1) × (1-vegetation coverage, 1.46%) × (transpiration, 0.102 m·year−1) × (density, 1000 kg·m−3) × (Gibbs free energy, 4740 J kg−1) = 7.36 × 10⁷ J·ha−1
5. Runoff chemical energy (J·ha−1): (the runoff flow, 322.34 m3·ha−1) × (density, 1000 kg·m−3) × (Gibbs free energy, 4940 J·kg−1) = 1.59 × 10⁹ J·ha−1
6. Runoff geopotential energy (J·ha−1): (the runoff flow, 322.34 m3·ha−1) × (density, 1000 kg·m−3) × (average altitude, 1200 m) × (gravity, 9.8 m·s−2) = 3.79 × 10⁹ J·ha−1
7.SOM reduction energy (J·ha−1): (1 ha) × (area, 10,000 m2·ha−1) × (soil layer, 0.3 m) × (soil bulk density, 1400 kg m−3) × (SOM reduction weight, 0 g·kg−1) × (SOM energy, 5400 kcal·kg−1) × (SOM coefficient, 4186 J·kcal−1) = 0.00 J·ha−1
8. Soil erosion (g·ha−1): (1 ha) × (soil erosion, 167.92 kg·ha−1·yr−1) × (1000 g·kg−1) = 1.68 × 10⁵ g·ha−1
9. Labor energy (J·ha−1)
Sowing: (person, 1) × (work time, 4 h·per−1)
Fertilizer: (person, 15) × (work time, 8 h·per−1)
Pest control and weeding: (person, 7) × (work time, 8 h·per−1)
Pruning: (person, 44) × (work time, 8 h·per−1)
Fruits bagged: (person, 14) × (work time, 8 h·per−1)
Harvest: (person, 8per) × (work time, 8 h·per−1)
Labor energy (J·ha−1) = Σ (person × work time) × (labor coefficient, 3.80 × 10⁵ J·h−1) = 3.43 × 10⁷ J·ha−1
Macadamia-Desmodium intortum intercropping system (NDI)
1. Solar energy (J·ha−1): (1 ha) × (area, 10,000 m2·ha−1) × (annual solar radiation, 4.71 × 10⁹ J·m−2·yr−1) × (1 yr) × (1-albedo, 0.8) = 3.77 × 10¹³ J·ha−1
2. Rain chemical energy (J·ha−1): (1 ha) × (area, 10,000 m2·ha−1) × (annual rainfall, 1 m) × (density, 1000 kg·m−3) × (Gibbs free energy, 4940 J·kg−1) =4.94 × 10¹⁰ J·ha−1
3. Rain potential energy (J·ha−1): (1 ha) × (area, 10,000 m2·ha−1) × (annual rainfall, 1 m) × (gravity, 9.8 m·s−2) × (average altitude, 1200 m) = 1.18 × 10¹¹ J·ha−1
4. Evapotranspiration energy (J·ha−1): (1 ha) × (area, 10,000 m2·ha−1) × (1-vegetation coverage, 0.01%) × (transpiration, 0.102 m year−1) × (density, 1000 kg·m−3) × (Gibbs free energy, 4740 J kg−1) = 5.03 × 10⁵ J·ha−1
5. Runoff chemical energy (J·ha−1): (the runoff flow, 273.61 m3·ha−1) × (density, 1000 kg·m−3) × (Gibbs free energy, 4940 J·kg−1) = 1.35 × 10⁹ J·ha−1
6. Runoff geopotential energy (J·ha−1): (the runoff flow, 273.61 m3·ha−1) × (density, 1000 kg·m−3) × (average altitude, 1200 m) × (gravity, 9.8 m·s−2) = 3.22 × 10⁹ J·ha−1
7.SOM reduction energy (J·ha−1): (1 ha) × (area, 10,000 m2·ha−1) × (soil layer, 0.3 m) × (soil bulk density, 1400 kg·m−3) × (SOM reduction weight, 0 g·kg−1) × (SOM energy, 5400 kcal·kg−1) × (SOM coefficient, 4186 J·kcal−1) = 0.00 J·ha−1
8. Soil erosion (g·ha−1): (1 ha) × (soil erosion, 63.87 kg·ha−1·yr−1) × (1000 g·kg−1) = 6.39 × 10⁴ g·ha−1
9. Labor energy (J·ha−1)
Sowing: (person, 1) × (work time, 4 h·per−1)
Fertilizer: (person, 12) × (work time, 8 h·per−1)
Pest control and weeding: (person, 6) × (work time, 8 h·per−1)
Pruning: (person, 37) × (work time, 8 h·per−1)
Harvest: (person, 7) × (work time, 8 h·per−1)
Labor energy (J·ha−1) = Σ (person × work time) × (labor coefficient, 3.80 × 10⁵ J·h−1) = 2.37 × 10⁷ J·ha−1
Total cost:
Maize field sysyem (MF)
Urea (RMB) = 1200 kg·ha−1 × 6 yuan·kg−1 = 7200 yuan·ha−1
Compound fertilizer (RMB) = 650 kg·ha−1 × 7.8 yuan·kg−1 = 5070 yuan·ha−1
Pesticides (RMB) = 6.18 kg·ha−1× 60 yuan·kg−1 = 370.8 yuan·ha−1
Seed (RMB) = 30 kg·ha−1× 70 yuan·kg−1 = 2100 yuan·ha−1
Labor (RMB) = 50 per·ha−1 × 100 yuan·per−1 = 5000 yuan·ha−1
Mango monoculture sysyem (MM)
Compound fertilizer (RMB) =2300 kg·ha−1× 7.8 yuan·kg−1 = 17,940 yuan·ha−1
Paper bags (RMB) = 82,100 per·ha−1 × 0.04 yuan·per−1 = 3284 yuan·ha−1
Pesticides (RMB) = 6.72 kg·ha−1 × 100 yuan·kg−1 = 672 yuan·ha−1
Machinery (RMB) = 3 per·ha−1× 10⁵ yuan·per−1 = 315 yuan·ha−1
Labor (RMB) = 90 per·ha−1 × 100 yuan·per−1 = 9000 yuan·ha−1
Extra cost:
Films (RMB) =1.5 kg·ha−1 × 12.5 yuan·kg−1 = 18.75 yuan·ha−1
Mango seedlings (RMB) = 597 per·ha−1 × 12 yuan·per−1 = 7146 yuan·ha−1
Macadamia monoculture sysyem (NM)
Compound fertilizer (RMB) = 500 kg·ha−1 × 7.8 yuan·kg−1 = 3900 yuan·ha−1
Machinery (RMB) = 3 per·ha−1 × 10⁵ yuan·per−1 = 315 yuan·ha−1
Pesticides (RMB) = 6 kg·ha−1 × 100 yuan·kg−1 = 600 yuan·ha−1
Labor (RMB) = 64 per·ha−1 × 100 yuan·per−1 = 6400 yuan·ha−1
Extra cost:
Films (RMB) =1.2 kg·ha−1 × 12.5 yuan·kg−1= 15 yuan·ha−1
Nut seedlings (RMB) = 493 per·ha−1 × 15 yuan·per−1 = 7395 yuan·ha−1
Mango-Vicia angustifolia intercropping sysyem (MVI)
Compound fertilizer (RMB) = 1495 kg·ha−1 × 7.8 yuan·kg−1 = 11,661 yuan·ha−1
Paper bags (RMB) = 82,100 per·ha−1 × 0.04 yuan·per−1 = 3284 yuan·ha−1
Pesticides (RMB) = 6.05 kg·ha−1 × 100 yuan·kg−1 = 605 yuan·ha−1
Machinery (RMB) = 1 per·ha−1 × 10⁵ yuan·per−1 =105 yuan·ha−1
Organic fertilizer (sheep manure) (RMB) =14.93 t·ha−1 × 700 yuan·t−1 = 10,451 yuan·ha−1
Labor (RMB) = 88 per·ha−1 × 100 yuan·per−1 = 8800 yuan·ha−1
Extra cost:
Films (RMB) = 1.5 kg·ha−1 × 12.5 yuan·kg−1 = 18.75 yuan·ha−1
Mango seedlings (RMB) = 597 per·ha−1 × 12 yuan·per−1 = 7146 yuan·ha−1
Legume seed (RMB) = 5.5 kg·ha−1 × 15 yuan·kg−1 = 82.5 yuan·ha−1
Labor (RMB) = 0.5 per·ha−1 × 100 yuan·per−1 = 50 yuan·ha−1
Macadamia-Desmodium intortum intercropping system (NDI)
Compound fertilizer (RMB) = 325 kg·ha−1 × 7.8 yuan·kg−1 = 2535 yuan·ha−1
Machinery (RMB) = 1 per·ha−1 × 10⁵ yuan·per−1 = 105 yuan·ha−1
Pesticides (RMB) = 5.4 kg·ha−1 × 100 yuan·kg−1 = 540 yuan·ha−1
Organic fertilizer (sheep manure) (RMB) = 2.37 kg·ha−1 × 700 yuan·kg−1 = 1659 yuan·ha−1
Labor (RMB) = 62 per·ha−1 × 100 yuan·per−1 = 6200 yuan·ha−1
Extra cost:
Films (RMB) =1.2 kg·ha−1 × 12.5 yuan·kg−1 = 15 yuan·ha−1
Nut seedlings (RMB) = 493 per·ha−1 × 15 yuan·per−1 = 7395 yuan·ha−1
Legume seed (RMB) = 5.5 kg·ha−1 × 15 yuan·kg−1 = 82.5 yuan·ha−1
Labor (RMB) = 0.5 per·ha−1 × 100 yuan·per−1 = 50 yuan·ha−1
References
- Li, D.; Wen, L.; Jiang, S.; Song, T.; Wang, K. Responses of soil nutrients and microbial communities to three restoration strategies in a karst area, southwest China. J. Environ. Manag. 2018, 207, 456–464. [Google Scholar] [CrossRef]
- Hu, P.; Liu, S.; Ye, Y.; Zhang, W.; He, X.; Su, Y.; Wang, K. Soil carbon and nitrogen accumulation following agricultural abandonment in a subtropical karst region. Appl. Soil Ecol. 2018, 132, 169–178. [Google Scholar] [CrossRef]
- Cheng, H.T.; Li, Q.F.; Wang, X.M.; Lu, T.Y.; Zhang, X.B. Effects of Different Vegetation Restoration Strategies on Soil Penetrability of Karst Ecosystem in Guizhou Province. J. Soil Water Conserv. 2020, 34, 110–116. (In Chinese) [Google Scholar]
- Jiang, Z.; Lian, Y.; Qin, X. Rocky desertification in Southwest China: Impacts, causes, and restoration. Earth Sci. Rev. 2014, 132, 1–12. [Google Scholar] [CrossRef]
- Chen, H.; Yue, Y.; Wang, K. Comprehensive control on rocky desertification in karst regions of southwestern China: Achievements, problems, and countermeasures. Carsolog. Sin. 2018, 37, 37–42. Available online: https://kns.cnki.net/kcms/detail/45.1157.p.20171127.0944.002.html (accessed on 15 August 2017).
- Song, T.Q.; Peng, W.X.; Du, H.; Wang, K.L.; Zeng, F.P. Occurrence, spatial-temporal dynamics and regulation strategies of karst rocky desertification in southwest China. Acta Ecol. Sin. 2014, 34, 5328–5341. (In Chinese) [Google Scholar]
- Amiri, Z.; Asgharipour, M.R.; Campbell, D.E.; Armin, M. A Sustainability Analysis of Two Rapeseed Farming Ecosystems in Khorramabad, Iran Based on Emergy and Economic Analyses. J. Clean. Prod. 2019, 226, 1051–1066. [Google Scholar] [CrossRef]
- Lu, X.; Toda, H.; Ding, F.; Fang, S.; Yang, W.; Xu, H. Effect of vegetation types on chemical and biological properties of soils of karst ecosystems. Eur. J. Soil. Biol. 2014, 61, 49–57. [Google Scholar] [CrossRef]
- Cheng, F.; Lu, H.; Ren, H.; Zhou, L.; Zhang, L.; Li, J.; Lu, X.; Huang, D.; Zhao, D. Integrated emergy and economic evaluation of three typical rocky desertification control modes in karst areas of Guizhou Province, China. J. Clean. Prod. 2017, 161, 1104–1128. [Google Scholar] [CrossRef]
- Odum, H.T. Environmental Accounting: Emergy and Environmental Decision Making; Wiley: New York, NY, USA, 1996. [Google Scholar]
- Geng, Y.; Sarkis, J.; Ulgiati, S.; Zhang, P. Measuring China’s Circular Economy. Science 2013, 339, 1526–1527. Available online: https://www.science.org/doi/10.1126/science.1227059 (accessed on 29 March 2013). [CrossRef]
- Amiri, Z.; Asgharipour, M.R.; Campbell, D.E.; Azizi, K.; Kakolvand, E.; Moghadam, E.H. Conservation agriculture, a selective model based on emergy analysis for sustainable production of shallot as a medicinal-industrial plant. J. Clean. Prod. 2021, 292, 126000–126019. [Google Scholar] [CrossRef]
- Calvo, G.; Valero, A.; Valero, A. Material flow analysis for Europe: An exergoecological approach. Ecol. Indic. 2016, 60, 603–610. [Google Scholar] [CrossRef]
- Steinberger, J.K.; Krausmann, F.; Eisenmenger, N. Global patterns of materials use: A socioeconomic and geophysical analysis. Ecol. Econ. 2010, 69, 1148–1158. [Google Scholar] [CrossRef]
- Van der Wiel, B.Z.; Weijma, J.; van Middelaar, C.E.; Kleinke, M.; Buisman, C.J.N.; Wichern, F. Restoring nutrient circularity: A review of nutrient stock and flow analyses of local agro-food-waste systems. Resour. Conserv. Recycl. X 2019, 3, 100014. [Google Scholar] [CrossRef]
- Wu, H.; Huang, Z.; Gao, L.; Li, H.; Yang, T.; Yang, J.; Li, X. Understanding Farmers’ Behaviors and Driving Factors Toward Phosphorus Security of Crop Farming in Chaohu Watershed, China. Pol. J. Environ. Stud. 2021, 30, 1865–1879. [Google Scholar] [CrossRef]
- Liu, Z.; Li, B.; Chen, M.; Li, T. Evaluation on sustainability of water resource in karst area based on the emergy ecological footprint model and analysis of its driving factors: A case study of Guiyang city, China. Environ. Sci. Pollut. Res. 2021, 28, 49232–49243. [Google Scholar] [CrossRef]
- Wang, Z.; Yang, L.; Yin, J.; Zhang, B. Assessment and prediction of environmental sustainability in China based on a modified ecological footprint model. Resour. Conserv. Recycl. X 2018, 132, 301–313. [Google Scholar] [CrossRef]
- Chen, W.; Zhang, X.; Huang, Y.J.E.S.; Research, P. Spatial and temporal changes in ecosystem service values in karst areas in southwestern China based on land use changes. Environ. Sci. Pollut. Res. Int. 2021, 28, 45724–45738. [Google Scholar] [CrossRef]
- Tamburini, E.; Pedrini, P.; Marchetti, M.G.; Fano, E.A.; Castaldelli, G. Life Cycle Based Evaluation of Environmental and Economic Impacts of Agricultural Productions in the Mediterranean Area. Sustainability 2015, 7, 2915–2935. [Google Scholar] [CrossRef]
- Campbell, D.E. Emergy baseline for the Earth: A historical review of the science and a new calculation. Ecol. Model. 2016, 339, 96–125. [Google Scholar] [CrossRef]
- Asgharipour, M.R.; Amiri, Z.; Campbell, D.E. Evaluation of the sustainability of four greenhouse vegetable production ecosystems based on an analysis of emergy and social characteristics. Ecol. Model. 2020, 424, 109021–109038. [Google Scholar] [CrossRef]
- Liu, W.; Wang, J.; Sun, L.; Wang, T.; Li, C.; Chen, B. Sustainability evaluation of soybean-corn rotation systems in the Loess Plateau region of Shaanxi, China. J. Clean. Prod. 2019, 210, 1229–1237. [Google Scholar] [CrossRef]
- Nan, B.; Li, B.; Yang, Z.; Dai, X.; Fan, Y.; Fu, Q.; Hao, L.; Zhang, X. Sustainability of sown systems of cultivated grassland at the edge of the Junggar Desert Basin: An integrated evaluation of emergy and economics. J. Clean. Prod. 2020, 276, 122800–122811. [Google Scholar] [CrossRef]
- Cheng, H.; Chen, C.; Wu, S.; Mirza, Z.A.; Liu, Z. Emergy evaluation of cropping, poultry rearing, and fish raising systems in the drawdown zone of Three Gorges Reservoir of China. J. Clean. Prod. 2017, 144, 559–571. [Google Scholar] [CrossRef]
- Hou, J.; Wang, X.; Xu, Q.; Cao, Y.; Zhu, J. Rice-crayfish systems are not a panacea for sustaining cleaner food production. Environ. Sci. Pollut. Res. Int. 2021, 28, 22913–22926. [Google Scholar] [CrossRef] [PubMed]
- Wang, C.; Wang, Y.; Geng, Y.; Wang, R.; Zhang, J. Measuring regional sustainability with an integrated social-economic-natural approach: A case study of the Yellow River Delta region of China. J. Clean. Prod. 2016, 114, 189–198. [Google Scholar] [CrossRef]
- Jaklič, T.; Juvančič, L.; Kavčič, S.; Debeljak, M. Complementarity of socio-economic and emergy evaluation of agricultural production systems: The case of Slovenian dairy sector. Ecol. Econ. 2014, 107, 469–481. [Google Scholar] [CrossRef]
- Kocjančič, T.; Debeljak, M.; Žgajnar, J.; Juvančič, L. Incorporation of emergy into multiple-criteria decision analysis for sustainable and resilient structure of dairy farms in Slovenia. Agric. Syst. 2018, 164, 71–83. [Google Scholar] [CrossRef]
- Zou, Z.; Zeng, F.; Wang, K.; Zeng, Z.; Zhao, L.; Du, H.; Zhang, F.; Zhang, H. Emergy and Economic Evaluation of Seven Typical Agroforestry Planting Patterns in the Karst Region of Southwest China. Forests 2019, 10, 138. [Google Scholar] [CrossRef]
- Fonseca, A.M.P.; Marques, C.A.F.; Pinto-Correia, T.; Campbell, D.E. Emergy analysis of a silvo-pastoral system, a case study in southern Portugal. Agroforestr. Syst. 2015, 90, 137–157. [Google Scholar] [CrossRef]
- Fonseca, A.M.P.; Marques, C.; Pinto-Correia, T.; Guiomar, N.; Campbell, D.E. Emergy evaluation for decision-making in complex multifunctional farming systems. Agric. Syst. 2019, 171, 1–12. [Google Scholar] [CrossRef] [PubMed]
- Antoniou, N.; Monlau, F.; Sambusiti, C.; Ficara, E.; Barakat, A.; Zabaniotou, A. Contribution to Circular Economy options of mixed agricultural wastes management: Coupling anaerobic digestion with gasification for enhanced energy and material recovery. J. Clean. Prod. 2019, 209, 505–514. [Google Scholar] [CrossRef]
- Xu, Z.; Fan, W.; Dong, X.; Wang, X.-C.; Liu, Y.; Xue, H.; Klemeš, J.J. Analysis of the functional orientation of agricultural systems from the perspective of resource circulation. J. Clean. Prod. 2020, 258, 120642–120658. [Google Scholar] [CrossRef]
- Zhan, C.; Zhao, R.; Hu, S. Emergy-based sustainability assessment of forest ecosystem with the aid of mountain eco-hydrological model in Huanjiang County, China. J. Clean. Prod. 2020, 251, 119638–119652. [Google Scholar] [CrossRef]
- Odum, H.T. Systems Ecology; Wiley: New York, NY, USA, 1983. [Google Scholar]
- Ulgiati, S.; Odum, H.T.; Bastianoni, S. Emergy use, environmental loading and sustainability an emergy analysis of Italy. Ecol. Model. 1994, 73, 215–268. [Google Scholar] [CrossRef]
- Campbell, D.E.; Brandt-Williams, S.L.; Meisch, M.E. Environmental Accounting Using Emergy: Evaluation of the State of West Virginia; US Environmental Protection Agency, Office of Research and Development: Washington, DC, USA, 2005.
- Asgharipour, M.R.; Shahgholi, H.; Campbell, D.E.; Khamari, I.; Ghadiri, A. Comparison of the sustainability of bean production systems based on emergy and economic analyses. Environ. Monit. Assess. 2019, 191, 2. [Google Scholar] [CrossRef]
- Cohen, M.J.; Brown, M.T.; Shepherd, K.D. Estimating the environmental costs of soil erosion at multiple scales in Kenya using emergy synthesis. Agric. Ecosyst. Environ. 2006, 114, 249–269. [Google Scholar] [CrossRef]
- Lu, H.; Campbell, D.E. Ecological and economic dynamics of the Shunde agricultural system under China’s small city development strategy. J. Environ. Manag. 2009, 90, 2589–2600. [Google Scholar] [CrossRef]
- Rótolo, G.C.; Francis, C.A.; Ulgiati, S. Environmentally sound resource valuation for a more sustainable international trade: Case of argentine maize. Resour. Conserv. Recycl. X 2018, 131, 271–282. [Google Scholar] [CrossRef]
- Brown, M.T.; Ulgiati, S. Emergy assessment of global renewable sources. Ecol. Model. 2016, 339, 148–156. [Google Scholar] [CrossRef]
- Lu, N.; Wei, H.; Fan, W.; Xu, Z.; Wang, X.; Xing, K.; Dong, X.; Viglia, S.; Ulgiati, S. Multiple influences of land transfer in the integration of Beijing-Tianjin-Hebei region in China. Ecol. Indic. 2018, 90, 101–111. [Google Scholar] [CrossRef]
- Dai, E.; Zhu, J.; Wang, X.; Xi, W. Multiple ecosystem services of monoculture and mixed plantations: A case study of the Huitong experimental forest of Southern China. Land Use Policy 2018, 79, 717–724. [Google Scholar] [CrossRef]
- Yang, Q.; Liu, G.; Casazza, M.; Campbell, E.T.; Giannetti, B.F.; Brown, M.T. Development of a new framework for non-monetary accounting on ecosystem services valuation. Ecosyst. Serv. 2018, 34, 37–54. [Google Scholar] [CrossRef]
- Yang, X.; Sui, P.; Zhang, X.; Dai, H.; Yan, P.; Li, C.; Wang, X.; Chen, Y. Environmental and economic consequences analysis of cropping systems from fragmented to concentrated farmland in the North China Plain based on a joint use of life cycle assessment, emergy and economic analysis. J. Environ. Manag. 2019, 251, 109588–109600. [Google Scholar] [CrossRef] [PubMed]
- Yi, L.X.; Xia, R.Y.; Wang, Z.; Lu, H.P.; Zhao, L.J. Infiltration coefficient of precipitation in karst peak-cluster depression area: A case study of Zhaidi karst underground river basin. Carsolog. Sin. 2017, 512–517. (In Chinese) [Google Scholar] [CrossRef]
- Brown, M.T.; Ulgiati, S. Emergy-based indices and ratios to evaluate sustainability: Monitoring economies and technology toward environmentally sound innovation. Ecol. Eng. 1997, 9, 51–69. [Google Scholar] [CrossRef]
- Lu, H.F.; Lan, S.F.; Li, L.; Peng, S.L. New emergy indices for sustainable development. J. Environ. Sci. 2003, 15, 562–569. (In Chinese) [Google Scholar]
- Odum, H.; Brown, M.; Williams, S. Folio #1: Introduction and Global Budget. In Handbook of Emergy Evaluation; Center for Environmental Policy, Environmental Engineering Sciences, University of Florida: Gainesville, FL, USA, 2000; pp. 7–8. [Google Scholar]
- Agostinho, F.; Diniz, G.M.; Siche, R.; Ortega, E. The use of emergy assessment and the Geographical Information System in the diagnosis of small family farms in Brazil. Ecol. Model. 2008, 210, 37–57. [Google Scholar] [CrossRef]
- Lu, H.; Bai, Y.; Ren, H.; Campbell, D.E. Integrated emergy, energy and economic evaluation of rice and vegetable production systems in alluvial paddy fields: Implications for agricultural policy in China. J. Environ. Manag. 2010, 91, 2727–2835. [Google Scholar] [CrossRef]
- Gasparatos, A.; Gadda, T. Environmental support, energy security and economic growth in Japan. Energy Policy 2009, 37, 4038–4048. [Google Scholar] [CrossRef]
- Li, S.; Wu, J.; Wang, X.; Ma, L. Economic and environmental sustainability of maize-wheat rotation production when substituting mineral fertilizers with manure in the North China Plain. J. Clean. Prod. 2020, 271, 122683–122694. [Google Scholar] [CrossRef]
- Dai, X.; Zhou, W.; Liu, G.; Liang, G.; He, P.; Liu, Z. Soil C/N and pH together as a comprehensive indicator for evaluating the effects of organic substitution management in subtropical paddy fields after application of high-quality amendments. Geoderma 2019, 337, 1116–1125. [Google Scholar] [CrossRef]
- Zhang, B.; Su, S.; Duan, C.; Feng, H.; Chau, H.W.; He, J.; Li, Y.; Hill, R.L.; Wu, S.; Zou, Y. Effects of partial organic fertilizer replacement combined with rainwater collection system on soil water, nitrate-nitrogen and apple yield of rainfed apple orchard in the Loess Plateau of China: A 3-year field experiment. Agric. Water Manag. 2022, 260, 107295–107306. [Google Scholar] [CrossRef]
- Xiao, L.Y.; Wu, X.Q.; Zhou, J.X.; Xiao, G.Y. Comprehensive Benefit Evaluation of Rocky Desertification Control in the Typical County of Karst Fault Basin: A Case Study of Jianshui County, Yunnan Province. Acta Geosci. Sin. 2020, 42, 444–450. (In Chinese) [Google Scholar]
- Zhang, M.; Wang, K.; Liu, H.; Zhang, C.; Yue, Y.; Qi, X. Effect of ecological engineering projects on ecosystem services in a karst region: A case study of northwest Guangxi, China. J. Clean. Prod. 2018, 183, 831–842. [Google Scholar] [CrossRef]
- Chen, X.; Zhang, W.; Wang, X.; Liu, Y.; Yu, B.-G.; Chen, X.-P.; Zou, C. Life cycle assessment of a long-term multifunctional winter wheat-summer maize rotation system on the North China Plain under sustainable P management. Sci. Total Environ. 2021, 783, 147039. [Google Scholar] [CrossRef]
- Helgason, B.L.; Walley, F.L.; Germida, J.J. No-till soil management increases microbial biomass and alters community profiles in soil aggregates. Appl. Soil Ecol. 2010, 46, 390–397. [Google Scholar] [CrossRef]
- Gao, X.; Liu, Z.; Zhao, X.; Ling, Q.; Huo, G.; Wu, P. Extreme natural drought enhances interspecific facilitation in semiarid agroforestry systems. Agric. Ecosyst. Environ. 2018, 265, 444–453. [Google Scholar] [CrossRef]
- Zhang, R.; Huang, Q.; Yan, T.; Yang, J.; Zheng, Y.; Li, H.; Li, M. Effects of intercropping mulch on the content and composition of soil dissolved organic matter in apple orchard on the loess plateau. J. Environ. Manag. 2019, 250, 109531–109540. [Google Scholar] [CrossRef]
- Wang, Y.; Huang, Q.; Gao, H.; Zhang, R.; Yang, L.; Guo, Y.; Li, H.; Awasthi, M.K.; Li, G. Long-term cover crops improved soil phosphorus availability in a rain-fed apple orchard. Chemosphere 2021, 275, 130093. [Google Scholar] [CrossRef]
- Fan, F.; van der Werf, W.; Makowski, D.; Lamichhane, J.R.; Huang, W.; Li, C.; Zhang, C.; Cong, W.-F.; Zhang, F. Cover crops promote primary crop yield in China: A meta-regression of factors affecting yield gain. Field Crops Res. 2021, 271, 108237–108247. [Google Scholar] [CrossRef]
- FAO. The Future of Food and Agriculture—Trends and Challenges; Food and Agriculture Organization of the United Nations: Rome, Italy, 2017. [Google Scholar]
- Zikankuba, V.L.; Mwanyika, G.O.; Ntwenya, J.E.; James, A. Pesticide regulations and their malpractice implications on food and environment safety. Cogent Food Agric. 2019, 5, 1601544. [Google Scholar] [CrossRef]
- Dhananjayan, V.; Ravichandran, B. Occupational health risk of farmers exposed to pesticides in agricultural activities. Curr. Opin. Environ. Sci. Health 2018, 4, 31–37. [Google Scholar] [CrossRef]
- Maira, N.B.; Nayane, F.B.; Willian, N.D.S.; Cristina, A.F.; Thiago, A.V.; Denise, C.L. Beneficial soil fungi and Jabuticaba growth promotion. Agronomy 2021, 12, 367. [Google Scholar] [CrossRef]
- Jitendra, K.; Ayyagari, R.; Dharmendra, M.; Vachaspati, M. Review an overview of some biopesticides and their importance in plant protection for commercial acceptance. Plants 2021, 10, 1185. [Google Scholar] [CrossRef]
- Baker, B.P.; Green, T.A.; Loker, A. Biological control and integrated pest management in organic and conventional systems. Biol. Control. 2020, 140, 104095–104105. [Google Scholar] [CrossRef]
- Lykogianni, M.; Bempelou, E.; Karamaouna, F.; Aliferis, K.A. Do pesticides promote or hinder sustainability in agriculture? The challenge of sustainable use of pesticides in modern agriculture. Sci. Total Environ. 2021, 795, 148625–148637. [Google Scholar] [CrossRef]
Publisher’s Note: MDPI stays neutral with regard to jurisdictional claims in published maps and institutional affiliations. |
© 2022 by the authors. Licensee MDPI, Basel, Switzerland. This article is an open access article distributed under the terms and conditions of the Creative Commons Attribution (CC BY) license (https://creativecommons.org/licenses/by/4.0/).

