Article

The Effect of Different Road Types on Timber Truck Drivers by Assessing the Load Environment of Drivers by Monitoring Changes in Muscle Tension

Department of Forestry Technologies and Construction, Faculty of Forestry and Wood Sciences, Czech University of Life Sciences Prague, Kamýcká 129, 165 21 Prague, Czech Republic
*
Author to whom correspondence should be addressed.
Forests 2022, 13(10), 1565; https://doi.org/10.3390/f13101565
Submission received: 30 August 2022 / Revised: 19 September 2022 / Accepted: 20 September 2022 / Published: 25 September 2022
(This article belongs to the Section Forest Operations and Engineering)

Abstract

:
Our research aimed to quantify stress load in drivers by monitoring the load on the radial extensor carpi radialis (musculus extensor carpi radialis) on different types of forest and other categories of roads. We observed changes in the electrical potential of skeletal muscles using electromyographic measurements and changes in heart rate using a Biofeedback2000 x-pert recorder. We measured the loading of drivers during the normal operation of timber trucks and timber trucks with trailers, while the reference measurements took place in a passenger car. We obtained descriptive statistics from the individual measurements and evaluated the normality of the measured data. Differences in muscle load increased when driving on lower-grade roads. The muscle load increased significantly, especially when passing through villages, inversely proportional to the width of the roads and the radius of their bends. Experiments revealed that the drivers of loaded vehicles who drove on lower-grade roads were under higher stress. Muscle load of drivers a loaded timber truck with a trailer was more difficult on roads of lower grades than on roads of grade I by 41.3%. Driving a timber truck is 21.9% more difficult on lower grade roads than on grade I roads. For preventive health and safety reasons, it is optimal to alternate trucking with a different type of work, thus minimizing the chance of occurrence of health disabilities.

1. Introduction

Timber can be transported on forest, rural, and land roads by various vehicles with suitable technical modifications. The yearbook of the Czech Statistical Office reports that in the years 2019 and 2020, a total of 68.39 million m3, i.e., approx. 31.39 million tons of timber, were trucked on the Czech road network. In comparison, 963 million tons of goods were transported via the Czech road network during the same period, of which 350 million tons were minerals (coal, stone, oil, and petroleum products) [1]. When transporting timber from the roadside to the customer or conversion depots, a timber truck or a truck and trailer combination is usually used (Figure 1). We choose the particular alternative to match the size of the commodity (e.g., logs, stems, wood chips), the carrying capacity, and the technical parameters of the roads used [2]. Drivers transporting firewood must be able to load, transfer and unload both leveled assortments of firewood, stems, or whole trees. Hauling loads of different dimensions affects the mental and physical load of drivers and, consequently, the level of work performance [3,4]. With the length of the exposure, different types of health problems develop in the background, with varying intensity and visibility. High demands on concentration, quick decision making and reactions, stress, and muscle strain are key factors affecting the work of a professional driver. The loading intensity depends on the vehicle used, its mode of operation, the bundled wood’s shape, and the road’s parameters.
The issue of occupational safety and health in timber trucking, the working conditions in which the truck drivers work, and their stress load continue to gain the interest of researchers. Previously published studies mainly dealt with the working conditions of drivers, especially from the side of ergonomics of the driver’s workplace (positioning of control elements, vibration, temperature, noise). Such studies focused on drivers’ work environment, workload, and the character of the work environment from a physical point of view [5]. They observed the parameters of the driver’s seat and the requirements for its properties and quality [5,6,7]. The experimental measurements evaluated selected driving factors, e.g., vibrations, and their effect on the myoskeletal and cardiovascular systems of the drivers. Researchers further studied the effect of uneven distribution of drivers’ working hours [8,9], the effect of working far from the family [10,11,12] and at a long distance from home (transcontinental and international transport), and stress caused by a significant imbalance between work and private life [13,14], but also, e.g., in an international study on the effect of road and air traffic noise on health [15] or, especially in the countryside, the effect of birdsong [16]. The results of these studies show a significant influence of social, family, and economic factors on the intensity of the psychological burden of truck drivers. Furthermore, a combination of excessive work demands and stress is associated with poorer sleep due to poor work–life balance. Extended work shifts lead to increased stress, conflicts with personal life, and reduced sleep quality [17].
Truck drivers regularly work extended and unevenly spaced shifts. They are limited in delivering the transported goods to the designated place, i.e., they work in stressful conditions with irregular work and sleep regimes [18]. As shown by the statistics of analyses of the causes of traffic accidents, fatigue can be considered one of the leading causes of traffic accidents [19,20,21]. The source of fatigue is excessive strain due to static work and mental strain (overloading or monotony) [22]. The lack of situation awareness is thus the result of several factors, such as inattention, sleepiness, and fatigue-related errors in judgment [23].
Driving on long routes, particularly monotonous driving on higher-grade roads, increases the risk of fatigue and microsleep. The risk increases because the monotonous execution of one or several simple actions, performed even with a small force, increases psychological loading [24,25]. We can use subjective perceptions (e.g., questionnaires) [26] or objective observations of physiological functions to observe the loading. In the latter case, Chen [27] advises using non-invasive methods (sensing biosignals from the body surface). Another approach is to observe the changes in physiological variables, e.g., tracking the speed of reaction to a change in the situation depending on the length or intensity of the visual loading via observations of eye movements [28]. It is advantageous to combine methods of subjective and objective data collection, e.g., comparing the description of the subjective perception of visual loading with the measured speed of reaction to a visual stimulus [27]. Ever since the first collection of changes in physiological functions, efforts were made to automate the data collection. This includes electrocardiography (ECG), electromyography (EMG), galvanic skin response (GSR), and heart rate (HR). For example, EMG can be sampled at a frequency of 15.5 Hz after first passing through an averaging filter for 0.5 s. The onboard computer then collects the signals in the vehicle [27]. The main advantage of multivariate measurement models is that they solve many problems, which helps doctors treat patients more efficiently or focus on preventive measures [29].
Research dealing with drivers’ stress levels was primarily looking for methods that can monitor and evaluate these levels in practice [30,31]. Hu [32]., for example, studied the electromyographic activity of the driver’s muscles while driving a truck on roads with different roughness. In addition, Sekkay [33] studied the limits of the musculoskeletal pain thresholds for the physical loading of truck drivers. Thus, assessing a driver’s workload through physiological parameters provides valuable information [34]. For example, Szeto [35] used ECG and EMG signals to assess fatigue in public transport drivers. Several other studies [27,29,31,36,37,38,39,40,41] studied changes in ECG, EEG, EMG, heart rate, body temperature or skin reactions to observe the reactions of car drivers in connection to traffic stress situations and accidents. Said studies list several effective methods that monitor driver behavior and detect behavioral patterns and mental states. These approaches can be summarized as contact measurements extracted from physiological signals. According to Vicente et al. [31] and Zheng et al. [29], methods used for observations of physiological (bio)signals to detect changes in the driver’s condition also apply in research focused on the stress loading of drivers. Alternatively, Babic [42] has used eye-tracking technology on drivers and its relationship with the visual information processing speeds and driver fatigue, e.g., from traffic signs. Additionally, Szewczyk [43] used eye-tracking technology in assessing the psychological load of a harvester operators. The increasing popularity of modern methods that analyze physiological signals is likely due to the accuracy of detecting the participant’s condition and the technical innovations. Indeed, innovations in hardware and software allowed researchers to move research out of the laboratory and into real life thanks to sufficient data noise reduction and solving problems with interpersonal variability of research participants.
The study evaluates the muscle loading of timber truck drivers passing on roads of various grades when trucking timber. We investigated the effects of passing on different road grades on muscular and psychological loading. We observed truck drivers’ muscular and psychological loading on forest and major and minor state roads outside of forests.

2. Materials and Methods

Data were collected by measuring the workload of seven truck drivers during their work shifts. Work shifts were carried out between 5 a.m. and 2 p.m., in clear, partly cloudy or cloudy weather, with occasional rain or snow, but without intense wind. Road traffic was smooth and work shifts did not take place during heavy traffic. All observed drivers worked in similar working conditions (e.g., had the exact starting and destination location, drove the vehicle on the same routes, and worked in the same weather). Since this was a field study, we could not ensure that the environmental conditions drivers were identical for all drivers (e.g., the ambient air pressure fluctuated, as did the illumination inside the cabs). We expressed the muscular workload of truck drivers as the changes in action potentials of their extensor carpi radialis brevis muscles (electromyography (EMG) for the right muscle) in μV. We expressed the psychological workload through the changes in the truck drivers’ heart rate (HR) in beats per minute (BPM). We observed the muscle action potentials through electromyography and heart rate through photoplethysmography method. Photoplethysmography is a method that uses computer processing of light signal reflection from the skin and subcutaneous tissue. In our case, the placement of the sensors was on the upper limbs of the truck drivers.
The experimental measurement of stress load took place between October 2019 and February 2021 on a group of timber truck drivers. The experiment included drivers aged between 46 and 54 years, with 5–25 years of experience with driving trucks. The health status of the drivers was at least good, i.e., they had a body mass index (BMI) between 24.6 and 29.7, no known physical or mental conditions that would affect their performance and were without permanent medication and dispensary by a doctor. Body mass index reflects well the magnitude of the risk of metabolic syndrome, diabetes 2nd type, vascular diseases (heart attack, and stroke). The selection of drivers for the experiment was based on a self- questionnaire reported survey of a group of employed drivers without the observer verifying the drivers’ answers. The latter criterion was applied to avoid a possible pharmacological influence on the drivers’ physiological functions. Without it, the measured values could be distorted by the prescribed drug or drugs.
Tatra 815, Tatra Phoenix 1st and 2nd generation trucks adapted for transporting timber were used in the study. The vehicles observed were set up as timber trucks without trailers, timber trucks with trailers, and timber trucks with semitrailers. The vehicles’ dimensions were within the standard limits for each vehicle type, i.e., 2.55 m in width, 12 m in length for trucks, 18.75 m for timber trucks with trailers, and 16.5 m for timber trucks with semitrailers. The trucks had a mass of 14,490 kg; trailers weighed 7290 kg. The maximum total weight of a truck and trailer combination permitted by Czech legislation is 48 tons (Figure 1). All trucks had ergonomic seats adjustable to the height and length needs of the truck drivers, with a high backrest, integrated headrest, and air suspension. All vehicles had manual transmissions and engine power ranging from 325 kW, in the Tatra 815, to 390 kW in the Tatra Phoenix II. All Tatra vehicles had all-wheel drive, so 6 × 6. To provide a reference point for physiological data, we used a passenger car (Toyota ProAce, model year 2019) occupied by the particular truck driver and a researcher conducting the measurements. The passenger car had ergonomic seats adjustable to the height and length needs of the drivers, a high backrest, and an integrated headrest. The passenger car was 2.1 m in width, 5.39 m in length, and had a mass of 2100 kg.
We carried out measurements on several different types of roads—on forest paths and roads of lower classes and on roads of higher classes. Forest roads in our case were only forest roads 1L and or 2L according to ČSN 73 6108 (Table 1). Among the higher classes, we included Class I roads and highway-type roads (high-speed roads and highways) intended mainly for long-distance and interstate transport. A substantial part of the journeys on higher class roads were made on Class I roads. Roads of lower classes are II. roads classes that are intended for transport between districts and roads III. classes that are intended to connect municipalities to each other or connect them to other land roads.
We measured the loading of the truck drivers using the Biofeedbackx-pert 2000 device (BFB; Schuhfried, AT, 2004). The device is a multimedia system composed of modules that allow monitoring and recording of selected physiological functions. For this study, we used two modules—the EMG module, designed to record changes in muscle action potentials, and the MULTI module, designed to record heart rate, skin temperature, the galvanic response of the skin, the blood volume pulse, and motility of the sensor. Biofeedbackx-pert 2000 enables non-invasive sensing of biosignals from the body’s surface to continuously monitor drivers’ workload. The limiting factors are the device’s power supply and data storage capacity. The system and its modules are intended for diagnosing physiological functions and therapeutic use [44]. Electrodes for EMG measurements were positioned on the body according to Škvor [45]. Sampling frequency of the EMG module was set to 50 Hz. The MULTI sensor was attached to the last link of the middle finger of the right hand. Its data wire was fixed to the next link of the finger and the wrist. The key point in this phase is the exact localization of the measurement points and a firm and stable attachment of the measuring sensors.
The workload of each driver was measured and recorded in all types of vehicles. The reference data were obtained while driving a passenger car. Throughout the experiment, each driver drove the same pre-determined real-world route with a timber truck, a truck and trailer or semitrailer combination, and the passenger car to ensure comparability of the workloads. The routes included higher and lower-class roads and forest roads found in the Czech Republic. Forest roads were 1L or 2L (road parameters can be seen in Table 1). Roads used outside the forests were represented by roads III. class (intended for connecting municipalities or connecting them to other roads), sometimes even lower-quality roads II. classes (designated as a link between districts) passing through the landscape between plots of land, usually along their historically determined boundaries. Aside from driving, the drivers performed work operations standard for their profession, including loading and unloading the timber trucks (or truck and trailer combinations.
Measurements of biosignals and their changes during work shifts were carried out in regular cycles with simultaneous recording of GPS positional data (individual measurements were supplemented with a recording photo). During work shifts, all potential risk situations were monitored, marked in the database, recorded on the route (GPS coordinates and photographic evidence), and confronted with measured biosignals. Data flows were synced based on time stamps—device time on the BFB device, GPS locator, and camera was synchronized. The measurements took place in several seasons (end of summer, autumn, and winter) for a total of 21 days for approximately 6 h a day. All drivers worked non-standard day shifts, i.e., between 5 a.m. and 2 p.m. Control measurements on a passenger car took place daily in conditions similar to truck measurements.

Data Processing and Analyses

RRField measurements provided a total of 7,703,678 cases. Of this data set, 3,851,839 cases represented muscle load, while 1,020,738 cases represented muscle load when driving on forest roads, 2,446,303 when driving on lower class roads, and 384,798 when driving on higher class roads. The same amount of data was then obtained for the values of heart rate changes.
Data collected by experimental field measurements were aggregated in the BFB device software suite. First-stage data processing consisted of visual checks of the graphic outputs, observing whether the recordings were continuous and without failures. Subsequently, biosignal data were classified, assigned to individual drivers, types of roads, and types of vehicles used. Before evaluation, the biosignal data was visually inspected for the normality of its distribution. The measured data were sorted and the normality of the data distribution was visually checked using a histogram. The measured data were subsequently processed in the software STATISTICA CZ version 12 from TIBCO Software, Inc. Descriptive statistics were calculated using basic statistical operations. The data thus checked were subjected to analysis of variance (ANOVA). Based on the results of the analysis of variance, we determined specific differences using Post hoc tests. The measured values of muscle load of drivers on different types of monitored roads for different types of vehicles used for wood transport were compared for the same routes and climate.

3. Results

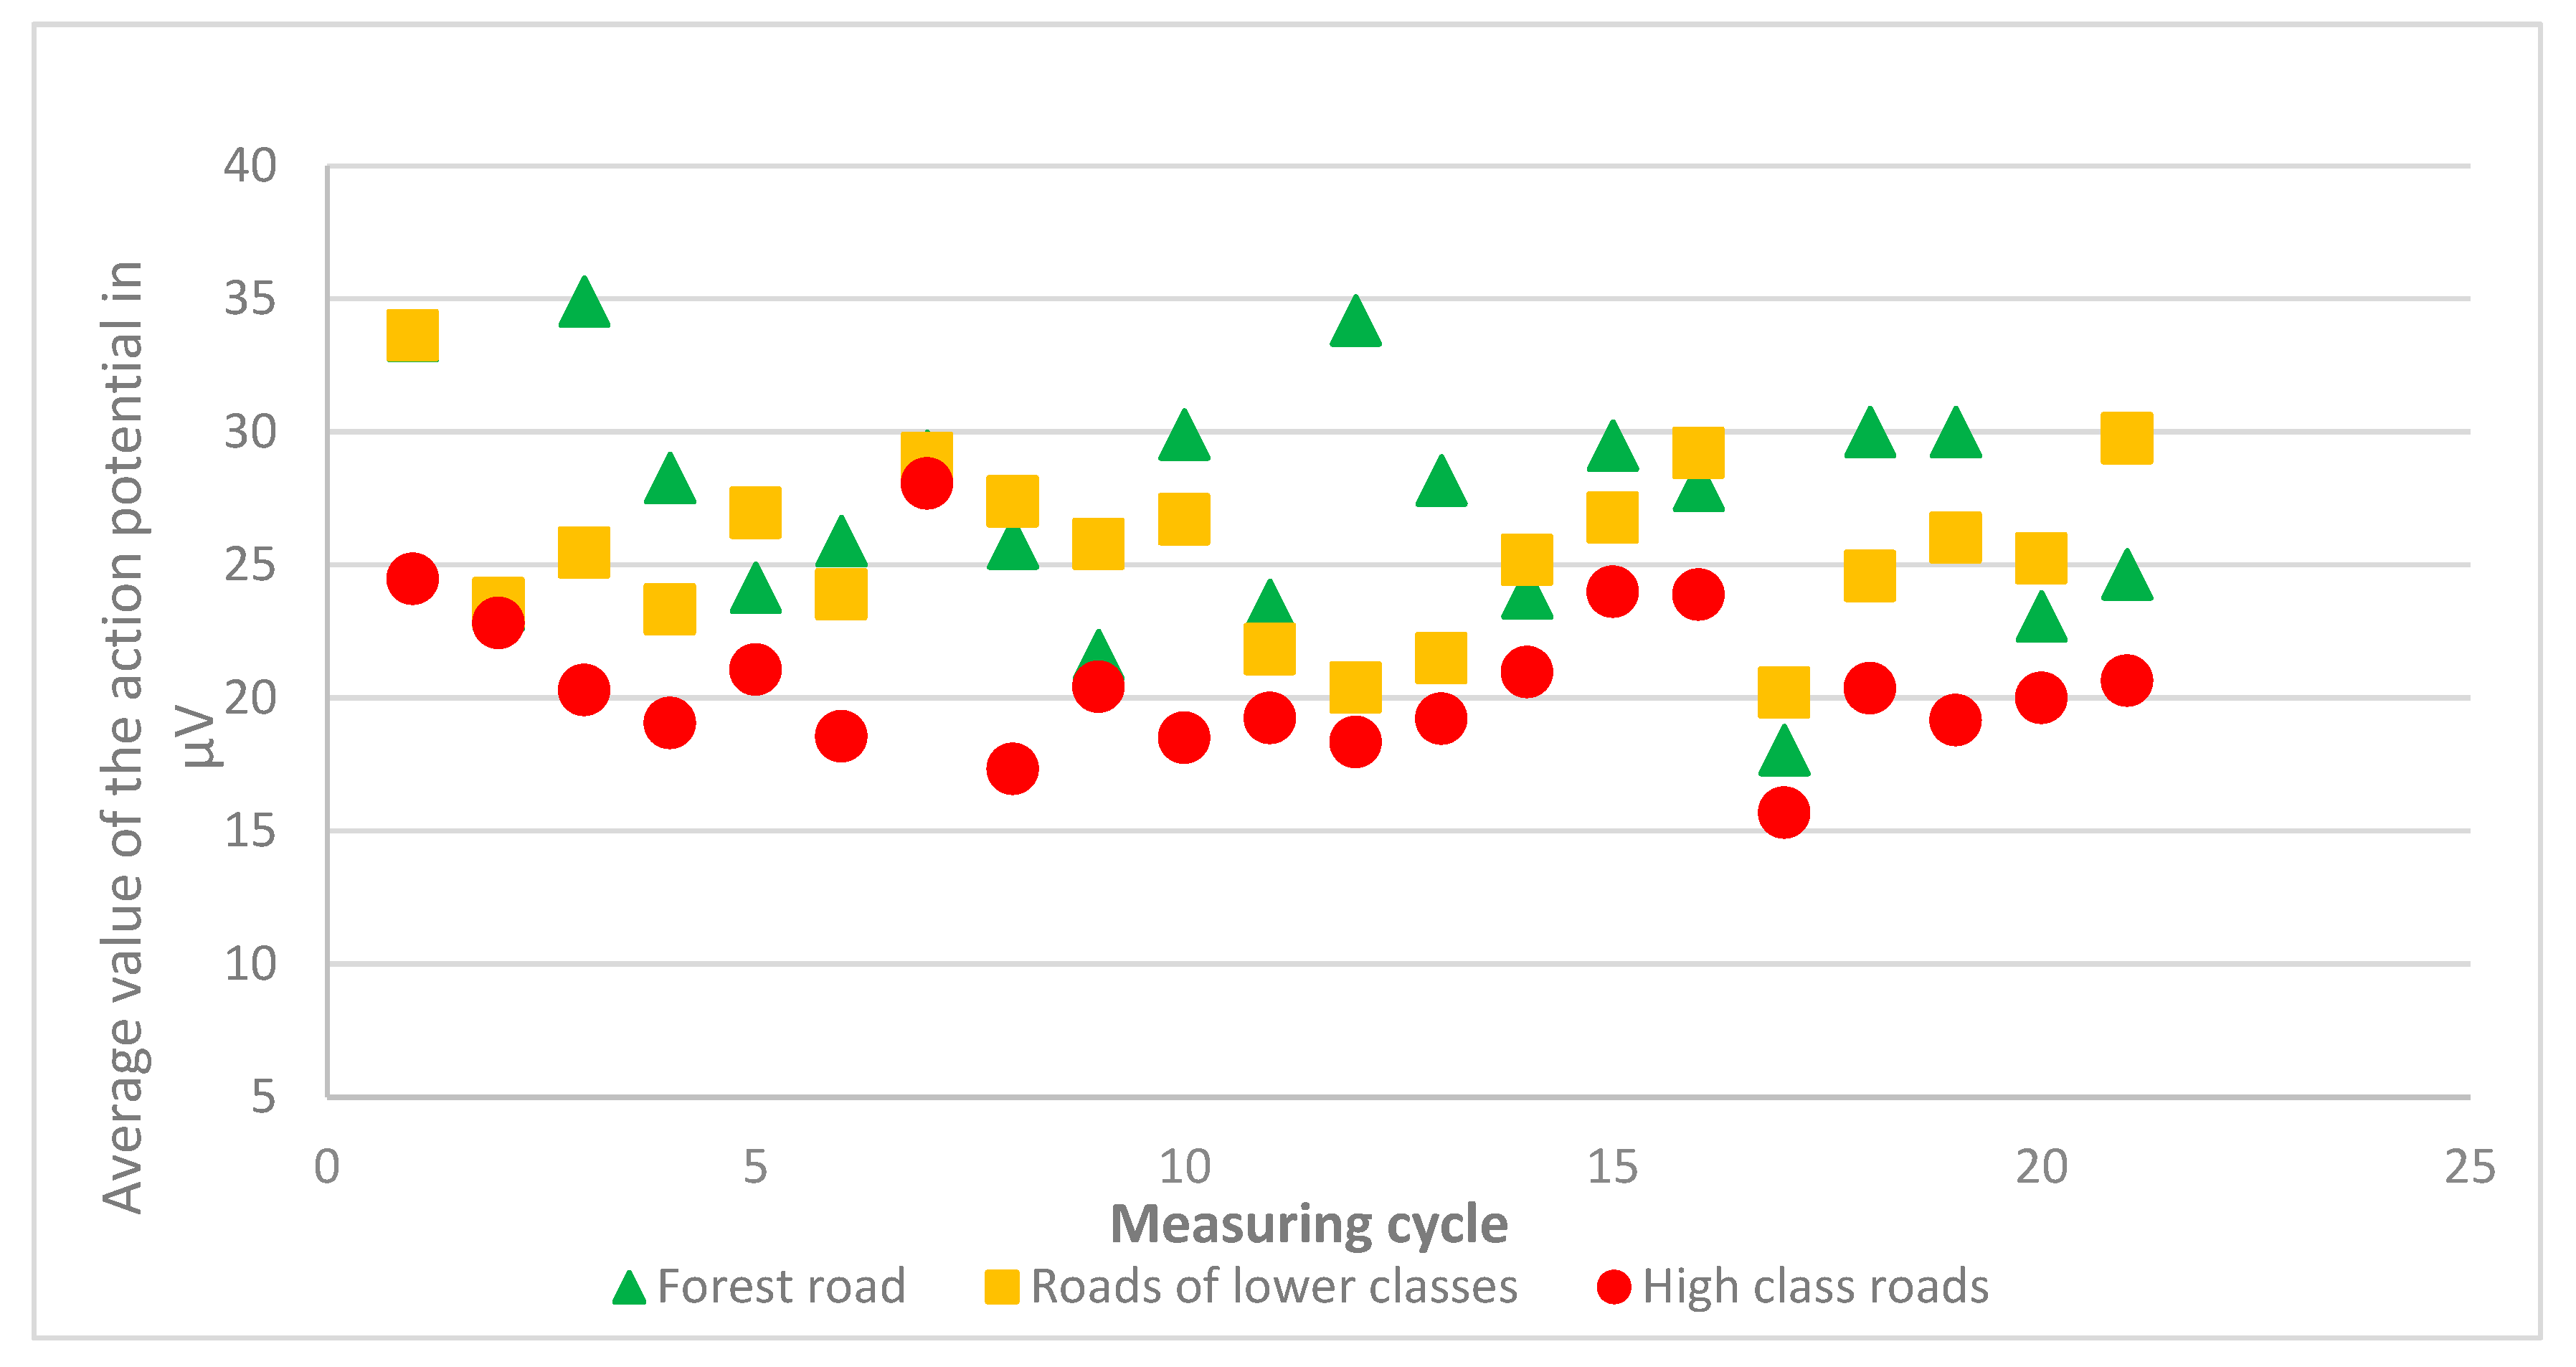
The muscle load values measured during driving the vehicles along the work routes showed a marked difference in difficulty of driving (muscle loading and heart rates) concerning the type of used road traveled. The higher muscular effort associated with driving a specific vehicle on public roads of lower classes was evident compared to driving on forest roads and on roads of higher classes (Table 2). We found that driving a loaded timber truck and trailer or semitrailer combination produced 39.4% more muscular loading on forest roads than on public roads of higher classes. Driving on lower-class roads produced 41.3% more muscular loading of the drivers’ muscles than driving on higher-class roads. Interestingly, driving on forest roads proved to load the muscles less than driving on lower-class roads outside of the forest. Considering the timber trucks, driving on forest roads loaded the muscles of the drivers 37.5% more than driving on higher-class roads while driving on lower-class roads outside the forests loaded the muscles 21.9% more than on roads of a higher grade. For a timber truck, load on forest roads while driving was 12.8% higher than on roads of lower classes. Driving the reference vehicle produced 59.2% more muscle loading on forest roads than on roads of higher classes, whereas on lower-class roads, it produced 30.7% more loading. When comparing the load on forest roads to the lower-class roads outside the forest, driving on forest roads produced 21.9% more muscle loading than driving on lower-class roads (Table 3). The muscle load was the lowest for all types of vehicles when driving the vehicle on higher class roads. Therefore, the load in Table 2 and Table 3 is taken as a default load of 1.0. Figure 2 and Figure 3 provide a graphical comparison of the differences in the muscle loading of drivers on selected types of roads using respective vehicles. Significantly higher values of muscle strain were measured when driving vehicles on lower-grade roads, especially when driving a timber truck and trailer or semitrailer combination (Table 4).
The comparison of the workload on the monitored types of roads showed in several daily measurement cycles (as shown in Figure 2 and Figure 3) some variability could have been caused by the current weather, when the workload of the drivers increased during rain or snow.
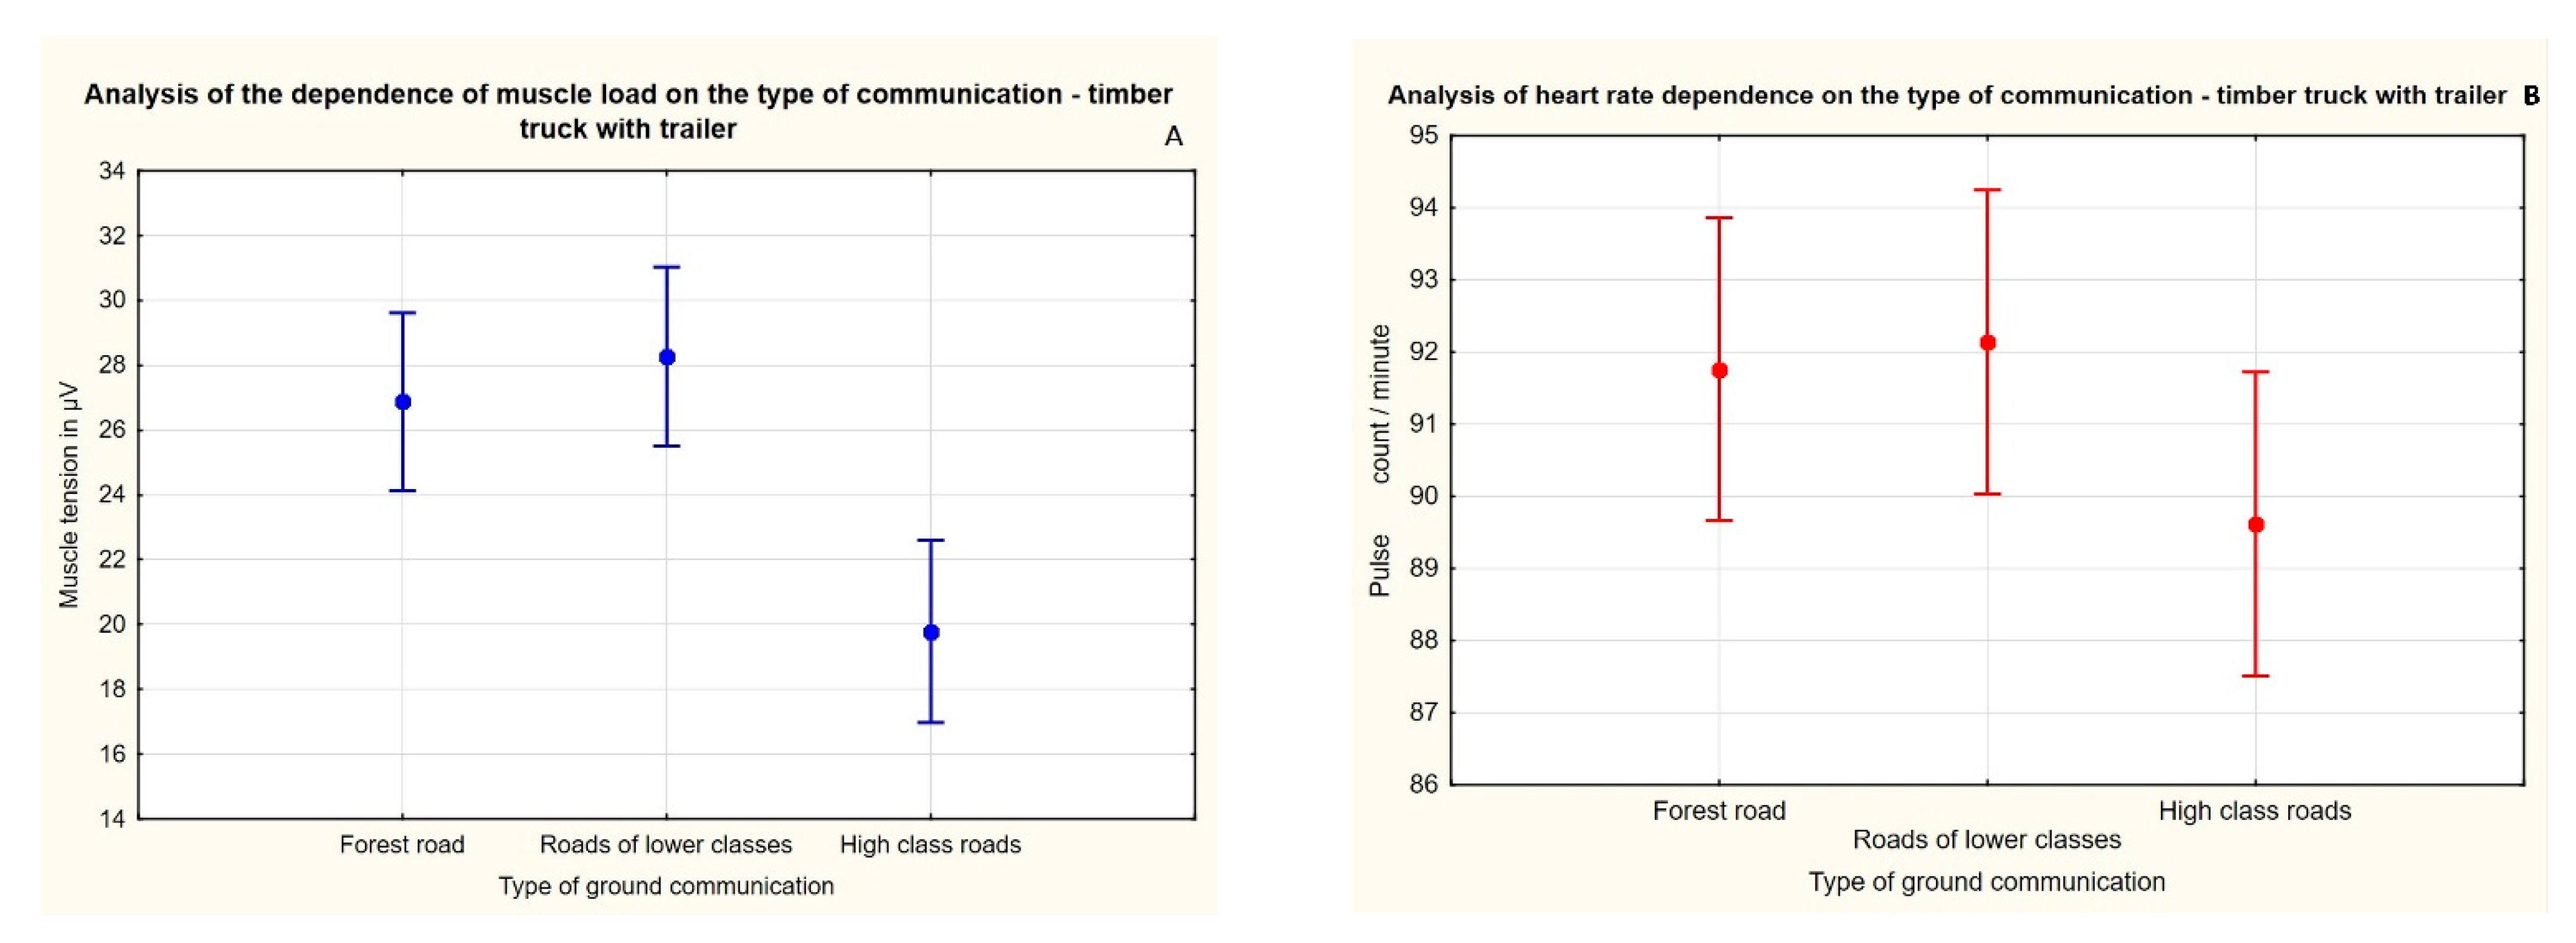
Analysis of variance (ANOVA) of muscle loading values categorized by the type of road when driving the timber truck with trailer or semitrailer (Figure 4A) reveals noticeable differences in the muscle load required for operation on the monitored types of roads. On forest roads, its values ranged between 24.0 μV and 29.8 μV, on lower-class roads between 24.7 μV and 31.1 μV, and on higher-class roads between 16.9 μV and 22.8 μV. Heart rate also varied depending on the type of road when driving a timber truck and trailer or semitrailer combination. Figure 4B shows noticeable differences in muscle loading—on forest roads, it ranged between 89.6 and 93.9 BPM, on lower-class roads between 90.0 and 94.3 BPM, and on higher-class roads between 87.5 and 91.8 BPM. The analysis showed that road type significantly influenced the drivers’ muscle loading while driving a timber truck and trailer (Table 4, Table 5 and Table 6).
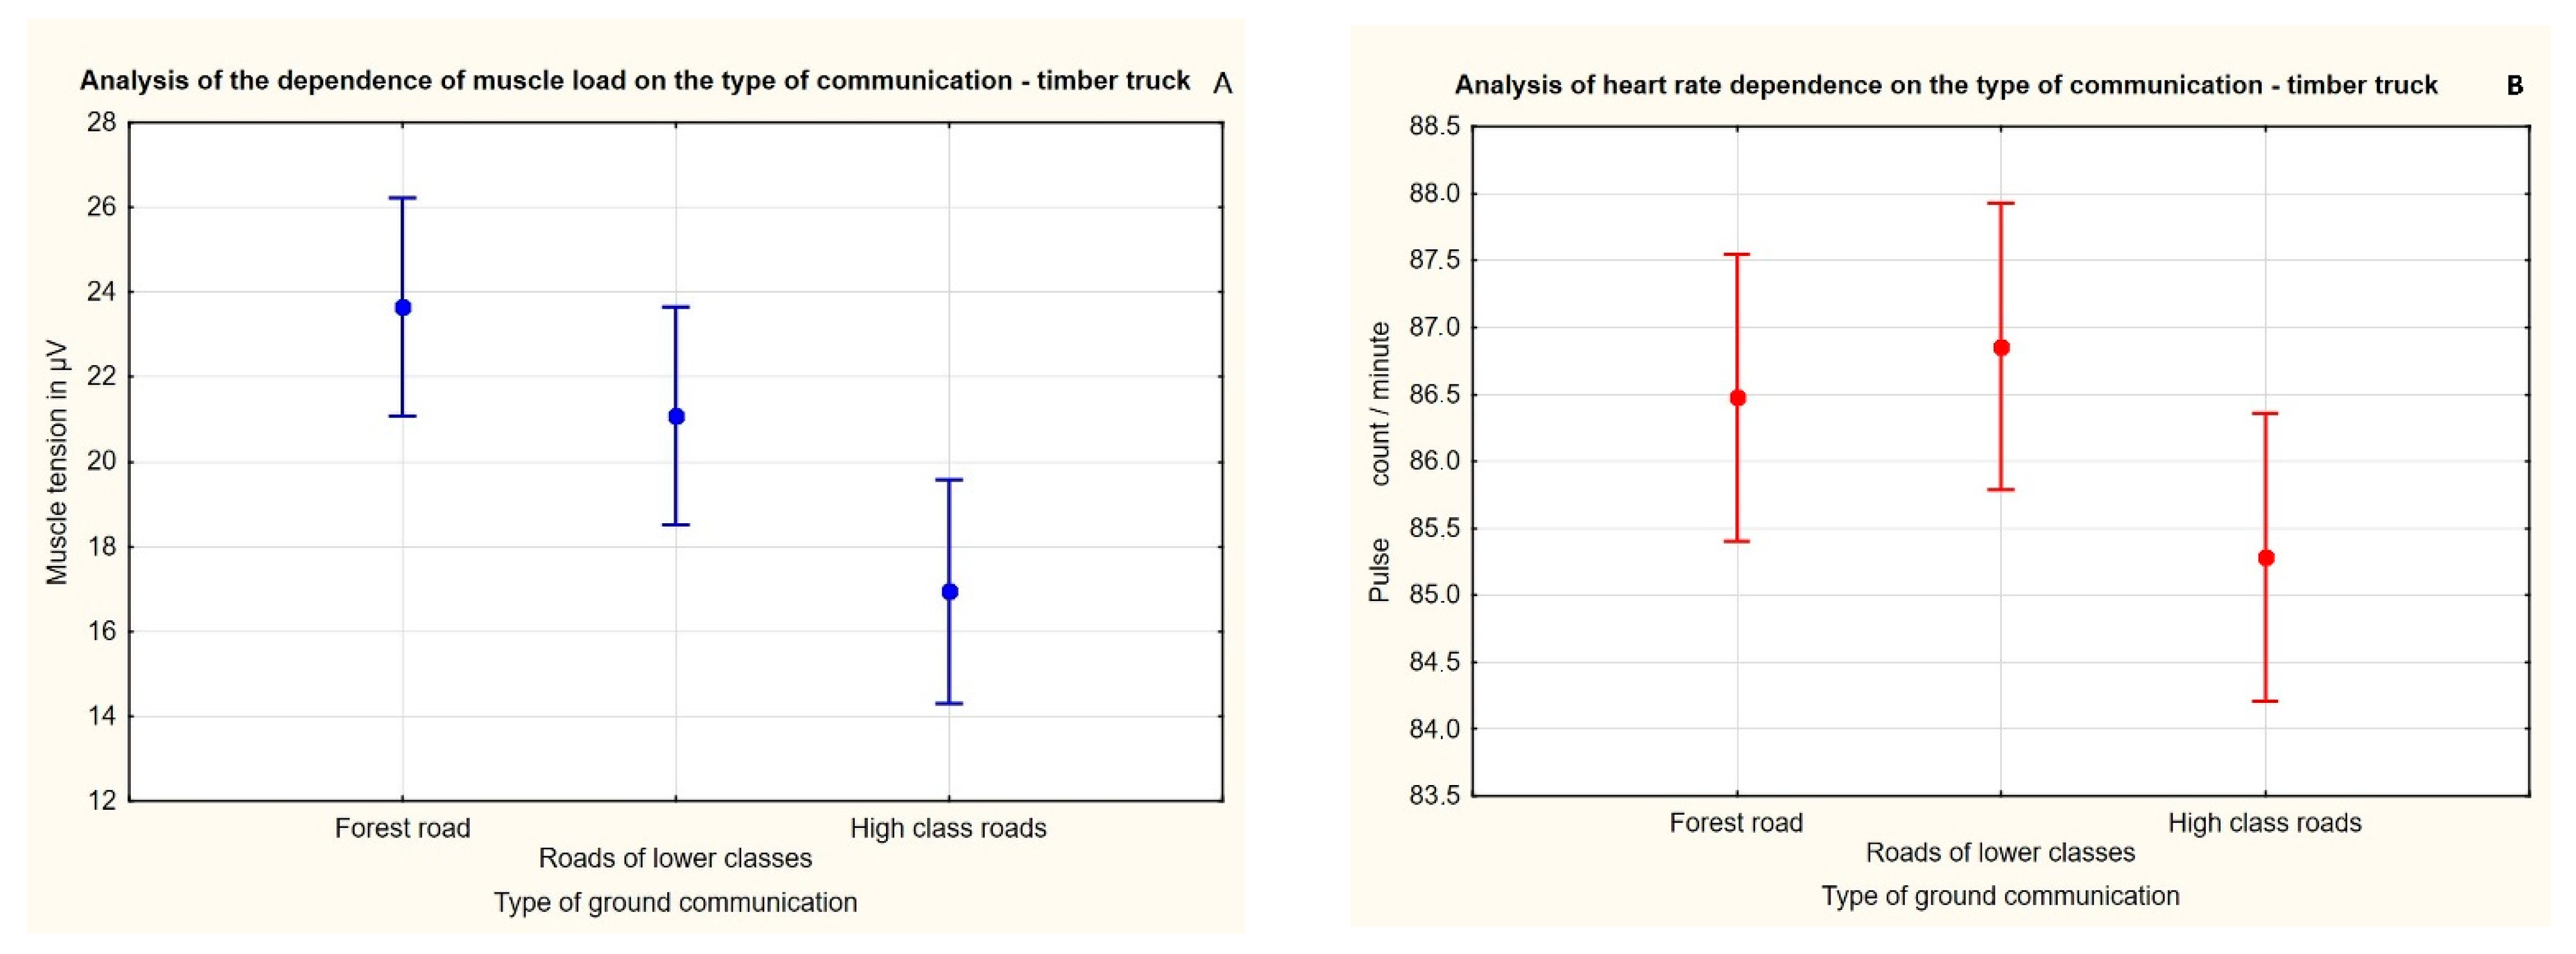
The ANOVA of the muscle loading categorized by the road type when driving a timber truck without a trailer were similar (Figure 5A). Muscle strain required to drive on forest roads ranged between 21.0 μV and 26.1 μV. On lower-class roads, it was between 18.3 μV and 23.8 μV, whereas on higher-class roads, it was between 14.2 μV and 19.7 μV. Heart rate was highest on forest roads, between 85.4 and 87.5 pulses, on lower class roads between 85.7 and 88.0 pulses, on higher class roads between 84.2 and 86.4 pulses (Figure 5B). The analysis showed that the road type’s influence on muscle load and heart rate was statistically significant (Table 4, Table 7 and Table 8).
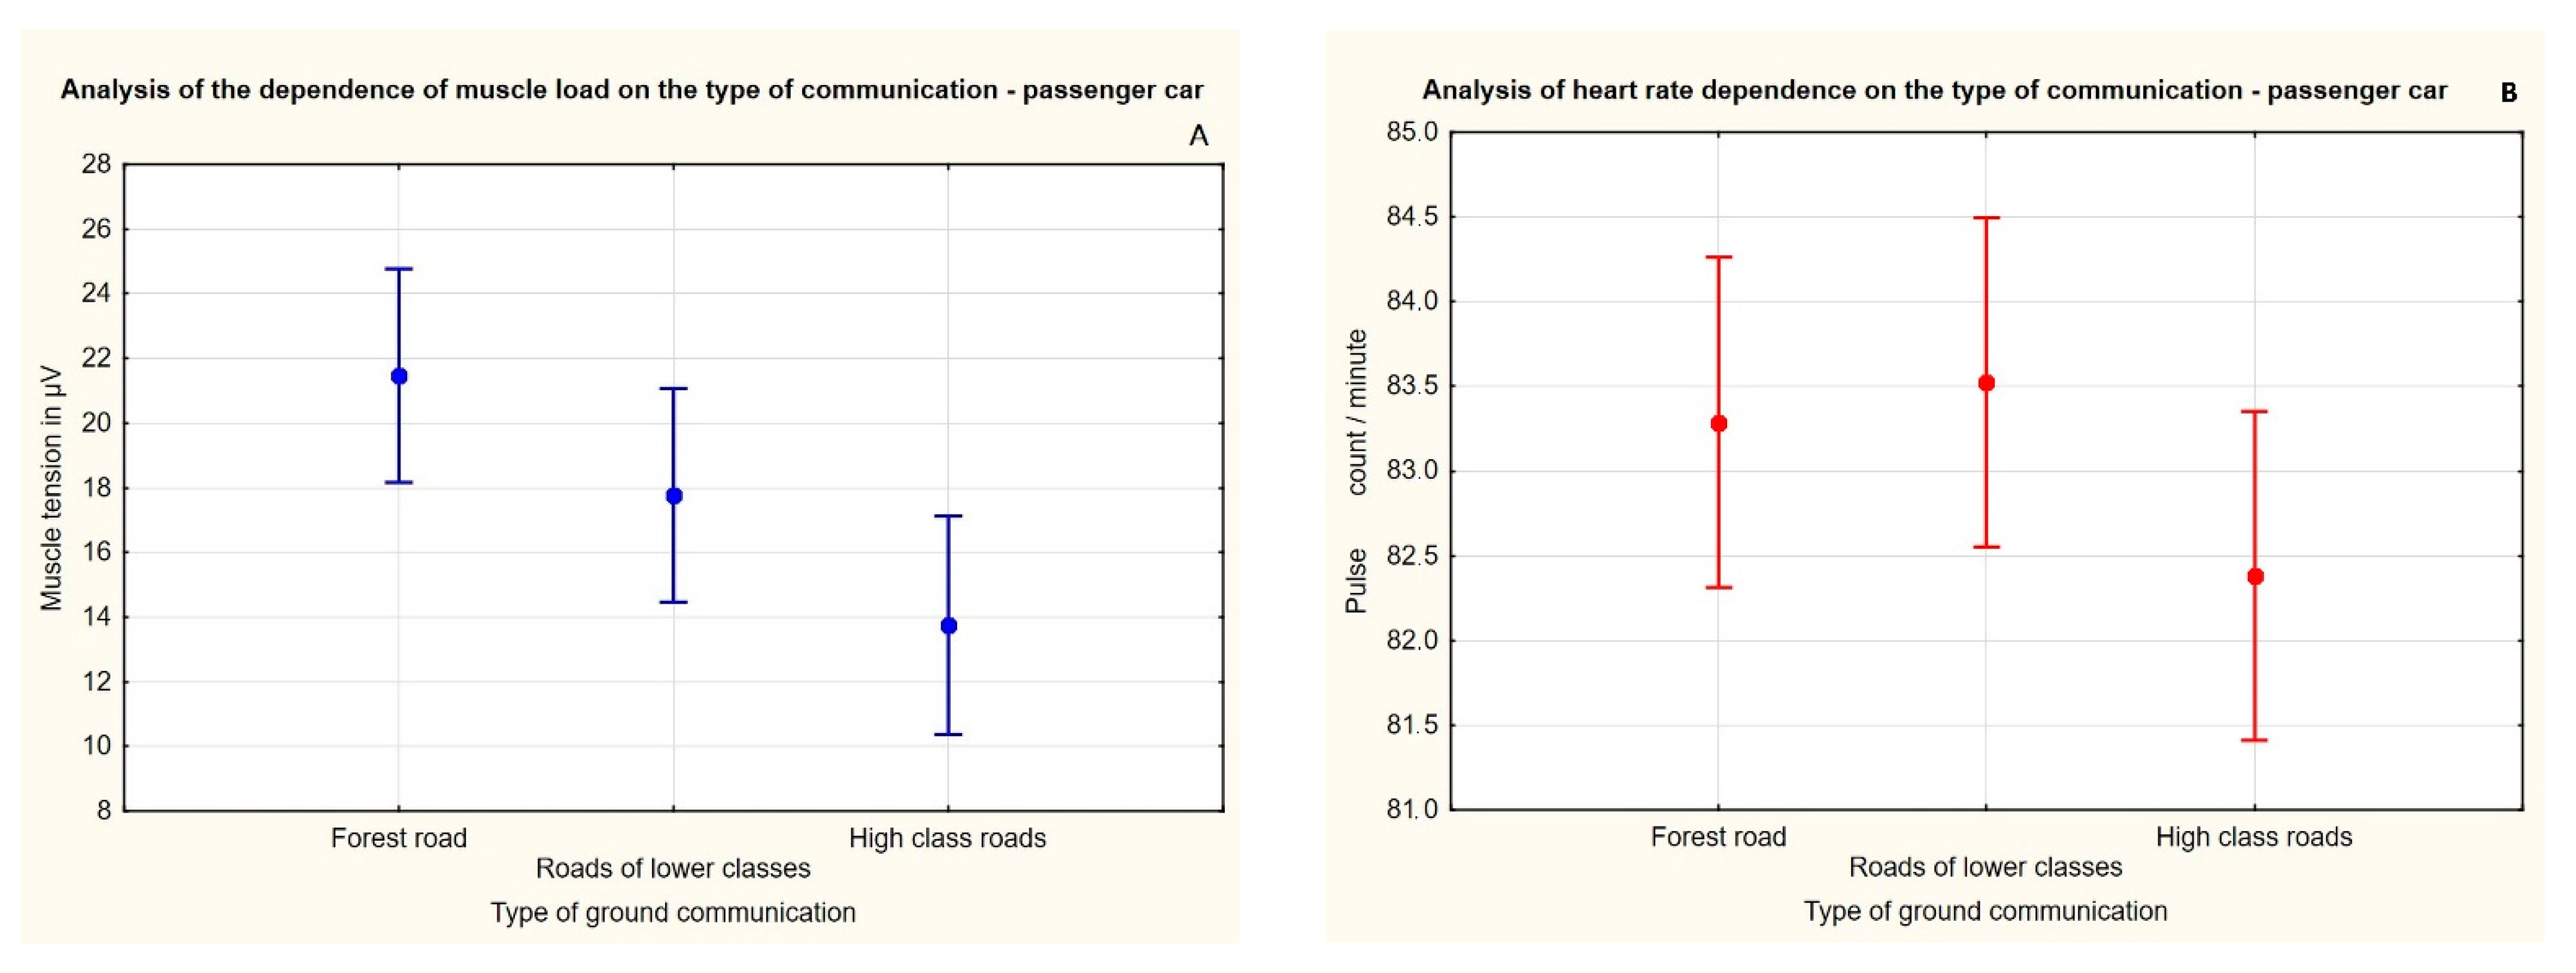
Muscle strain and heart rate were the smallest while driving the reference vehicle. The ANOVA (Figure 6A) revealed that on forest roads, muscle activation reached values between 18.0 μV and 25.0 μV, on lower-class roads between 14.2 μV and 21.2 μV, and on higher-class roads between 10.1 μV and 17.1 μV. Heart rate varied too, based on the road type (Figure 6B)—on forest roads, it ranged between 82.3 and 84.3 BPM, on lower-class roads between 82.5 and 84.5 BPM, and on higher-class roads between 81.4 and 83.4 pulses. The analysis showed that the road type significantly affected the drivers’ muscle activation and heart rates (Table 4, Table 9 and Table 10).
Figure 4, Figure 5 and Figure 6 show the measured values of biosignals, when the lowest measured value is shown as the lowest point, the highest point the maximum measured value and the center point determines the median.

4. Discussion

Our study is a continuation of the studies of load assessment using the measurement of bioindicators of forest machine operators [44,45,46,47,48]. This study covers the workload of workers during the last stage of the forest harvesting process—timber trucking. Similar studies exist for long-distance truck transport of goods (lengthy and time-consuming journeys, mostly on highways) [18] or the transport of goods by smaller vans (short routes, mostly in urban areas) [49]. However, a study monitoring the workload of timber truck drivers who drove their vehicles on forest or public roads is yet to be published.
Truck driving is a highly variable occupation. Each work shift presents a unique set of conditions in which the driver performs their tasks, such as routes, weather, traffic conditions, and delivery locations [50]. One of the variables that can affect the drivers’ physiological state, well-being, and stress levels is the type of road they drive on and its state. Considering the muscle strain associated with driving timber trucks with trailer and timber trucks with semitrailer on different road types, we found that drivers activated their muscles more when driving on lower grade roads than on other roads. Driving on narrow, often winding roads required significantly more frequent braking and downshifts followed by acceleration and upshifts, which increases muscle strain.
Similarly, the drivers activated the muscles more on lower-grade roads compared to higher-grade public roads. We attributed this to a higher degree of arm movements when driving on lower-grade roads than when driving on high-grade public roads, a tighter grip of the steering wheel, or both, this is confirmed by the data we found. The order of the types of roads that require the greatest activation of muscles from forest roads through roads of a lower grade to public roads of a higher grade, in the case of using a combination of the timber truck and the trailer or the semitrailer, is significantly higher on roads of lower grades, followed by forest roads and the lowest effort driving on higher class roads. Passing through the villages, whose roads copy the original unpaved roads originally built for horse-drawn carriages and pedestrians, was (as the measurements showed) significantly more difficult with the longer vehicle. During the entire driving time, the drivers had to monitor the position of the entire vehicle on the road, including the outline of the rear of the last vehicle. They had to adjust their speed and drive through bends while anticipating the presence of an oncoming vehicle of similar dimensions. In places surrounded by houses in the development, drivers had to slow down significantly to compensate possible presence of a vehicle traveling in the opposite direction. A similar conclusion was reached by Abdelkareem [51] in his study evaluating the effect of vibrations on driver comfort.
Studies published so far have mainly focused on the workload of truck drivers [18] or van drivers [49]. Hege [18] investigated how work organization, stress and irregular sleep significantly affect the quality of working life. He clarified that the magnitude of the stress load is influenced by the speed of the work pace, the support of the superior/colleague and the length of the sleep period. In his study, Romeo [49] identified situations that are stressful for van drivers from the point of view of the risk of health damage or damage to the shipments they transport. In our study, drivers were evaluated by completing work tasks in normal hours that are used for this area and can be completed at a natural work pace. The stress load was increased by driving on roads of lower classes, especially when passing through villages and avoiding oncoming vehicles, especially larger ones (trucks, agricultural machinery). Drivers transporting firewood followed prescribed and binding procedures in the area of the size of the assembled load with regard to its dimensions and weight. Before leaving the loading point, they properly and securely secured each load against movement on the loading platform during the entire transport. Muscle loading triggers physical and emotional reactions in the organism on a physiological level, which increases cardiovascular performance, blood pressure, heart rate and blood flow to the skeletal muscles. At the same time, there is a decrease blood supply to the kidneys and visceral organs [3,4].
Experimental measurements in operating conditions revealed that muscle tension in individual muscle groups responded to specific stimuli and its range changed both in connection with the load on the musculoskeletal system and as a result of the person’s psychological state [52]. The connection between muscle activation and mental state was verified by evaluating the drivers’ heart rate changes. The drivers’ muscle loading and heart rate increased significantly in more demanding conditions. In his study, Lee [37] assessed driver fatigue by monitoring eye movement and other biosignal changes via wireless transmission using the Android platform in a mobile phone by combining video recording and biosignal value collection. The system indicated the driver’s current ability to control the vehicle and acoustically alerted the driver to the real risk of fatigue. In our study, we used a MiVue camera to record GPS coordinates, which at the same time monitored the way of driving and the movement of the vehicle along the road, which it evaluated and, in the event of inadequate driving or exceeding the safe driving time, drew attention to the need to rest. Lee [53] further investigated the effect of driving and its localization within the time of day and drivers’ attention. He found that if the work cycle is divided into a morning (from early morning to early afternoon) and an afternoon (from early afternoon to night) work shift, drivers in the afternoon shifts reported up to three times more intense feeling of sleepiness. In our study, all shifts were performed from early morning (5:00 a.m.) to early afternoon (2:00 p.m.). The reason for this setting, as stated by the drivers themselves, is precisely the adaptation of the work shift to the circadian rhythm of the organism and the prevention of fatigue, ensuring work safety and achieving the expected performance without undue stress.
Analysis of data obtained from the measurement of physiological (bio)signals detecting changes in drivers’ state can be can be used in assessment of workload [29,31]. Heart rate parameters are sensitive to various emotions, but the mental load is also conditioned by the driver’s personality [34]. Not only theoretically, but above all in practice, the resting level of adrenergic hormones or the level of the muscle action potential in two individuals in the same situation differs. This is also valid for stressful situations. The differences are influenced by the body’s resistance to a stimulus of a certain intensity and the driver’s current state of health. The resistance of the organism is determined by the organism’s ability to adapt to different types of load and the type of stress that affects the driver (eustress/distress). The absolute values of monitored biosignals are therefore not as important as their changes from a state without load-to-load situations [54,55].

5. Conclusions

In the conducted study, we investigated the differences in the workload of professional drivers on selected types of roads. We found that road type affects the muscle activation and heart rate of the drivers for all vehicles used in this study. The identified differences in the muscle load of drivers can be used in the revision of existing standards, rules and processes in the field of occupational safety, shift planning, the plan for changing operators on different types of vehicles or alternating the work activity of driving vehicles with other activities, even with regard to unilateral loading of the musculoskeletal system. A possible extension of load quantification research in this area could include the detection of loads in different types of transport vehicles driving on highways, possibly in urbanized areas. This kind of workload can only be approximated at present. Further, research could focus more on the relationship between variables related to shift-work that may reduce situational awareness, cause sleep deprivation, or other factors that impair drivers’ mental performance.

Author Contributions

All listed authors meet the requirements of authorship in all required points. Conceptualization, P.Š. and M.J.; methodology, P.Š.; software, P.Š.; validation, M.J., P.N. and J.D.; formal analysis, P.N.; investigation, P.Š.; resources, J.D.; data curation, P.Š.; writing—original draft preparation, P.Š.; writing—review and editing, M.J.; visualization, P.Š.; supervision, M.J. and K.Z.; project administration, P.Š.; funding acquisition, K.Z. All authors have read and agreed to the published version of the manuscript.

Funding

The research was financed by the main author (Škvor. P.) from personal funds, the measuring devices are the property of the main author and the measuring device Biofeedbackx-pert 2000 was loaned to the authors by the authors’ home Department of forestry technology and construction, Faculty of Forestry and Wood, Czech University of Life Sciences Prague.

Data Availability Statement

All found data important for the published research result are published in this article.

Acknowledgments

We would like to thank the Training Forest Enterprise in Kostelec nad Černými lesy of Czech University of Life Sciences Prague, Training Forest Enterprise Křtiny of Mendel University in Brno and the company SPRÁVA MAJETKU HS Ltd., all of whom kindly allowed us to collect data from their drivers.

Conflicts of Interest

The authors declare no conflict of interest.

References

  1. CSZO. Statistical Yearbook of the Czech Republic. 2021. Available online: https://www.czso.cz/csu/czso/statisticka-rocenka-ceske-republiky-lxnk9quszp (accessed on 14 May 2022).
  2. Allman, M.; Dudaková, Z.; Jankovský, M.; Merganič, J. Operational Parameters of Logging Trucks Working in Mountainous Terrains of the Western Carpathians. Forests 2021, 12, 718. [Google Scholar] [CrossRef]
  3. Wasmund, W.L.; Westerholm, E.C.; Watenpaugh, D.E.; Wasmund, S.L.; Smith, M.L. Interactive effects of mental and physical stress on cardiovascular control. J. Appl. Physiol. 2002, 92, 1828–1834. [Google Scholar] [CrossRef] [PubMed]
  4. Zuzewicz, K.; Roman-Liu, D.; Konarska, M.; Bartuzi, P.; Matusiak, K.; Korczak, D.; Guzek, M. Heart rate variability (HRV) and muscular system activity (EMG) in cases of crash threat during simulated driving of a passenger car. Int. J. Occup. Med. Environ. Health 2013, 26, 710–723. [Google Scholar] [CrossRef]
  5. Cardoso, M.; McKinnton, C.; Viggiani, D.; Johnson, M.J.; Callaghan, J.P.; Albert, W.J. Biomechanical investigation of prolonged driving in an ergonomically designed truck seat prototype. Int. J. Occup. Saf. Ergon. 2017, 61, 367–380. [Google Scholar] [CrossRef]
  6. Cardoso, M.; Fulton, F.; Callghan, J.P.; Johnson, M.; Albert, W.J. A pre–post evaluation of fatigue, stress and vigilance amongst commercially licensed truck drivers performing a prolonged driving task. Int. J. Occup. Saf. Ergon. 2018, 61, 129–136. [Google Scholar] [CrossRef]
  7. Fröhlich, P.; Sackl, A.; Trösterer, S.; Meschtscheriakov, A.; Diamond, L.; Tscheligi, M. Acceptance Factors for Future Workplaces in Highly Automated Trucks. In Proceedings of the 10th International Conference on Automotive User Interfaces and Interactive Vehicular Applications—Automotive, Wien, Austra, 23–25 September 2018; 2018; p. 18. [Google Scholar] [CrossRef]
  8. Lemke, M.; Apostolopoulos, Y.; Hege, A.; Sonmez, Z.S.; Wideman, L. Understanding the role of sleep quality and sleep duration in commercial driving safety. Accid. Anal. Prev. 2016, 97, 79–86. [Google Scholar] [CrossRef]
  9. Hege, A.; Lemke, M.; Apostolopoulos, Y.; Perko, M.; Sonmez, S.; Strack, R. US long-haul truck driver work organization and the association with cardiometabolic disease risk. Arch. Environ. Res. Public Health 2017, 72, 303–310. [Google Scholar] [CrossRef]
  10. Alterman, T.; Luckhaupt, S.; Dahlhamer, J.; Ward, B.; Calvert, G. Job Insecurity, Work-Family Imbalance, and Hostile Work Environment, Prevalence Data from the 2010 National Health Interview Survey. Am. J. Ind. Med. 2013, 56, 660–669. [Google Scholar] [CrossRef]
  11. Krieger, N. Workers are People Too: Societal Aspects of Occupational Health Disparities—An Ecosocial Perspective. Am. J. Ind. Med. 2010, 53, 104–115. [Google Scholar] [CrossRef]
  12. Landsbergis, P. Assessing the Contribution of Working Conditions to Socioeconomic Disparities in Health: A Commentary. Am. J. Ind. Med. 2010, 53, 95–103. [Google Scholar] [CrossRef]
  13. Marmot, M. The Health Gap: The Challenge of an Unequal World; Bloomsbury Press: London, UK, 2015; Volume 32, pp. 537–546. [Google Scholar] [CrossRef]
  14. Ahonen, E.; Fujishiro, K.; Cunningham, T.; Flynn, M. Work as an Inclusive Part of Population Health Inequities, Research and Prevention. Am. J. Public Health 2018, 108, 306–311. [Google Scholar] [CrossRef]
  15. Stansfeld, S.A.; Berglund, B.; Clark, C.; Lopez-Barrio, I.; Berry, B.F. Aircraft and road traffic noise and children’s cognition and health: A cross-national study. Lancet 2005, 365, 1942–1949. [Google Scholar] [CrossRef]
  16. Hong, X.C.; Wang, G.Y.; Liu, J.; Song, L.; Wu, E.T. Modeling the impact of soundscape drivers on perceived birdsongs in urban forests. J. Clean. Prod. 2021, 292, 125315. [Google Scholar] [CrossRef]
  17. Puttonen, S.; Harma, M.; Hubin, C. Shift work and cardiovascular disease—Pathways from circadian stress to morbidity. Scand. J. Work Environ. Health 2010, 36, 96–108. [Google Scholar] [CrossRef]
  18. Hege, A.; Lemke, M.K.; Apostolopoulos, Y.; Whitaker, B.; Sönmez, S. Work-Life Conflict among US Long-Haul Truck Drivers. Int. J. Environ. Res. Public Health 2019, 16, 984. [Google Scholar] [CrossRef]
  19. Brown, I. Fatigue, Safety and the Truck Driver—Mc Donald, N; Taylor & Francis: London, UK, 1986; Volume 18, pp. 178–179. [Google Scholar] [CrossRef]
  20. Haworth, N.L.; Heffernan, C.J.; Horne, E.J. Fatigue in Truck Accidents (Rep. No. 3); Victorian Road Freight Industry Council: Melbourne, Australia, 1989; p. 80. ISBN 0-7326-0002-2. [Google Scholar]
  21. Åkerstedt, T. Work Hours and Slippiness. Clin. Neurophysiol. 1995, 25, 367–375. [Google Scholar] [CrossRef]
  22. Davson, D.; Fletcher, A. A quantitative model of work related fatigue, Background and definition. Ergonomics 2001, 44, 144–163. [Google Scholar] [CrossRef]
  23. Bekiaris, E.; Nikolau, S. State of the Art on Driver Hypovigilance Monitoring and Warning Systems, AWAKE System for effective Assessment of Driver Vigilance and Warning According to Traffic Risk Estimation. 2001; IST-2000-28062. [Google Scholar]
  24. Bongers, P.M.; Kremer, A.M. Arepsychosocial factors, risk factors for symptoms and signs of the shoulder, elbow, or hand/wrist? J. Intern. Med. 2002, 41, 315–342. [Google Scholar] [CrossRef]
  25. Van Galen, G.P.; Mullel, M.L.; Meulenbroek, R.G.; Van Gemmert, A.W. Forearm EMG response activity during motor performance in individuals prone to increased stress reactivity. J. Intern. Med. 2002, 4 1, 406–419. [Google Scholar] [CrossRef]
  26. Spinelli, W.M.; Fernstrom, K.M.; Britt, H.; Pratt, R. Seeing the Patient Is the Joy: A Focus Group Analysis of Burnout in Outpatient Providers. Fam. Med. 2016, 48, 273–278. [Google Scholar] [PubMed]
  27. Chen, L.L.; Zhao, Y.; Ye, P.F.; Zhang, J.; Zou, J.Z. Detecting driving stress in physiological signals based on multimodal feature analysis and kernel classifiers. Expert Syst. Appl. Int. J. 2015, 85, 279–291. [Google Scholar] [CrossRef]
  28. Szewczyk, G.; Spinelli, R.; Magagnotti, N.; Tylek, P.; Sowa, J.M.; Rudy, P.; Gaj-Gielarowiec, D. The mental workload of harvester operators working in steep terrain conditions. Silva Fenn. 2020, 54, 1–18. [Google Scholar] [CrossRef]
  29. Zheng, R.; Yamabe, S.; Nakano, K.; Suda, Y. Biosignal analysis to assess mental stress in automatic driving of trucks: Palmar perspiration and masseter electromyography. Sensors 2015, 15, 5136–5150. [Google Scholar] [CrossRef] [PubMed]
  30. Barfield, W.; Dingus, T.A. Human Factors in Intelligent Transportation Systems; Lawrence Erlbaum Associates Psychology Press: New York, NY, USA, 1998. [Google Scholar] [CrossRef]
  31. Vicente, J.; Laguna, P.; Bartra, A.; Bailon, R. Drowsiness detection using heart rate variability. Med. Biol. Eng. Comput. 2016, 54, 927–937. [Google Scholar] [CrossRef] [PubMed]
  32. Hu, J.B.; Gao, X.J.; Wang, R.H.; Sun, S.Y. Research on Comfort and Safety Threshold of Pavement Roughness. Sage J. 2017, 2641, 149–155. [Google Scholar] [CrossRef]
  33. Sekkay, F.; Imbeau, D.; Dube, P.A.; Cinniah, Y.; de Marcelis-Warin, N.; Bearegard, N.; Trepanier, M. Assessment of physical work demand of short distance industrial gas delivery truck drivers. Appl. Ergon. 2021, 90, 103222. [Google Scholar] [CrossRef]
  34. Bernston, G.; Cacioppo, J.T.; Quigley, K.S. Autonomicdeter minism, The modes of autonomic control, the doctrine of autonomic space, and the laws of autonomic constraint. Psychol. Rev. 1991, 98, 459–487. Available online: https://psycnet.apa.org/record/1992-04570-001?doi=1 (accessed on 19 April 2022). [CrossRef]
  35. Szeto, G.P.Y.; Lam, P.G. Work-related musculoskeletal disorders in urban bus drivers of Hong Kong. J. Occup. Rehabil. 2007, 17, 181–198. [Google Scholar] [CrossRef] [PubMed]
  36. Jennifer, A.; Healey, R.; Picard, W. Detecting stress during real-world driving tasks using physiological sensors. IEEE Trans. Intell. Transp. Syst. 2005, 2, 156–166. [Google Scholar] [CrossRef]
  37. Lee, B.G.; Chung, W.Y. Driver alertness monitoring using fusion of facial features and bio-signals. IEEE Sens. J. 2012, 12, 2416–2422. [Google Scholar] [CrossRef]
  38. Gang, L.; Chung, W.Y. Detection of driver drowsiness using wavelet analysis of heart rate variability and a support vector machine classifier. Sensors 2013, 13, 16494–16511. [Google Scholar] [CrossRef]
  39. Correa, A.G.; Orosco, L.; Laciar, E. Automatic detection of drowsiness in eeg records based on multimodal analysis. Med. Eng. Phys. 2014, 36, 244–249. [Google Scholar] [CrossRef] [PubMed]
  40. Fu, R.; Wang, H.; Zhao, W. Dynamic driver fatigue detection using hidden markov model in real driving condition. Expert Syst. Appl. 2016, 63, 397–411. [Google Scholar] [CrossRef]
  41. Chen, L.L.; Zhao, Y.; Zhang, J.; Zou, J.Z. Automatic detection of alertness/drowsiness from physiological signals using wavelet-based nonlinear features and machine learning. Expert Syst. Appl. 2017, 42, 7344–7355. [Google Scholar] [CrossRef]
  42. Babic, D.; Dijanić, H.; Jakob, L.; Garcia-Garzon, E. Driver eye movements in relation to unfamiliar traffic signs: An eye tracking study. Appl. Ergon. 2020, 89, 103191. [Google Scholar] [CrossRef] [PubMed]
  43. Szewczyk, G.; Spinelli, R.; Magagnotti, N.; Mitka, B.; Tylek, P.; Kulak, D.; Adamski, K. Perception of the Harvester Operator’s Working Environment in Windthrow Stands. Forests 2021, 12, 168. [Google Scholar] [CrossRef]
  44. Škvor, P. Vliv Pracovního Prostředí na Operátora Harvestoru—Analýza Elektromyogramu Svalů Zápěstí a Předloktí [Influence of Working Environment on Harvester Operator—Analysis of Electromyogram of Wrist and Forearm Muscles]. Master´s Thesis, Czech University of Life Sciences, Prague, Czech Republic, 2018; p. 90. [Google Scholar]
  45. Škvor, P. Vyhodnocení Vybraných Biometrických Ukazatelů u Obsluhy Těžebně Dopravního Zařízení [Evaluation of Selected Biometric Indicators for the Operator of Mining and Transport Equipment]. Master´s Thesis, Czech University of Life Sciences, Prague, Czech Republic, 2020; p. 112. [Google Scholar]
  46. Macků, J. Biometrical analysis of operators in cut-to-lenght harvesters data collection and analysis methodology using the Biofeedback 2000 xpert device. In Proceedings of the 4th International Conference of Young Scientists, Prague, Czech Republic, 6–7 November 2011; pp. 194–202. [Google Scholar]
  47. Jankovský, M.; Hnilica, R.; Dvořák, J.; Dado, M.; Naton, P. Utilization of Biofeedback devices in determination of learning curves of harvester operations. In Proceedings of the 6th International Conference of Education, Research and Innovation, Seville, Spain, 18–20 November 2013; pp. 3703–3711. [Google Scholar]
  48. Jankovský, M.; Merganič, J.; Allman, M.; Ferenčik, M.; Messingerová, V. The cumulative effects of work-related factors increase the heart rate of cabin field machine operators. ScienceDirect 2018, 65, 173–178. [Google Scholar] [CrossRef]
  49. Romero, J.M.O.-J.; Reiman, A.; Delgado, J.; Vayrynen, S.; Pekkala, J.; Forsman, M. Delivery truck drivers’ work outside the cab, psychosocial discomforts and risks based on participatory video analyses. Eur. Transp. Res. Rev. 2018, 10, 27. [Google Scholar] [CrossRef]
  50. Douglas, M.; Schwartz, S. Knights of the road: Safety, ethics, and the professional truck driver. J. Bus. Ethics 2017, 142, 567–588. [Google Scholar] [CrossRef]
  51. Abdelkareem, M.A.; Makrahy, M.M.; Abd-El-Tawwab, A.M.; El-Razaz, A.; Ali, M.K.A.; Moheyeldein, M. An analytical study of the performance indices of articulated truck haulage rig during three different cases to improve the driver comfort. Proc. Instr. Mech. Eng. Part K-J. Multi-Body Dyn. 2018, 232, 84–102. [Google Scholar] [CrossRef]
  52. Dvořák, J.; Malkovský, Z.; Macků, J. Influence of human factor on the time of work stages of harvesters and craneequipped forwaders. J. For. Res. 2008, 54, 24–30. [Google Scholar]
  53. Lee, S.; Kim, H.; Byun, J.; Jang, T. Sleepiness while driving and shiftwork patterns among Korean bus drivers. Ann. Occup. Environ. Med. 2017, 29, 8. [Google Scholar] [CrossRef] [PubMed]
  54. Dobšák, R.; Sieglová, J.; Sačinová, H.; Homolka, P.; Dunklerová, L.; Sosíková, M.; Plachetka, Z. Klinická Fyziologie Tělesné Zátěže [Clinical Physiology of Exercise]; Masaryk University: Brno, Czech Republic, 2009; ISBN 978-80-210-4965-9. [Google Scholar]
  55. Máček, M.; Radvanský, J. Fyziologie a Klinické Aspekty Pohybové Aktivity [Physiology and Clinical Aspects of Movement Activity]; Galén: Prague, Czech Republic, 2011; ISBN 978-80-726-2695-3. [Google Scholar]
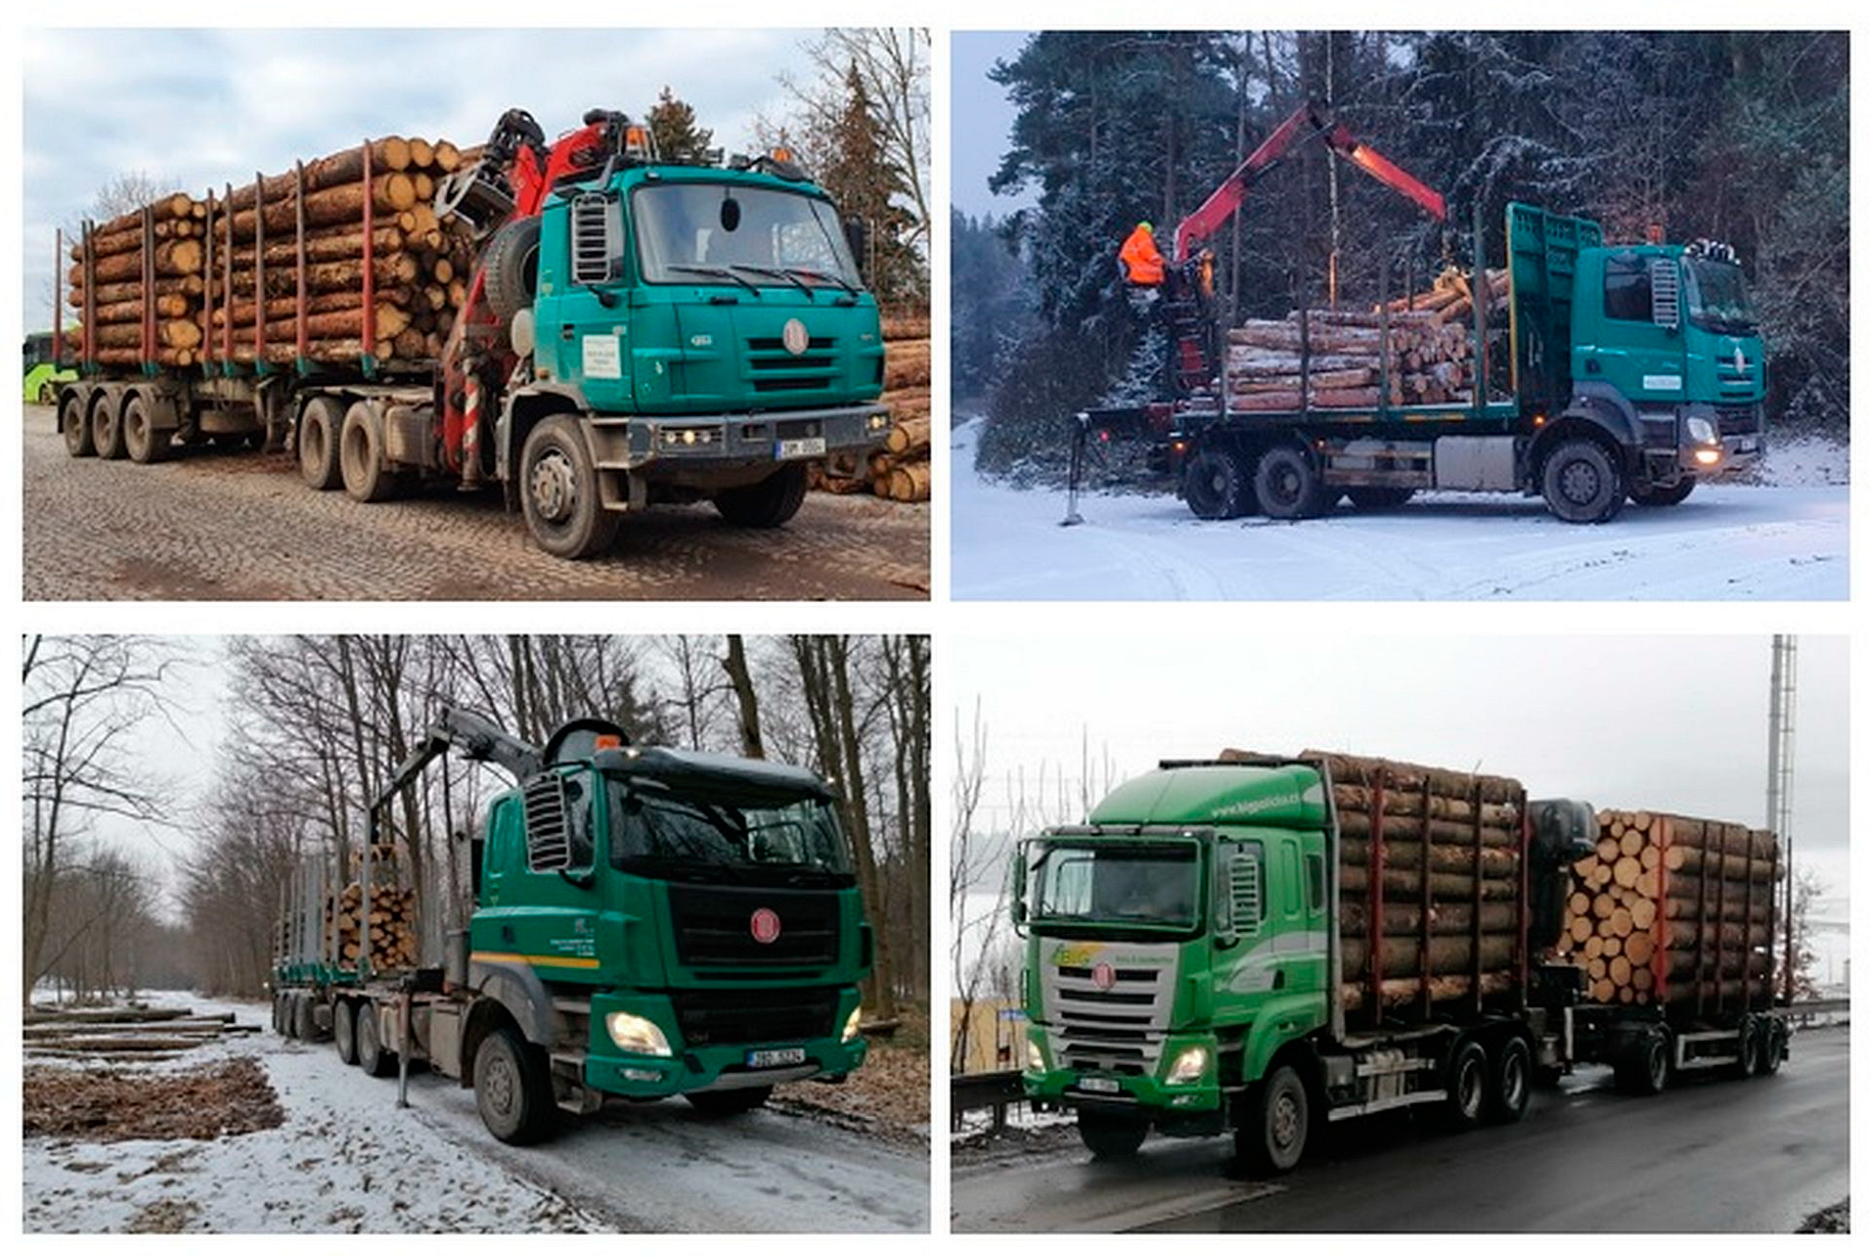
Figure 1. Vehicles used in the experiment. From left up Tatra 815, Tatra Phoenix I. and down Tatra Phoenix II. (Author).
Forests 13 01565 g001
Figure 2. Comparison of the course of changes in muscle load expressed in μV of electric potential on monitored types of roads when driving a timber truck with trailer (author).
Forests 13 01565 g002
Figure 3. Comparison of the course of changes in muscle load expressed in μV of electric potential on monitored types of roads when driving a timber truck (author).
Forests 13 01565 g003
Figure 4. Dispersion analysis of the dependence of muscle load values (A) and heart rate (B) on the type of communication used when driving the timber truck with trailer (author).
Forests 13 01565 g004
Figure 5. Dispersion analysis of the dependence of muscle load values (A) and heart rate (B) on the type of communication used when driving the timber truck (author).
Forests 13 01565 g005
Figure 6. Dispersion analysis of the dependence of muscle load values (A) and heart rate (B) on the type of communication used when driving the passenger car (author).
Forests 13 01565 g006
Table 1. Forest road category according to CSN 73 6108.
CategoryTechnical ParametersIntended Use
Min. Lane Width/mMin. Free Width/mMax. Slope in%DrainageSurfacePassability
1L3412longitudinal and transverseroadwayyearlongtimber transport
2L33.512longitudinal and transverseroadway/operational reinforcementseasonaltimber transport
Table 2. Summary relative comparison of muscle load when driving a work vehicle by vehicle type when driving different types of work trips in the work cycle (one work day, shift).
Type of the VehicleTyp of the RoadsMeasuring Cycle No. 1Measuring Cycle No. 2Measuring Cycle No. 3Measuring Cycle No. 4Measuring Cycle No. 5Measuring Cycle No. 6Measuring Cycle No. 7Measuring Cycle No. 8Measuring Cycle No. 9Measuring Cycle No. 10Measuring Cycle No. 11Measuring Cycle No. 12Measuring Cycle No. 13Measuring Cycle No. 14Measuring Cycle No. 15Measuring Cycle No. 16Measuring Cycle No. 17Measuring Cycle No. 18Measuring Cycle No. 19Measuring Cycle No. 20Measuring Cycle No. 21
Timber truck whith trailerForest road137%103%172%148%115%140%104%149%106%162%122%186%147%114%123%117%115%147%157%115%119%
Roads of lower classes137%103%125%122%128%129%103%158%126%144%113%111%112%120%112%122%129%121%136%126%144%
High class roads100%100%100%100%100%100%100%100%100%100%100%100%100%100%100%100%100%100%100%100%100%
Timber truck Forest road138%138%109%131%135%112%104%127%122%158%125%124%140%138%110%132%140%129%137%110%125%
Roads of lower classes119%123%107%122%122%110%103%118%114%140%114%111%121%124%108%109%159%107%109%125%114%
High class roads100%100%100%100%100%100%100%100%100%100%100%100%100%100%100%100%100%100%100%100%100%
Passenger carForest road127%126%106%125%176%124%112%133%132%131%139%111%148%138%117%105%139%121%133%130%100%
Roads of lower classes110%110%102%116%112%106%111%117%119%111%114%116%126%110%113%107%117%112%116%122%114%
High class roads100%100%100%100%100%100%100%100%100%100%100%100%100%100%100%100%100%100%100%100%100%
Table 3. Differentiated relative comparison of muscle load when driving a work vehicle according to the monitored type of roads (author).
Timber Truck Whith TrailerTimber Truck Passenger Car
Forest road133.23%106.65%127.8%108.20%127.3%112.28%
Roads of lower classes124.9%118.1%113.4%
High class roads0.0% 0.0% 0.0%
Table 4. Analysis of the variance of values of the dependence of muscle load and heart ratevalues on the type of ground communications and on the type of vehicle used. The red text indicates statistical significance.
Type of the VehicleEffectSum of SquaresNumbers of Degrees of FreedomAverage SquareF Valuep-Level of Significance
Timber truck whith trailerEMG
Intercept38,652.05138,652.05972.73160.000000
Type of ground communication843.722421.8610.61670.000115
Error2344.405939.74
PULSE
Intercept523,706.91523,706.922,487.420.000000
Type of ground communication77.7238.91.670.197033
Error1397.36023.3
Timber truck EMG
Intercept26,194.25126,194.25750.66040.000000
Type of ground communication467.652233.826.70080.002385
Error2058.805934.89
PULSE
Intercept468,186.71468,186.777,579.590.000000
Type of ground communication28.2214.12.340.105231
Error362.1606.0
Passenger carEMG
Intercept19,326.65119,326.65339.51100.000000
Type of ground communication610.242305.125.36000.007263
Error3358.575956.92
PULSE
Intercept434,671.31434,671.387,378.080.000000
Type of ground communication15.327.61.530.223843
Error298.5605.0
Table 5. Post hoc test to analyze the variance of muscle load values depending on the type of communication when driving the timber truck with trailer. Red text indicates statistical significance.
Scheffe’s Test; EMG Variable
Probabilities for Post hoc Tests
Error: Intermediate. SS = 34.895, AS = 59.000
Cell NumberType of Ground Communication(1) 26.877(2) 28.270(3) 19.778
1Forest road 0.7747110.002820
2Roads of lower classes0.774711 0.000309
3High class roads0.0028200.000309
Table 6. Post hoc test to analyze the variance of heart rate values depending on the type of communication when driving the timber truck with trailer.
Scheffe’s Test; Pulse Variable
Probabilities for Post hoc Tests
Error: Intermediate. SS = 23.289, AS = 60.00
Cell NumberType of Ground Communication(1) 91.762(2) 92.143(3) 89.619
1Forest road 0.9678310.361434
2Roads of lower classes0.967831 0.245958
3High class roads0.3614340.245958
Table 7. Post hoc test to analyze the variance of muscle load values depending on the type of communication when driving the timber truck. The red text indicates statistical significance.
Scheffe’s Test; EMG Variable
Probabilities for Post hoc Tests
Error: Intermediate. SS = 56.925, AS = 59.00
Cell NumberType of Ground Communication(1) 23.650(2) 21.086(3) 16.944
1Forest road 0.3780670.002587
2Roads of lower classes0.378067 0.089193
3High class roads0.0025870.089193
Table 8. Post hoc test to analyze the variance of heart rate values depending on the type of communication when driving the timber truck.
Scheffe’s Test; Pulse Variable
Probabilities for Post hoc Tests
Error: Intermediate. SS = 6.0349, AS = 60.000
Cell NumberType of Ground Communication(1) 86.476(2) 86.857(3) 85.286
1Forest road 0.8816290.298722
2Roads of lower classes0.881629 0.125584
3High class roads0.2987220.125584
Table 9. Post hoc test to analyze the variance of muscle load values depending on the type of communication when driving the passenger car. The red text indicates statistical significance.
Scheffe’s Test; EMG Variable
Probabilities for Post hoc Tests
Error: Intermediate. SS = 39.736, AS = 59.000
Cell NumberType of Ground Communication(1) 21.464(2) 17.770(3) 13.747
1Forest road 0.2914520.007266
2Roads of lower classes0.291452 0.241362
3High class roads0.0072660.241362
Table 10. Post hoc test to analyze the variance of heart rate values depending on the type of communication when driving the passenger car.
Scheffe’s Test; Pulse Variable
Probabilities for Post hoc Tests
Error: Intermediate. SS = 4.9746, AS = 60.000
Cell NumberType of Ground Communication(1) 83.286(2) 83.524(3) 82.381
1Forest road 0.9419830.426686
2Roads of lower classes0.941983 0.259837
3High class roads0.4266860.259837
Publisher’s Note: MDPI stays neutral with regard to jurisdictional claims in published maps and institutional affiliations.