Positive Effects of Reforestation on the Diversity and Abundance of Soil Fauna in a Landscape Degraded Red Soil Area in Subtropical China

 ,
,
Abstract
:1. Introduction
2. Materials and Methods
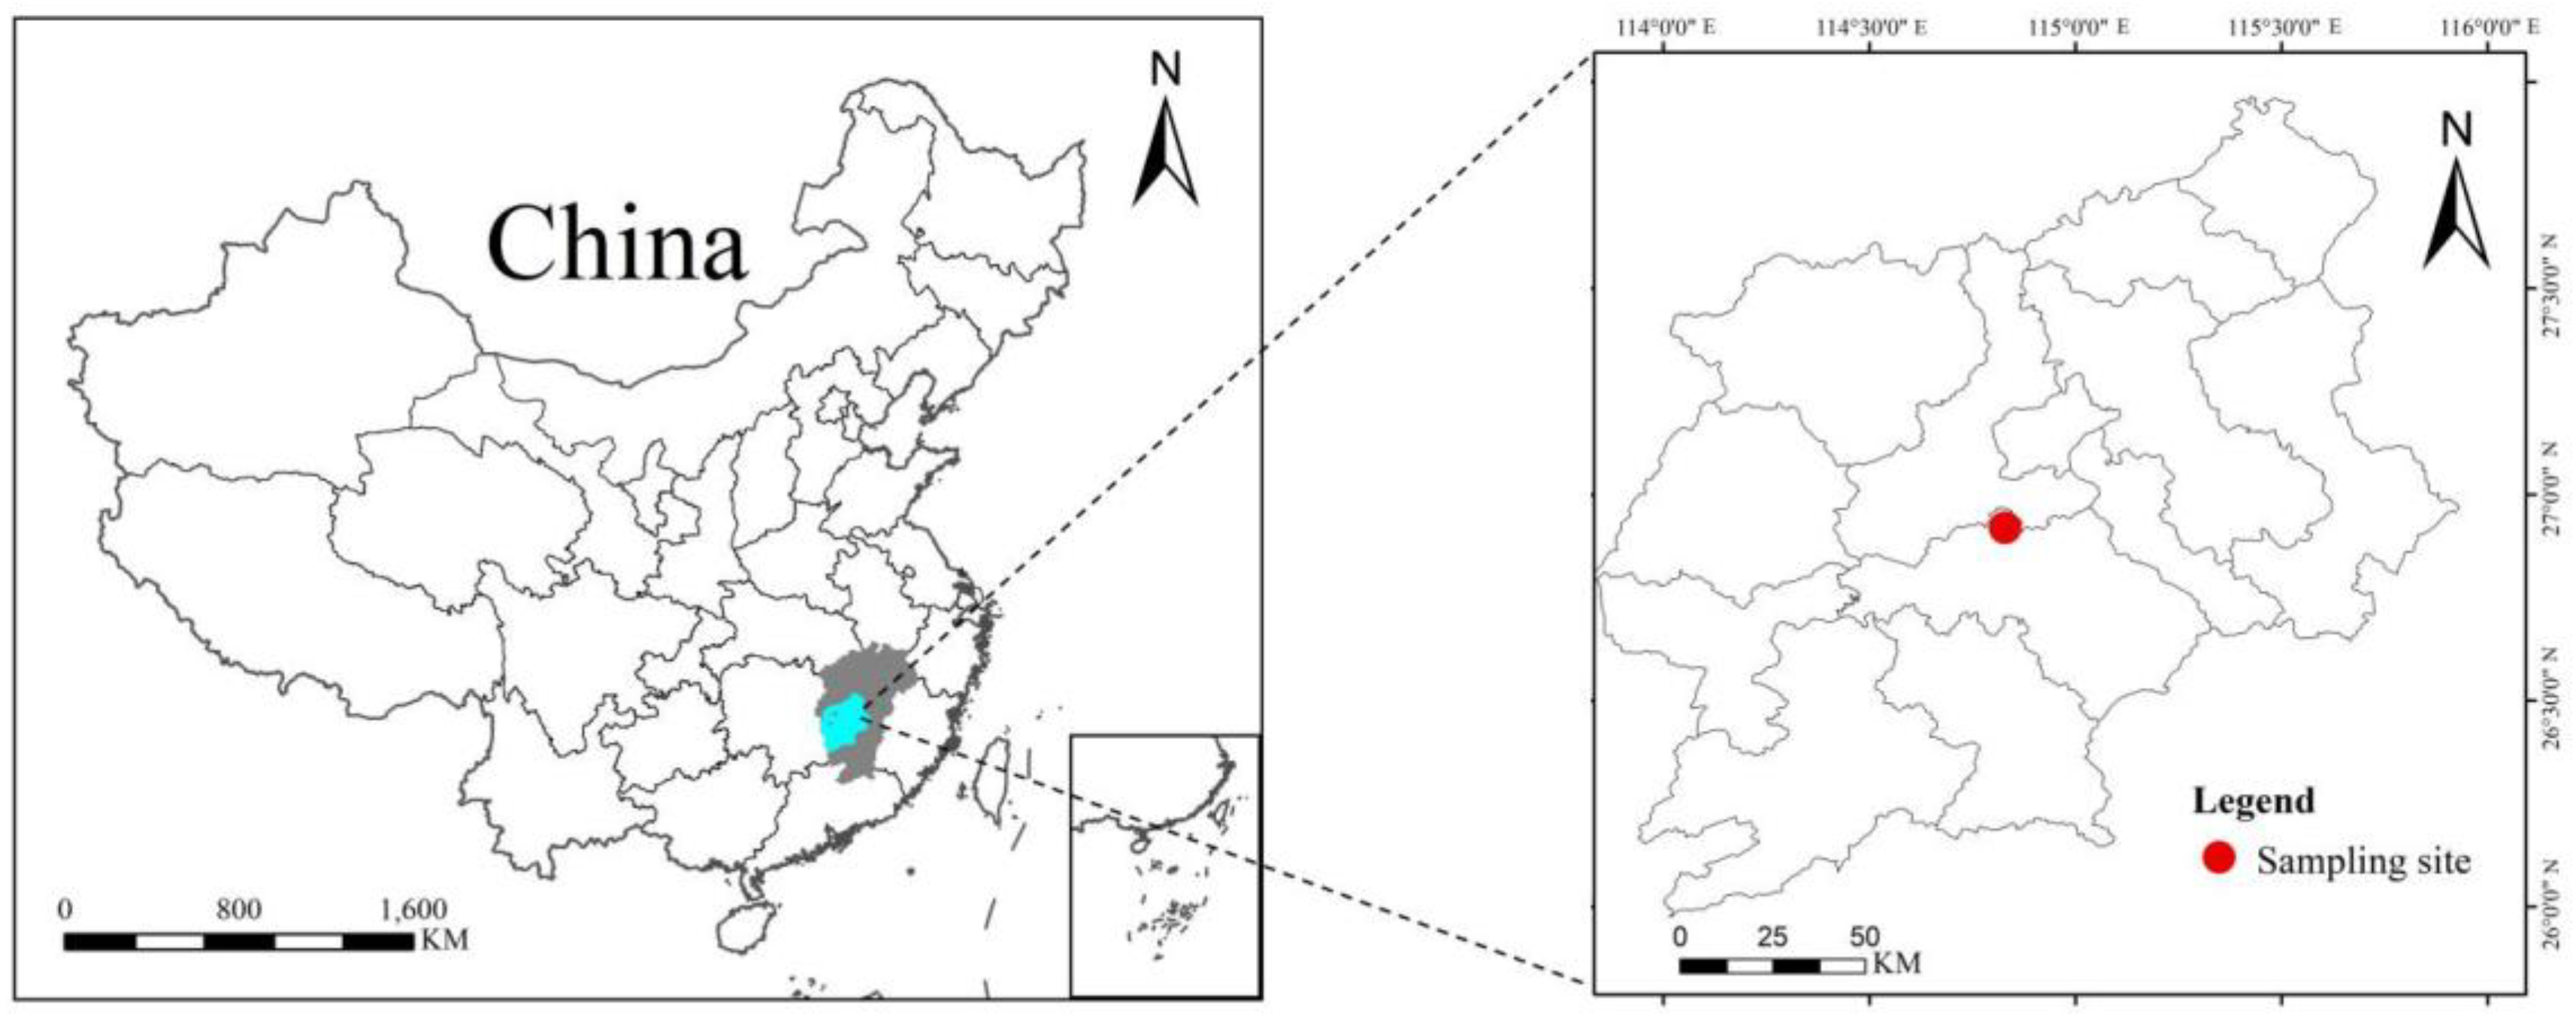
2.1. Study Site
2.2. Soil Sample Collection
2.3. Soil Fauna Separation and Extraction
2.4. Data Analysis
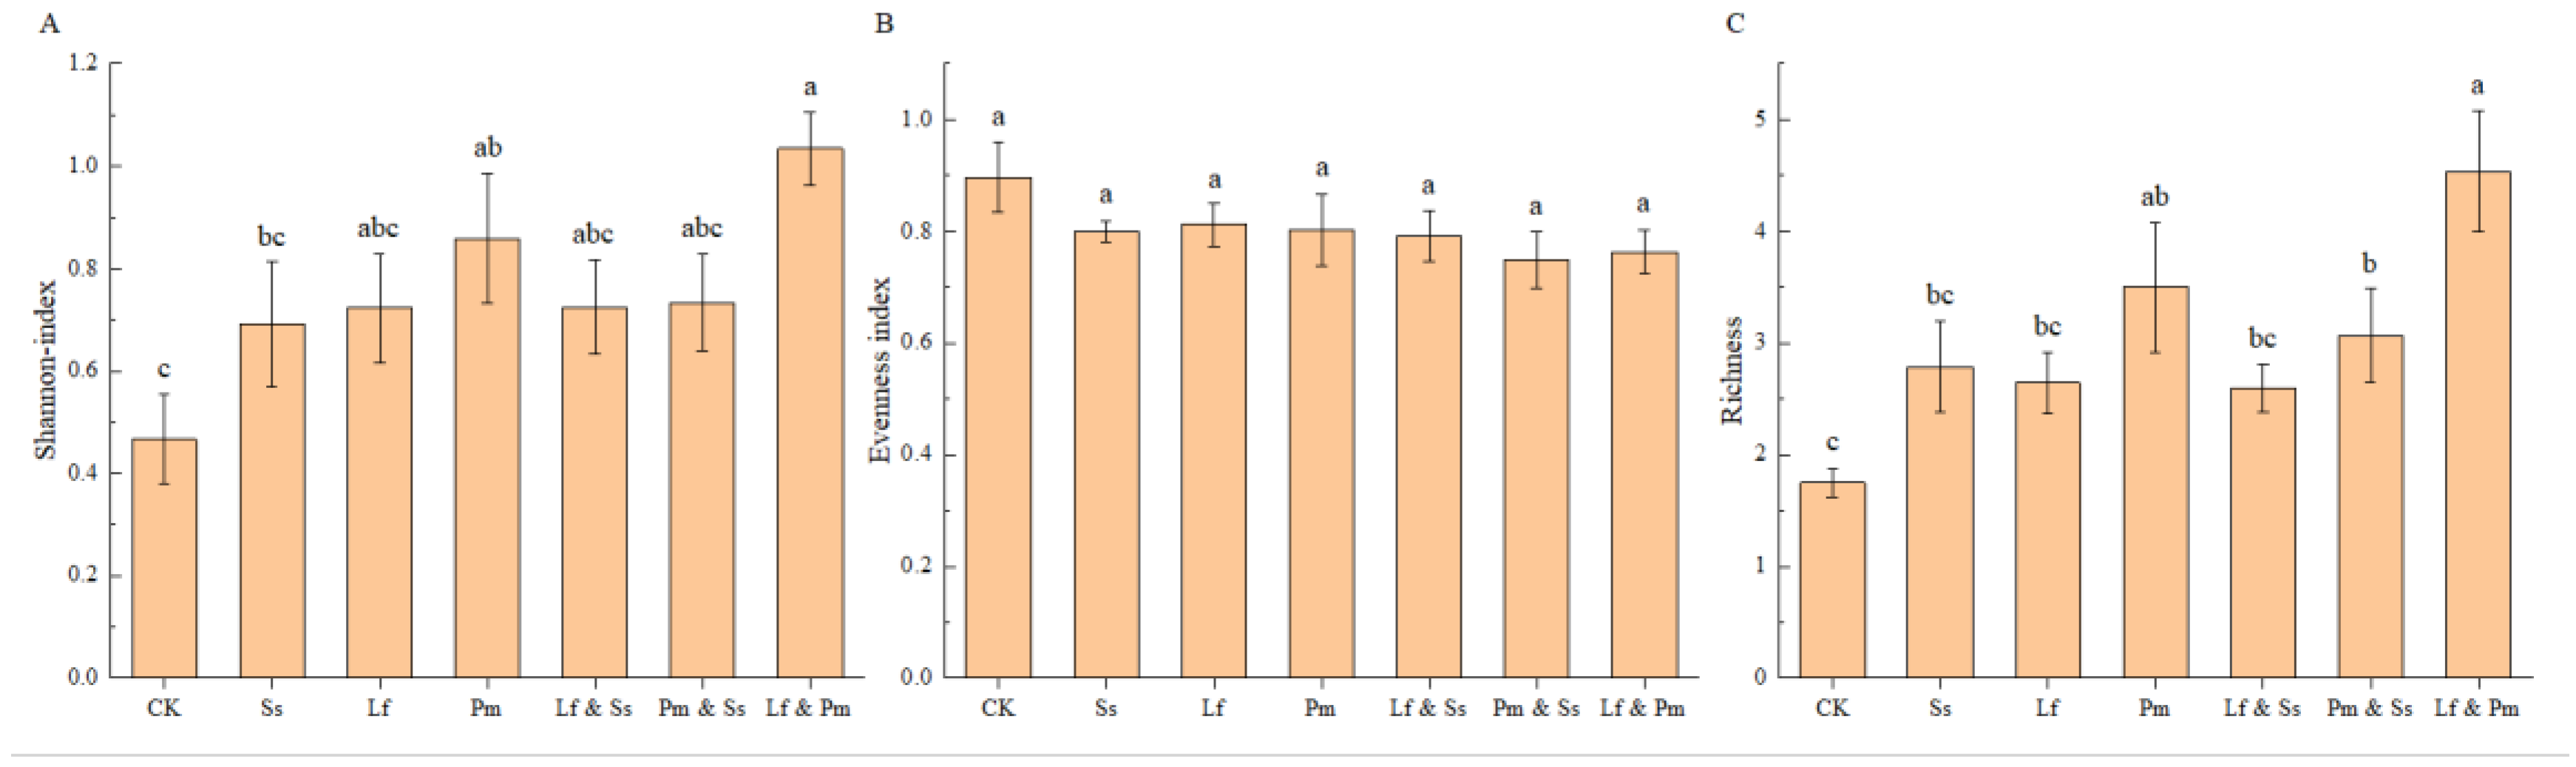
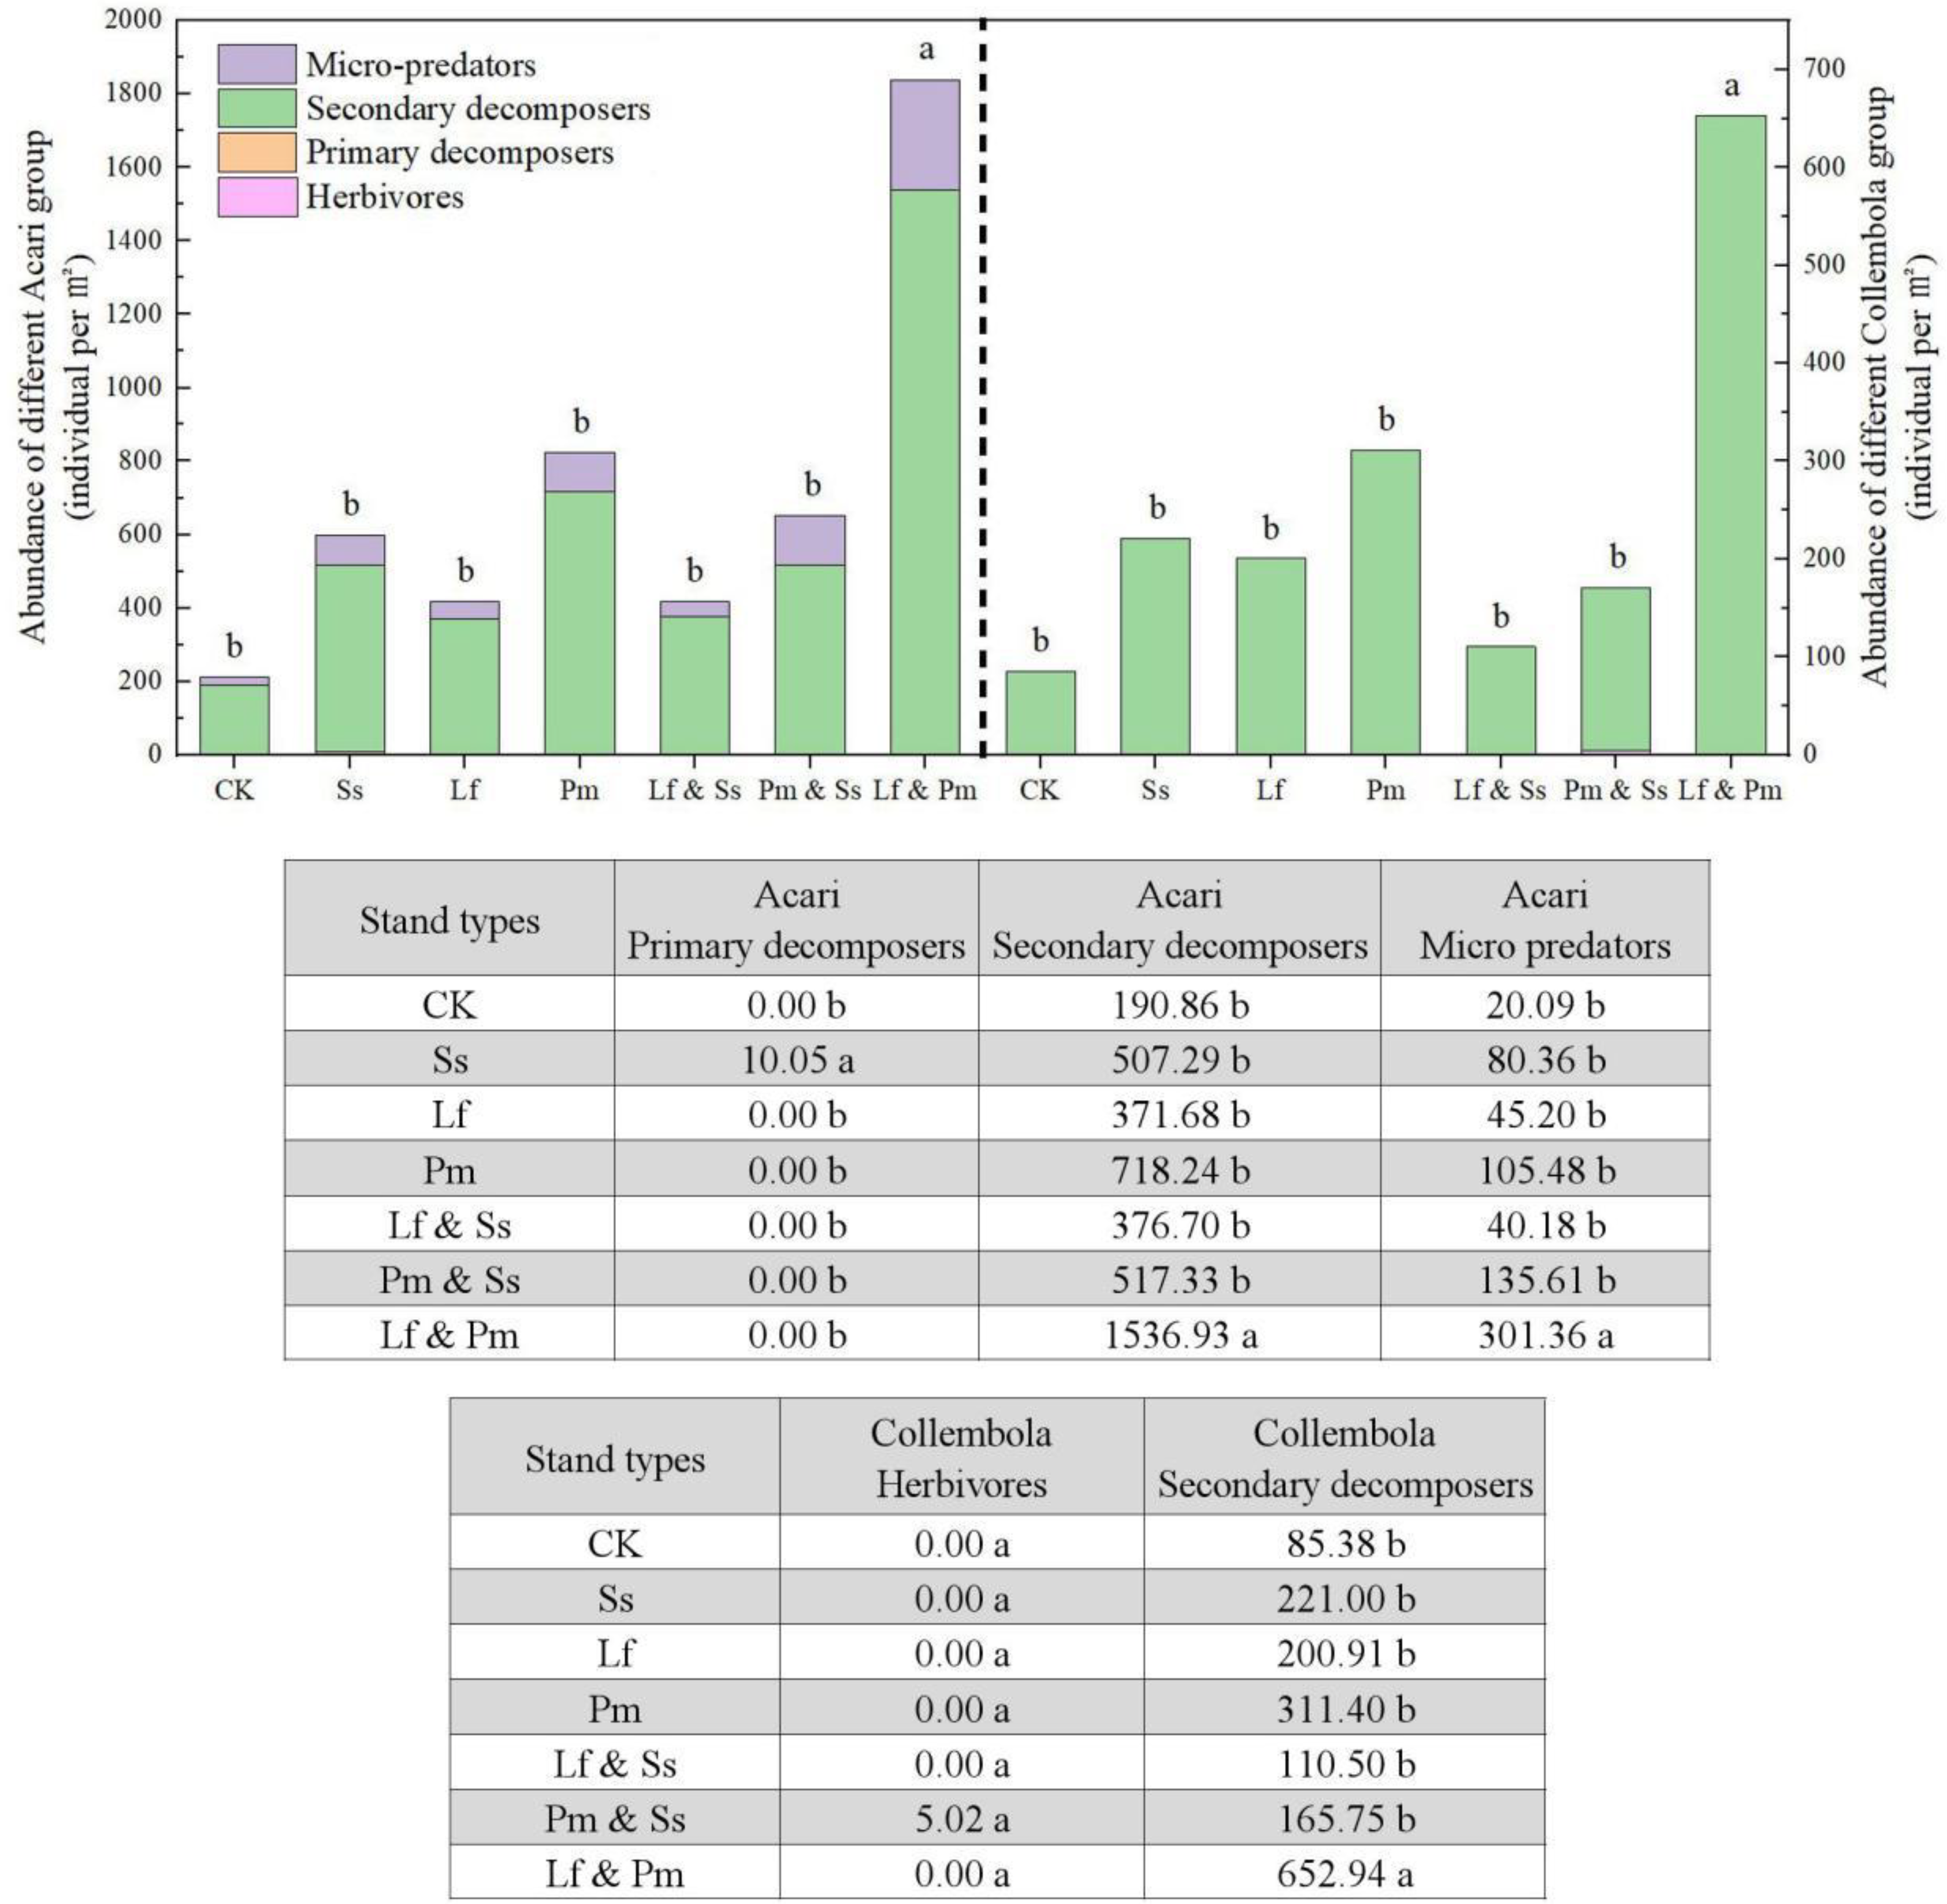
3. Results
4. Discussion
5. Conclusions
Author Contributions
Funding
Conflicts of Interest
Appendix A

| Forest Types | Water Content (%) | Total N (g·kg−1) | Total P (g·kg−1) | Soil Organic Carbon (g·kg−1) | pH | C/N |
|---|---|---|---|---|---|---|
| Lf | 12.69 ± 1.53 ab | 0.92 ± 0.01 b | 0.32 ± 0.02 b | 20.13 ± 1.45 b | 4.75 ± 0.03 a | 21.98 ± 1.60 b |
| Ss | 15.36 ± 1.68 a | 1.04 ± 0.03 a | 0.37 ± 0.01 a | 23.10 ± 0.87 a | 4.73 ± 0.03 a | 22.13 ± 0.34 b |
| Pm | 12.52 ± 0.57 ab | 0.74 ± 0.02 c | 0.33 ± 0.02 ab | 21.77 ± 0.66 ab | 4.58 ± 0.05 c | 29.37 ± 1.15 a |
| Lf & Ss | 15.56 ± 0.47 a | 1.07 ± 0.01 a | 0.35 ± 0.02 ab | 21.97 ± 0.93 ab | 4.64 ± 0.01 bc | 20.50 ± 0.65 b |
| Pm & Ss | 11.48 ± 0.98 b | 0.73 ± 0.03 c | 0.27 ± 0.01 c | 4.69 ± 0.15 d | 4.70 ± 0.01 ab | 6.50 ± 0.46 d |
| Lf & Pm | 13.04 ± 0.87 ab | 0.75 ± 0.02 c | 0.32 ± 0.01 bc | 10.17 ± 0.47 c | 4.62 ± 0.01 bc | 13.60 ± 0.22 c |
| CK | 12.54 ± 1.13 ab | 0.62 ± 0.02 d | 0.32 ± 0.01 b | 5.08 ± 0.03 d | 4.74 ± 0.02 a | 8.19 ± 0.23 d |
References
- Zhao, Q.G.; Huang, G.Q.; Ma, Y.Q. The problems in red soil ecosystem in southern of China and its countermeasures. Acta Ecol. Sin. 2013, 33, 7615–7622. [Google Scholar]
- Li, Z.A.; Zou, B.; Cao, Y.S.; Ren, H.; Liu, J. Nutrient properties of soils in typical degraded hilly land in South China. Acta Ecol. Sin. 2003, 23, 1648–1656. [Google Scholar]
- Land Use Administration Bureau of Jiangxi (LUAB). Soil of Jiangxi; China Agricultural Science and Technology Press: Beijing, China, 1991; pp. 58–59. [Google Scholar]
- Gong, X.; Liu, Y.Q.; Li, Q.L.; Wei, X.; Guo, X.; Niu, D.; Zhang, J.; Zhang, L. Zhang, Sub-tropic degraded red soil restoration: Is soil organic carbon build-up limited by nutrients supply. For. Ecol. Manag. 2013, 300, 77–87. [Google Scholar] [CrossRef]
- Sun, B.; Zhao, Q. Evaluation indexes and methods of soil quality concerning red soil degradation. Prog. Geogr. 1999, 18, 118–128. [Google Scholar]
- Zhao, Q. Some Considerations for present soil and water conservation and ecology security of south China. Bull. Soil Water Conserv. 2006, 26, 1–8. [Google Scholar]
- Lal, R. Degradation and resilience of soils. Philosophical Transactions of the Royal Society of London. Ser. B Biol. Sci. 1997, 352, 997–1010. [Google Scholar] [CrossRef]
- Lal, R. Restoring soil quality to mitigate soil degradation. Sustainability 2015, 7, 5875–5895. [Google Scholar] [CrossRef]
- Liu, Y.; Du, T.; Guo, X.; Yang, G.; Lou, L. Study on rehabilitating forest model and soil restoration on degraded Quaternary red soil. J. Soil Water Conserv. 2004, 18, 34–37. [Google Scholar]
- Zheng, H.; Ouyang, Z.Y.; Wang, X.K.; Miao, H.; Zhao, T.; Peng, T. Effects of forest restoration types on soil quality in red soil eroded region, Southern China. Acta Ecol. Sin. 2004, 24, 1994–2002. [Google Scholar]
- Yan, E.R.; Wang, X.H.; Chen, X.Y. Impacts of evergreen broad-leaved forest, degradation on soil nutrients and carbon pools in Tiantong, Zhejiang province. Acta Ecol. Sin. 2007, 27, 1646–1655. [Google Scholar]
- Lu, Y.; Gan, H.; Xu, S. Study on organic matter and nitrogen characteristics of red soil and its organic-inorganic complex. Chin. J. Soil Sci. 1996, 01, 29–32. [Google Scholar]
- Zhao, R.; Fan, J.; He, Y.; Song, C.; Tu, R.; Tan, B. Research on soil enzyme activities and limiting factors for restoration of degraded Pinus massoniana plantation. Acta Pedol. Sin. 2011, 48, 1287–1292. [Google Scholar]
- Yin, R.; Deng, H.; Wang, H.; Zhang, B. Vegetation type affects soil enzyme activities and microbial functional diversity following re-vegetation of a severely eroded red soil in sub-tropical China. Catena 2014, 115, 96–103. [Google Scholar] [CrossRef]
- Bengtsson, J. Disturbance and resilience in soil animal communities. Eur. J. Soil Biol. 2002, 38, 119–125. [Google Scholar] [CrossRef]
- Heneghan, L.; Coleman, D.C.; Zou, X.; Haines, B.L. Soil microarthropod contributions to decomposition dynamics: Trophic-temperate comparisons of a single substrate. Ecology 1999, 80, 1873–1882. [Google Scholar]
- Kautz, T.; Lpez-Fando, C.; Ellmer, F. Abundance and biodiversity of soil microarthtopods as influenced by different types of organic manure in a long-term field experiment in central Spain. Appl. Soil Ecol. 2006, 33, 278–285. [Google Scholar] [CrossRef]
- Carrillo, Y.; Ball, B.A.; Bradford, M.A.; Jordan, C.F.; Molina, M. Soil fauna alter the effects of litter composition on nitrogen cycling in a mineral soil. Soil Biol. Biochem. 2011, 43, 1440–1449. [Google Scholar] [CrossRef]
- García, R.R.; Ocharan, F.J.; García, U.; Osoro, K.; Celaya, R. Arthropod fauna on grassland-heathland associations under different grazing managements with domestic ruminants. Comptes Rendus Biol. 2010, 333, 226–234. [Google Scholar] [CrossRef]
- Basset, Y.; Cizek, L.; Cuénoud, P.; Didham, R.K.; Guilhaumon, F.; Missa, O.; Novotny, V.; Ødegaard, F.; Roslin, T.; Schmidl, J.; et al. Arthropod diversity in a tropical forest. Science 2012, 338, 1481–1484. [Google Scholar] [CrossRef]
- Cunha Neto, F.V.; Correia, M.E.F.; Pereira, G.H.A.; Pereira, M.G.; Leles, P.S.D.S. Soil fauna as an indicator of soil quality in forest stands, pasture and secondary forest. Rev. Bras. De Ciência Do Solo 2012, 36, 1407–1417. [Google Scholar] [CrossRef] [Green Version]
- Elie, F.; Vincenot, L.; Berthe, T.; Quibel, E.; Zeller, B.; Saint-André, L.; Normand, M.; Chauvat, M.; Aubert, M. Soil fauna as bioindicators of organic matter export in temperate forests. For. Ecol. Manag. 2018, 429, 549–557. [Google Scholar] [CrossRef]
- Babenko, A.; Temnikova, I.; Bokova, U. Soil fauna as an indicator of disturbed forest areas in West Siberian industrial regions (the Kuznetsky Alatau case study). Int. J. Environ. Stud. 2014, 71, 671–677. [Google Scholar] [CrossRef]
- Liu, Y.; Yu, G.R.; Li, J.; Song, X.; Chen, Y. Study on surface energy balance closure of a coniferous forest plantation in red earth hilly area, China—Take Qianyanzhou, Taihe County, Jiangxi Province as an example. Sci. Silvae Sin. 2006, 42, 13–20. [Google Scholar]
- Liu, W.; Zhang, J.; Norris, S.L.; Murray, P.J. Impact of grassland reseeding, herbicide spraying and ploughing on diversity and abundance of soil arthropods. Front. Plant Sci. 2016, 7, 1200. [Google Scholar] [CrossRef] [PubMed]
- Crotty, F.V.; Blackshaw, R.P.; Adl, S.M.; Inger, R.; Murray, P.J. Divergence of feeding channels within the soil food web determined by ecosystem type. Ecol. Evol. 2014, 4, 1–13. [Google Scholar] [CrossRef]
- Krebs, C.J. Ecological Methodology, 2nd ed.; Benjamin-Cummings: Menlo Park, CA, USA, 1999. [Google Scholar]
- McVicar, T.R.; van Niel, T.G.; Li, L.T.; Wen, Z.M.; Yang, Q.K.; Li, R.; Jiao, F. Parsimoniously modelling perennial vegetation suitability and indentifying priority areas to support China’s re-vegetation program in the Loess Plateau: Matching model complexity to data availability. For. Ecol. Manag. 2010, 259, 1277–1290. [Google Scholar] [CrossRef]
- Sun, X.; Li, Q.; Yao, H.F.; Liu, M.Q.; Wu, D.H.; Zhu, D.; Zhu, Y.G. Soil fauna and soil health. Acta Pedol. Sin. 2021, 58, 1–13. [Google Scholar]
- George PB, L.; Keith, A.M.; Creer, S.; Barrett, G.L.; Lebron, I.; Emmett, B.A.; Robinson, D.A.; Jonesa, D.L. Evaluation of mesofauna communities as soil quality indicators in a national-level monitoring programme. Soil Biol. Biochem. 2017, 115, 537–546. [Google Scholar] [CrossRef]
- Lakshmi, G.; Joseph, A. Soil microarthropods as indicators of soil quality of tropical home gardens in a village in Kerala, India. Agrofor. Syst. 2017, 91, 439–450. [Google Scholar] [CrossRef]
- Krantz, G.W.; Lindquist, E.E. Evolution of phytophagous mites (Acari). Annu. Rev. Entomol. 1979, 24, 121–158. [Google Scholar] [CrossRef]
- Frouz, J. Effects of soil macro- and mesofauna on litter decomposition and soil organic matter stabilization. Geoderma 2018, 332, 161–172. [Google Scholar] [CrossRef]
- Norton, R.A. Aspects of the biology and systematics of soil arachnids, particularly saprophagous and mycophagous mites. Quaest. Entomol. 1985, 21, 523–541. [Google Scholar]
- Siepel, H. Niche relationships between two panphytophagous soil mites, Nothrus silvestris Nicolet (Acari, Oribatida, Nothridae) and Platynothrus peltifer (Koch) (Acari, Oribatida, Camisiidae). Biol. Fertil. Soils 1990, 9, 139–144. [Google Scholar] [CrossRef]
- Behan-Pelletier, V.M.; Kanashiro, D. Acari in grassland soils of Canada. Arthropods Can. Grassl. 2010, 1, 137–166. [Google Scholar]
- Wu, P.F.; Zhu, B. Comparison of soil animal community characteristics between alder and cypress mixed plantation and cypress pure plantation. Chin. J. Appl. Environ. Biol. 2008, 14, 488–493. [Google Scholar]
- Moore, J.C.; William Hunt, H. Resource compartmentation and the stability of real ecosystems. Nature 1988, 333, 261–263. [Google Scholar] [CrossRef]
- Seastedt, T.R. The role of microarthropods in decomposition and mineralization processes. Annu. Rev. Entomol. 1984, 29, 25–46. [Google Scholar] [CrossRef]
- Bardgett, R.D.; Frankland, J.C.; Whittaker, J.B. The effects of agricultural management on the soil biota of some upland grasslands. Agric. Ecosyst. Environ. 1993, 45, 25–45. [Google Scholar] [CrossRef]
- Jörg-Alfred, S.; Jörn, A. The Collembola community of a Central European forest: Influence of tree species composition. Eur. J. Soil Biol. 2009, 45, 199–206. [Google Scholar]
- Zhang, P.; Tian, X.J.; He, X.B.; Song, F.; Ren, L.; Jiang, P. Effect of litter quality on its decomposition in broadleaf and coniferous forest. Eur. J. Soil Biol. 2008, 44, 392–399. [Google Scholar] [CrossRef]
- Saetre, P.; Brandtberg, P.O.; Lundkvist, H.; Bengtsson, J. Soil organisms and carbon, nitrogen and phosphorus mineralisation in Norway spruce and mixed Norway spruce–birch stands. Biol. Fertil. Soils 1999, 28, 382–388. [Google Scholar] [CrossRef]
- Hättenschwiler, S.; Gasser, P. Soil animals alter plant litter diversity effects on decomposition. Proc. Natl. Acad. Sci. USA 2005, 102, 1519–1524. [Google Scholar] [CrossRef] [PubMed]
- Ma, X.L.; Yang, J.Y.; Huang, X.R. Meso- and Micro-faunal communities of litter layer in the Pure and Mixed Larch Plantations, Saihanba area. J. Sichuan Agric. Univ. 2016, 34, 147–152. [Google Scholar]
- Hasegawa, M.T.; Ota, A.; Kabeya, D.; Okamoto, T.; Saitoh, T.; Nishiyama, Y. The effects of mixed broad-leaved trees on the collembolan community in larch plantations of central Japan. Appl. Soil Ecol. 2014, 83, 125–132. [Google Scholar] [CrossRef]
- Chauvat, M.; Wolters, Z.V. Successional changes of Collembola and soil microbiota during forest rotation. Oecologia 2003, 137, 269–276. [Google Scholar] [CrossRef]
- Eisenhauer, N.; Partsch, S.; Parkinson, D.; Scheu, S. Invasion of a deciduous forest by earthworms: Changes in soil chemistry, microflora, microarthropods and vegetation. Soil Biol. Biochem. 2007, 39, 1099–1110. [Google Scholar] [CrossRef]
- Migge, S.; Maraun, M.; Scheu, S.; Schaefer, M. The oribatid mite community (Acarina) of pure and mixed stands of beech (Fagus sylvatica) and spruce (Picea abies) of different age. Appl. Soil Ecol. 1998, 9, 115–121. [Google Scholar] [CrossRef]
- Tian, T.; Bai, Y.F.; Zhang, X.D.; Jiang, C.Q. The reason and countermeasure of the soil degradation of Chinese Fir plantation. For. Sci. Technol. 2019, 6–10. [Google Scholar]
- Hansen, R.A.; Coleman, D.C. Litter complexity and composition are determinants of the diversity and species composition of oribatid mites (Acari: Oribatida) in litterbags. Appl. Soil Ecol. 1998, 9, 17–23. [Google Scholar] [CrossRef]
- Hansen, R.A. Effects of habitat complexity and composition on a diverse litter microarthropod assemblage. Ecology 2000, 81, 1120–1132. [Google Scholar] [CrossRef]
- Kaneko, N.; Salamanca, E. Mixed leaf litter effects on decomposition rates and soil microarthropod communities in an oak–pine stand in Japan. Ecol. Res. 1999, 14, 131–138. [Google Scholar] [CrossRef]


| Phylum | Class | Superorder | Order | Family | Individual Number (/core) | Percentage of Total (%) | Relative Abundance |
|---|---|---|---|---|---|---|---|
| Arthropoda | Arachnida | Araneae | 20 | 1.33 | ++ | ||
| Acari | Parasitiformes | Mesostogmata | 145 | 9.67 | ++ | ||
| Acariformes | Prostigmata | 15 | 1.00 | ++ | |||
| Oribatida | 827 | 55.17 | +++ | ||||
| Pseudoscorpiones | 9 | 0.60 | + | ||||
| Collembola | Entomobryomorpha | 348 | 23.22 | +++ | |||
| Symphypleona | 1 | 0.07 | + | ||||
| Diplopoda | Sphaerotheriida | 1 | 0.07 | + | |||
| Chilopoda | Lithobiomorpha | 4 | 0.27 | + | |||
| Diplura | Diplura | 3 | 0.20 | + | |||
| Insecta | Diptera larvae | 6 | 0.40 | + | |||
| Hymenoptera | 107 | 7.14 | ++ | ||||
| Hemiptera | 1 | 0.07 | + | ||||
| Thysanoptera | 1 | 0.07 | + | ||||
| Coleoptera | Lathridiidae | 1 | 0.07 | + | |||
| Carabidae | 2 | 0.13 | + | ||||
| Staphylinidae | 1 | 0.07 | + | ||||
| Coleoptera larvae | 5 | 0.33 | + | ||||
| Annelida | Oligochaeta | Enchytraeidae | 2 | 0.13 | + | ||
| Total | 1499 | 100.00 |
Publisher’s Note: MDPI stays neutral with regard to jurisdictional claims in published maps and institutional affiliations. |
© 2022 by the authors. Licensee MDPI, Basel, Switzerland. This article is an open access article distributed under the terms and conditions of the Creative Commons Attribution (CC BY) license (https://creativecommons.org/licenses/by/4.0/).
Share and Cite
Xue, H.; Wang, Q.; Mao, K.; Liu, Y.; Jiang, X.; Murray, P.J.; Zhang, L.; Liu, W. Positive Effects of Reforestation on the Diversity and Abundance of Soil Fauna in a Landscape Degraded Red Soil Area in Subtropical China. Forests 2022, 13, 1596. https://doi.org/10.3390/f13101596
Xue H, Wang Q, Mao K, Liu Y, Jiang X, Murray PJ, Zhang L, Liu W. Positive Effects of Reforestation on the Diversity and Abundance of Soil Fauna in a Landscape Degraded Red Soil Area in Subtropical China. Forests. 2022; 13(10):1596. https://doi.org/10.3390/f13101596
Chicago/Turabian StyleXue, Huajian, Qiong Wang, Kuncai Mao, Yuanqiu Liu, Xueru Jiang, Philip J. Murray, Lvshui Zhang, and Wei Liu. 2022. "Positive Effects of Reforestation on the Diversity and Abundance of Soil Fauna in a Landscape Degraded Red Soil Area in Subtropical China" Forests 13, no. 10: 1596. https://doi.org/10.3390/f13101596