Article

Prediction of Suitable Habitats for Sapindus delavayi Based on the MaxEnt Model

1
Research Institute of Subtropical Forestry, Chinese Academy of Forestry, Hangzhou 311400, China
2
AnJi Longshan Forest Farm, Huzhou 313306, China
*
Author to whom correspondence should be addressed.
Forests 2022, 13(10), 1611; https://doi.org/10.3390/f13101611
Submission received: 29 August 2022 / Revised: 26 September 2022 / Accepted: 29 September 2022 / Published: 2 October 2022
(This article belongs to the Section Forest Inventory, Modeling and Remote Sensing)

Abstract

:
Sapindus delavayi (Franch.) Radlk. (S. delavayi) is an important biological washing material and biomass energy tree species with a peel rich in saponins and a kernel high in oil content. We used the maximum entropy model (MaxEnt) to predict the suitable habitats for S. delavayi in China, screen the dominant environmental factors affecting its distribution, and analyze the changes in its suitable habitats under future climate change. The results provide a scientific basis for its introduction, cultivation, and germplasm resource collection and protection. Twenty-two environmental variables and China distribution data for S. delavayi were used to construct the species distribution model, and the receiver operating characteristic (ROC) curve was used to verify the model’s accuracy. The dominant environmental factors were screened through the jackknife method, then a geographical information system (ArcGIS) was used to determine the level of suitable habitat division and area calculation. The results showed that the MaxEnt model had an excellent predictive effect for which the area under the ROC curve (AUC) value was as high as 0.959. The annual precipitation (Bio18), minimum temperature of the coldest month (Bio6), temperature seasonality (Bio4), and precipitation of the coldest quarter (Bio19) were the dominant environmental factors that affected the distribution of S. delavayi. Under the current climate, the suitable area for S. delavayi is 1,321,308.07 km2, and under the four climate scenarios for the 2050s and 2090s, the suitable area is predicted to change by −3.97%~2.57%. Overall, the centroids of the highly suitable habitats will shift by different degrees to the southwest in the future.

1. Introduction

Species respond to constant climate change in the future by altering their characteristics and physiological activities [1,2], which in turn lead to changes in their geographical distribution range and community composition and pattern [3,4]. Many studies have shown that climate warming will cause plant species to migrate to higher altitudes and latitudes [5,6]. The protection of endangered species and biodiversity has become a research hotspot in the world today [7]. Climate change is of great significance for plant introduction and domestication, ex situ protection, and preservation of germplasm resources and must be addressed by analyzing different scenarios of current and future climate development, determining the dominant environmental factors affecting vegetation distribution and predicting the geographical distribution of suitable vegetation habitats. At present, species distribution models (SDMs) are widely used to analyze the impact of climate change on the potential distribution of species, and model simulations can predict the changes in suitable habitats for species under different climate scenarios [8,9]. The generalized additive model (GARP) [10], the domain model (DOMAIN) [11], the bioclimatic model (BIOCLIM) [12], the niche factor analysis model (ENFA) [13], and the maximum entropy model (MaxEnt) are commonly used for niche analysis at both national and international levels [14]. As a machine-learning algorithm model with the advantages of good prediction effect, wide application, and simple operation [15], the MaxEnt model can obtain the maximum entropy of a species probability distribution by requiring only species distribution coordinates and environmental-factor data to evaluate the suitability of the habitat in question [16,17].
Sapindus delavayi (Franch.) Radlk. (S. delavayi) is a deciduous tree species of the Sapindus in Sapindaceae and is mainly distributed in central and northwestern Yunnan Province and southwestern Sichuan Province. It is endemic to China [18]. S. delavayi is a primary supplier of raw materials for the biological washing industry, as its pseudopericarp is rich in saponins and other substances [19]. It has also become a new biomass energy tree species due to the high oil content in its kernels [20]. Sun et al. [21] showed that the seed kernel oil content, kernel content, 100-seed kernel weight, and 100-kernel oil of S. delavayi were 1.77%, 51.34%, 32.30%, and 40.67% respectively, which values were higher than those for Sapindus mukorossi. It has greater potential as a biomass energy raw-material tree species. In addition, S. delavayi has a beautiful tree shape, a developed root system, strong acid resistance and barren resistance, and its leaves absorb SO2 and other air pollutants. Therefore, it is also an important ecological restoration and landscaping tool for native tree species in Southwest China. At present, there are few studies on S. delavayi, with only a few reports on saponin extraction and activity [22], variation in economic traits [20], and cutting propagation [23]. Liu et al. [24] conducted a brief study on its suitable habitats and environmental factors affecting distribution under the current climate. As an important tree species that integrates economic, ecological, and social benefits, although S. delavayi is rich in Southwest China, it has not been well developed and utilized. Our study combined survey data and specimen-distribution information for the wild population of S. delavayi with 19 climatic factors and three terrain factors, then adopted the Coupled Model Intercomparison Project Phase 6 (CMIP6) to generate future climate data with a high scenario starting point and flat forecast that are close to true values [25]; these data were used to construct the MaxEnt model. The purpose was to explore the influence of dominant environmental factors on the distribution of S. delavayi, analyze the potentially suitable habitats in China, and predict the changes in suitable habitats under four climate scenarios in two periods of the future. Genetic protection and ex situ conservation of the germplasm resources as well as cultivation and utilization of S. delavayi are provided with a scientific basis.

2. Materials and Methods

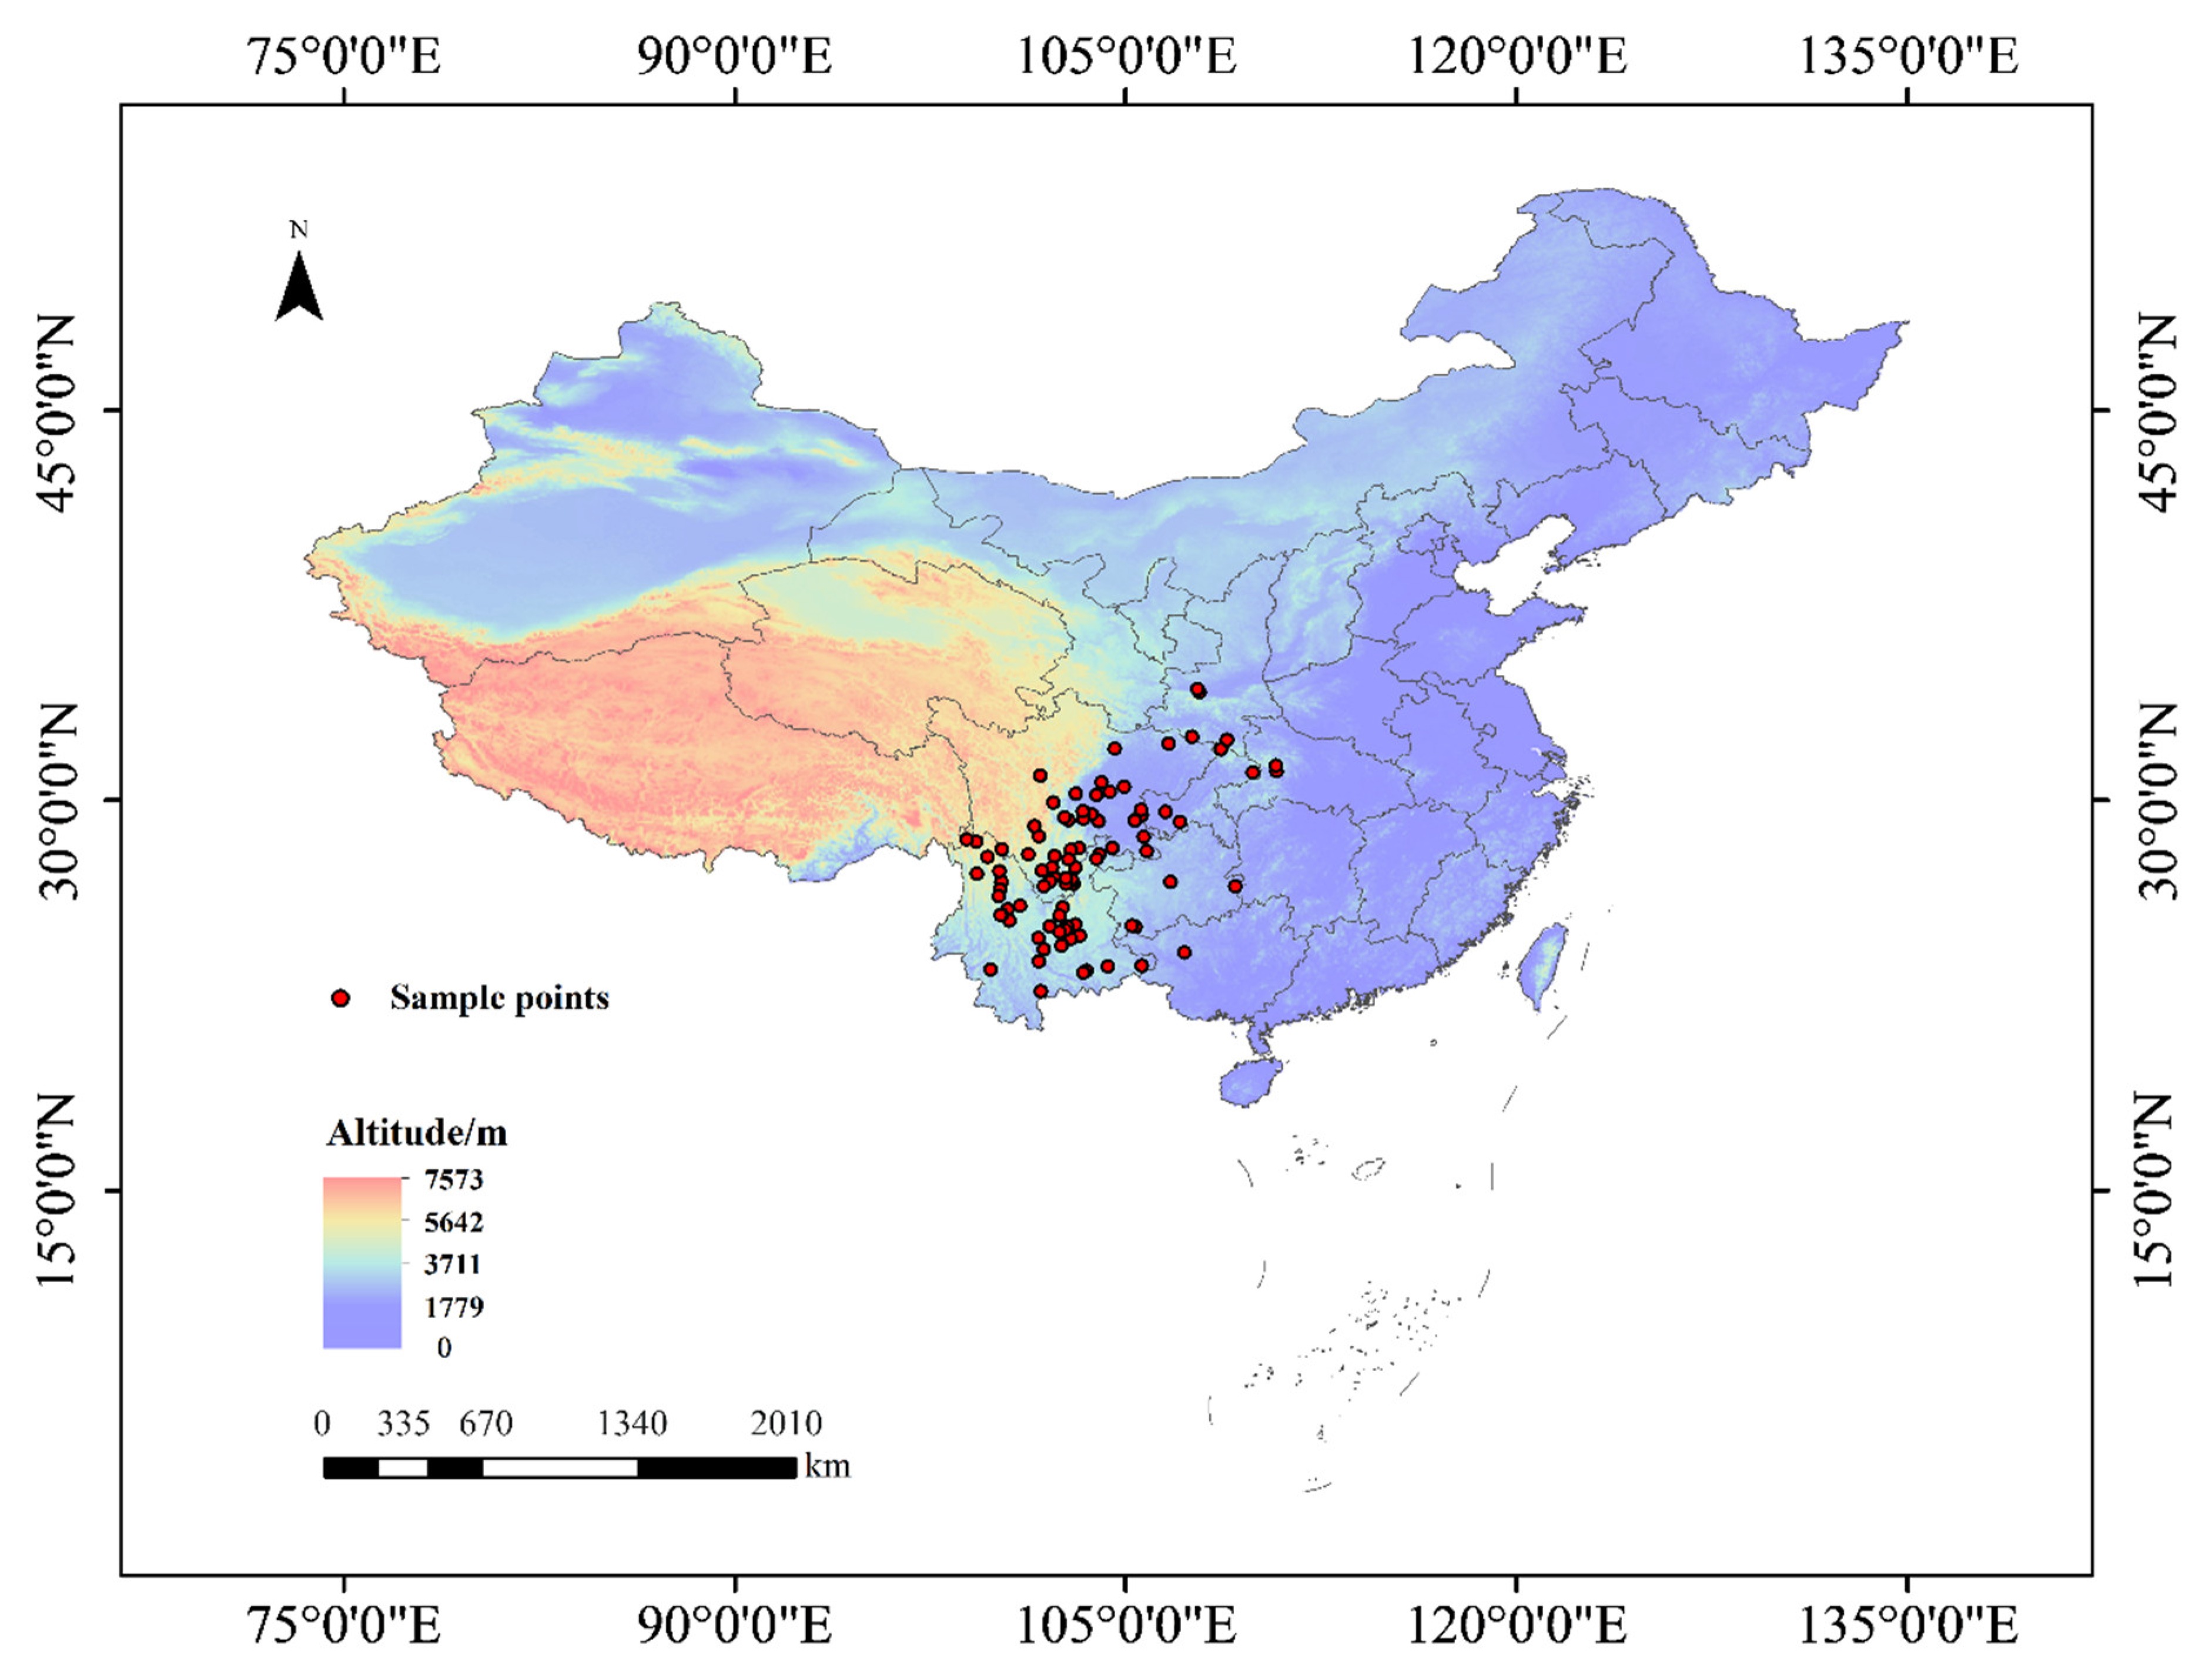
2.1. Distributional Data

The 168 wild S. delavayi distribution points were selected from the Global Biodiversity Information Facility (GBIF, https://www.gbif.org, accessed on 7 July 2021), the NSII-China National Specimen Resource Platform (http://www.nsii.org.cn, accessed on 6 July 2021), the China Digital Herbarium (https://www.cvh.ac.cn/, accessed on 7 July 2021), and China flora records and field surveys. First, duplicate and uncertain data were removed, and then only one specimen record datum for the 2.50′ × 2.50′ grid of the distribution area was selected [26]. Finally, a total of 92 distribution points of S. delavayi were determined for model construction (Figure 1).

2.2. Environmental Variable Data

The study initially used 19 climate variables and three terrain variables to construct the MaxEnt model (Table 1). The climate variable data came from the World Climate Database (WorldClim v2.1, https://www.worldclim.org/, accessed on 21 April 2021), which included three periods: Current (1970s~2000s), Future 2050s (2040s~2060s), and Future 2090s (2080s~2100s), and the spatial resolution was unified to 2.50′. The future climate data were adopted from the Coupled Model Intercomparison Project Phase 6 (CMIP6) and the Moderate Resolution Climate System Model (BCC-CSM2-MR). There were four shared socioeconomic paths: SSP1-2.6 (sustainable development path), SSP2-4.5 (medium development path), SSP3-7.0 (partial development path), and SSP5-8.5 (conventional development path) [27]. The global elevation (DEM) data came from the National Oceanic and Atmospheric Administration National Center for Environmental Information (NOAA-NCEI, https://www.ngdc.noaa.gov/, accessed on 21 April 2021), with an accuracy of 1 km. The slope and aspect data were analyzed and generated by the 3D Analyst tool in ArcGIS 10.3. The world’s national administrative base map, with 1 million basic geographic data points around the world, came from the Resource and Environment Science and Data Center of the Institute of Geographic Sciences and Natural Resources Research, Chinese Academy of Sciences.

2.3. MaxEnt Model Building and Parameter Setting

The 92 S. delavayi distribution data (*.csv) and 22 environmental variable data (*.asc) obtained above were simultaneously imported into the MaxEnt v3.4.4 software. The environmental factor was set to “continues”, “jackknife” and “response curves” were checked, the training data were set to 75.00% of all distribution points, and the test data were set to 25.00%. The model was set to operate 1000 times, and the operation was repeated 10 times [28]; the other parameters were the default values of the system.

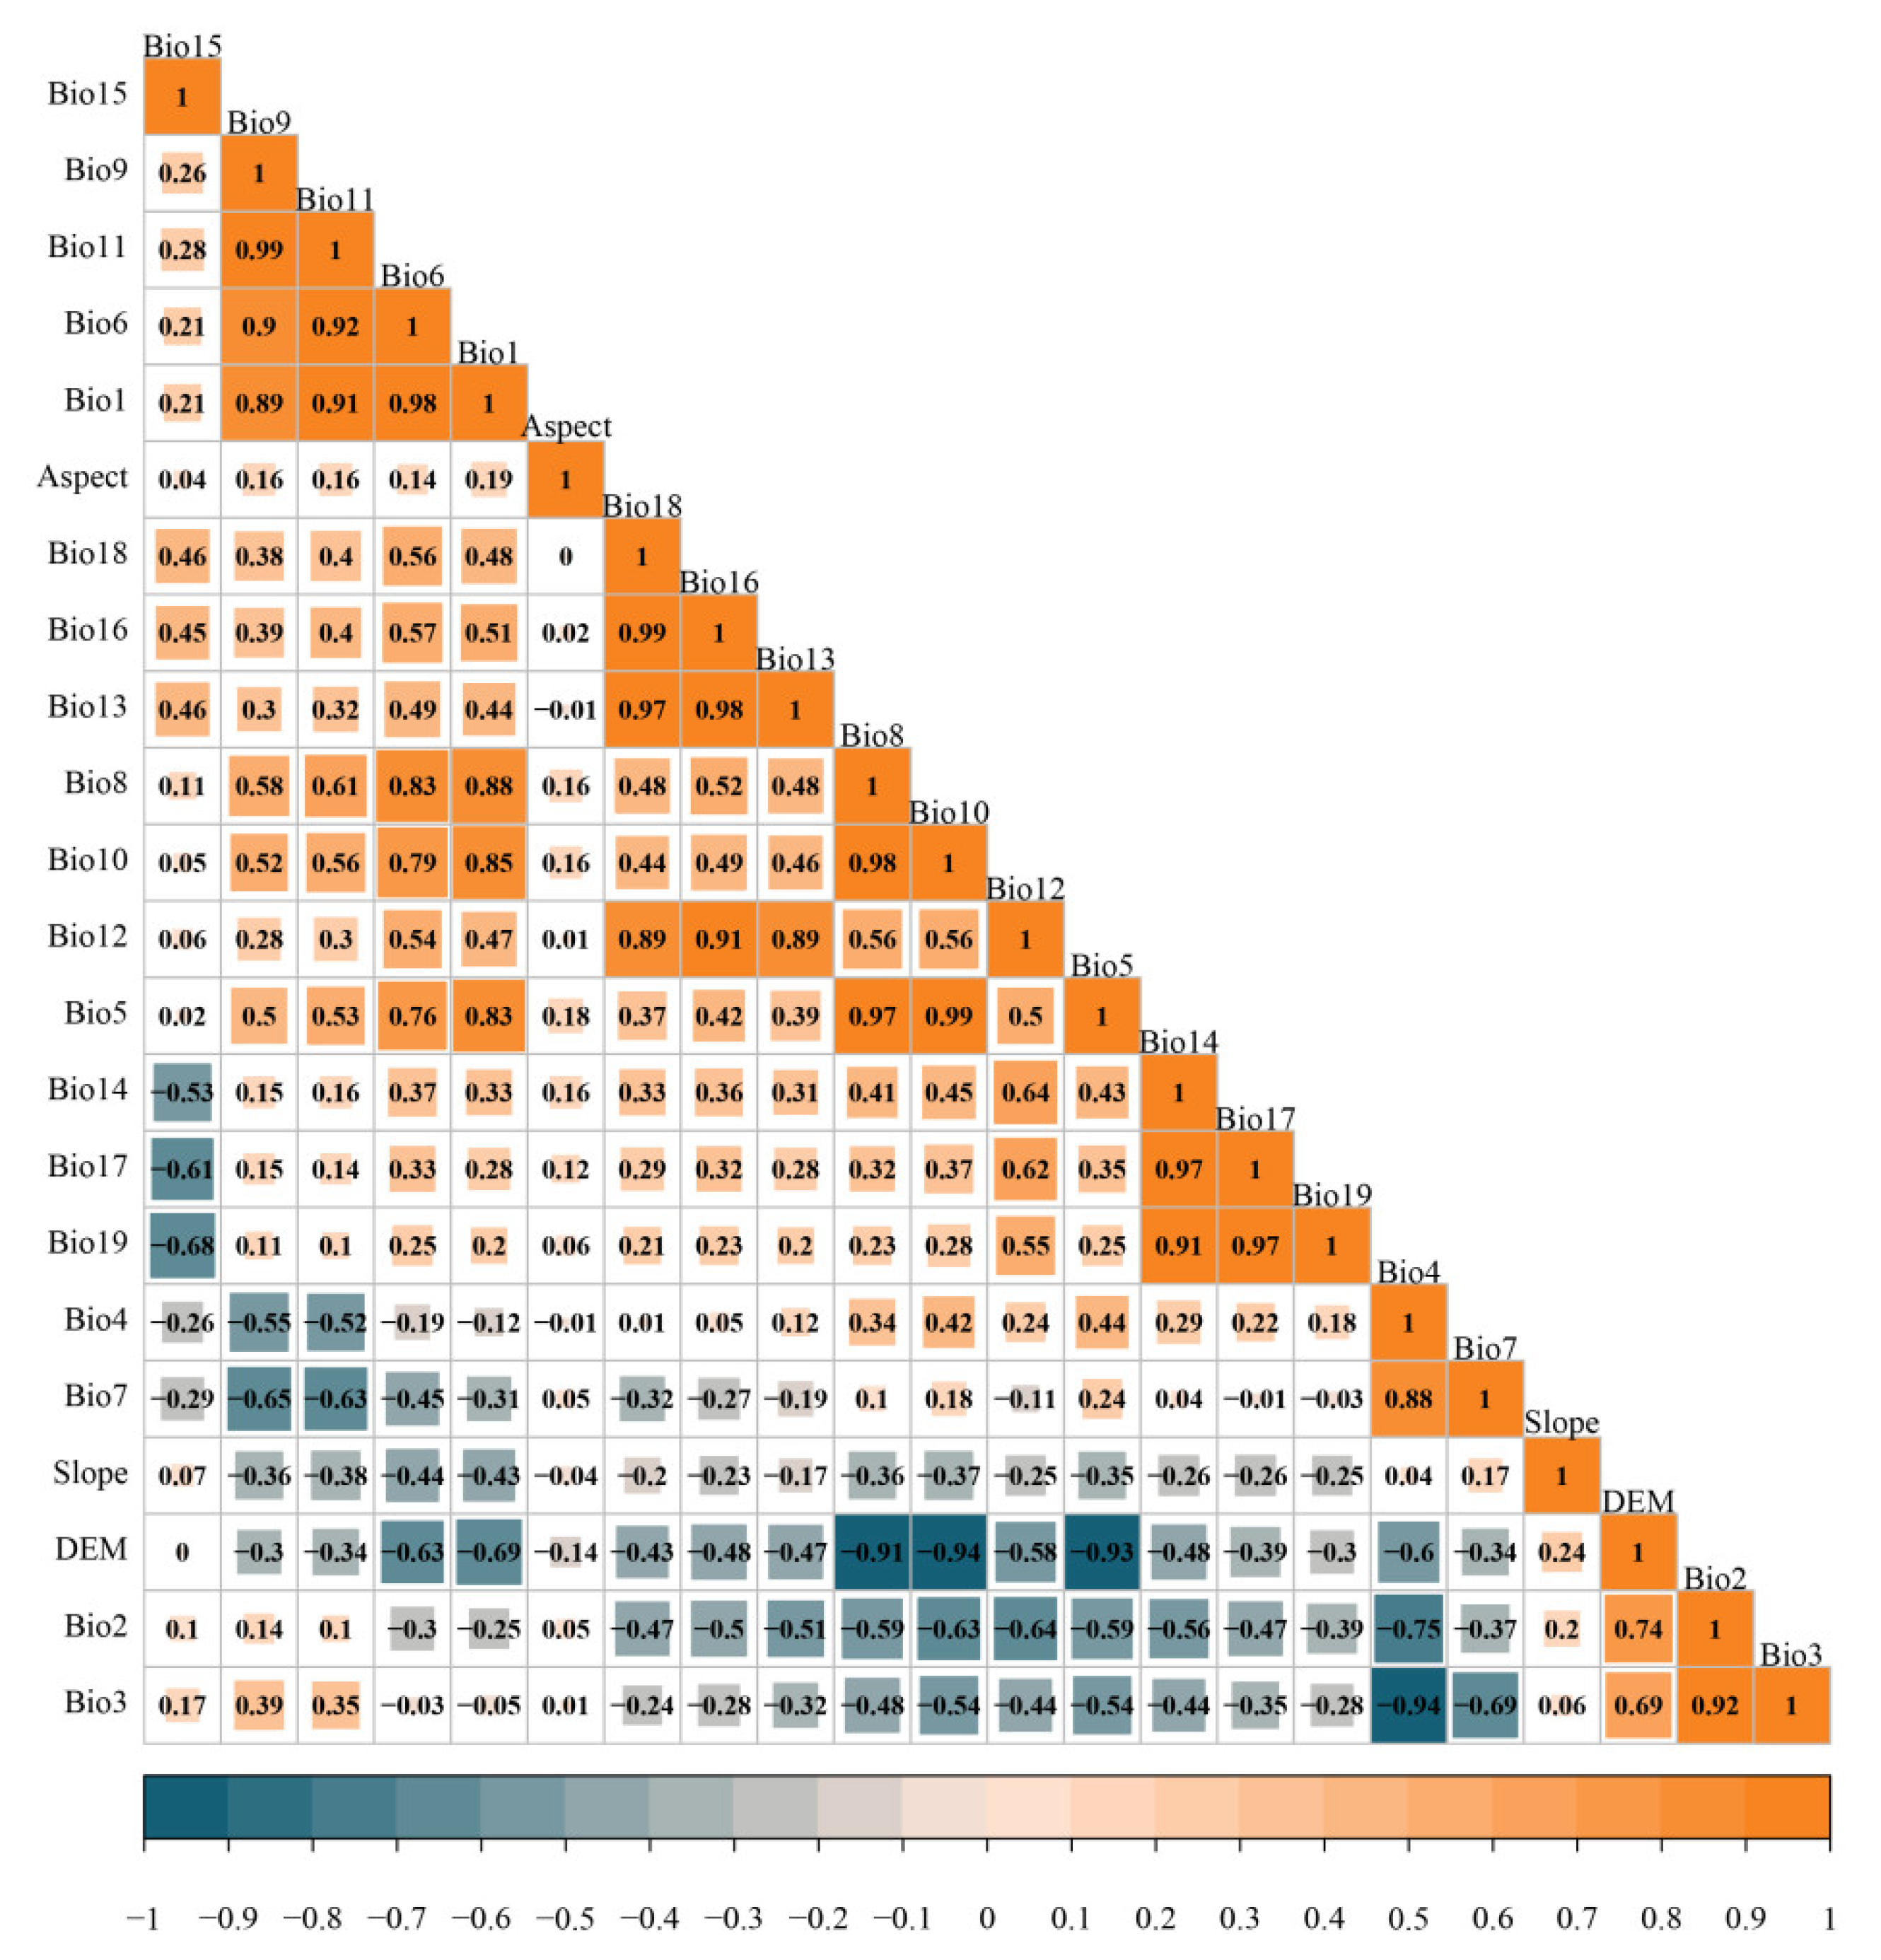
2.4. Environmental Variable Screening

The multicollinearity between environmental variables can lead to overfitting of the model [29], which affects the evaluation of simulation results. Therefore, it was necessary to carry out a correlation analysis on 22 environmental variables, to remove the environmental variables with a contribution rate of 0 and retain the one with the higher contribution rate among two variables with a correlation coefficient greater than 0.80. The Extract Values to Point tool of ArcGIS v10.3 software was used to extract the environmental variable values for each distribution point, and the “corrplot” package of R v4.0.4 software was used to perform Pearson correlation analysis (Figure 2). Finally, the following 10 environmental variables were selected to build the MaxEnt model: isothermal (Bio3), temperature seasonality (Bio4), minimum temperature of the coldest month (Bio6), mean temperature of the warmest quarter (Bio10), annual precipitation (Bio12), precipitation seasonality (Bio15), precipitation of the coldest quarter (Bio19), DEM, slope, and aspect.

2.5. Model Accuracy Evaluation

The prediction accuracy of the model was evaluated using the receiver operating characteristic curve (ROC) and the AUC value (area under the ROC curve) as the evaluation index. The evaluation criteria for AUC values were as follows: 0.50~0.60 for invalid prediction, 0.60~0.70 for poor prediction, 0.70~0.80 for average prediction, 0.80~0.90 for good prediction, and 0.90~1.00 for excellent prediction [30].

2.6. Division of Suitable Habitats

The Reclass tool in ArcGIS v10.3 was used to reclassify the output of the MaxEnt v3.4.4 software. The natural-breaks classification method (Jenks) was used to classify S. delavayi into four levels [31]: highly suitable habitat (0.49~0.96), moderately suitable habitat (0.27~0.49), poorly suitable habitat (0.08~0.27), and unsuitable habitat (0~0.08). The changes in the nationally suitable habitats under future climatic conditions and the centroid shifts of the highly suitable habitats of S. delavayi were analyzed by inputting the folder containing current and future binary SDMs (species distribution models) to SDMtoolbox v2.4 tool [32].

3. Results

3.1. MaxEnt Model Accuracy

Based on the MaxEnt model, the potentially suitable habitats of S. delavayi were predicted, and the ROC curve verified the accuracy of the simulated distribution. The average AUC of the prediction model for the suitable habitat for S. delavayi under the current climate was 0.959 (Figure S1), which indicated that the model’s prediction effect was excellent and that the prediction results had high accuracy and reliability.

3.2. Screening for Dominant Environmental Factors

The annual precipitation (Bio12) made the highest percentage contribution to the prediction model, with a percentage contribution of 32.00%. This was followed by the minimum temperature of the coldest month (Bio6), temperature seasonality (Bio4), and precipitation of the coldest quarter (Bio19), which were 27.30%, 12.20%, and 10.40%, respectively. The percentage contributions of DEM, isothermality (Bio3), and slope were also relatively high, at 9.80%, 4.30%, and 2.70%, respectively. The replacement importance of temperature seasonality (Bio4) and the minimum temperature of the coldest month (Bio6) were 46.10% and 36.20%, respectively; these values were significantly higher than those of other environmental variables and played an important role in model prediction by comparison of the replacement importance of environmental variables (Table 2).
The results of the variable-importance jackknife test showed that when an environmental variable was used alone, annual precipitation (Bio12) had considerable gain on model training, with a gain value of 1.41, followed by temperature seasonality (Bio4), min temperature of the coldest month (Bio6), and precipitation of the coldest quarter (Bio19). The gain values were 1.34, 1.26, and 1.10, respectively; the gain values of other environmental variables were relatively low and all less than 0.70 (Figure S2). When ignoring a single variable, the most obvious reduction in model gain was for the slope, which indicated that the slope had more effective information than other environmental variables, followed by temperature seasonality (Bio4), altitude (DEM), minimum temperature of the coldest month (Bio6), precipitation of the coldest quarter (Bio19), and annual precipitation (Bio12). Combining the contribution rates and replacement importance of environmental variables indicated that annual precipitation (Bio12), minimum temperature of the coldest month (Bio6), temperature seasonality (Bio4), and precipitation of the coldest quarter (Bio19) were the dominant environmental variables that affected the distribution of S. delavayi.

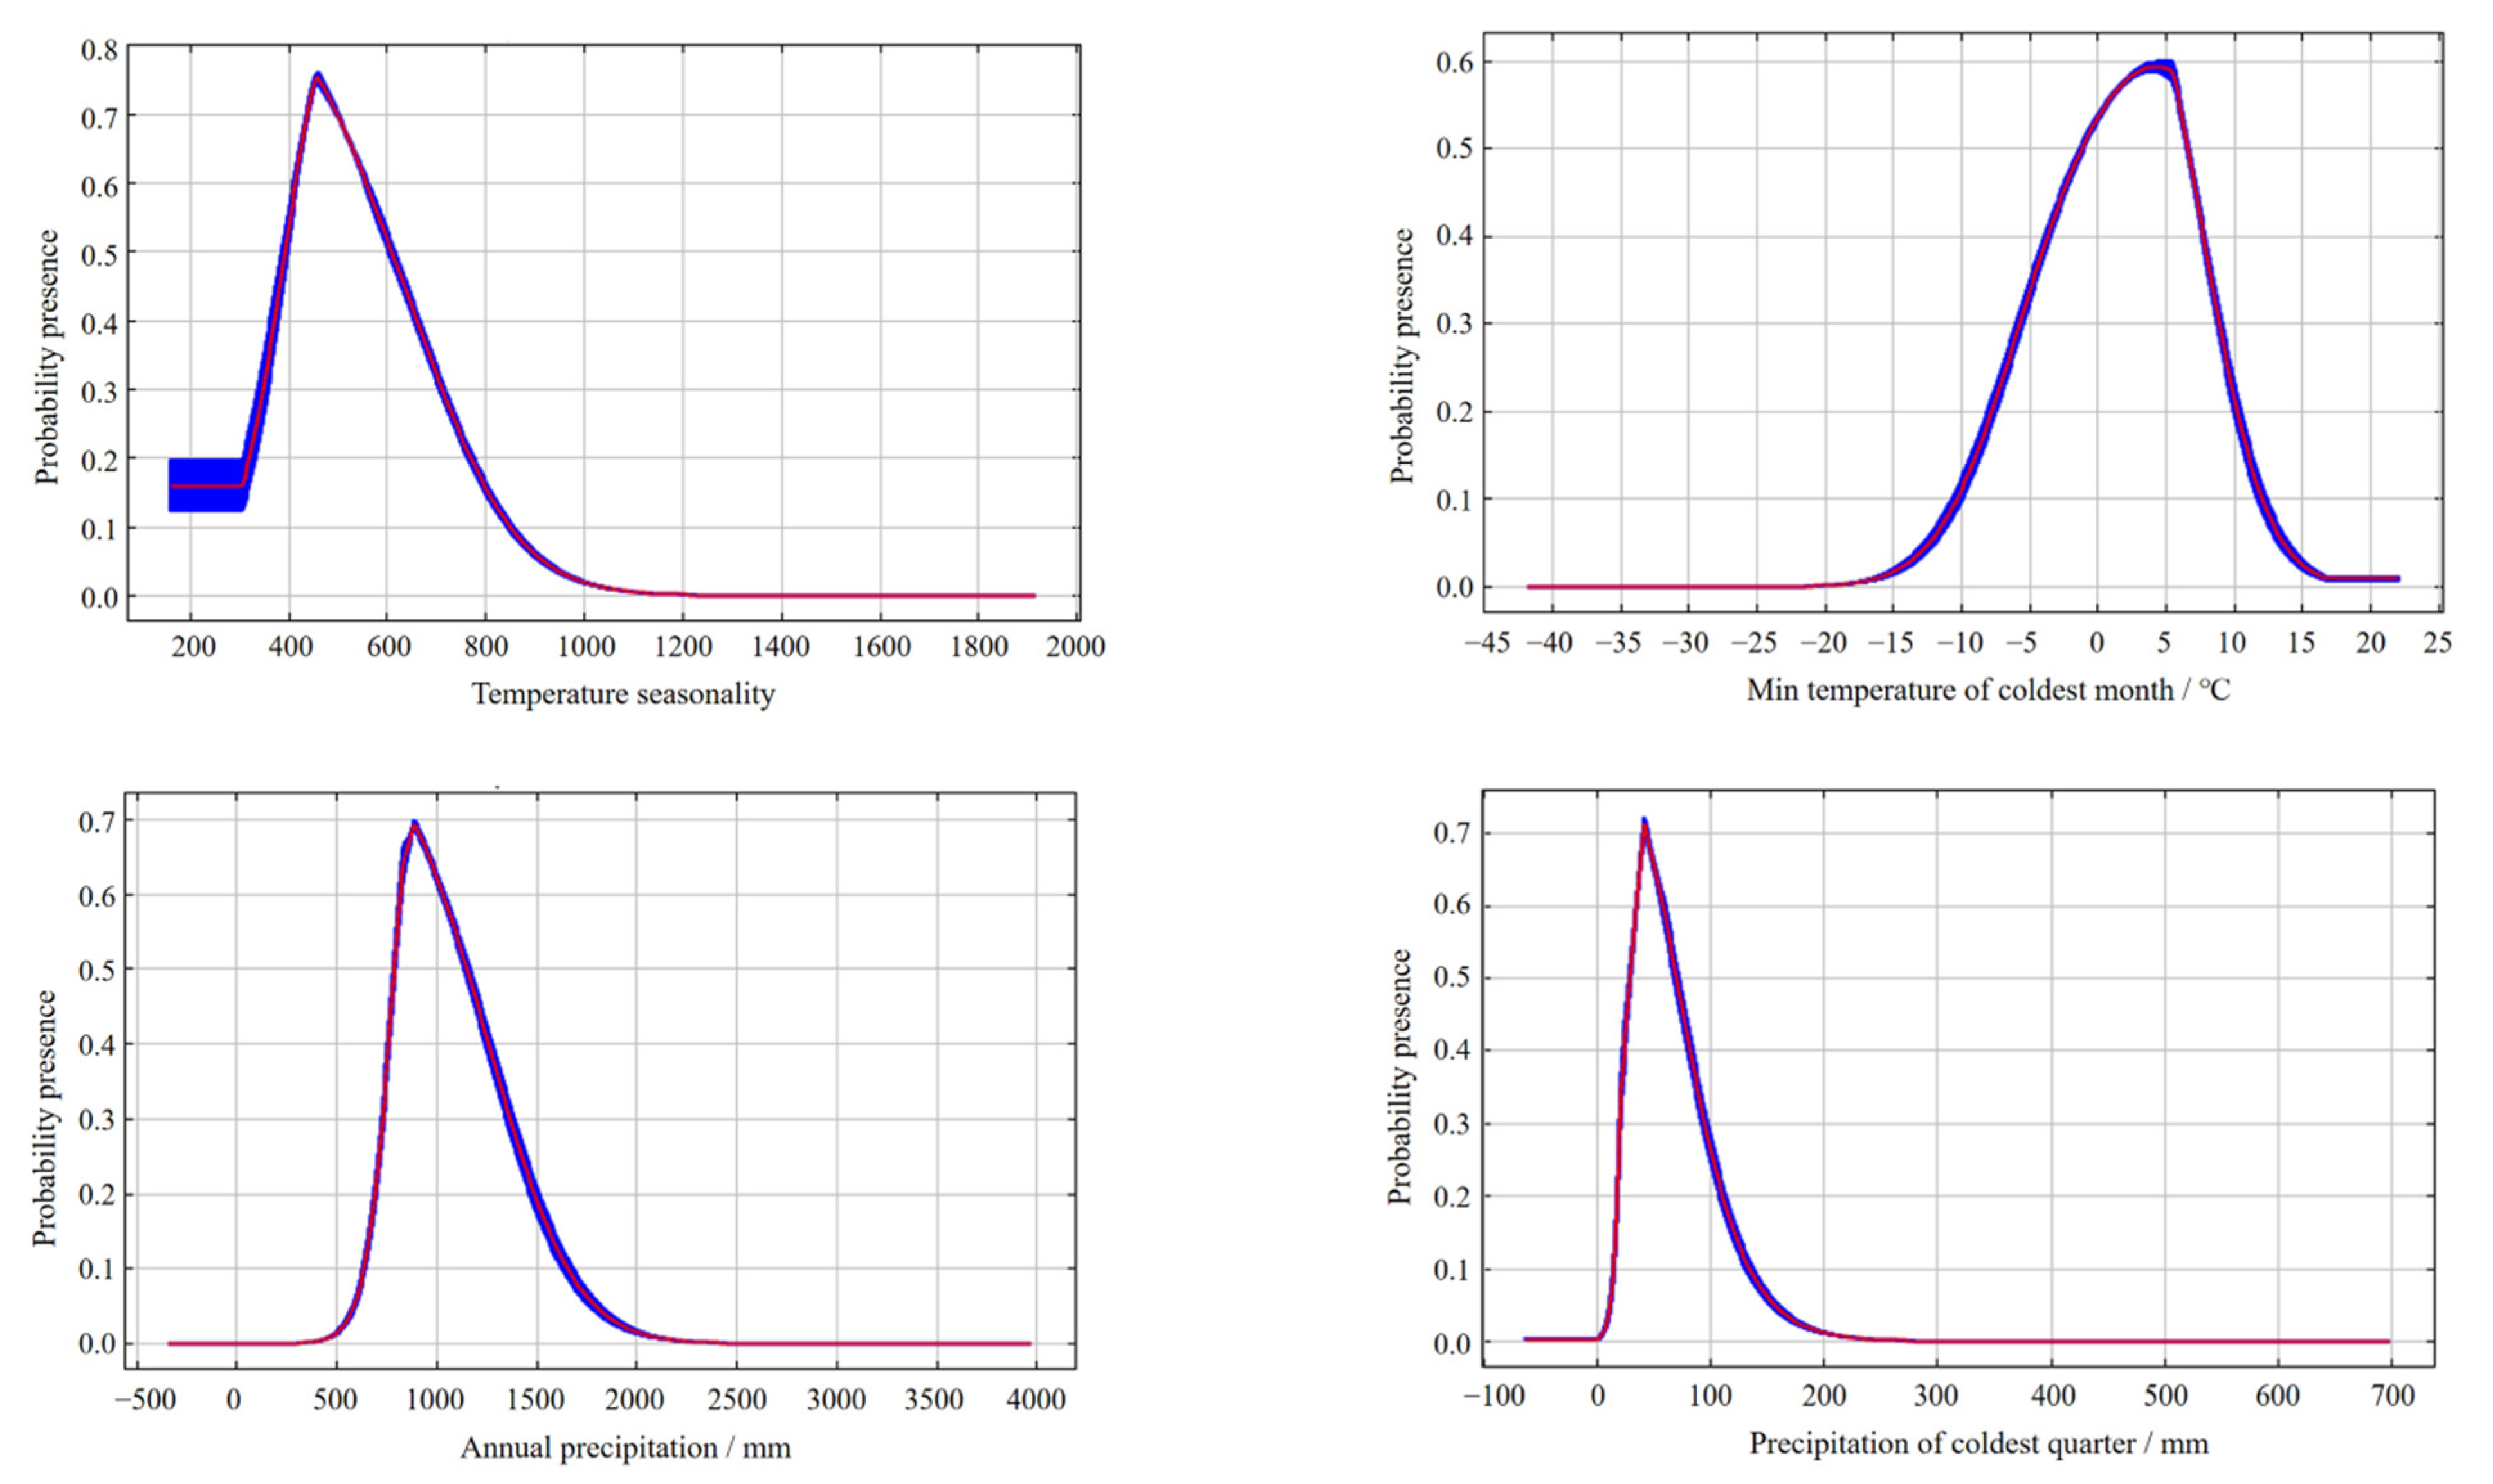
3.3. Relationship between Distribution Probability and Dominant Environmental Factors

The model’s response curves represented the influence trends of each environmental variable on the model prediction [33]; the above four dominant environmental variables were selected for specific analysis. The dominant environmental-factor threshold ranges that determined the suitability for the survival of S. delavayi for which the probability of occurrence was greater than 0.50 were as follows: the annual precipitation (Bio12) threshold range was 792.70~1147.04 mm, with a peak value of 887.76 mm; the minimum temperature of the coldest month (Bio6) threshold range was −1.10~6.57 °C, with a peak value of 4.14 °C; the temperature seasonality (Bio4) threshold range was 394.97~605.86, with a peak value of 458.23; and the precipitation of the coldest quarter (Bio19) threshold range was 29.46~69.09 mm, with a peak value of 41.66 mm (Figure 3).

3.4. Distribution of Suitable Habitats for S. delavayi in China under the Current Climate

Under the current climate, the highly suitable habitats for S. delavayi were mainly concentrated in two regions. One region included Chuxiong, Kunming, and Qujing Cities of Yunnan Province, Panzhihua and Liangshan of Sichuan Province, and the other region included Mianyang, Chengdu, Deyang, Ziyang, and Suining Cities of Sichuan Province. The moderately suitable and poorly suitable habitats were spread in the eastern and southwestern areas of the highly suitable habitats; there were also poorly suitable habitats in the southeast of Fujian Province and the west of Taiwan Province (Figure 4).
The total area of suitable habitats for S. delavayi in China was 1,321,308.07 km2, of which the areas of highly, moderately, and poorly suitable habitats were 308,340.31 km2, 438,976.99 km2, and 573,990.77 km2, accounting for 23.34%, 33.22%, and 43.44%, respectively. Yunnan Province had the largest area (364,909.91 km2) of suitable habitats in China, followed by Sichuan Province (279,604.22 km2); these two highly suitable habitats accounted for 48.55% and 36.61% of China, respectively. The areas of suitable habitats in Guizhou, Tibet, Shaanxi, Guangxi, Hubei Province, and Chongqing City were also relatively large, accounting for 5.12%~12.51% of China; the areas of suitable habitats in other provinces and cities accounted for less than 3.00% of China (Table 3).

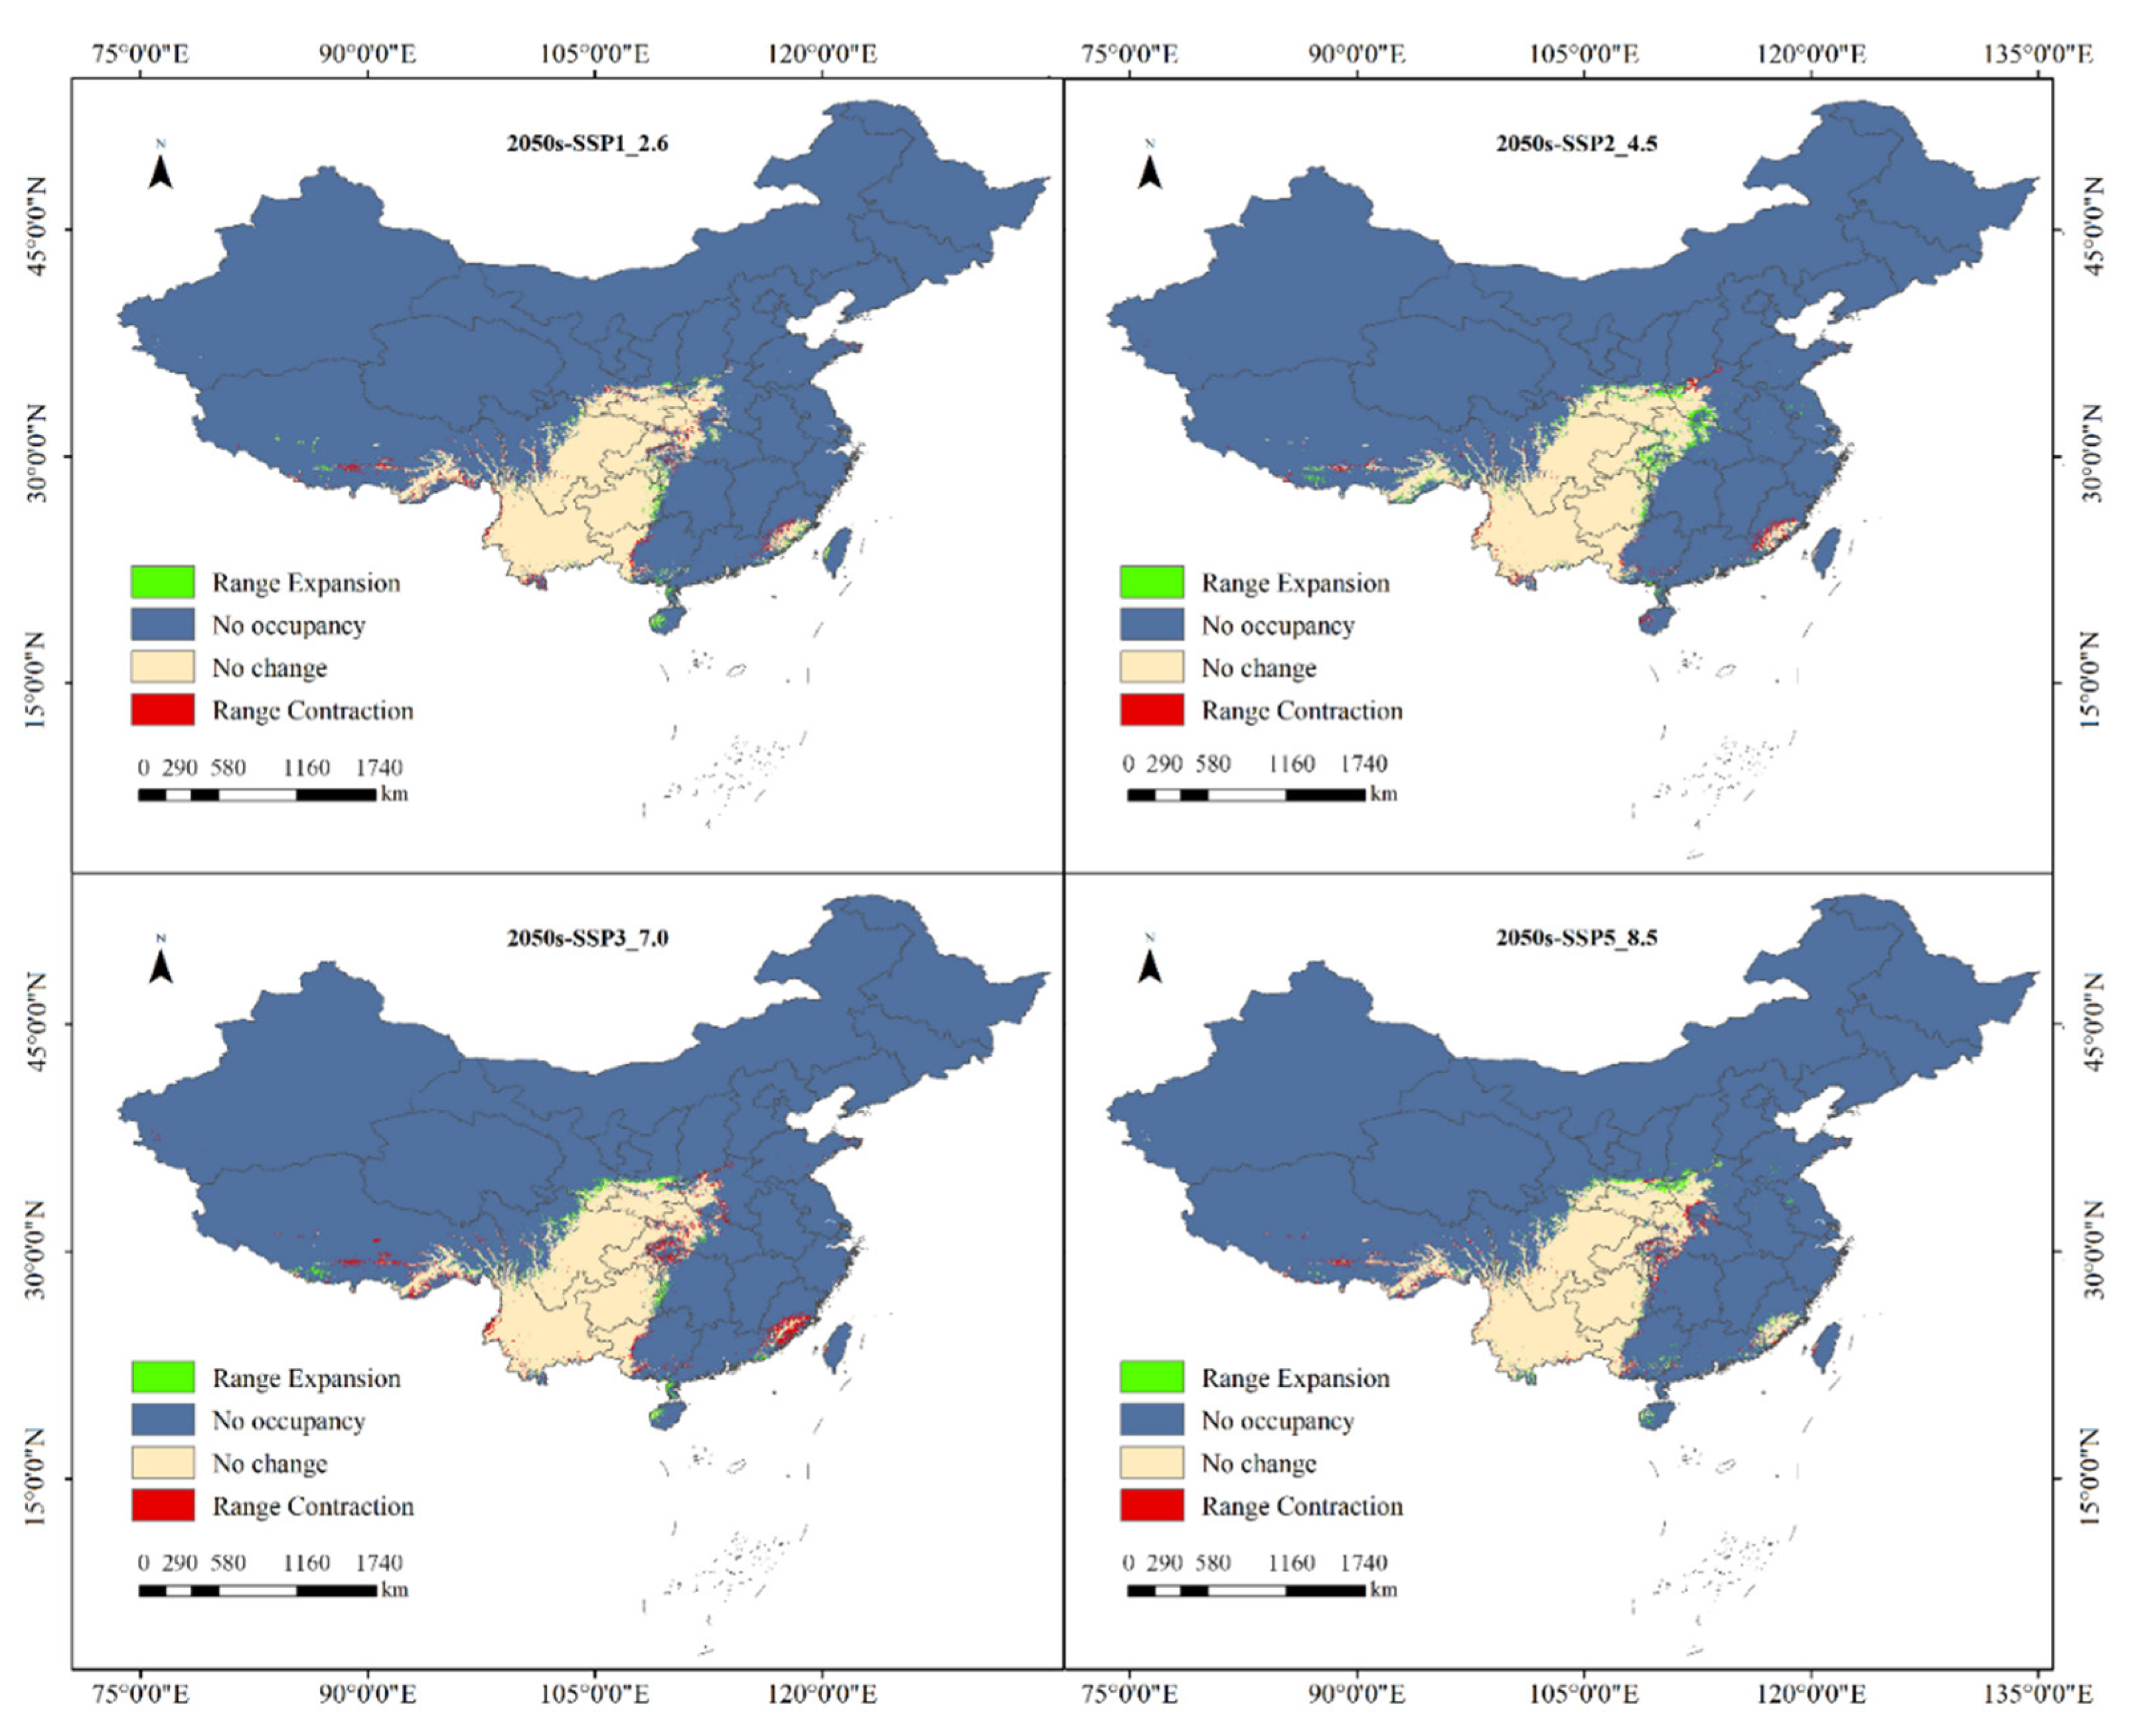
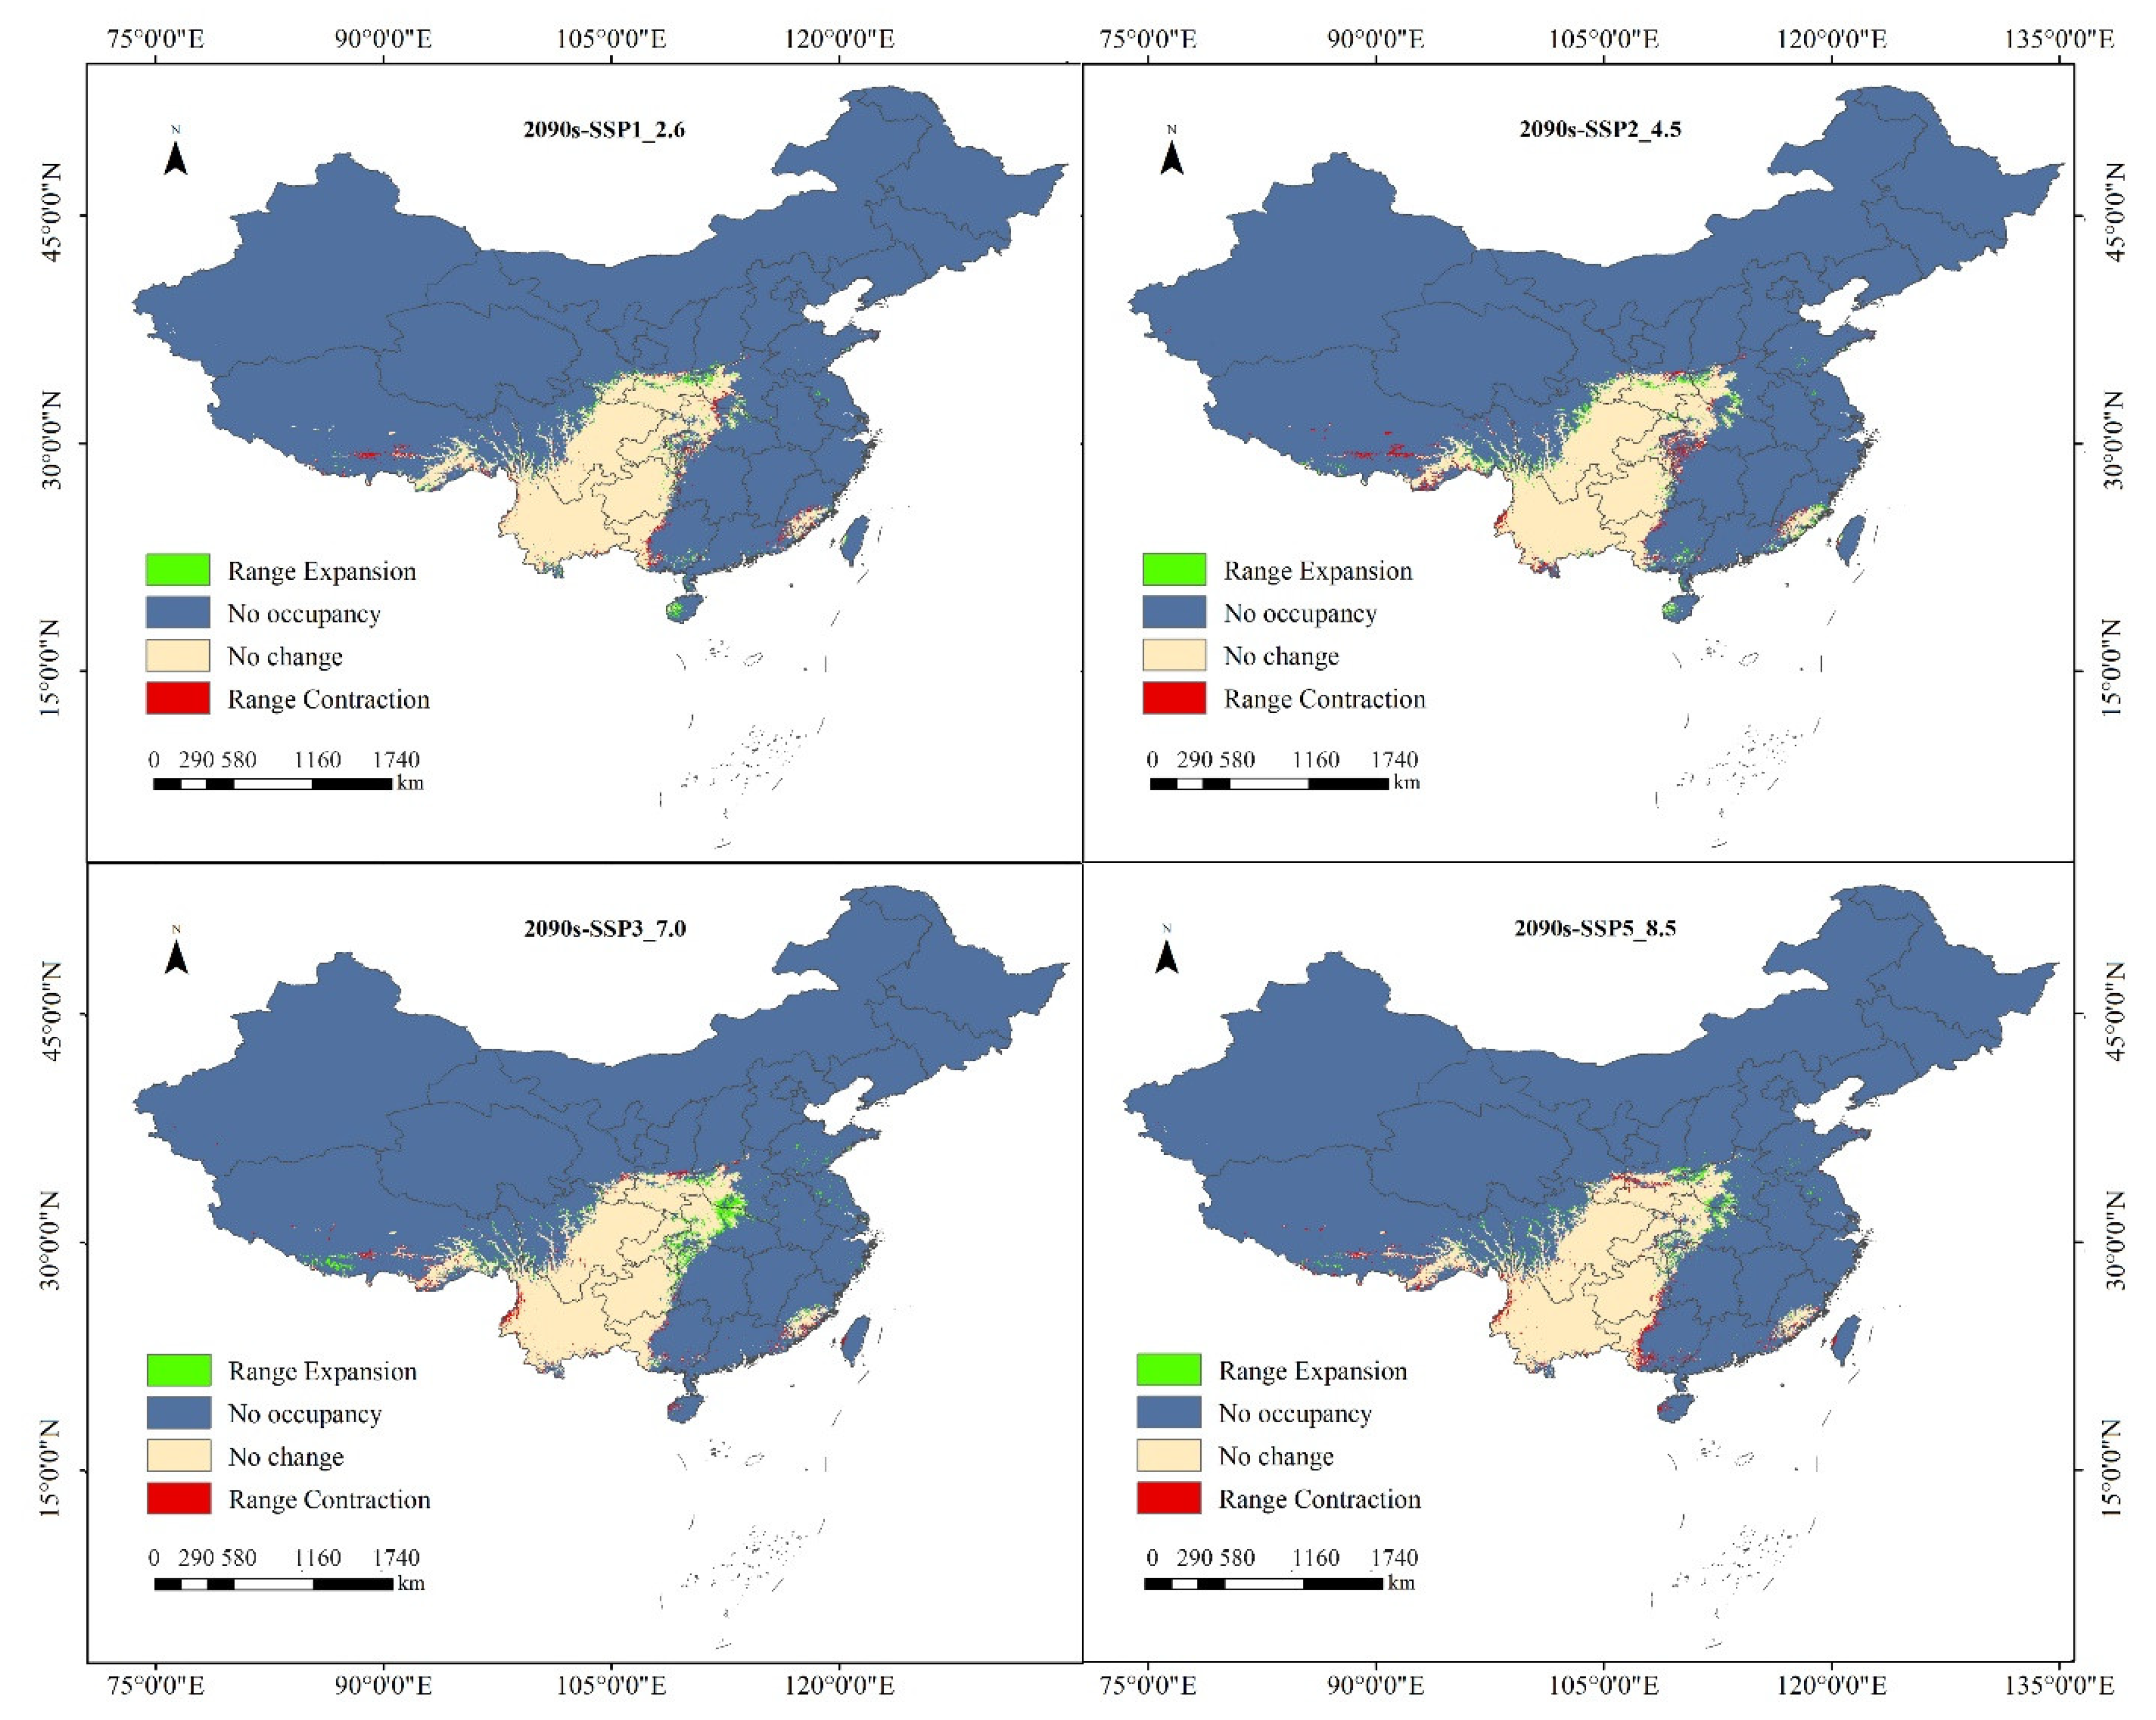
3.5. Changes in the Suitable Habitats of S. delavayi under Future Climate Scenarios

Under the four climate scenarios from the present to the 2050s, the area of all suitable habitats increased only in the SSP2 scenario (1.89%), while the other scenarios showed decreasing trends, among which the SSP3 scenario showed the most considerable reduction (−3.97%) and the SSP5 scenario the smallest reduction (−0.87%). The area of highly suitable habitats was reduced to varying degrees; the most evident reduction (−12.80%) occurred in the SSP5 scenario. The area of moderately suitable habitats was reduced only in the SSP3 scenario (−0.73%) and showed an increasing trend in other scenarios, among which the SSP2 scenario showed the largest increase (10.30%). The area of poorly suitable habitats increased only in the SSP2 scenario (0.60%), while other scenarios showed decreasing trends, among which the SSP1 scenario presented the most considerable reduction (−5.44%) (Table 4).
Under the SSP1 scenario, the suitable habitats for S. delavayi both expanded and shrank. They shrank at the junction of Hubei Province and Chongqing City, the junction of Hechi and Chongzuo Cities in Guangxi, near Longyan City in Fujian Province, Xishuangbanna in Yunnan Province, and southeastern Tibet. They expanded at the junction of Hunan and Guizhou Provinces. In Zhanjiang City in Guangdong Province, the southeastern coastal regions of Fujian Province, the west of Hainan Province, western Taiwan Province, and other regions, suitable habitats also expanded. Under the SSP2 scenario, the suitable habitats expanded in large areas, including Nanyang City in Henan Province, Xiangyang and Jingmen Cities in Hubei Province, near Enshi in Hubei Province, Sanmenxia City in Henan Province, and northern Shangluo City in Shaanxi Province. They shrank in northern Luoyang City in Henan Province, western Hainan Province, Longyan City in Fujian Province, Meizhou City in Guangdong Province, etc. The changes in suitable habitats under the SSP3 scenario were similar to those under the SSP1 scenario, while the suitable habitats in the southeastern coastal regions of Fujian Province, the vicinity of Enshi in Hubei Province, and Henan Province were greatly reduced. The suitable habitats in Weinan City in Shaanxi Province, Tianshui and Longnan Cities in Gansu Province, and western Sichuan Province were significantly expanded. Under the SSP5 scenario, the northern border regions of the suitable habitat area expanded on a large scale, while the area of suitable habitats decreased in Luoyang City in Henan Province, Xiangyang City in Hubei Province, Enshi in Hubei Province, western Hunan Province, and Shigatse City in Tibet, and sporadic changes occurred in other regions (Figure 5).
Under the four climate scenarios from the present to the 2090s, all suitable habitats only increased in the SSP3 scenario (2.57%), and the other three scenarios showed decreasing trends, among which the smallest reduction occurred in the SSP1 scenario (−0.11%), and the most evident reduction occurred in the SSP5 scenario (−1.87%). The area of highly suitable habitats also showed a decreasing trend, with the most considerable decrease in the SSP5 scenario (−18.78%). The areas of moderately suitable habitats all showed increasing trends, among which the largest increase was under the SSP3 scenario (10.54%). The area of poorly suitable habitats showed a decreasing trend (Table 4).
Under the SSP1 scenario, the areas of suitable habitats of Nanyang City in Henan Province, Xiangyang City in Hubei Province, northwestern Hunan Province, Hechi and Chongzuo Cities in Guangxi, Meizhou City in Guangdong Province, southern Fujian Province, eastern Shigatse City in Tibet, and other regions showed decreasing trends; Luoyang and Sanmenxia Cities in Henan Province, northern Shangluo City in Shaanxi Province, and western Hainan Province showed increasing trends. Under the SSP2 scenario, the areas of suitable habitats in the three regions of Hunan Province, Hubei Province, and Chongqing City, Xishuangbanna and Dehong in Yunnan Province, and Shigatse City, Lhasa City, and Shannan City in Tibet were greatly reduced; the areas in the western part of Henan Province, southern Gansu Province, central Sichuan Province, and eastern Tibet expanded sporadically. Under the SSP3 scenario, almost all of the suitablehabitats in Taiwan and Hainan Provinces were lost, and the suitable habitats in western Yunnan Province and around Weinan City in Shaanxi Province were greatly reduced. The suitable habitats of the surrounding regions of Nanyang City in Henan Province and Xiangyang City in Hubei Province and the junction of Hubei Province, Hunan Province, and Chongqing City expanded over a large area. Under the SSP5 scenario, the areas of suitable habitats in Taiwan, Hainan Province, Qiandongnan in Guizhou Province, Hechi and Chongzuo Cities in Guangxi, and western Yunnan Province were greatly reduced; the western and eastern regions of Tibet expanded in a small area based on the original suitable habitats (Figure 6).

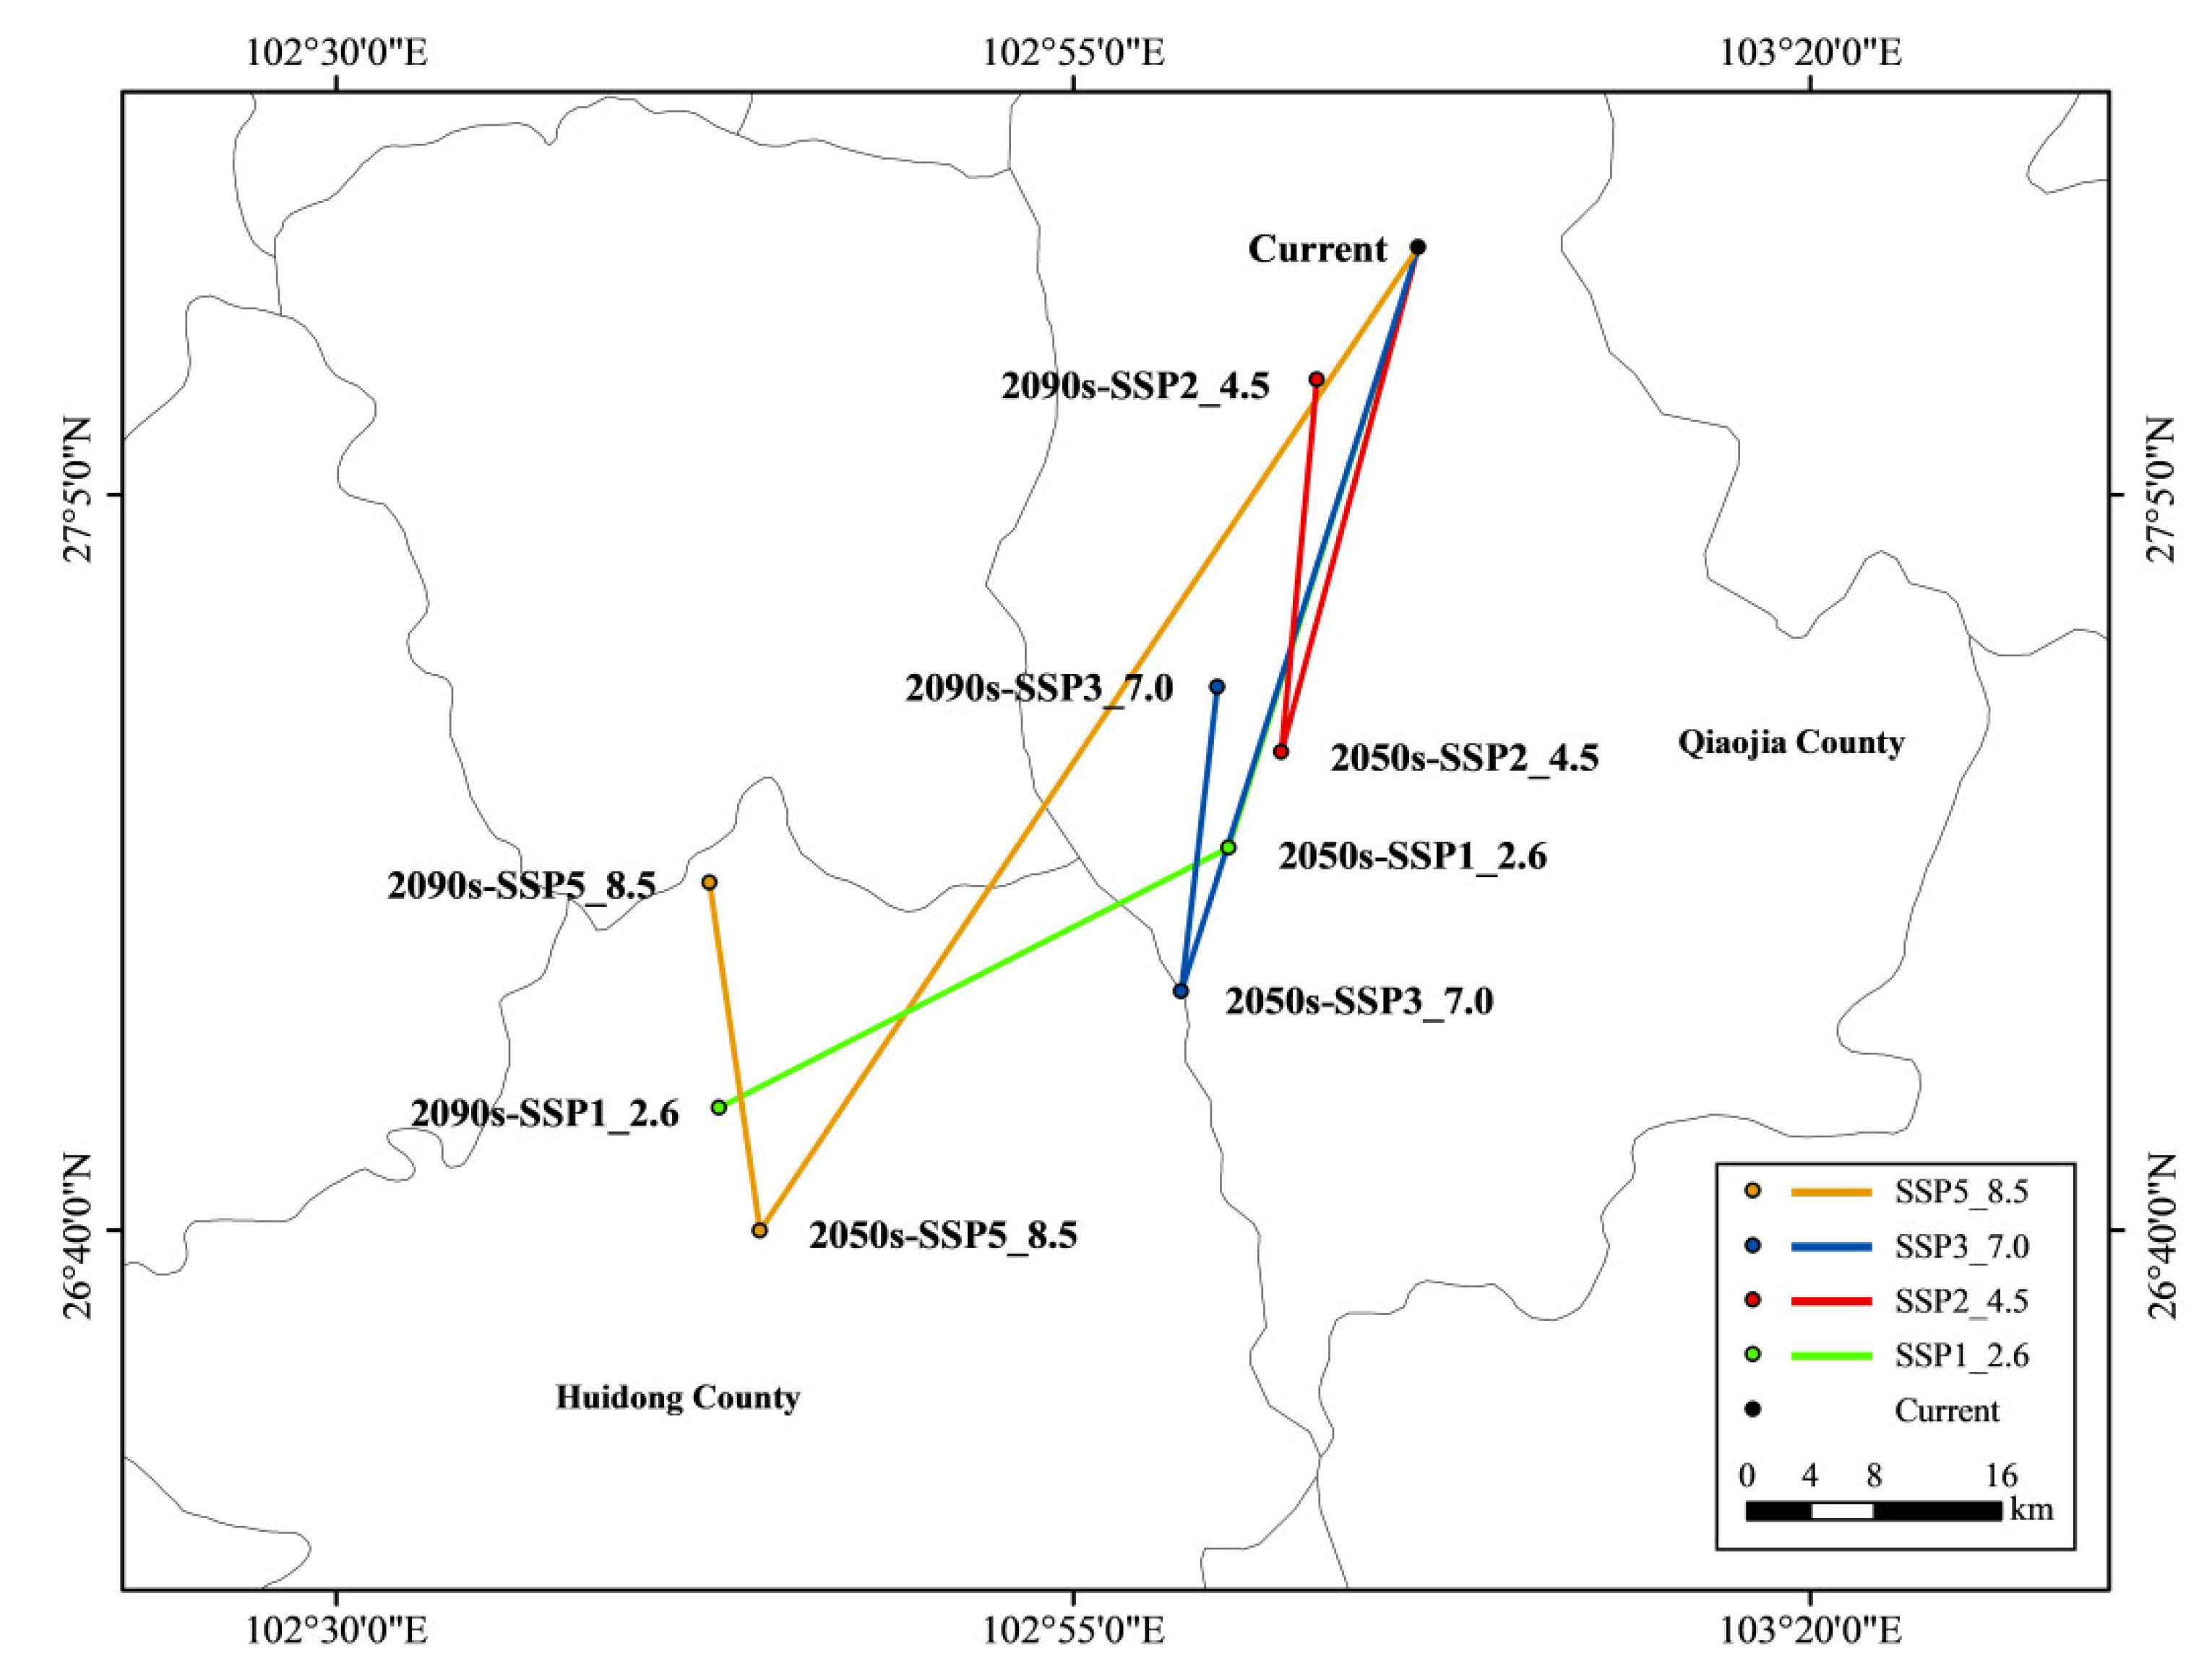
3.6. Shift in the Centroids of Highly Suitable Habitats under Four Future Climate Scenarios

Under the current climate, the centroid of highly suitable habitats for S. delavayi is located in Qiaojia County in Yunnan Province (103.112° E, 27.224° N). Under four climate scenarios in the future, the centroids of the highly suitable habitats will shift to different degrees, but the shift locations are all located in Yunnan Province. Under the SSP1 scenario, the centroid will shift to 103.004° E, 26.883° N by the 2050s, where the shift distance is 39.37 km, then the centroid will shift to Huidong County (102.716° E, 26.736° N) by the 2090s, where the shift distance is 32.87 km. Under the SSP2 scenario, the centroid will shift to 103.034° E, 26.938° N by the 2050s, where the shift distance is 32.77 km, then the centroid will shift to 103.055° E, 27.149° N by the 2090s, where the shift distance is 23.60 km. Under the SSP3 scenario, the centroid will shift to 102.978° E, 26.802° N by the 2050s, where the shift distance is 48.82 km, then the centroid will shift to 102.998° E, 26.974° N by the 2090s, with the shortest shift distance (19.34 km). Under the SSP5 scenario, the centroid will shift to Huidong County (102.739° E, 26.666° N) by the 2050s, with the longest shift distance (72.13 km), then the centroid will shift to 102.711° E, 26.864° N by the 2090s, with a shift distance of 22.14 km (Figure 7).

4. Discussion

4.1. Dominant Environmental Factors Affecting the Distribution of S. delavayi

Among the 10 environmental factors involved in the construction of the MaxEnt model, the total contribution rate related to precipitation was 42.70%, the total contribution rate related to temperature was 44.00%, and the contribution rate related to terrain was 13.30%, indicating that precipitation and temperature were the main factors affecting the distribution of S. delavayi. From the jackknife test and the analysis of the single response curves of the dominant environmental factors, it could be seen that annual precipitation (Bio12) was the most important factor affecting the distribution of S. delavayi, with a suitable growth range of 792.70~1147.04 mm, followed by the minimum temperature of the coldest month (Bio6, −1.10~6.57 °C), temperature seasonality (Bio4, 394.97~605.86), and precipitation of the coldest quarter (Bio19, 29.46~69.09 mm). Currently, S. delavayi is mainly distributed in Southwest China, which has warm winters, dry and wet seasons, and annual precipitation of 800.00~1000.00 mm. The dominant environmental factors affecting the distribution of S. delavayi from our results were consistent with the local climate characteristics. Liu et al. [24], based on the MaxEnt model of the zoning and ecological characteristics of S. delavayi, showed that the precipitation of the warmest quarter (Bio18) was the dominant environmental factor affecting the distribution of S. delavayi, with a contribution rate as high as 37.9%. In our research results, the correlation coefficient between the precipitation of the warmest season (Bio18) and the annual precipitation (Bio12) was greater than 0.80, but the Bio18 contribution rate was only 0.10 when the model was initially constructed. The reason for the difference in the above results may be that a smaller species distribution sample size (38) was selected when building the model. It was confirmed that the sampling method had a significant impact on the prediction accuracy of species distribution model, and the prediction ability was poor when the sample size was small. The prediction accuracy increased nonlinearly with the increase of sample size until it became stable [34].

4.2. Suitable Habitats for S. delavayi under the Current Climate

Under the current climate, the total area of suitable habitats for S. delavayi in China is 13,213,008.07 km2, among which the highly suitable habitats are mainly concentrated in Yunnan and Sichuan Provinces; hence, these two regions are more suitable for the development and utilization of S. delavayi genetic resources. Research shows that a species has a high probability of being distributed in highly suitable habitats and belongs to the core regions of germplasm resource distribution, which may have rich genetic diversity [35]. Therefore, we could focus on investigation, resource collection, and protection work in these regions. The simulation results of Liu et al. [24] are basically consistent with our results, suggesting that the simulated area of the suitable habitat is only 789,900.00 km2; this discrepancy may have been due to differences in the distributions of the selected samples. Relevant studies have shown that sample range influences a model’s accuracy and that the training data should cover the entire environmental range where the species may appear to the greatest extent possible when applying the MaxEnt model to simulate and predict the suitable area [36]. In addition, Baise City in Guangxi, western Guizhou Province, western Chongqing City, Hanzhong and Ankang Cities in Shaanxi Province, Longnan City in Gansu Province, Linzhi City in Tibet, and other regions also had distributions of highly and moderately suitable habitats for S. delavayi, where the introduction and cultivation of S. delavayi or the remote conservation of genetic resources can be implemented. In order to improve the probability of successful introduction and cultivation of S. delavayi, it may be considered to select those areas with similar habitats and tree community structure compared with the original area. There were also large areas of poorly suitable habitats in western Hubei Province, western Henan Province, southeastern Fujian Province, and other urban regions in southern Shaanxi Province where the cultivation of S. delavayi resources can be appropriately carried out according to the actual local conditions.

4.3. Changes in the Suitable Habitats of S. delavayi under Future Climate Scenarios

From the present to the 2050s, the area of suitable habitats for S. delavayi varied from −3.97% to 1.89%; it showed an expansion trend only under the SSP2 scenario, and the reduced area was relatively large under the SSP3 scenario. From the current period to the 2090s, the area of suitable habitats for S. delavayi varied by −1.87~2.57% and showed an expansion trend only under the SSP3 scenario. Under future climate change, the edges of the suitable habitat for S. delavayi changed irregularly, and there was a northward expansion trend, but the area change was small. The suitable habitats of Chongzuo and Hechi Cities in Guangxi, southern Fujian Province, Dehong in Yunnan Province, Enshi in Hubei Province, and Tibet were greatly affected by climate change in the future scenarios; they were reduced. Careful consideration should be given to the introduction, cultivation, and other efforts to promote the existence of S. delavayi in the above regions. Rescue and protection measures should be taken for the existing S. delavayi resources in their areas to avoid the loss of specific germplasm resources. Recently, scholars, domestically and internationally, have researched the changes in potentially suitable habitats for different tree species or types of vegetation in the future. The trend is to migrate to high latitudes and altitudes as the current area gradually shrinks [5]. Li et al. [6] also came to a similar conclusion using the MaxEnt model to predict future changes in the suitable habitats of Sapindus mukorossi. Our results showed that the suitable habitat for S. delavayi also tends to migrate to high latitudes and shrink in area under future scenarios, but the performance was not evident. Cai et al. [20] analyzed the variation in economic and yield traits of S. delavayi and found that the phenotypic traits of the species were negatively correlated with latitude and longitude. In addition, both the annual precipitation and average temperature showed downward trends with increasing latitude in China. The results for the dominant environmental factors affecting the distribution of S. delavayi screened in our study were consistent with the above phenomenon, and these factors may be the main ones restricting the northward expansion of the suitable habitats of S. delavayi.

5. Conclusions

By combining the survey data and specimen distribution information for the wild population of S. delavayi with 22 environmental variables, we constructed a MaxEnt model to simulate the distribution of suitable habitats under the current climate and predict changes in suitable habitats in the future. The results showed that, under the current climate, the highly suitable habitats of S. delavayi are mainly concentrated in Yunnan and Sichuan Provinces, though other regions, such as Guizhou Province, Chongqing City, and Guangxi and Shaanxi Provinces also contain suitable habitats. Annual precipitation (Bio12) was the main environmental factor affecting the distribution of S. delavayi, followed by the minimum temperature of the coldest month (Bio6), temperature seasonality (Bio4), and precipitation of the coldest quarter (Bio19). Under future climate change scenarios, the edges of the suitable habitat for S. delavayi will undergo unstable changes, mainly due to habitat area reduction, but the range will not change much. Our results provide an important scientific basis for the conservation of genetic resources, the introduction and cultivation, and the development and utilization of S. delavayi in China.

Supplementary Materials

The following supporting information can be downloaded at: https://www.mdpi.com/article/10.3390/f13101611/s1, Figure S1: ROC results predicted by the MaxEnt model; Figure S2: Results for the environmental variables according to the jackknife test.

Author Contributions

Conceptualization, Y.L. and W.S.; Data curation, Y.L., W.S., S.H., Y.Z., H.F. and J.J.; Formal analysis, W.S.; Investigation, W.S.; Methodology, Y.L.; Software, Y.L.; Validation, W.S., S.H. and J.J.; Writing—original draft preparation, Y.L. and W.S.; Writing—review and editing, Y.L. and W.S. All authors have read and agreed to the published version of the manuscript.

Funding

This work was supported by the National Science and Technology Basic Resources Survey Program of China (grant number 2019FY100803_02) and the Zhejiang Science and Technology Major Program on Agricultural New Variety Breeding (grant number 2021C02070-3).

Data Availability Statement

The data sets generated and/or analyzed during the current study are available in the Global Biodiversity Information Database (GBIF; https://www.gbif.org, accessed on 7 July 2021), the National Specimen Information Infrastructure (http://www.nsii.org.cn), the Chinese Virtual Herbarium (https://www.cvh.ac.cn/, accessed on 6 July 2021), and the World Climate Database (WorldClim v2.1, https://www.worldclim.org/, accessed on 7 July 2021).

Conflicts of Interest

The authors declare no conflict of interest.

References

  1. Crimmins, S.M.; Dobrowski, S.Z.; Mynsberge, A.R. Evaluating ensemble forecasts of plant species distributions under climate change. Ecol. Model 2013, 266, 126–130. [Google Scholar] [CrossRef]
  2. Kumar, P. Assessment of impact of climate change on Rhododendrons in Sikkim Himalayas using Maxent modelling: Limitations and challenges. Biodivers. Conserv. 2012, 21, 1251–1266. [Google Scholar] [CrossRef]
  3. Korell, L.; Auge, H.; Chase, J.M.; Harpole, S.; Knight, T.M. We need more realistic climate change experiments for understanding ecosystems of the future. Glob. Chang. Biol. 2022, 26, 325–327. [Google Scholar] [CrossRef] [Green Version]
  4. Parmesan, C.; Yohe, G. A globally coherent fingerprint of climate change impacts across natural systems. Nature 2003, 421, 37–42. [Google Scholar] [CrossRef]
  5. Li, Y.; Zhang, X.; Fang, Y. Responses of the distribution pattern of Quercus chenii to climate change following the Last Glacial Maximum. Chin. J. Plant Ecol. 2016, 40, 1164–1178. [Google Scholar]
  6. Li, Y.; Shao, W.; Jiang, J. Predicting the potential global distribution of Sapindus mukorossi under climate change based on MaxEnt modelling. Environ. Sci. Pollut. R. 2022, 29, 21751–21768. [Google Scholar] [CrossRef] [PubMed]
  7. Thuiller, W.; Albert, C.; Araújo, M.B.; Berry, P.M.; Cabeza, M.; Guisan, A.; Hickler, T.; Midgley, G.F.; Paterson, J.; Schurr, F.M.; et al. Predicting global change impacts on plant species’ distributions: Future challenges. Perspect. Plant Ecol. Evol. Syst. 2008, 9, 137–152. [Google Scholar] [CrossRef]
  8. Zhai, X.; Shen, Y.; Zhu, S.; Tu, Z.; Zhang, C.; Li, H. Potential impacts of climate change in future on the geographical distributions of Relic Liriodendron chinense. J. Trop. Subtrop. Bot. 2021, 29, 151–161. [Google Scholar]
  9. Zhang, H.; Zhao, H.; Wang, H. Potential geographical distribution of populus euphratica in China under future climate change scenarios based on Maxent model. Acta Ecol. Sin. 2020, 40, 6552–6563. [Google Scholar]
  10. Yang, J.; Huang, Y.; Jiang, X.; Chen, H.; Liu, M.; Wang, R. Potential geographical distribution of the edangred plant Isoetes under human activities using MaxEnt and GARP. Glob. Ecol. Conserv. 2022, 38, e02186. [Google Scholar] [CrossRef]
  11. Carpenter, G.; Gillison, A.N.; Winter, J. DOMAIN: A flexible modelling procedure for mapping potential distributions of plants and animals. Biodivers. Conserv. 1993, 2, 667–680. [Google Scholar] [CrossRef]
  12. Booth, T.H.; Nix, H.A.; Busby, J.R.; Hutchinson, M.F. BIOCLIM: The first species distribution modelling package, its early applications and relevance to most current MAXENT studies. Divers. Distrib. 2014, 20, 1–9. [Google Scholar]
  13. Rinnan, D.S.; Lawler, J. Climate-niche factor analysis: A spatial approach to quantifying species vulnerability to climate change. Ecography 2019, 42, 1494–1503. [Google Scholar] [CrossRef] [Green Version]
  14. Zhu, G.; Liu, G.; Bu, W.; Gao, Y. Ecological niche modeling and its applications in biodiversity conservation. Biodivers. Sci. 2013, 21, 90–98. [Google Scholar]
  15. Han, M.; Bai, S.; Sun, S.; Yan, J.; Zhang, C.; Zhang, C.; Zhang, J.; You, M.; Li, D.; Yan, X. Simulation of Elymus sibiricus L. distribution in Tibetan Plateau based on MaxEnt model. Acta Agrestia Sin. 2021, 29, 374–382. [Google Scholar]
  16. Fan, X.; Pan, J.; He, S. Prediction of the potential distribution of Rosa roxburghii under the backround of climate change based on MaxEnt model. Acta Bot. Boreali-Occident. Sin. 2021, 41, 159–167. [Google Scholar]
  17. Yang, X.; Kushwaha, S.P.S.; Saran, S.; Xu, J.; Roy, P.S. Maxent modeling for predicting the potential distribution of medicinal plant, Justicia adhatoda L. In Lesser Himalayan foothills. Ecol. Eng. 2013, 51, 83–87. [Google Scholar] [CrossRef]
  18. Wang, X.; Wang, L.; Liu, H.; Wang, D.; Li, Q. The complete chloroplast genome sequence of Sapindus delavayi, a species endemic to China. Mitochondrial DNA 2021, 6, 1906–1908. [Google Scholar] [CrossRef]
  19. Zhou, L. Study on the Chemical Components and the Application of Surface Active Properties of the Total Saponins from Sapindus Delavayi; Yunnan University of Chinese Medicine: Kunming, China, 2017. [Google Scholar]
  20. Cai, G.; Xiong, H.; Jia, W.; Hu, P.; Deng, L.; Wang, L.; Zhou, J.; Liu, H. The variation analysis of the fruit’s economic and yield character of the Sapindus delavay. J. Southwest For. Univ. 2018, 38, 37–45. [Google Scholar]
  21. Sun, C.; Wang, L.; Liu, J.; Zhao, G.; Gao, S.; Xi, B.; Duan, J.; Weng, X.; Jia, L. Genetic structure and biogeographic divergence among Sapindus species: An inter-simple sequence repeat-based study of germplasms in China. Ind. Crops Prod. 2018, 118, 1–10. [Google Scholar] [CrossRef]
  22. Zhou, L.; Xie, W.; Ren, H.; Zhou, B. Extracting process and bioactivity of saponins from Sapindus delavayi pericarp. J. Yunnan Agric. Univ. 2013, 28, 433–437. [Google Scholar]
  23. He, Q. Study on Cutting Propagation Techniques and Mechanism of Sapindus Mukorossi Gaertn. and Sapindus Delavayi (Franch.) Radlk; Beijing Forestry University: Beijing, China, 2018. [Google Scholar]
  24. Liu, J.; Jia, L.; Wang, L.; Sun, C.; Wang, X.; Zheng, Y.; Chen, Z.; Weng, X. Potential distribution and ecological characteristics of genus Sapindus in China based on MaxEnt model. Sci. Silvae Sin. 2021, 57, 1–12. [Google Scholar]
  25. Yang, Q.; Li, R. Predicting the potential suitable habitats of Alsophila spinulosa and their changes. Chin. J. Appl. Ecol. 2021, 32, 538–548. [Google Scholar]
  26. Elith, J.; Leathwick, J.R. Species distribution models: Ecological explanation and prediction across space and time. Annu. Rev. Ecol. Evol. Syst. 2009, 40, 677–697. [Google Scholar] [CrossRef]
  27. Riahi, K.; van Vuuren, D.P.; Kriegler, E.; Edmonds, J.; O Neill, B.C.; Fujimori, S.; Bauer, N.; Calvin, K.; Dellink, R.; Fricko, O.; et al. The Shared Socioeconomic Pathways and their energy, land use, and greenhouse gas emissions implications: An overview. Glob. Environ. Chang. 2017, 42, 153–168. [Google Scholar] [CrossRef] [Green Version]
  28. Qin, A.; Liu, B.; Guo, Q.; Bussmann, R.W.; Ma, F.; Jian, Z.; Xu, G.; Pei, S. Maxent modeling for predicting impacts of climate change on the potential distribution of Thuja sutchuenensis Franch., An extremely endangered conifer from southwestern China. Glob. Ecol. Conserv. 2017, 10, 139–146. [Google Scholar] [CrossRef]
  29. Zhang, M.; Zhou, Z.; Chen, W.; Cannon, C.H.; Raes, N.; Slik, J.W.F. Major declines of woody plant species ranges under climate change in Yunnan, China. Divers. Distrib. 2014, 20, 405–415. [Google Scholar] [CrossRef]
  30. Araujo, M.B.; Pearson, R.G.; Thuiller, W.; Erhard, M. Validation of species-climate impact models under climate change. Glob. Chang. Biol. 2005, 11, 1504–1513. [Google Scholar] [CrossRef] [Green Version]
  31. Guo, X.; Wang, L.; Xu, X.; Tong, L. MaxEnt modeling for predicting potential suitable distribution areas of Styrax odoratissimus. Ecol. Sci. 2020, 39, 119–124. [Google Scholar]
  32. Brown, J.L.; Bennett, J.R.; French, C.M. SDMtoolbox 2.0: The next generation Python-based GIS toolkit for landscape genetic, biogeographic and species distribution model analyses. PeerJ 2017, 5, e4095. [Google Scholar] [CrossRef] [PubMed] [Green Version]
  33. Esfanjani, J.; Ghorbani, A.; Zare Chahouki, M.A. MaxEnt modeling for predicting impacts of environmental factors on the potential distribution of Artemisia aucheri and Bromus tomentellus-Festuca ovina in Iran. Pol. J. Environ. Stud. 2018, 27, 1041–1047. [Google Scholar] [CrossRef]
  34. Chen, X.; Lei, Y.; Zhang, X.; Jia, H. Effects of sample sizes on accuracy and stability of maximum entropy model in predicting species distribution. Sci. Silvae Sin. 2012, 48, 53–59. [Google Scholar]
  35. Wu, Z.; Hou, X.; Ren, W.; Wang, Z.; Chang, C.; Yang, Y.; Yang, Y. Prediction of the potential geographic distribution of Leymus chinensis based on MaxEnt and collection and protection of germplasm. Acta Prataculturae Sin. 2018, 27, 125–135. [Google Scholar]
  36. Ji, Q.; Wang, R.; Huang, Z.; Yuan, J.; Ren, G.; Xiao, W. Effects of sample size and study range on accuracy of MaxEnt in predicting species distribution: A case study of the black-and white snub-nosed monkey. Acta Theriol. Sin. 2019, 39, 126–133. [Google Scholar]
Figure 1. Geographical distribution of S. delavayi in China.
Forests 13 01611 g001
Figure 2. Correlation analysis of environmental variables.
Forests 13 01611 g002
Figure 3. Single response curves of dominant environmental factors.
Forests 13 01611 g003
Figure 4. Distribution of suitable habitats for S. delavayi under the current climate.
Forests 13 01611 g004
Figure 5. Changes in the suitable habitats of S. delavayi under four climate scenarios in the 2050s.
Forests 13 01611 g005
Figure 6. Changes in the suitable habitats of S. delavayi under four climate scenarios in the 2090s.
Forests 13 01611 g006
Figure 7. Shift in the centroids of highly suitable habitats of S. delavayi under four future climate scenarios.
Forests 13 01611 g007
Table 1. Environmental variables related to the distribution of S. delavayi.
Environmental
Variable
DescriptionUnit
Bio1Annual mean temperature°C
Bio2Mean diurnal range (mean of monthly (max temp − min temp))°C
Bio3Isothermality (Bio2/Bio7) (×100)-
Bio4Temperature seasonality (standard deviation ×100)-
Bio5Maximum temperature of the warmest month°C
Bio6Minimum temperature of the coldest month°C
Bio7Temperature annual range (Bio5–Bio6)°C
Bio8Mean temperature of the wettest quarter°C
Bio9Mean temperature of the driest quarter°C
Bio10Mean temperature of the warmest quarter°C
Bio11Mean temperature of the coldest quarter°C
Bio12Annual precipitationmm
Bio13Precipitation of the wettest monthmm
Bio14Precipitation of the driest monthmm
Bio15Precipitation seasonality (coefficient of variation)-
Bio16Precipitation of the wettest quartermm
Bio17Precipitation of the driest quartermm
Bio18Precipitation of the warmest quartermm
Bio19Precipitation of the coldest quartermm
DEM m
Aspect °
Slope %
Table 2. The percentage contributions and permutation importance values for environmental variables.
Environment
Variable
DescriptionPercentage
Contribution (%)
Permutation
Importance (%)
Bio12Annual precipitation32.002.80
Bio6Minimum temperature of the coldest month27.3036.20
Bio4Temperature seasonality (standard deviation × 100)12.2046.10
Bio19Precipitation of the coldest quarter10.404.00
DEMAltitude9.808.10
Bio3Isothermality (Bio2/Bio7) (×100)4.300.10
SlopeSlope2.701.60
AspectAspect0.800.20
Bio15Precipitation seasonality (coefficient of variation)0.300.60
Bio10Mean temperature of the warmest quarter0.200.30
Table 3. Areas of suitable habitats for S. delavayi in China under the current climate.
RegionPoorly Suitable Habitats (km2)Moderately Suitable Habitats (km2)Highly Suitable Habitats (km2)Total Suitable
Habitats (km2)
Yunnan Province89,524.23125,671.04149,714.63364,909.91
Sichuan Province50,363.86116,361.11112,879.25279,604.22
Guizhou Province70,480.5776,941.4317,846.35165,268.34
Tibet Autonomous Region56,477.7223,651.158358.9788,487.84
Shaanxi Province54,914.3629,991.432088.5986,994.38
Guangxi Zhuang Autonomous Region43,715.3822,214.7811,112.0577,042.21
Chongqing City43,758.1329,108.883674.8376,541.84
Hubei Province61,137.476091.44457.5167,686.43
Henan Province38,936.99568.9453.5839,559.51
Gansu Province16,172.668087.332104.5526,364.54
Fujian Province24,606.5158.340.0024,664.85
Hunan Province11,880.5993.080.0011,973.66
Guangdong Province6880.850.000.006880.85
Hainan Province1899.510.000.001899.51
Taiwan Province1451.990.000.001451.99
Shandong Province757.2417.320.00774.56
Shanxi Province720.4052.850.00773.25
Xinjiang Uygur Autonomous Region186.3451.140.00237.48
Hebei Province17.290.0050.0067.29
Jiangsu Province52.950.000.0052.95
Anhui Province36.760.000.0036.76
Zhejiang Province18.970.000.0018.97
Tianjin City0.0016.730.0016.73
Total573,990.77438,976.99308,340.311,321,308.07
Table 4. Areas of suitable habitats for S. delavayi under future climate scenarios.
ScenariosPoorly
Suitable
Habitats (km2)
Changes (%)Moderately
Suitable
Habitats (km2)
Changes (%)Highly
Suitable
Habitats (km2)
Changes (%)Total
Suitable
Habitats (km2)
Changes (%)
Current573,990.770.00438,976.990.00308,340.310.001,321,308.070.00
2050s-SSP1_2.6542,749.17−5.44451,778.062.92290,957.70−5.641,285,484.93−2.71
2050s-SSP2_4.5577,450.340.60484,199.3410.30284,681.78−7.671,346,331.471.89
2050s-SSP3_7.0553,735.12−3.53435,768.19−0.73279,330.22−9.411,268,833.53−3.97
2050s-SSP5_8.5573,032.48−0.17467,883.186.58268,858.77−12.801,309,774.43−0.87
2090s-SSP1_2.6572,195.91−0.31463,432.875.57284,273.81−7.811,319,902.59−0.11
2090s-SSP2_4.5573,944.89−0.01448,762.852.23296,320.56−3.901,319,028.30−0.17
2090s-SSP3_7.0571,968.04−0.35485,250.9610.54298,080.93−3.331,355,299.922.57
2090s-SSP5_8.5563,893.50−1.76482,242.209.86250,422.90−18.781,296,558.61−1.87
Publisher’s Note: MDPI stays neutral with regard to jurisdictional claims in published maps and institutional affiliations.

