Article

Comparative Morphological, Anatomical and Physiological Analyses Explain the Difference of Wounding-Induced Agarwood Formation between Ordinary Agarwood Nongrafted Plants and Five Grafted Qi-Nan Clones (Aquilaria sinensis)

Research Institute of Tropical Forestry, Chinese Academy of Forestry, Guangzhou 510520, China
*
Author to whom correspondence should be addressed.
Forests 2022, 13(10), 1618; https://doi.org/10.3390/f13101618
Submission received: 22 August 2022 / Revised: 24 September 2022 / Accepted: 28 September 2022 / Published: 2 October 2022
(This article belongs to the Section Forest Ecophysiology and Biology)

Abstract

:
Agarwood is the dark resinous heartwood of injured ordinary Aquilaria sinensis (OA). Recently, some new clones of A. sinensis (Qi-Nan) that intensively produce high-quality agarwood were selected and cultivated by grafted clonal seedlings. However, very little is known about their agarwood formation mechanism, and it is unclear whether the current method of distinguishing Qi-Nan from OA by observing its leaf apparent morphology is scientifically reliable. In this study, the differences between OA and Qi-Nan clones in agarwood formation and their correlation with morphological, anatomical and physiological characteristics were investigated in two types of A. sinensis trees. After the mechanical injury, agarwood yield and essential oil content in agarwood of Qi-Nan were significantly higher than that of OA. There was no significant difference in leaf shape parameters between Qi-Nan and OA, but Qi-Nan showed higher specific leaf weight, total leaf chlorophyll, leaf nitrogen content and net photosynthetic rate. A xylem anatomical analysis showed that Qi-Nan had significantly smaller vessel wall thickness, greater ray cell wall thickness and larger interxylary phloem area than OA. Moreover, Qi-Nan had a greater consumption of non-structural carbohydrates than OA. Agarwood yield and oil content in agarwood showed significantly positive correlations with leaf photosynthetic capacity, the wall thickness of xylem ray cell, interxylary phloem area, starch utilization rate of trees, and a significantly negative correlation with the wall thickness of xylem vessel of trees. In brief, Qi-Nan has a stronger photosynthetic basis to supply more carbon sources, a more efficient xylem structural basis for agarwood production and a higher carbon source utilization rate, leading to a higher agarwood yield and oil content. It is not reliable to distinguish Qi-Nan from OA simply by observing leaf apparent morphology.

1. Introduction

Agarwood, the highly valuable aromatic resinous heartwood of Aquilaria trees, has been widely used for incense, caving and medicine purposes and in the perfume industry [1]. However, healthy Aquilaria trees do not produce agarwood unless they have suffered from environmental stress, such as wounding by lightning or wind, and infected by insects or microbials [2]. Conventional methods, such as holing, cutting, and nailing, as well as non-conventional methods, such as chemical reagents and fungal strains, are used to induce agarwood production. At present, wild Aquilaria species have been destructively exploited [3]. This genus is now listed in Appendix II of the Convention on Internal Trade in Endangered Species of Wild Fauna and Flora (CITES, http://checklist.cites.org, accessed on 8 April 2021).
As wild resources are exhausted and protected, a large number of Aquilaria plantations have been established with seed seedlings in China [4]. However, Chinese farmers have suffered great economic losses from Aquilaria plantations because of low yields and poor quality of agarwood produced from the Aquilaria plantations. Recently, some clones of Aquilaria sinensis (Lour.), namely Qi-Nan, have been selected from Aquilaria forests and cultivated with grafting clonal seedlings [5]. Qi-Nan can more easily produce higher quality agarwood compared to trees grown from ordinary A. sinensis (OA) seedlings [5,6]. A lot of attention has been paid to the differences in agarwood composition between Qi-Nan and OA [6,7,8]. Unfortunately, little is known about the differences in the mechanisms of agarwood production between Qi-Nan and OA. In addition, local farmers distinguish Qi-Nan from OA mainly by observing leaf apparent morphology without scientific explanation. Therefore, it is necessary to find an efficient and reliable method to identify Qi-Nan from Aquilaria trees.
Agarwood oil is the secondary metabolism product of Aquilaria trees, which is derived from the carbon sources that trees assimilate through photosynthesis. Efficient photosynthesis can provide more carbon sources to produce agarwood. In addition to environmental factors, plant photosynthesis is also affected by leaf morpho-physiology and xylem tissue structure. For example, studies have shown that leaves with a higher specific leaf weight and chlorophyll content have a higher photosynthetic efficiency [9,10]. Xylem hydraulic tissue determines tree water transport efficiency, which in turn affects photosynthesis and transpiration [11]. In addition, the xylem is the location of the formation and deposition of agarwood oil. Active parenchyma cells in the xylem convert carbohydrates into agarwood oil, and the oil is transported and deposited into vessels and wood fibers to form agarwood [12]. The proportion of active tissues, such as interxylary phloem and wood rays in xylem, could affect the rate and yield of agarwood oil synthesis, and its tissue structure could affect the rate and quantity of oil transport and deposition. Thus, leaf morphology and physiology and xylem tissue structure are the organizational basis for the formation of agarwood, which could affect the time and quantity of agarwood formation by affecting the synthesis, transport and deposition of agarwood oil. Perhaps we can start from the basic study of tissue structure to explain that Qi-Nan can more easily induce the formation of agarwood than OA.
Two types of A. sinensis, OA and Qi-Nan clones, were selected to induce agarwood formation through the physical drilling of trees. Leaf morphology, photosynthetic physiology, xylem anatomical structure and non-structural carbohydrates metabolism were studied in these clones. Moreover, the correlations between these parameters, the agarwood yield of the trees, and oil content in agarwood from the trees were investigated. This study aimed to test: (1) whether there are significant differences in leaf morphology, photosynthetic physiology or xylem anatomical structure between Qi-Nan and OA; (2) whether the current method of distinguishing Qi-Nan from OA by observing the leaf apparent morphology is scientifically reliable; (3) whether Qi-Nan has a more efficient morpho-physiological basis for higher agarwood yield with higher oil content than OA.

2. Materials and Methods

2.1. Plant Materials and Experimental Design

The experiment was conducted in March 2020 at Chunlong Qi-Nan planting base, Mata Town, Maoming City, Guangdong Province, China (longitude 111.35.36 E, latitude 21.68.85 N). The experimental materials were 3-year-old healthy trees from seedlings of ordinary A. sinensis (OA) and trees from grafting clonal seedlings from five Qi-Nan clones, including HG, KC, XG, XY, and ZT. The growth status of OA and Qi-Nan before the experimental laying is shown in Table 1.
This study was conducted using a completely random design with six treatments and fifteen trees per treatment. Five samples were collected per treatment and each bulk sample was collected from three trees. Physical drilling was conducted to induce agarwood formation in each tree, and holes with a diameter of 0.8 mm were made on the stem in a space of 6 cm using a driller. Agarwood yield and its essential oil content were measured 1.5 years after drilling.

2.2. Agarwood Yield and Essential Oil Content

Stems of trees were air-dried and weighed after harvest. Sapwood was removed by a specific agarwood knife and the remaining dark resinous part was kept as agarwood. The agarwood yields were calculated with the weight of agarwood in crude dried stem material (w/w% DW).
Agarwood essential oil was extracted using alcohol supersonic extraction method [13]. In brief, 2.0 g of powdered and dried agarwood samples were immersed in 20 mL of 95% ethanol, shaken in a microwave shaker at 60 °C and 750 W supersonic condition (Elmasonic P300H, Germany) for 60 min, and filtered through a 0.45 μm filter membrane and concentrated by rotary evaporation (Concentrator 5301, Eppendorf, Germany). Essential oil content was calculated as the ratio of oil weight to crude dried material (w/w% DW).

2.3. Determination of Leaf

For each tree, 10 leaves were collected in the middle of the south canopy. The leaf length, leaf width, leaf perimeter, length-width ratio and leaf area were measured using a leaf area meter (Li-3000c, Li-Cor Inc., Lincoln, NE, USA).
Leaves were placed in an oven at 105 °C for 20 min to perform de-enzyming and then dried at 80 °C until the weight remained unchanged, and the average specific leaf weight was calculated by dividing the average single-leaf dry weight by the average single-leaf area [14]. The dried leaves were crushed and passed through a 0.2 mm sieve to determine the contents of nitrogen, phosphorus and potassium [15].
Another 10 full and disease-free leaves were cut from each tree, brought back with dry ice, and stored in a refrigerator at −80 °C for the measurement of chlorophyll contents. The chlorophyll content was measured by acetone method and ultraviolet–visible spectrophotometer (UV-2550) [16].

2.4. Gas Exchange Parameter Measurement

Gas exchange parameters were measured using the portable photosynthetic measurement system (Li-6400 XT, li-cor, Lincoln, NE, USA). On sunny days (9:00–11:00 am) in September 2021, 5 leaves per tree were selected and measured at a light intensity of 1200 μmol m−2 s−1.

2.5. Xylem Structure

The agarwood slices were cut into blocks (1 cm × 1 cm × 1 cm) and preserved by FAA (Concentrations was 5:5:50:40 Formaldehyde, Glacial Acetic Acid, 95% ETOH and distilled Water) [17]. Subsequently, the specimens were sliced into 20 µm sections using an ultra-microtome (Leica EM UC7, Germany). To identify sugars, the sections were stained with I2-KI to detect starch grains, and soluble sugar compounds were detected by staining with periodic acid-Schiff (PAS) reagent, and all sections were observed under a light microscope (Nikon E100, Sendai-shi, Japan) [12]. For each section, five 1 mm2 visual fields were selected in the cross-section to measure vessel density, vessel diameter, vessel wall thickness, vessel area, interxylary phloem area; in the longitudinal section to measure the ray density, ray height, ray width, and ray cell length; and in the radial section to measure the ray cell width, ray cell wall thickness with WinCell software [18].

2.6. Determination of Non-Structural Carbohydrates

Stem samples were collected from the main stem at 2 cm above the holing point of three trees in each treatment and immediately deactivated in a 600 W microwave oven for 90 s, dried at 65 °C to constant weight, ground and passed through a 50-mesh sieve, and stored in refrigerator at 4 °C for determination of non-structural carbohydrates concentrations [6]. The soluble sugar and starch concentrations were determined by a modified phenol–sulfuric acid method [19], and total NSCs concentrations were calculated as the sum of soluble sugar and starch concentrations [20].

2.7. Statistical Analysis

All data were analyzed by SPSS 22.0 for one-way ANOVAs to determine the differences between the six treatment groups. All statistical effects were considered significant at p < 0.05.

3. Results

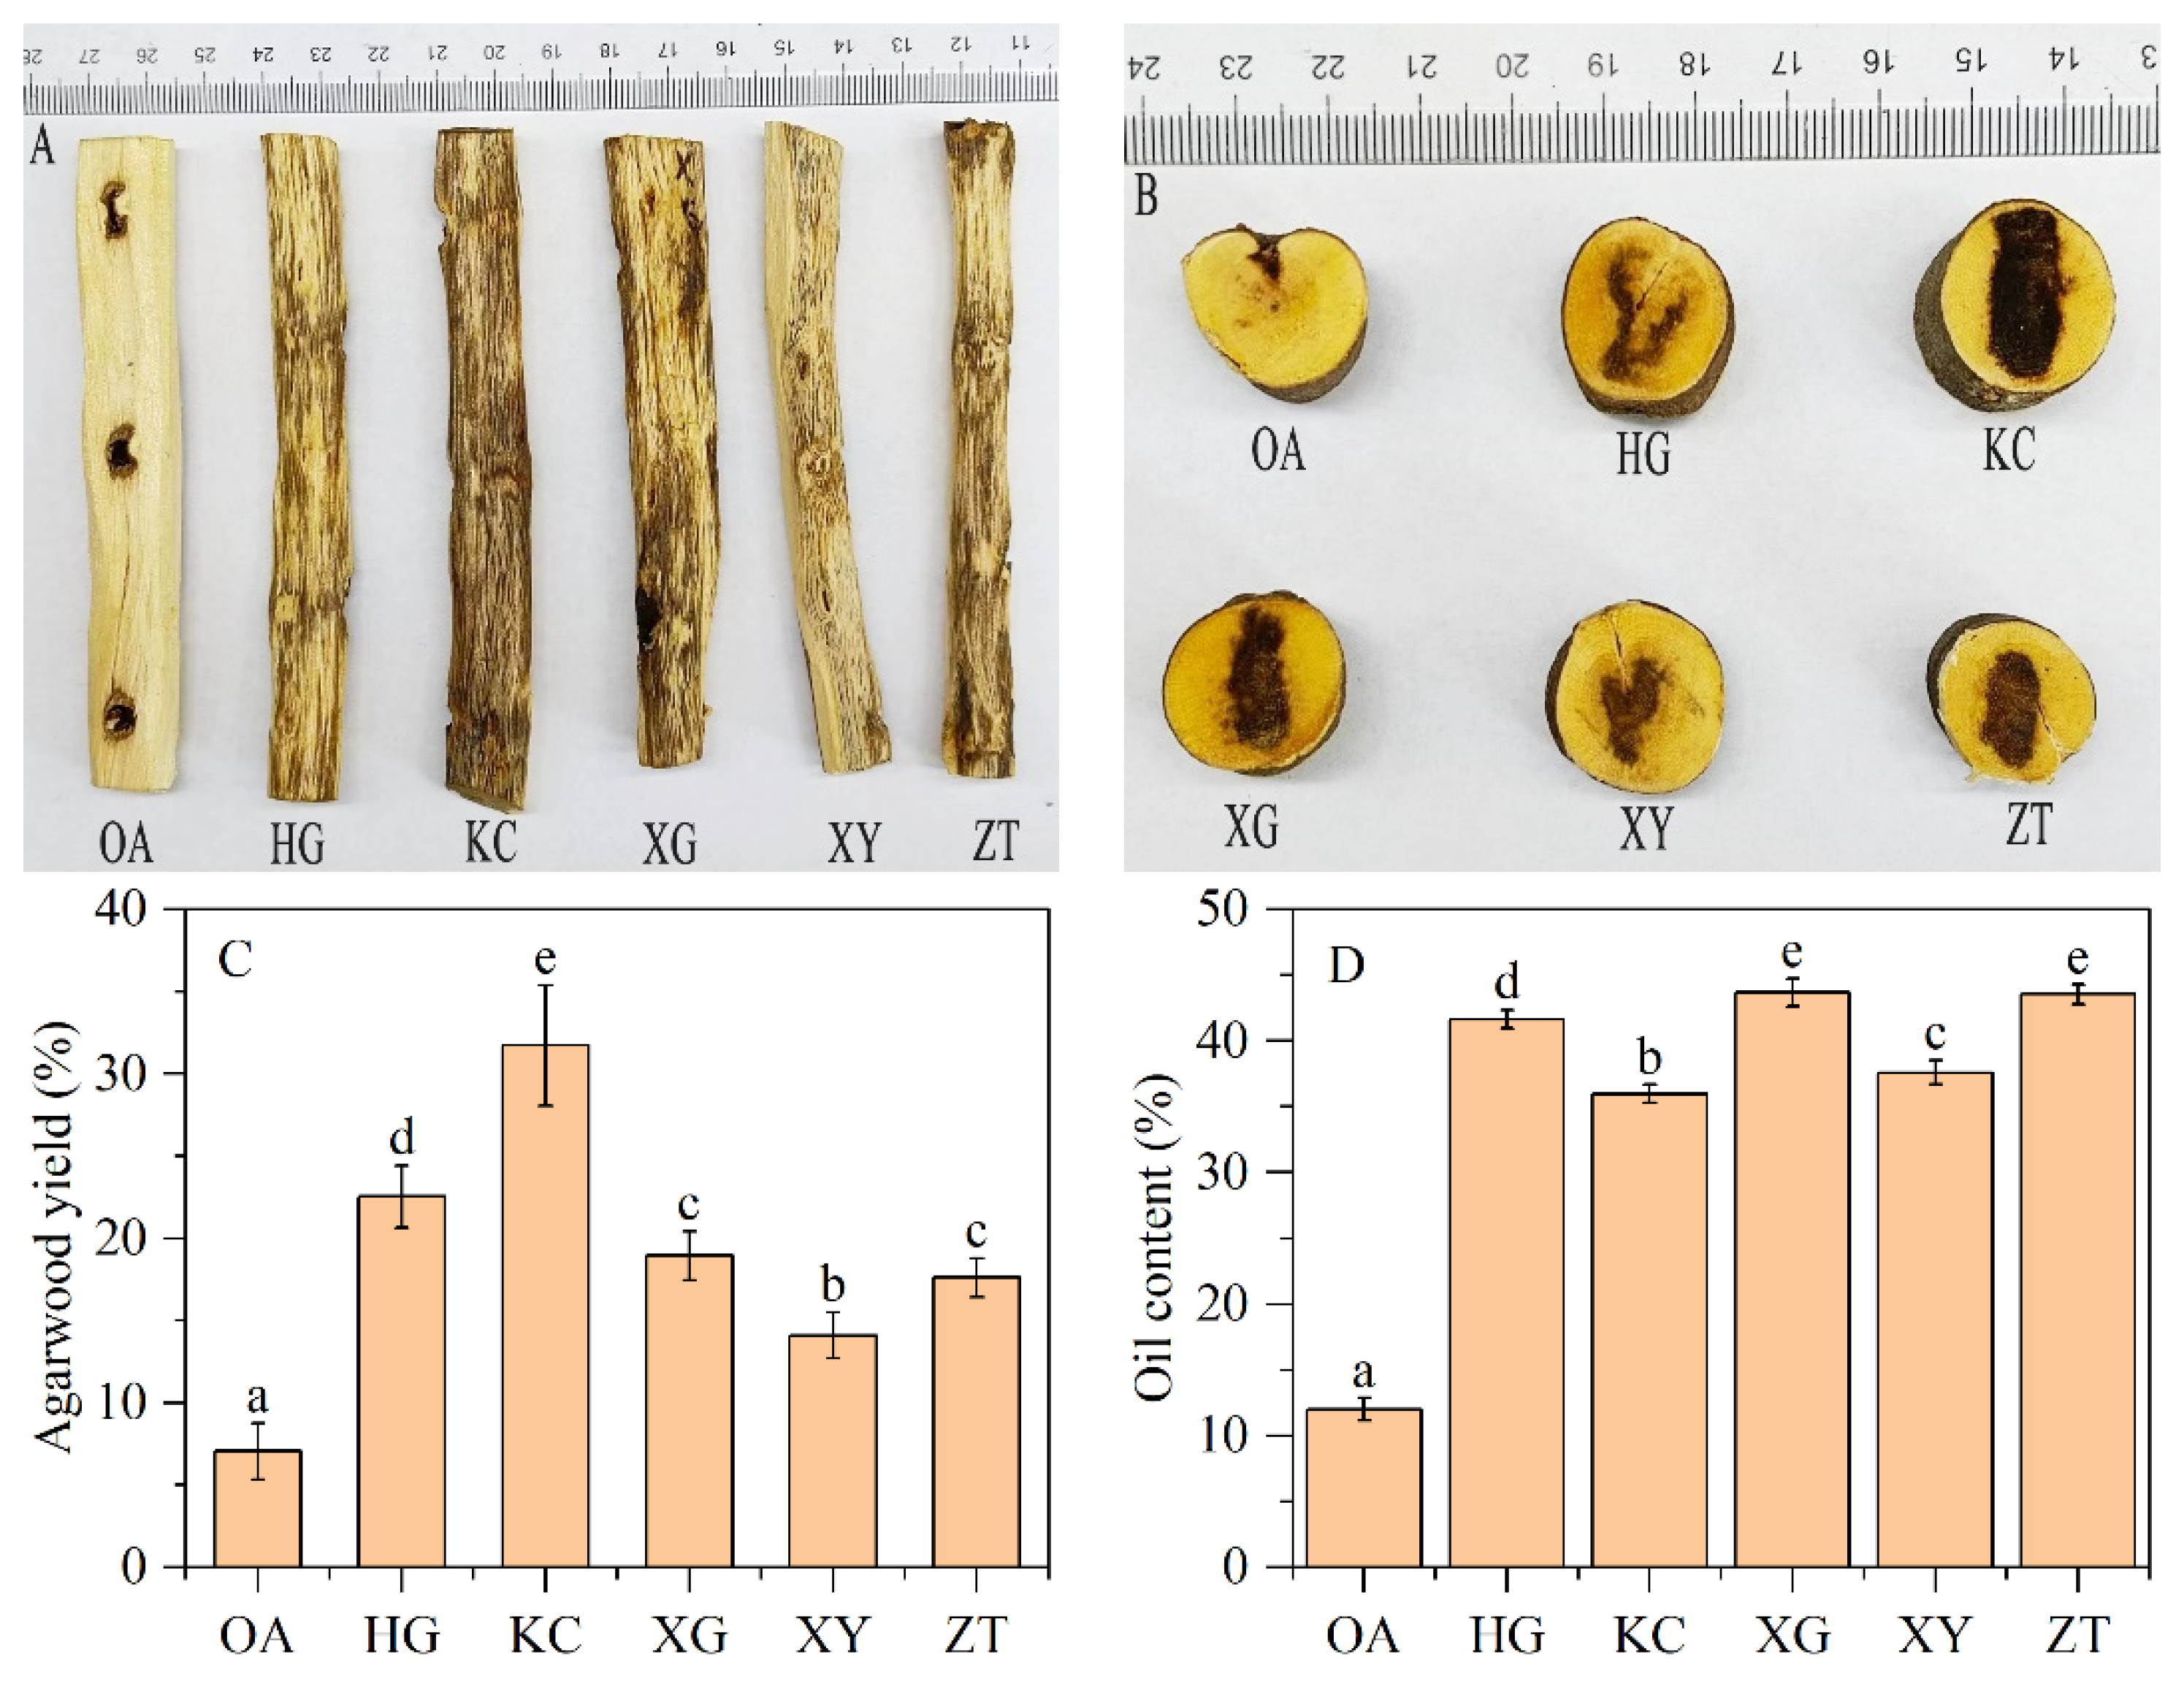
3.1. Agarwood Yield and Essential Oil Content

Significant differences in agarwood yield (dark discoloration range) were observed between OA and Qi-Nan (Figure 1A,B). The discoloration range is much larger and darker in five Qi-Nan clones than OA stems.
The average agarwood yield of the five Qi-Nan clones was 20.98%, which was nearly 3-fold higher than that of OA (7.03%) (Figure 1C). The yields of the five Qi-Nan clones ranged from high to low were KC (31.74%), HG (22.53%), XG (18.95%), ZT (17.6%), XY (14.09%). The average oil content of the five Qi-Nan clones was 40.50%, which was 3.36-fold higher than that of OA (12.04%) (Figure 1D). The oil content of the five Qi-Nan clones ranged from high to low was XG (43.70%), ZT (43.55%), HG (41.65%), XY (37.60%), KC (35.99%).

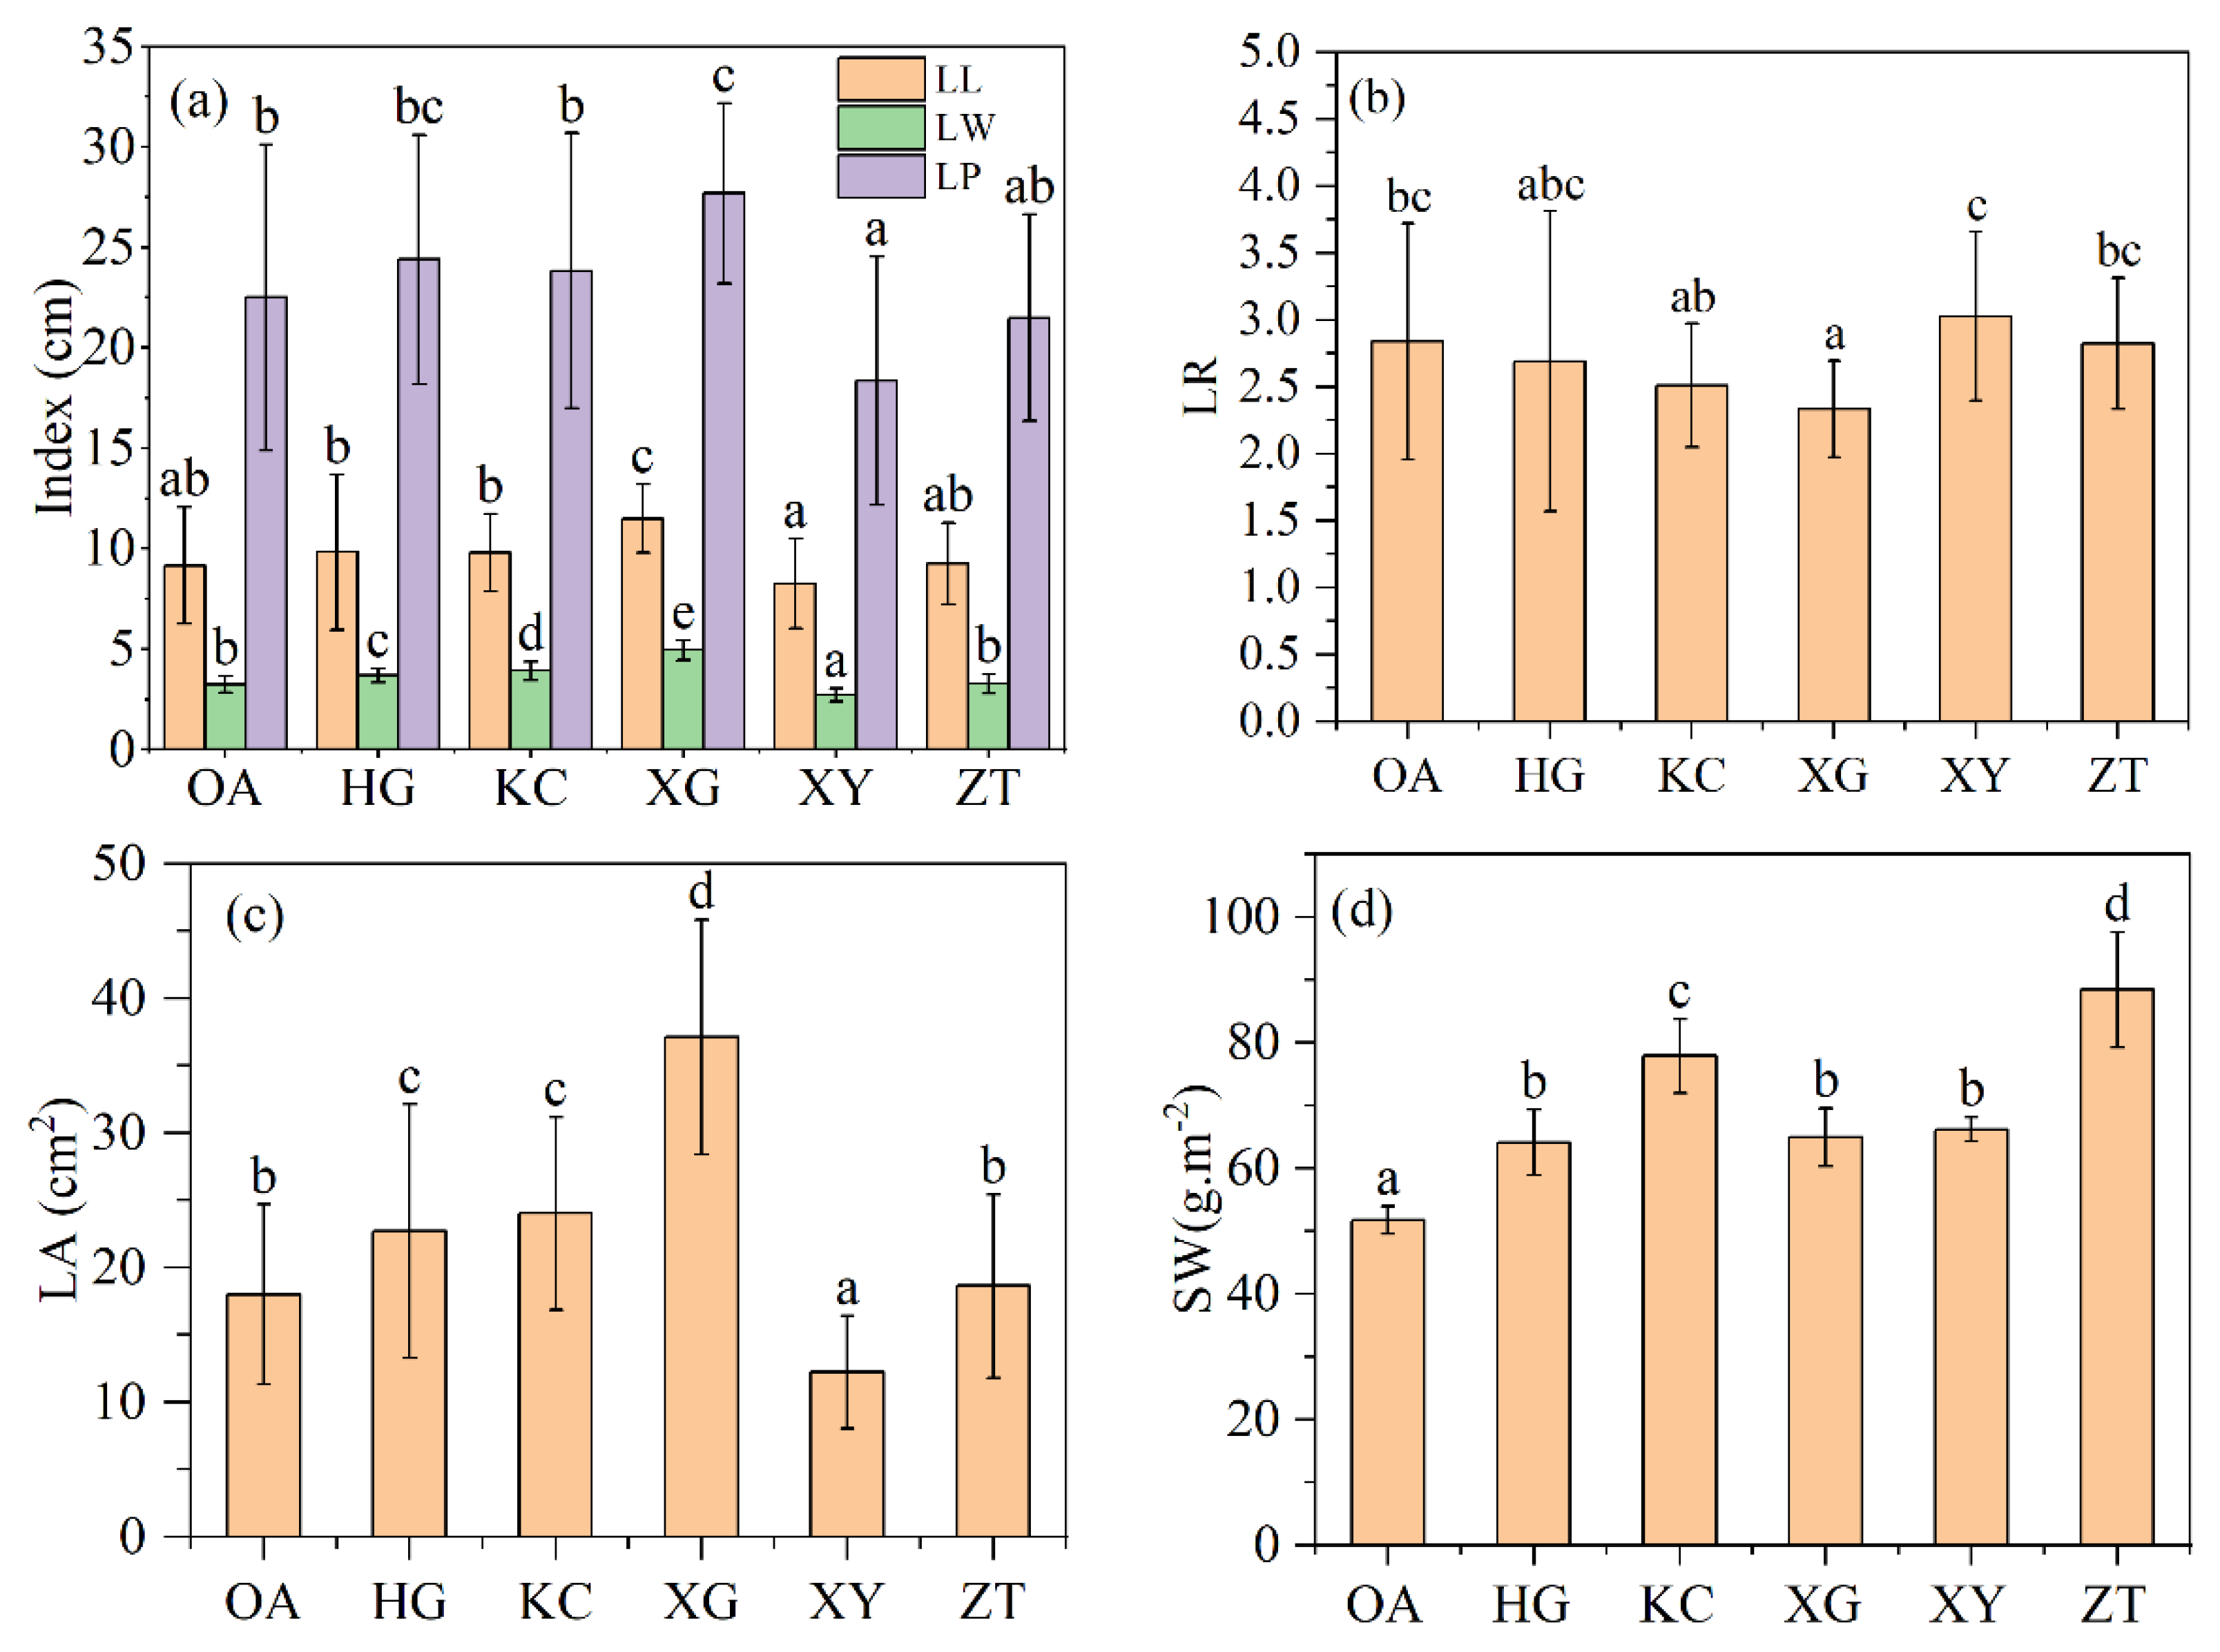
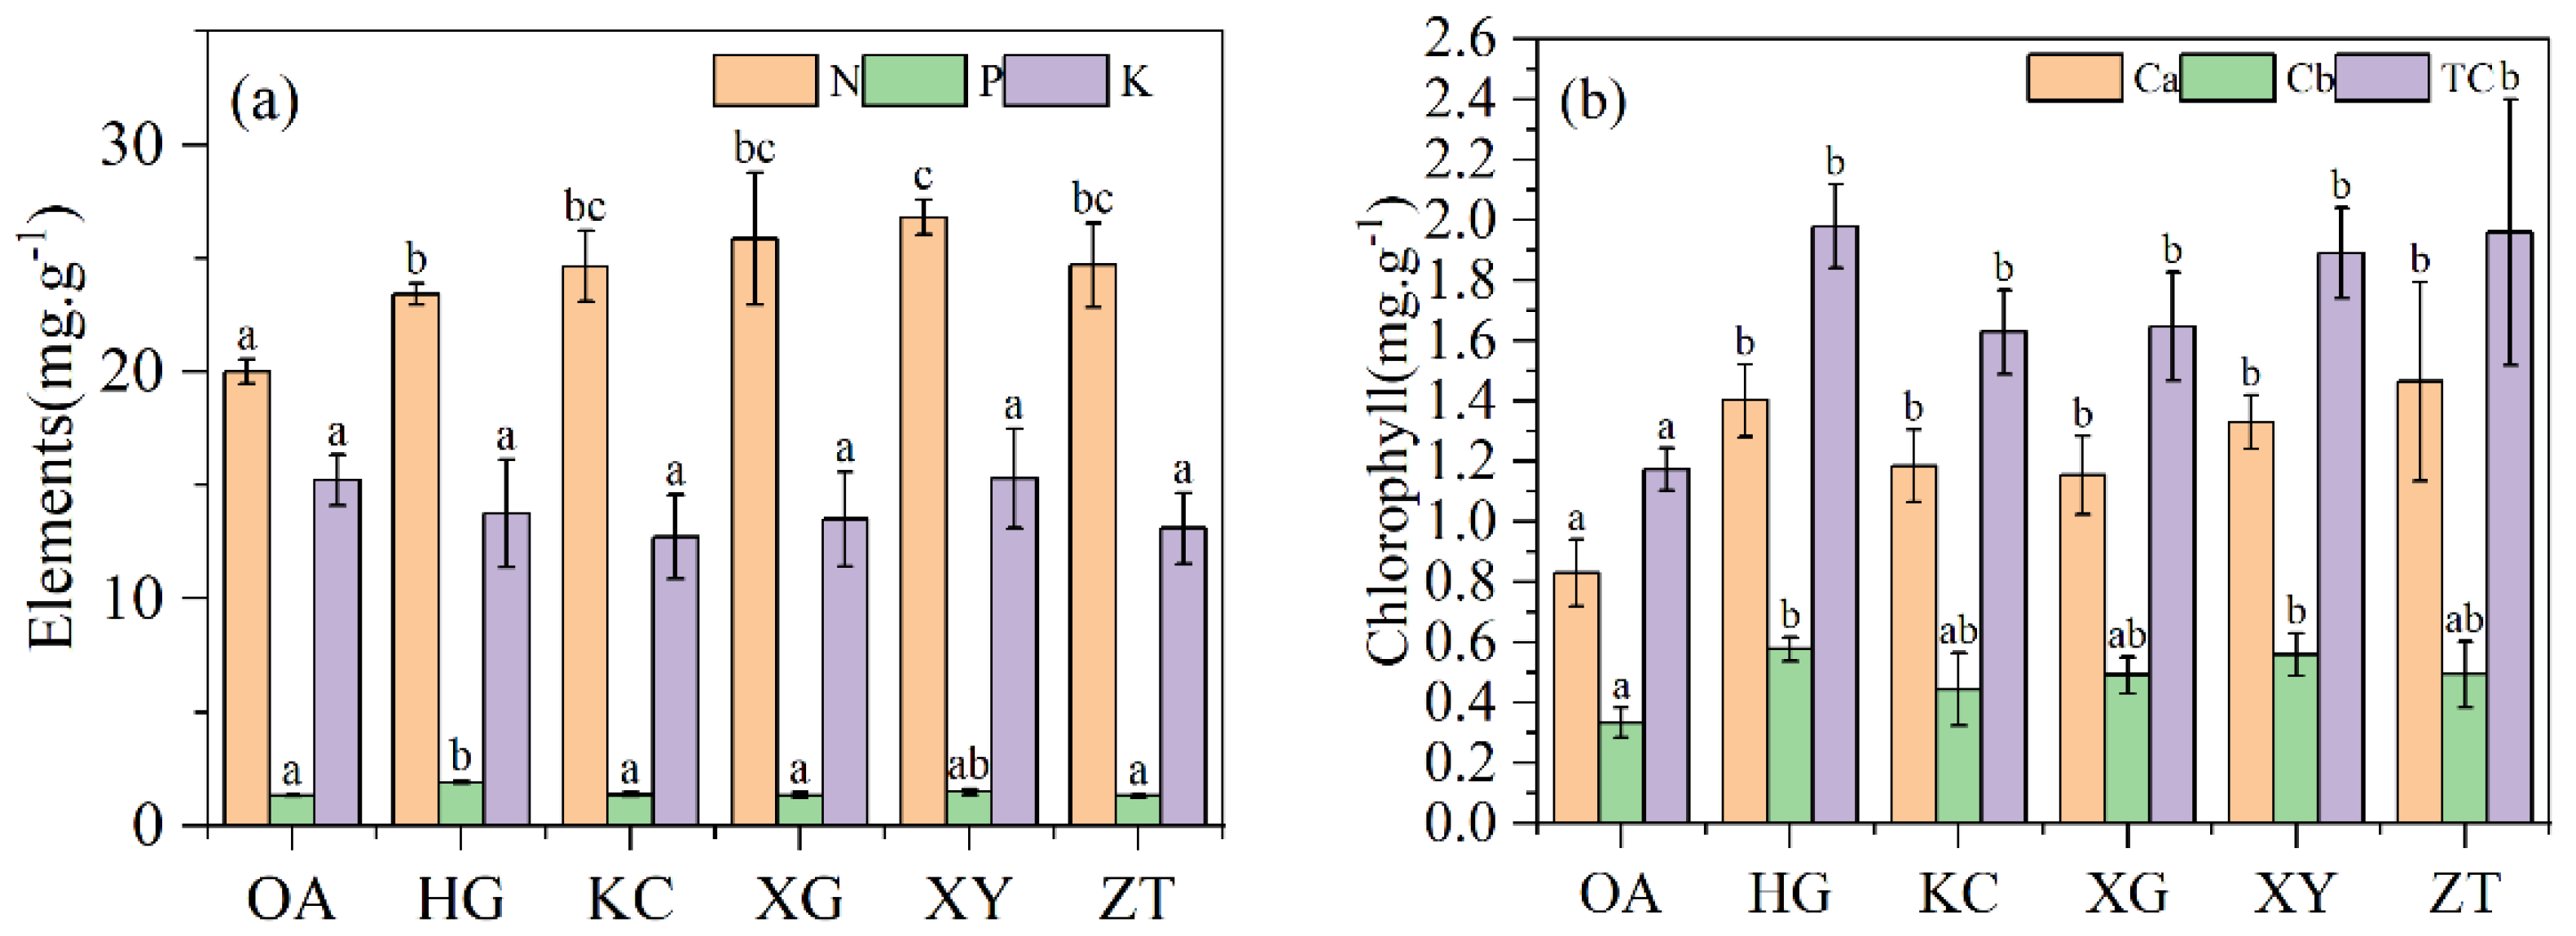
3.2. Leaf Morphological and Physiological Parameters

There was a significant difference in leaf area between OA and 5 clones of Qi-Nan (Figure 2c). XG have the largest leaf area, while XY have the smallest leaf area. The leaf areas of XG, KC and HG are significantly larger than that of OA, the leaf area of ZT is not significantly different from that of OA, and the leaf area of XY is significantly smaller than that of OA. From Figure 2a, only the leaf length of XG was significantly different with OA, and the other clones of Qi-Nan were not significantly different with OA. The leaf width of OA was significantly different with four Qi-Nan clones but ZT. Leaf length-to-width ratio of XG was smaller than OA, and there was no difference between OA and the other four clones.
There was a significant difference in specific leaf weight between OA and the five clones of Qi-Nan, and the average specific leaf weight of Qi-Nan (68.88 g.m−2) was significantly greater than that of OA (51.78 g.m−2) (Figure 2d). The specific leaf weights of the five Qi-Nan clones were HG (60.78 g.m−2), KC (77.89 g.m−2), XG (56.61 g.m−2), XY (59.51 g.m−2), ZT (88.41 g.m−2).
The average nitrogen content of the Qi-Nan leaves was 25.53% higher than that of the OA leaves. The differences in leaf phosphorus and potassium content were not significant between OA and Qi-Nan (Figure 3a). No significant difference was found in chlorophyll b content between OA and Qi-Nan, but the contents of chlorophyll a and total chlorophyll of Qi-Nan were 1.5 times those of OA (p < 0.01) (Figure 3b). No significant difference was found in chlorophyll a, chlorophyll b and total chlorophyll content among the five Qi-Nan clones.

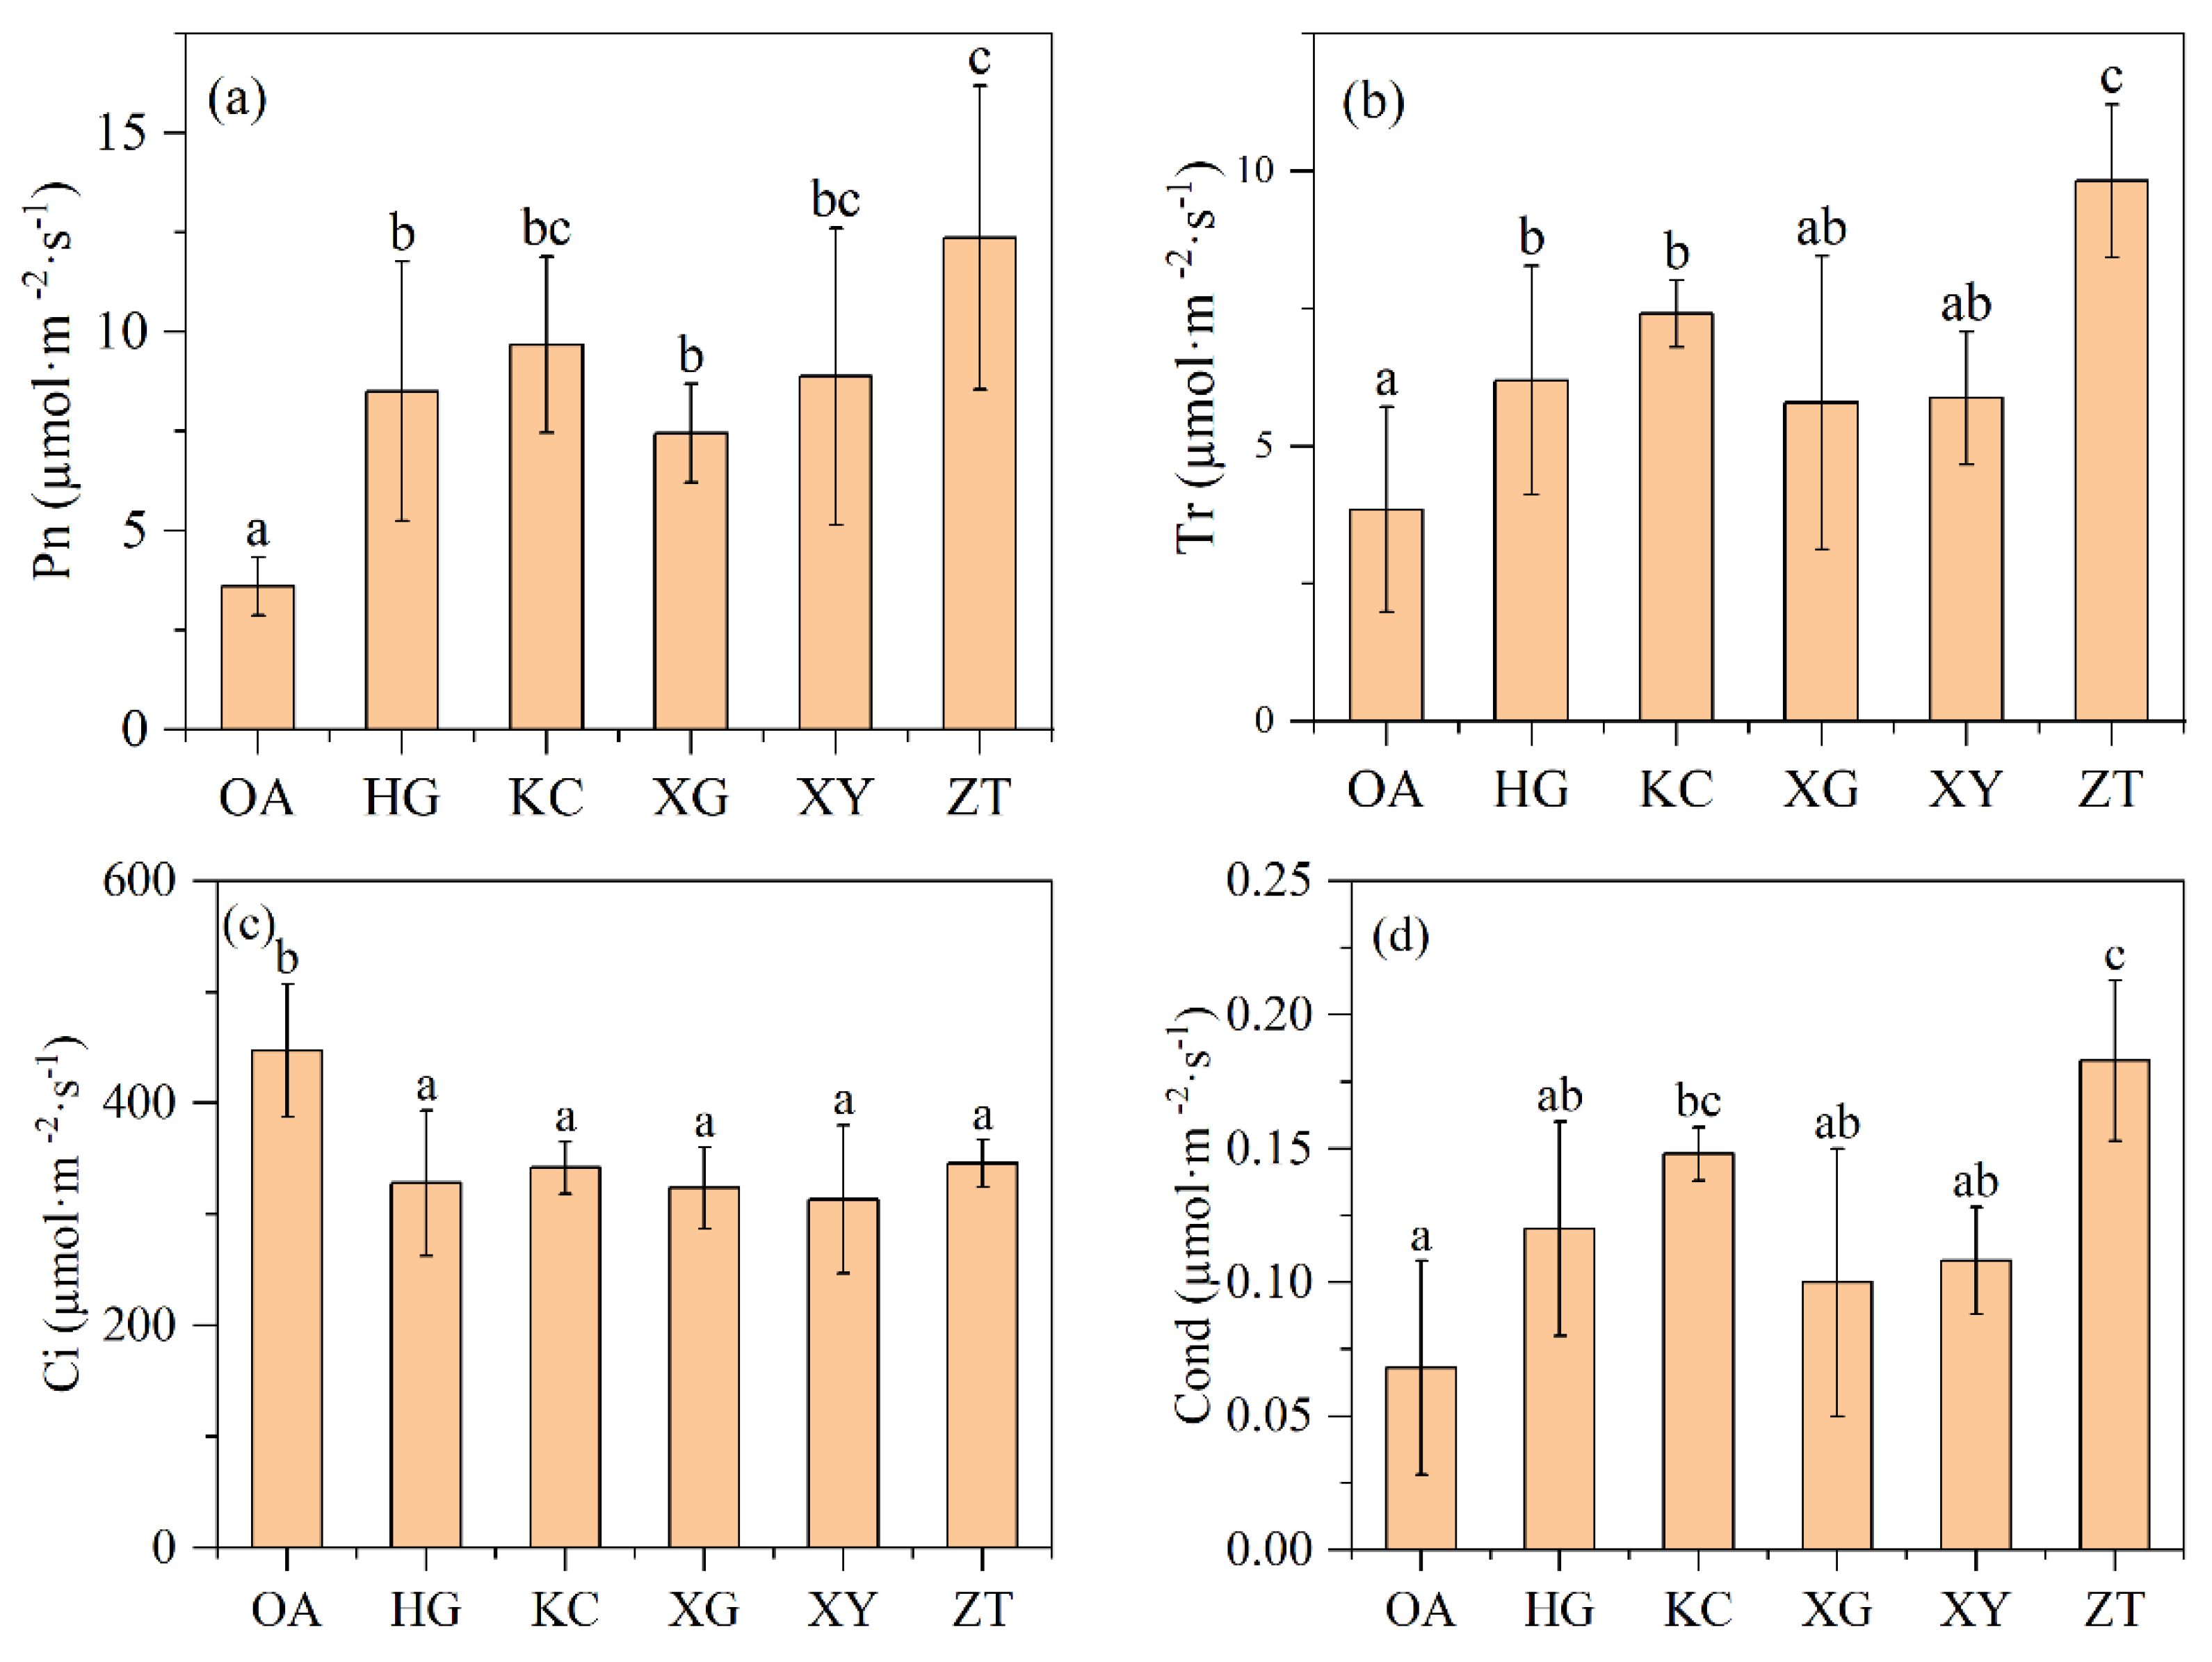
3.3. Gas Exchange Parameters

The net photosynthetic rate and intercellular CO2 concentration were significantly different between Qi-Nan and OA (Figure 4a,c). The average net photosynthetic rate of Qi-Nan was 9.37 µmol·m−2·s−1, which was 2.60-fold higher than that of OA (3.6 µmol·m−2·s−1). The average intercellular CO2 concentration of Qi-Nan was 332.66 µmol·m−2·s−1, only 74.35% of OA (447.43 µmol·m−2·s−1). In addition, the average transpiration rate of Qi-Nan was 7.18 µmol·m−2·s−1, about 1.86 times that of OA (3.85 µmol·m−2·s−1); the average stomatal conductance of Qi-Nan was 0.13 µmol·m−2·s−1, 1.85 times of OA (0.07 µmol·m−2·s−1), and the transpiration rate and stomatal conductance in not all Qi-Nan clones were significantly higher than those of OA (Figure 4).
Among the five Qi-Nan clones, the net photosynthetic rate, transpiration rate and stomatal conductance of ZT were significantly higher than the other four Qi-Nan clones, but there was no significant difference in the intercellular CO2 concentration between the five Qi-Nan clones.

3.4. Xylem Structure

A shown inn Table 2, significant differences were observed in the thickness of the vessel cell wall, the thickness of the ray cell wall, and the area of the interxylary phloem between Qi-Nan and OA. Other parameters did not show significant differences.
The average vessel wall thickness of OA was 9.61 μm, about 56.77% thicker than that of Qi-Nan (6.13 μm). There were also significant differences in vessel wall thickness between the five Qi-Nan clones, the thicknesses of the vessel walls of five Qi-Nan clones from large to small were XY, XG, KC, HG, ZT.
The average thickness of the ray cell wall of the Qi-Nan was 5.76 μm, which was 1.19 times thicker than that of OA (4.83 μm). Among the five Qi-Nan clones, XG had the thickest ray cell wall, which was significantly different from the other four Qi-Nan clones.
The average area of the interxylary phloem of Qi-Nan was 133,330.43 μm2, which was 1.86 times greater than that of OA (71,592.19 μm2). Among the five Qi-Nan clones, HG has the largest area of the interxylary phloem, which is significantly different from the other four Qi-Nan clones.

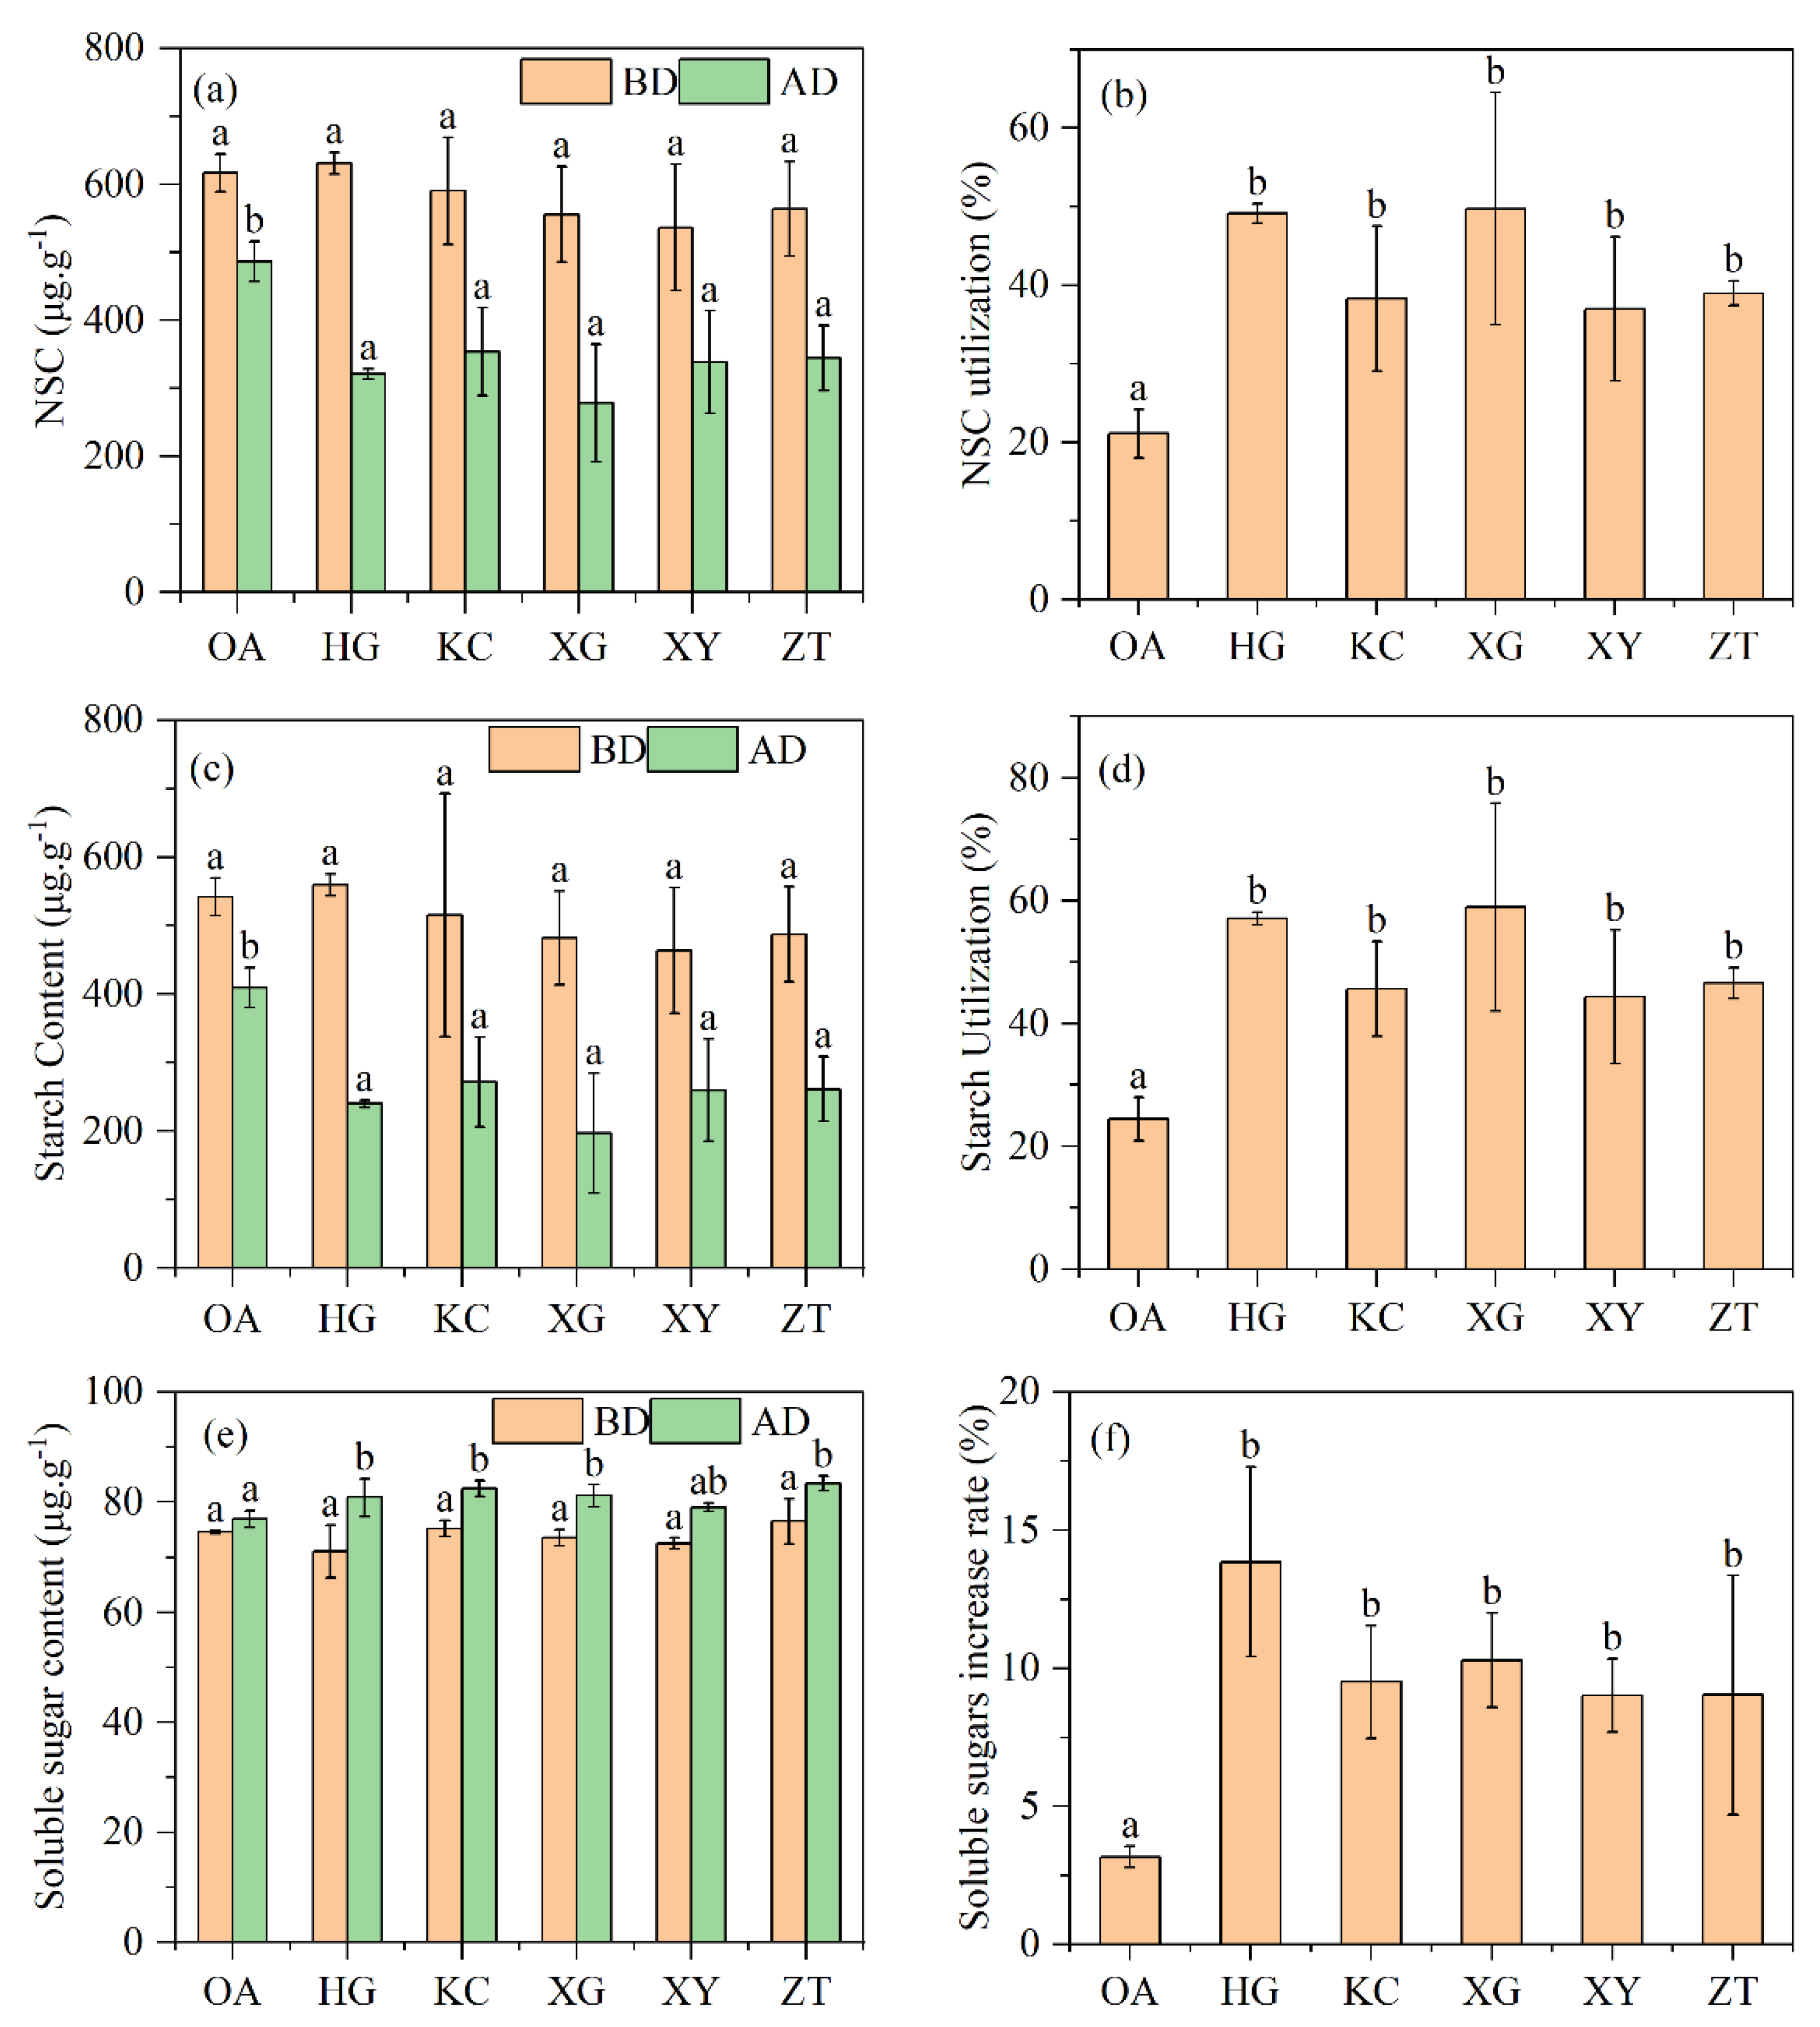
3.5. Non-Structural Carbohydrates

There were no significant differences in starch, soluble sugars and total non-structural carbohydrates contents between OA and Qi-Nan before drilling treatment, but 1.5 years after drilling treatment, total non-structural carbohydrates in stem of Qi-Nan were lower than that of OA, and the utilization rates of non-structural carbohydrates were significantly higher in Qi-Nan than in OA (Figure 5). There was no significant difference between the total non-structural carbohydrates in five Qi-Nan clones. Starch content in the stem of Qi-Nan was lower than that of OA, and the utilization rates of starch were significantly higher in Qi-Nan than in OA (Figure 5). There was no significant difference between starch content in the five Qi-Nan clones. Soluble sugar content in the stems of Qi-Nan was higher than that of OA, and the utilization rates of soluble sugar were significantly higher in Qi-Nan than in OA (Figure 5). There was no significant difference between soluble sugar content in five Qi-Nan clones.
Histochemical observations also showed that a large amount of starch in ray parenchyma cells was consumed and converted into agarwood oils during agarwood formation (Figure 6).

3.6. Correlation Analysis

A correlation analysis showed a significant negative correlation between agarwood yield and vessel cell wall thickness and significant positive correlations with starch utilization, soluble sugar growth rate, and specific leaf weight (Figure 7).
The content of agarwood ethanol extract was significantly negatively correlated with the thickness of vessel cell wall and ray cell height of a tree and was significantly positively correlated with interxylary phloem area, starch utilization, soluble sugar growth rate, ray cell wall thickness, photosynthetic rate, chlorophyll content, and the leaf nitrogen content of a tree.

4. Discussion

4.1. Relationships between Leaf Morphology and Photophysiological Characteristics and Agarwood Formation

Plant physiological traits can be used as indirect selection criteria for yield [21]. When the genetic diversity of a specific trait has been determined, an excellent variety can be identified through its relative genetic correlation with yield [10]. The results show that there were no significant differences in the leaf length, width, circumference, area and length–width ratio between OA and Qi-Nan, and these leaf parameters did not significantly correlate with the agarwood yield of a tree and oil content in agarwood. Therefore, it is difficult to distinguish OA and Qi-Nan simply by the leaf appearance properties.
The leaf is the main organ of plant photosynthesis, which directly affects the production capacity of plants and is the basis of a high yield [22]. Specific leaf weight and chlorophyll content are two important indicators for assessing the photosynthetic capacity of plants. A larger specific leaf weight often has a higher chlorophyll content, which also means a stronger photosynthetic capacity [9]. The specific leaf weight, chlorophyll content, nitrogen content and net photosynthetic rate of Qi-Nan were significantly higher than those of OA, and these factors are correlated with each other.
A correlation analysis showed that there were significant positive correlations between specific leaf weight, chlorophyll content, nitrogen content, net photosynthetic rate and agarwood yield or agarwood oil content. Studies have shown that the specific leaf weight has a certain relationship with the plant’s resistance to stress [23], and agarwood is the resin-shaped heartwood formed when agarwood plants are subjected to external stress. Agarwood formation is a stress-resistant process [24]. A larger specific leaf weight represents a better leaf water retention capacity, higher dry matter accumulation and photosynthetic efficiency, and is a result of stronger stress resistance and higher agarwood production.
Chlorophyll is an important pigment for photosynthesis, leading to the assumption that the total amount of the leaf chlorophyll content directly influences the photosynthetic capacity of plants [25]. Leaf nitrogen content, an indicator for the amount of photosynthetic proteins, plays an important role in understanding plant function and status, while nitrogen deficiency significantly reduces photosynthetic yield [26,27].
Previous studies found that, after physical damage, there are two obvious physiological changes in the formation of agarwood. The first change is that the starch in the parenchyma cells decreases and disappears after the tree is injured; the second change is that there is a significant saponification in parenchymal tissue cells, and brown droplets appear [28,29]. This means that during agarwood formation, non-structural carbohydrates provide a large amount of carbon sources for agarwood synthesis through the conversion of starch to soluble sugars [30,31]. Adams et al. [32] also found that the metabolic byproducts of starch hydrolysis may be involved in agarwood resin synthesis. This study shows that more starch and total non-structural carbohydrates were consumed in Qi-Nan than in OA during agarwood formation. Larger specific leaf weight, chlorophyll content, nitrogen content and photosynthetic rate can provide more carbon sources to Qi-Nan trees than to OA trees. The carbon source flows through the phloem to different plant organs and is metabolized to form agarwood. Therefore, Qi-Nan can more easily form agarwood than OA.

4.2. Relationship between the Anatomical Characteristics of Xylem and Agarwood Formation

In this study, it was found that there were significant differences in the thickness of the vessel wall, the thickness of the ray cell wall, and the area of the interxylary phloem between OA and Qi-Nan.
The thickness of the vessel wall of OA was significantly greater than that of Qi-Nan, and the yield and oil content of agarwood were significantly negatively correlated with the vessel wall thickness. Most of the supporting cells (fibers) and water-transporting cells (vessels) in plants have secondary walls. Wood fibers form a thick secondary cell wall in xylem tissues to give mechanical support to trees [33]. Most of the photosynthetic products accumulated by plants are stored in the secondary cell wall to form the structure of the plant body, which is called lignocellulosic biomass [34]. Enzymatic analysis has shown that there is a strong negative correlation between lignin content and sugars release in naturally grown Populus pilosa [35]. From this point of view, the thicker cell wall of the OA vessel consumes more photosynthetic products than Qi-Nan. For Qi-Nan, more photosynthetic products can be used for physiological metabolism or the production of other agarwood substances. Furthermore, a thinner vessel wall thickness can reduce the proportion of the xylem area of the vessel, and the lower proportion of the vessel cells in the xylem can effectively increase the proportion of active cells for the synthesis of agarwood substances, thus increasing the production of agarwood.
This explanation is supported by the larger area proportion of the interxylary phloem in the Qi-Nan xylem. The interxylary phloem belongs to the vascular cambium, which intermittently produces a secondary phloem in a specific time and space [36,37]. Usually, its main function is to transport and store nutrients and photosynthetic products [38]. When subjected to external stress, the interxylary phloem of agarwood plants plays an important role in synthesizing agarwood substances, preventing a further invasion of pathogens and reducing external stress [38,39]. The area proportion of the interxylary phloem of Qi-Nan was much larger than that of OA, indicating that the ability of nutrient transportation and storage, synthesis of agarwood substances and stress resistance in Qi-Nan is much stronger than in OA. When injured by the outside world, nutrients can be delivered to the injured area faster and in higher quantities, participating in the stress response, thus resulting in higher agarwood yield and oil content in Qi-Nan.
There was a significant positive correlation between the thickness of the ray cell wall and agarwood oil content, and the thickness of the Qi-Nan ray cell wall was significantly larger than that of OA. Ray cell is a type of active living cell that exists in the xylem and can synthesize and transport secondary metabolites in response to stress [40]. Firstly, the thickened cell wall acts as a passive barrier. When pathogens invade, the pathogen must take longer or secrete more cell-wall-degrading enzymes to hydrolyze the barrier [41,42]. Therefore, thicker cell walls allow living cells more time to synthesize and transport secondary metabolites in response to stress. Secondly, some photosynthetic products are stored in the cell wall as non-structural substances. When the cell wall is degraded, a large amount of carbohydrates are released [43]. Thirdly, the cell wall is also a reservoir of antibacterial compounds. When the cell wall is degraded, these antibacterial compounds are released, and part of the carbohydrates can be used as information molecules related to the damage, which can be sensed by plant pattern recognition receptors to initiate an immune response [44,45], thus more antibacterial substances and information molecules may be released to induce a stronger immune response during the degradation process of ray cell wall in Qi-Nan. For A. sinensis, a stronger immune response means that more agarwood substances will be synthesized.

5. Conclusions

It is difficult to distinguish OA and Qi-Nan simply by the analyzed leaf morphological parameters. Compared to OA, Qi-Nan leaves had a greater specific leaf weight, total chlorophyll content and nitrogen content, and thus had a stronger photosynthetic capacity. A stronger photosynthetic capacity can provide more carbon sources for the synthesis of agarwood substances and meet its higher carbohydrates consumption. A thinner vessel wall thickness and larger area of the interxylary phloem allowed Qi-Nan to have more active cells to synthesize agarwood substances. Furthermore, a thicker ray cell wall can better protect ray parenchyma cells, which can synthesize and transport agarwood substances longer and release more carbon source and defense signal substances by hydrolysis. These factors indicated that Qi-Nan had a more efficient morpho-physiological basis for agarwood formation than OA and revealed the mechanism by which Qi-Nan is more likely to produce agarwood.

Author Contributions

Conceptualization, D.X. and Z.C.; methodology, X.L. (Xiaojin Liu); software, X.L. (Xiaofei Li); validation, D.X., Z.C. and P.Z.; formal analysis, X.L. (Xiaojin Liu) and Z.H.; investigation, X.L. (Xiaofei Li); data curation, X.L. (Xiaofei Li) and Z.C.; writing—original draft preparation, X.L. (Xiaofei Li); writing—review and editing, X.L.(Xiaofei Li); supervision, D.X.; project administration, D.X. All authors have read and agreed to the published version of the manuscript.

Funding

This research was supported by Guangdong Forestry Science and Technology Innovation Project (No. 2020KJCX007) and National forest technological achievement Promotion project (No. 2020133130).

Institutional Review Board Statement

Not applicable.

Informed Consent Statement

Not applicable.

Data Availability Statement

Not applicable.

Acknowledgments

The authors thank Chunlong Huang for providing the experimental material of Qi-Nan trees for this experiment.

Conflicts of Interest

The authors declare no conflict of interest.

References

  1. Tan, C.S.; Isa, N.M.; Zainal, Z. Agarwood induction: Current developments and future perspectives. Front. Plant Sci. 2019, 10, 122. [Google Scholar] [CrossRef] [PubMed] [Green Version]
  2. Ding, X.P.; Mei, W.L.; Lin, Q.; Wang, H.; Wang, J.; Peng, S.Q.; Li, H.L.; Zhu, J.H.; Li, W.; Wang, P. Genome sequence of the agarwood tree Aquilaria sinensis (Lour.) Spreng: The first chromosome-level draft genome in the Thymelaeceae family. GigaScience 2020, 9, a13. [Google Scholar] [CrossRef] [PubMed] [Green Version]
  3. Liu, J.; Yang, J.; Jiang, C.; Zhou, J.H.; Zhao, Y.Y.; Huang, L.Q. Volatile organic compound and endogenous phytohormone characteristics during callus browning in Aquilaria sinensis. Ind. Crops Prod. 2021, 168, 113605. [Google Scholar] [CrossRef]
  4. Azren, P.D.; Lee, S.Y.; Emang, D.; Mohamed, R. History and perspectives of induction technology for agarwood production from cultivated Aquilaria in Asia: A review. J. Forestry Res. 2019, 30, 1–11. [Google Scholar] [CrossRef]
  5. Zhang, P.; Li, X.F.; Cui, Z.Y.; Xu, D.P. Morphological, physiological, biochemical and molecular analyses reveal wounding-induced agarwood formation mecha-nism in two types of Aquilaria sinensis (Lour.) Spreng. Ind. Crops Prod. 2022, 178, 114603. [Google Scholar] [CrossRef]
  6. Yu, M.; Liu, Y.Y.; Feng, J.; Chen, D.; Yang, Y.; Liu, P.W.; Yu, Z.X.; Wei, J.H. Remarkable Phytochemical Characteristics of Chi-Nan Agarwood Induced from New-Found Chi-Nan Germplasm of Aquilaria sinensis Compared with Ordinary Agarwood. Int. J. Anal. Chem. 2021, 10, 5593730. [Google Scholar] [CrossRef]
  7. Li, W.; Chen, H.Q.; Wang, H.; Mei, W.L.; Dai, H.F. Natural products in agarwood and Aquilaria plants: Chemistry, biological activities and biosynthesis. Nat. Prod. Rep. 2020, 38, 528–565. [Google Scholar] [CrossRef]
  8. Yang, L.; Yang, J.L.; Dong, W.H.; Wang, Y.L.; Zeng, J.; Yuan, J.Z.; Wang, H.; Mei, W.L.; Dai, H.F. The Characteristic fragrant sesquiterpenes and 2-(2-phenylethyl) chromones in wild and cultivated “Qi-Nan” agarwood. Molecules 2021, 26, 436. [Google Scholar] [CrossRef]
  9. Jumrani, K.; Bhatia, V.S.; Pandey, G.P. Impact of elevated temperatures on specific leaf weight, stomatal density, photosynthesis and chlorophyll fluorescence in soybean. Photosynth. Res. 2017, 131, 333–350. [Google Scholar] [CrossRef]
  10. Kanchan, J.; Virender, S.B. Identification of drought tolerant genotypes using physiological traits in soybean. Physiol. Mol. Biol. Plants 2019, 25, 697–711. [Google Scholar] [CrossRef]
  11. Olano, J.M.; Muñoz, N.G.; Arzac, A.; Rozas, V. Sex determines xylem anatomy in a dioecious conifer: Hydraulic consequences in a drier world. Tree Physiol. 2017, 11, 1493–1502. [Google Scholar] [CrossRef] [PubMed] [Green Version]
  12. Liu, Y.X.; Qiao, M.J.; Fu, Y.L.; Wei, P.L.; Li, Y.J.; Liu, Z.G. Tissue structure changes of Aquilaria sinensis xylem after fungus induction. Forests 2022, 13, 43. [Google Scholar] [CrossRef]
  13. Nguyen, T.T.N.; Trinh, N.Y.; Le, P.K. Recovery yield and bioactivities evaluation on essential oil and ethanolic extract of star anise (Illicium verum Hook. f.). Chem. Eng. J. 2021, 83, 205–210. [Google Scholar] [CrossRef]
  14. Wang, Z.T.; Zhang, Z.; Tang, H.X.; Zhang, Q.; Lia, X.G.; Zhou, G.F. Genetic variation in leaf characters of F1 hybrids of Chinese Jujube. Sci. Hortic. 2019, 244, 372–378. [Google Scholar] [CrossRef]
  15. Abubakar, D.; Zahir, A.Z.; Muhammad, I.; Atif, M.; Atif, J.; Azhar, H.; Bushra Maqshoof, A. Efficacy of rhizobacterial exopolysaccharides in improving plant growth, physiology, and soil properties. Environ. Monit. Assess. 2012, 193, 515. [Google Scholar] [CrossRef]
  16. Yang, L.Z.; Pan, C.X.; Shao, S.L.; Tao, C.Y.; Wan, G.W.; Ying, Y.Q. Effect of PP333 and drought-stress on the activity photosynthetic characteristics and nonstructura1 carbohydrates of Phyllostachy sedulis seedings. Acta Ecol. Sinica 2018, 38, 2082–2091. [Google Scholar] [CrossRef]
  17. Johansen, D. Plant Microtechnique; McGrawHill: New York, NY, USA, 1940; pp. 55–60. [Google Scholar]
  18. Scholz, A.; Klepsch, M.; Karimi, Z.; Jansen, S. How to quantify conduits in wood? Front. Plant Sci. 2013, 4, 56. [Google Scholar] [CrossRef] [Green Version]
  19. AbdElgawad, H.; Avramova, V.; Baggerman, G.; Raemdonck, G.V.; Valkenborg, D.; Ostade, X.V.; Guisez, Y.; Prinsen, E.; Asard, H.; Ende, W.V.D.; et al. Starch biosynthesis contributes to the maintenance of photosynthesis and leaf growth under drought stress in maize. Plant Cell Environ. 2020, 43, 2254–2271. [Google Scholar] [CrossRef]
  20. Zhang, H.Y.; Wang, C.K.; Wang, X.C. Spatial variability of non-structural carbohydrate concentrations in canopy branches and leaves of five temperate tree species. Acta Ecol. Sin. 2015, 35, 6496–6506. [Google Scholar] [CrossRef] [Green Version]
  21. Khadka, K.; Earl, H.J.; Raizada, M.N.; Navabi, A. A physio-morphological trait-based approach for breeding drought tolerant wheat. Front. Plant Sci. 2020, 11, 715. [Google Scholar] [CrossRef]
  22. Zhang, C.; Yang, H.Y.; Wu, W.L.; Li, W.L. Effect of drought stress on physiological changes and leaf surface morphology in the blackberry, Braz. J. Bot. 2017, 40, 625–634. [Google Scholar] [CrossRef]
  23. Alves, A.A.C.; Setter, T.L. Response of cassava leaf area expansion to water deficit: Cell proliferation, cell expansion and delayed development. Ann. Bot. 2004, 94, 605–613. [Google Scholar] [CrossRef] [PubMed] [Green Version]
  24. Chen, H.Q.; Wei, J.H.; Yang, J.S.; Zhang, Z.; Yang, Y.; Gao, Z.H.; Sui, C.; Gong, B. Chemical constituents of agarwood originating from the endemic genus Aquilaria plants. Chem. Biodivers. 2012, 9, 236–250. [Google Scholar] [CrossRef] [PubMed]
  25. Li, Y.; He, N.P.; Hou, J.H.; Xu, L.; Liu, C.C.; Zhang, J.H.; Wang, Q.F.; Zhang, X.M.; Wu, X.Q. Factors influencing leaf chlorophyll content in natural forests at the biome scale. Front. Ecol. Evol. 2018, 6, 64. [Google Scholar] [CrossRef] [Green Version]
  26. Liang, L.; Di, L.P.; Huang, T.; Wang, J.H.; Lin, L.; Wang, L.J.; Yang, M.H. Estimation of leaf nitrogen content in wheat using new hyperspectral indices and a random forest regression algorithm. Remote Sens. 2018, 10, 1940. [Google Scholar] [CrossRef] [Green Version]
  27. Jia, M.; Colombo, R.; Rossini, M.; Celesti, M. Estimation of leaf nitrogen content and photosynthetic nitrogen use efficiency in wheat using sun-induced chlorophyll fluorescence at the leaf and canopy scales. Eur. J. Agron. 2021, 122, 126192. [Google Scholar] [CrossRef]
  28. Nobuchi, T.; Somkid, S. Preliminary Observation of Aquliaria crassna Wood Associated with the Formation of Aloeswood Bult. Kyoto Univ. For. 1991, 63, 226–235. Available online: http://hdl.handle.net/2433/191992 (accessed on 10 May 2022).
  29. Kono, Y.; Ishida, A.; Saiki, S.T.; Yoshimura, K.; Dannoura, M.; Yazaki, K.; Kimura, F.; Yoshimura, J.; Aikawa, S. Initial hydraulic failure followed by late-stage carbon starvation leads to drought-induced death in the tree Trema orientalis. Commun. Biol. 2019, 2, 8. [Google Scholar] [CrossRef] [Green Version]
  30. Hartmann, H.; Trumbore, S. Understanding the roles of nonstructural carbohydrates in forest trees—From what we can measure to what we want to know. New Phytol. 2016, 211, 386–403. [Google Scholar] [CrossRef] [Green Version]
  31. Liu, B.H.; Liang, J.; Tang, G.M.; Wang, X.F.; Liu, F.C.; Zhao, D.C. Drought stress affects on growth, water use efficiency, gas exchange and chlorophyll fluorescence of Juglans rootstocks. Sci. Hortic. 2019, 250, 230–235. [Google Scholar] [CrossRef]
  32. Adams, S.J.; Manohara, T.N.; Krishnamurthy, K.V.; Kumar, T.S. Hito-Chemical Studies on Fungal-Induced Agarwood. Indian J. Plant Sci. 2016, 5, 102–110. Available online: https://www.researchgate.net/publication/300056960 (accessed on 12 July 2021).
  33. Naoki, T.; Tatsuya, A.; Miyuki, T.N.; Yuzou, S.; Shingo, S.; Nobutaka, M.; Toru, T. Populus NST/SND orthologs are key regulators of secondary cell wall formation in wood fibers, phloem fibers and xylem ray parenchyma cells. Tree Physiol. 2019, 39, 514–525. [Google Scholar] [CrossRef]
  34. Rubin, E.M. Genomics of cellulosic biofuels. Nature 2008, 454, 841–845. [Google Scholar] [CrossRef] [PubMed]
  35. Studer, M.H.; DeMartini, J.D.; Davis, M.F.; Sykes, R.W.; Davison, B.; Keller, M.; Tuskan, G.A.; Wyman, C.E. Lignin content in natural Populus variants affects sugar release. Proc. Natl. Acad. Sci. USA 2011, 108, 6300–6305. [Google Scholar] [CrossRef] [Green Version]
  36. Rao, K.R.; Dayal, R. The secondary xylem of Aquilaria agallocha (Thymelaeaceae) and the formation of ‘agar’. IAWA J. 1992, 13, 163–172. [Google Scholar] [CrossRef]
  37. Angyalossy, V.; Pace, M.R.; Lima, A.C. Liana Anatomy: A Broad Perspective on Structural Evolution of the Vascular System; Wiley-Blackwell Publishers: Oxford, UK, 2015; pp. 253–287. [Google Scholar] [CrossRef]
  38. Carlquist, S. Interxylary phloem: Diversity and functions. Brittonia 2013, 62, 477–495. [Google Scholar] [CrossRef]
  39. Liu, P.W.; Zhang, X.L.; Yang, Y.; Sui, C.; Xu, Y.H.; Wei, J.H. Interxylary phloem and xylem rays are the structural foundation of agarwood resin formation in the stems of Aquilaria sinensis. Trees 2019, 33, 533–542. [Google Scholar] [CrossRef]
  40. Cui, Z.Y.; Li, X.F.; Xu, D.P.; Yang, Z.J.; Zhang, N.N.; Liu, X.J.; Hong, Z. Physiological changes during heartwood formation induced by plant growth regulators in Dalbergia odorifera (Leguminosae). IAWA J. 2021, 42, 217–234. [Google Scholar] [CrossRef]
  41. Bacete, L.; Mélida, H.; Miedes, E.; Molina, A. Plant cell wall-mediated immunity: Cell wall changes trigger disease resistance responses. Plant J. 2018, 93, 614–636. [Google Scholar] [CrossRef]
  42. De Lorenzo, G.; Ferrarim, S.; Cervone, F.; Okun, E. Extracellular DAMPs in Plants and Mammals: Immunity, Tissue Damage and Repair. Trends Immunol. 2018, 39, 937–950. [Google Scholar] [CrossRef]
  43. Molina, A.; Miedesa, E.; Bacete, L.; Rodríguez, T.; Mélida, H.; Denancé, N.; Sánchez, V.A.; Rivière, M.P.; López, G.; Freydier, A. Arabidopsis cell wall composition determines disease resistance specificity and fitness. Proc. Natl. Acad. Sci. USA 2020, 118, e2010243118. [Google Scholar] [CrossRef] [PubMed]
  44. Souza, C.A.S.; Li, S.D.; Lin, A.Z.; Boutrot, F.; Grossmann, G.; Zipfel, C.; Somerville, S.C. Cellulose-derived oligomers act as damage-associated molecular patterns and trigger defense-like responses. Plant Physiol. 2017, 173, 2383–2398. [Google Scholar] [CrossRef] [PubMed] [Green Version]
  45. Engelsdorf, T.; Kjaer, L.; Bisceglia, N.G.; Vaahtera, L.; Bauer, S.; Miedes, E.; Wormit, A.; James, L.; Chairam, I.; Molina, A. Functional characterization of genes mediating cell wall metabolism and responses to plant cell wall integrity impairment. BMC Plant Biol. 2019, 19, 320. [Google Scholar] [CrossRef]
Figure 1. Agarwood formation, and agarwood yield and essential oil content of OA and Qi-Nan. Different letters denote significant (p < 0.05) differences among OA and five Qi-Nan clones in a one-way ANOVA, and the bar represents a standard deviation (n = 5). “OA” ordinary agarwood, “HG, KC, XG, XY, ZT” represent five Qi-Nan clones, The basic situation of the agarwood formation on the radial section (A), The basic situation of agarwood formation on the cross-section (B), Agarwood yield (C), Oil content (D).
Forests 13 01618 g001
Figure 2. Leaf length, width and perimeter (a), Leaf length–width ratio (b), Leaf area (c), specific leaf weight (d) of Qi-Nan and OA. Different letters denote significant (p < 0.05) differences among OA and the five Qi-Nan clones in a one-way ANOVA, and the bar represents standard deviation (n = 5). “LL” leaf length; “LW” leaf width; “LP” leaf perimeter; “LR” leaf length-width ratio; “LA” leaf area; “SW” specific leaf weight.
Forests 13 01618 g002
Figure 3. Nutrient content (a) and leaf chlorophyll content (b) of Qi-Nan and OA. Different letters denote significant (p < 0.05) differences among OA and five Qi-Nan clones in a one-way ANOVA, and the bar represents standard deviation (n = 3). “N” nitrogen; “P” phosphorus; “K” potassium, “Ca” Chlorophyll a, “Cb” Chlorophyll b, “TC” total chlorophyll.
Forests 13 01618 g003
Figure 4. The net photosynthetic rate (a), transpiration rate (b), intercellular CO2 concentration (c) and stomatal conductance (d) in leaves of OA and Qi-Nan trees, at the light intensity of 1200 μmol·m−2·s−1. Different letters denote significant (p < 0.05) differences among OA and five Qi-Nan clones in a one-way ANOVA, the bar represents standard deviation (n = 5), “Pn” net photosynthetic rate; “Tr” transpiration rate; “Ci” intercellular CO2 concentration; “Cond” stomatal conductance.
Forests 13 01618 g004
Figure 5. Total non-structural carbohydrates: (a) Non-structural carbohydrate utilization (b), starch content (c), starch utilization (d), soluble sugars content (e) and soluble sugars increment rate (f) of Qi-Nan and OA. Different letters denote significant (p < 0.05) differences among OA and five Qi-Nan clones in a one-way ANOVA, the bar represents standard deviation (n = 3), “NSC” non-structural carbohydrates; “BD” before drilling; “AD” after one and a half years of drilling.
Forests 13 01618 g005
Figure 6. Starch grains in wood ray cells before (A,C) and after treatment (B,D). Cross-section of the stem (A,B), radial-section of the stem (C,D). “XR” xylem rays; “S” starch; “F” fiber; “V” vessel; “IP” interxylary phloem; “EO” essential oil.
Forests 13 01618 g006
Figure 7. Correlation analysis of various indicators in OA and Qi-Nan. Note: “YA” yield of agarwood; “AE” agarwood ethanol extract; “TNV” total number of vessel; “NSV” number of single vessels; “NVP” number of vessels in pairs; “VWT” vessel wall thickness; “VD” vessel diameter; “TAV” total area of vessel; “IPA” interxylary phloem area; “SUR” starch utilization rate; “SSUR” soluble sugar utilization rate; “RH” ray height; “RW” ray width; “RD” ray density; “RCL” ray cell length; “RCW” ray cell width; “RCWT” ray cell wall thickness; “SW” specific leaf weight; “Pn” net photosynthetic rate; “Cond” stomatal conductance; “Tr” transpiration rate; “Ci” intercellular CO2 concentration; “Ca” chlorophyll a, “Cb” chlorophyll b, “TCa + b” total chorophyll; “N” nitrogen; “P” phosphorus; “K” potassium content in leaves.
Forests 13 01618 g007
Table 1. The growth status of OA and Qi-Nan.
Aquilaria sinensisOAHGKCXGXYZT
Tree height (m)3.06 ± 0.263.09 ± 0.473.32 ± 0.283.57 ± 0.543.13 ± 0.423.58 ± 0.64
Base diameter at 20 cm above ground (cm)5.63 ± 0.445.49 ± 0.525.76 ± 0.336.00 ± 0.355.52 ± 0.495.80 ± 0.35
Notes: values are the means ± standard error (n = 15).
Table 2. Differences in xylem anatomical characteristics between five Qi-Nan clones and OA.
Aquilaria sinensisTNVNSVNVPVWTVDVATAV
OA23.00 ± 1.00a4.67 ± 2.08a7.33 ± 1.53ab9.61 ± 2.18d51.40 ± 6.46bcd2630.74 ± 393.35c60,886.58 ± 6576.12b
HG30.33 ± 5.69a6.67 ± 2.52a8.67 ± 1.15ab5.11 ± 0.93a59.22 ± 2.77d3629.67 ± 373.92d116,443.47 ± 10,983.00d
KC29.33 ± 11.93a6.33 ± 1.53a7.00 ± 3.61ab6.00 ± 1.89b51.88 ± 5.50cd3110.24 ± 432.15c96,219.33 ± 4612.71c
XG19.67 ± 0.58a5.00 ± 1.00a5.67 ± 0.58a7.17 ± 1.69c42.48 ± 2.84ab2193.02 ± 296.69ab44,511.03 ± 5202.55a
XY44.67 ± 8.33b6.33 ± 1.53a10.33 ±0.58b7.28 ± 1.35c44.72 ± 6.93abc2439.53 ± 503.52b122,569.73 ± 7665.42d
ZT60.67 ± 6.51c8.00 ± 2.65a17.00 ±2.65c5.10 ± 1.08a40.45 ± 2.69a1841.65 ± 277.38a110,664.33 ± 7402.35d
Aquilaria sinensisRHRWRDRCLRCWRCWTIPA
OA337.43 ± 141.20cd20.98 ± 3.60b23.43 ±3.36ab34.69 ± 1.23a25.91 ± 1.32a4.83 ± 0.05a71,592.19 ± 21,859.73a
HG242.13 ± 100.15a17.34 ± 4.37a23.33 ±1.51ab37.74 ± 3.12a22.54 ± 0.44a5.72 ± 0.33b200,308.43 ± 36,001.94c
KC364.84 ± 118.00d30.70 ± 9.01d22.83 ±2.14ab36.90 ± 3.48a25.05 ± 1.03a5.46 ± 0.34b111,693.37 ± 18,575.93b
XG303.49 ± 93.59bc25.86 ± 6.65c21.83 ± 1.17a35.27 ± 3.10a23.58 ± 0.45a6.71 ± 0.52c105,941.93 ± 6539.21b
XY288.38 ± 87.66ab26.40 ± 7.87c25.00 ± 1.41b36.24 ± 4.64a27.02 ± 0.64a5.50 ± 0.27b108,637.07 ± 4499.48b
ZT265.20 ± 96.79ab18.89 ± 3.66ab33.17 ± 2.64c35.01 ± 2.88a24.27 ± 1.56a5.41 ± 0.21b140,071.33 ± 14,646.67b
Notes: Means ± standard deviation (n = 5) were given and analyzed with a one-way ANOVA and least significant difference test. Different lowercase letters in the same column mean significant (p < 0.05) differences among OA and five Qi-Nan clones. “TNV” total number of vessels; “NSV” number of single vessel; “NVP” number of vessels in pairs; “VWT” vessel wall thickness; “VD” vessel diameter; “VA” vessel area; “TAV” total area of the vessel; “RH” ray height; “RW” ray width; “RD” ray density; “RCL” ray cell length; “RCW” ray cell width; “RCWT” ray cell wall thickness; “IPA” interxylary phloem area. Bold font indicates significant differences.
Publisher’s Note: MDPI stays neutral with regard to jurisdictional claims in published maps and institutional affiliations.

