Article

Multi-Directional Rather Than Unidirectional Northward-Dominant Range Shifts Predicted under Climate Change for 99 Chinese Tree Species

1
State Key Laboratory of Soil Erosion and Dryland Farming on the Loess Plateau, Northwest A&F University, Xianyang 712100, China
2
Institute of Soil and Water Conservation, Chinese Academy of Sciences and Ministry of Water Resources, Xianyang 712100, China
*
Authors to whom correspondence should be addressed.
Forests 2022, 13(10), 1619; https://doi.org/10.3390/f13101619
Submission received: 31 August 2022 / Revised: 25 September 2022 / Accepted: 28 September 2022 / Published: 2 October 2022
(This article belongs to the Section Forest Ecology and Management)

Abstract

:
Climate change has a profound impact on the distribution of species on Earth. At present, there are two contrasting views explaining the direction of species range shifts. One is a single poleward (northward in the Northern Hemisphere) view, while the other is a multi-directional view (e.g., westward, southward, and eastward). Exploring the universality of these two views has become a key focus in climate change ecology. Here, we study the habitat range shift velocity of 99 tree species in China under future climate change scenarios using a bioclimatic envelope model (also called species distribution model) and a climate velocity method. A Monte Carlo method is used to test the consistency between the range shift pattern and stochastic process, and confusion matrices and kappa values are calculated to evaluate the consistency between the bioclimatic envelope model and climate velocity method. The results indicate that the tree species in China are generally expected to shift northwards, with northwest and northeast directions accounting for a larger proportion. The northward-shifting species are mainly distributed in the east monsoon region of China, while the multi-directional shifting species are mainly distributed in the alpine and arid regions of China. The shift directions described by the bioclimatic envelope model are inconsistent with those described by the climate velocity method. The results imply that the tree species in China support the view of the northward shift pattern but, more specifically, should be considered in terms of a multi-directional northward shift pattern. The results also emphasize that the inter-species variation in climate tolerance has been largely ignored in physical-based climate velocity methods. The development of a biological and vector operation-based climate velocity indicator may be more useful in characterizing the range shifts of species, compared to existing physical and scalar operation-based climate velocity indicators. This study provides favorable evidence for the pattern of climate change-induced range shifts in China, as well as in Eastern Asia.

1. Introduction

Our Earth has been experiencing increased warming since the 19th century [1]; however, the global rainfall has not yet formed a significant upward trend [2]. For China, the warming range is slightly higher than the global average temperature, with a rate of 0.03–0.12°/decade [3]. Regionally, this warming trend is more obvious in northern China, especially in winter and spring [4]. It is generally agreed that the positive radiative forcing of greenhouse gases is the main cause of climate warming [3]. Accordingly, simulation results have shown that the temperature in China will increase significantly in the future, and rainfall will also present an increasing trend [3].
Climate change caused by global warming can have profound positive and negative impacts on the environment, biodiversity, and the sustainability of various ecosystems [5,6,7]; for example, a positive effect study has predicted that the suitable forest areas in China may increase by about 15% [8], whereas a negative study has shown, through simulation, that forest productivity will decline in China [9]. Climate change is expected to bring challenges regarding biodiversity conservation in China. For example, Li et al. [10] have studied the species loss risk of 111 tree species and stated that 18% of the species may be at risk of local extinction in the most conservative scenario; Guo et al. [11] have shown that about 40% of species in southern China will lose more than 50% of their habitat area.
Distributional shifts are considered one of three possible strategies to deal with climate change [12]. From this point of view, the key issue is whether species can keep pace with climate change or how fast they must go to catch up with climate change [13]. Chinese research on migration or range shifts has mainly focused on looking for evidence of elevation movement. For example, Du et al. [14] have suggested that the tree species in the forest line of Changbai Mountain had increased in the past; Dang et al. [15] and Shi et al. [16] have suggested that the forest line in Qinling Mountain had moved to a high altitude; Wang et al. [17] have suggested that the forest line in Tianshan Mountains has not moved upward within the past few decades; and Liang et al. [18] have suggested that the forest line in the Qinghai–Tibet Plateau has moved slowly upward. However, few tree species shift patterns have been observed under contemporary climate change in terms of the longitude and latitude gradient in China. Under the assumption that species have unlimited dispersal capacity, Chinese species are likely to shift multi-directionally. For example, ranges of Chinese sea buckthorn (Hippophae rhamnoides subsp. sinensis) [19] and black locust (Robinia pseudoacacia) [20] have been predicted to shift toward the northwest China. Alpine fir species have been predicted to shift in a multi-directional manner [21]. However, these studies were limited to specific species or groups. Whether such a projected shift pattern is universal still needs to be further studied.
Globally, there are two popular views on the direction of species range shift in response to climate change [22,23,24,25]. One view is that species shift poleward (northward for northern hemisphere) in response to climate warming, based on the hypothesis that temperature is the main factor controlling species distribution. Hereafter, we call this the classical view. For example, Chen et al. [24] have estimated that species have shifted unidirectionally northward at a speed of 1.69 km/year in recent decades. The other view is that species range shift should not strictly follow the northward direction but may follow other directions as well (e.g., southward, westward, and/or eastward). Hereafter, we call this the novel view. For example, VanDerWal et al. [25] have found that 464 Australian birds were projected to shift multi-directionally. Fei et al. [22] have suggested that 86 USA tree saplings were observed to shift multi-directionally over the last three decades. Lenoir and Svenning [26] have provided a synthesis of climate-related range shifts for plants and animals and suggested that the hotspots of research efforts on species range shift were located in Europe, North America, and Australia, while being weak in Asian regions.
There are three methods that may be used to explore the range shift of species in the geographical space composed of longitude and latitude gradients: (1) observation methods [27,28], (2) simulation methods [29], (3) and climate velocity methods [30,31]. Observation methods only rely on a large number of long time-series quadrat survey data to study the dispersal pattern of species, according to the relative positions of seedlings and adults in geographical space [27,28]. Simulation methods can be divided into two categories: one comprises bioclimatic envelope models (also named as species distribution model), which assume that species can occupy suitable habitats instantaneously [32]; the other is migration models, which consider the actual migration process of species. For the implementation of this kind of model, one must have a clear understanding of the dispersal distance parameters of species [33]. Climate velocity methods only rely on long time-series of climate data without species parameters and assume that species have similar responses to climate change [30]. These methods are also known as the climate exposure methods [31]. To date, these three approaches have been applied to the study of species range shift in forests and other ecosystems around the world [28,31,34]. For China, the lack of long time-series forest quadrat survey data limits the use of observation methods. The dispersal distance parameters of many trees in China have not been reported either, so the use of migration models is limited. Bioclimatic envelope models and climate velocity methods, however, do not depend on the biological parameters of species, so they have advantages for preliminary evaluation based on climate data as well as species occurrence data.
In order to answer in which direction the habitat range of Chinese trees will shift under future climate conditions—that is, is it in line with the classical view or the novel view?—we used both a bioclimatic envelope model and a climate velocity method to study the range shift direction and speed of 99 tree species in China under various climate change scenarios. We propose two hypotheses: (1) as some species have been projected to shift northward, we propose the hypothesis that China’s tree species are expected to shift northward, conforming to the classical view, and (2) as the climate velocity method does not consider differences in the climate tolerance of species, in comparison to the bioclimatic envelope model, we hypothesize that the results of the two methods should be expected to be inconsistent. Answering these questions will help us to understand the habitat range shift pattern and dynamics of tree species in China as well as enable the public to obtain an intuitive understanding of the impact of climate change on species distribution.

2. Materials and Methods

2.1. Study Region

China has a wide variety of climate and topography types [35,36]. It is one of the most biodiversity-rich countries in the world [37]. The annual average temperature decreases gradually from south to north and from east to west (Figure 1A). Summer monsoons greatly dominate the climate of the country [38]. The oceanic monsoon season arrives earlier and leaves later in the southeast than in the northwest, and thus, the northwest has a shorter rainy season and is more under the influence of cold and dry winter winds than the south. Precipitation decreases from east to west due to the increasing distance from the sea (Figure 1B). Three climatic regions exist in China: namely, humid, semi-arid, and arid climates. The topography of China is a three-step staircase from west to east (Figure 1C). According to these characteristics, China’s climate region can be roughly divided into three regions: namely, the monsoon region, the arid region, and the alpine region (Figure 1D).

2.2. Species Occurrence Data

Typical natural and introduced tree species that have become naturalized in China were selected for the study, as they have a high coverage rate and play a key role in the stabilization of forest ecosystems. Species occurrence data were obtained from a 1:1,000,000 Vegetation Atlas of China (polygon format) [39], which was generated through robust field investigation and is the most systematic and comprehensive data set for Chinese vegetation. This data source has been widely used to study the climatic niche character of typical tree species [40], as well as the extinction risk of these species [10] and prioritization of conservation [41]. A feature-to-raster tool was used to convert the polygons into a grid format, with a cell size of 10 arc-min, using ArcGIS 10.6. Here, records of tree species greater than 15 points after verification were collected. The reason for using 15 threshold points is based on the trade-off between the number of species involved and the minimum recording requirements of species. In this study, only species were retained, not varieties or subspecies, as increasing these species may lead to increasing the weight of some groups. Finally, 99 species were obtained; their names, as well as records, are provided in Supplementary File S1 (Excel file).

2.3. Climatic Variables and Layers

A set of 13 climatic variables were used to characterize species climatic niches for China (Table 1). These variables were selected from the BIOCLIM system (Commonwealth Scientific and Industrial Research Organisation, CSIRO, Australia) [42], the Holdridge life zone system (University of Michigan, Ann Arbor, MI, USA) [43], and the Kira indices (Kyoto University, Kyoto, Japan) [44]. The three sources of climatic variables have been widely used in research on the relationships between species/vegetation and climate at the regional or global scale [45]. Here, we wish to describe the climate niches of species, namely, their Grinnell niches. As the objective of this study is to assess climate change impacts, if other small and medium scale factors (Elton niche) were included, the role of the climate may be confused, thus making the research goal unclear. We did not include terrain factors, as terrain is not a direct factor affecting species distribution (without direct biological significance mechanism and process), and its role was mainly as a proxy index of temperature.
The used climatic layers were obtained from the WorldClim database [46], with a spatial resolution of 10 arc-min. The climate layers were generated on the basis of thin-plate smoothing splines using the mean values of the latitude, longitude, altitude, and monthly temperature and precipitation data recorded by meteorological stations over 50 years (1950–2000) [47]. The future climatic layers were obtained by averaging seven general circulation models, including the BCC-CSM1-1 (BBC, Beijing, China), CCSM4 (NCAR, Boulder, CO, USA), GISS-E2-R (GISS, New York, NY, USA), HadGEM2-AO (MOHC, Exeter, UK), IPSL-CM5A-LR (IPSL, Guyancourt, France), MIROC-ESM-CHEM (NIES, Tokyo, Japan), and NorESM1-M (NCC, Oslo, Norway). In the current study, the time period of 2061–2080 (represented as the 2070s) was selected as the target for future climate estimation, and four representative concentration pathways (RCPs) were considered in order to deal with the uncertainty of future climate change [1]: RCP2.6, RCP4.5, RCP6.0, and RCP8.5. The CO2 concentration increases from 390.5 ppm (2011) to 437.5 ppm in RCP2.6, to 524.3 ppm in RCP4.5, to 549.8 ppm in RCP6.0, and to 677.1 ppm in RCP8.5 by the year 2070. It is noteworthy that future temperature, precipitation, and CO2 emissions are projections, not pre-determined outcomes. The simulated annual mean temperature will increase by 1.81 °C, 2.81 °C, 2.77 °C, and 4.24 °C, and the simulated annual precipitation will increase by 28 mm, 41 mm, 24 mm, and 48 mm for China, under the respective scenarios.

2.4. Simulation of Species Ranges and Evaluation Processes

Current species distributions and climate conditions were used to define the climatic niches of tree species, which were then used to project their climatically suitable distribution under climate layers and future climate layers. In this way, we could predict species range shifts. By far, the most common approach for simulation of species range shifts is the use of bioclimatic envelope methods, as they mirror recent advances in the availability and access of geospatial data for both species occurrences and climatic variables, analysis platforms, and tools. Here, MaxEnt (maximum entropy model) was used to simulate and project the spatial distributions of the trees under current climate conditions and the four future scenarios [48], as it requires fewer records [49] than Bioclim [42], genetic algorithms [50], and other algorithms [51]. MaxEnt is a machine learning algorithm written in Java that can be used on all modern computing platforms [52]. The software is freely available on the Internet (https://biodiversityinformatics.amnh.org/open_source/maxent/; accessed on 1 May 2021).
MaxEnt applies five different feature constraints (linear, quadratic, product, threshold, and hinge) to environmental variables—namely, according to the maximum entropy principle—in order to estimate the species distribution probability. The convergence threshold (10−5), maximum number of iterations (500), and 10,000 global background points were used to run the MaxEnt model. The logistic format of the suitability map was set as the output of MaxEnt. The suitability was estimated by including environmental variables, with values ranging from 0 to 1. The predictive performance of the MaxEnt models was evaluated by the area under the receiver operator characteristic curve (AUC) [53], which avoids the supposed subjectivity in the threshold selection process. The criteria for judgment were as follows: poor, 0.5–0.6; fair, 0.6–0.7; good, 0.7–0.8; very good, 0.8–0.9; and excellent, 0.9–1.0.
The results for each species were obtained in terms of tree probability maps, with values ranging from 0 (the lowest probability) to 1 (the highest probability). The optimal threshold was calculated based on the criteria of maximum sensitivity and specificity for each species and was used to convert the probability map into a binary (0/1) map, where one represents a suitable habitat and zero represents an unsuitable habitat. The contributions of climatic variables to the habitat suitability of trees was tested using the jackknife method included in the MaxEnt software [54]. A jackknife test (i.e., systematically leaving out each variable) was used to evaluate the importance of climatic factors in determining the potential distribution of species. Climatic variables with a contribution percentage greater than 8% were considered to be important climatic factors (the value is the average size, assuming that the 13 factors are equally important).

2.5. Calculation of Species Velocity and Hypothesis Testing

Species velocity (i.e., species range shift velocity) is the speed and direction necessary to track (or keep up with) future climate change. It assumes perfect unlimited dispersal ability for species, such that there is no lag with the projected climate change [19,28,55]. This metric is dependent on the sensitivity of individual species, as reflected in part by their climatic niche width [56]. Here, the centroids for each tree species range under current and future climate change scenarios were calculated using SDMTools [25]. The distance and azimuth of the range centroid shift was calculated using the distance function in SDMTools [25]. The species velocity is obtained as the distance between the range centroids divided by the time taken. This method can be termed the “global” velocity, with units of kilometers per year. The considered time period was 95 years between the present (1950–2000) and future scenarios (2060–2080). We divided the azimuth into eight direction classes (see Table 2 for specific standards) and then counted the number of species whose azimuth belonged to each class. We also calculated the mean speed in each direction under each RCP scenario as well as with respect to the three climate regions (monsoon region, arid region, and alpine region).
In order to test the first hypothesis (whether China’s tree species should be expected to conform to the novel or classical view), we used the Monte Carlo method to construct a null model. That is, 80% of the 99 species (79 species) were randomly selected without replacement, and the shift directions of these selected species were assessed. This process was repeated 100 times. The null model was defined as the probability of shift direction in all eight directions being equal. A T-test was used to analyze whether the observed northward shift was significantly greater than the null value. We divided the northward shift into three categories for testing: (1) unidirectional northward (N), (2) multi-directional northward (NW + NE), and (3) northward (N + NW + NE). In order to compare the consistency of shift directions under the four climate scenarios, we calculated confusion matrices and corresponding kappa values in order to evaluate the consistency in shift direction between each of the four climate scenarios for each of the tree species [57]. Generally, 0 ≤ kappa ≤ 1, although negative values do occur occasionally. The kappa statistic is a statistical measure of inter-rater reliability for categorical variables. In fact, it is almost synonymous with inter-rater reliability [58,59]. The consistency evaluation criteria are provided in Table 3.

2.6. Calculation of Climate Velocity and Hypothesis Testing

Climate velocity has been suggested as a useful metric for evaluating the exposure of species to climate change [30,55,60]. It represents the initial rate at which species must migrate over the surface of the Earth to maintain constant climate conditions [56]. The climate velocity was derived by dividing the temporal rate of projected climate change, in units of °C per year (e.g., the magnitude of change over time), by the current gradient of climate variability, measured in °C per kilometer across a spatial neighborhood (e.g., magnitude of change over space) [55,56]. This method has been termed the “local” velocity, with units of kilometers per year, as it only considers spatial variability within the immediate neighborhood of a location [56]. Spatial gradients were computed for each map cell using the weight average technique in a nine-cell kernel (i.e., the eight-neighbor rule) [30]. The temporal gradient was computed as the difference in the consensus climatic value between present and future scenarios, in units of °C per year, for each map cell. The climate velocity vectors were calculated by follows [31,60]:
v i = ( d c / d t d c / d x , d c / d t d c / d y )
where dc/dt denotes the change in climate variable per unit time (temporal trend) and dc/dx (or dc/dy) is the change in the same variable per unit of distance (spatial gradient). The temporal climate change trend is calculated based on current and future climate scenarios. The spatial gradient for a given variable was calculated using a 3 × 3 grid cell neighborhood, as this maximized the effective spatial resolution of the analysis [30]. The direction of the spatial gradient was calculated as the vector sum of the latitudinal and longitudinal gradients and its associated vector angle [60]. We used the median climate velocity value of each climatic layer to represent the average state of the velocity of climate change. The reason for using the median method is that extreme values will occur in plain areas, due to the occurrence of infinitely small spatial gradients, even zero values. Due to the heterogeneity of the local terrain, the shift direction should have great local variability. Therefore, the shift direction was re-calculated into a map with a coarse resolution of 4° × 4°, based on 10 arc-min grid cells, in order to illustrate the climate velocity in China. Overall, spatial gradients in coarse resolution were calculated as the vector sum of the N–S and E–W gradients, with the associated vector angle giving the direction of the gradient [30,60]. In order to test the second hypothesis—whether the results obtained by these two methods were consistent—we used a confusion matrix and corresponding kappa value to evaluate the consistency in shift direction between species velocity and climate velocity under the four climate scenarios [57].

3. Results

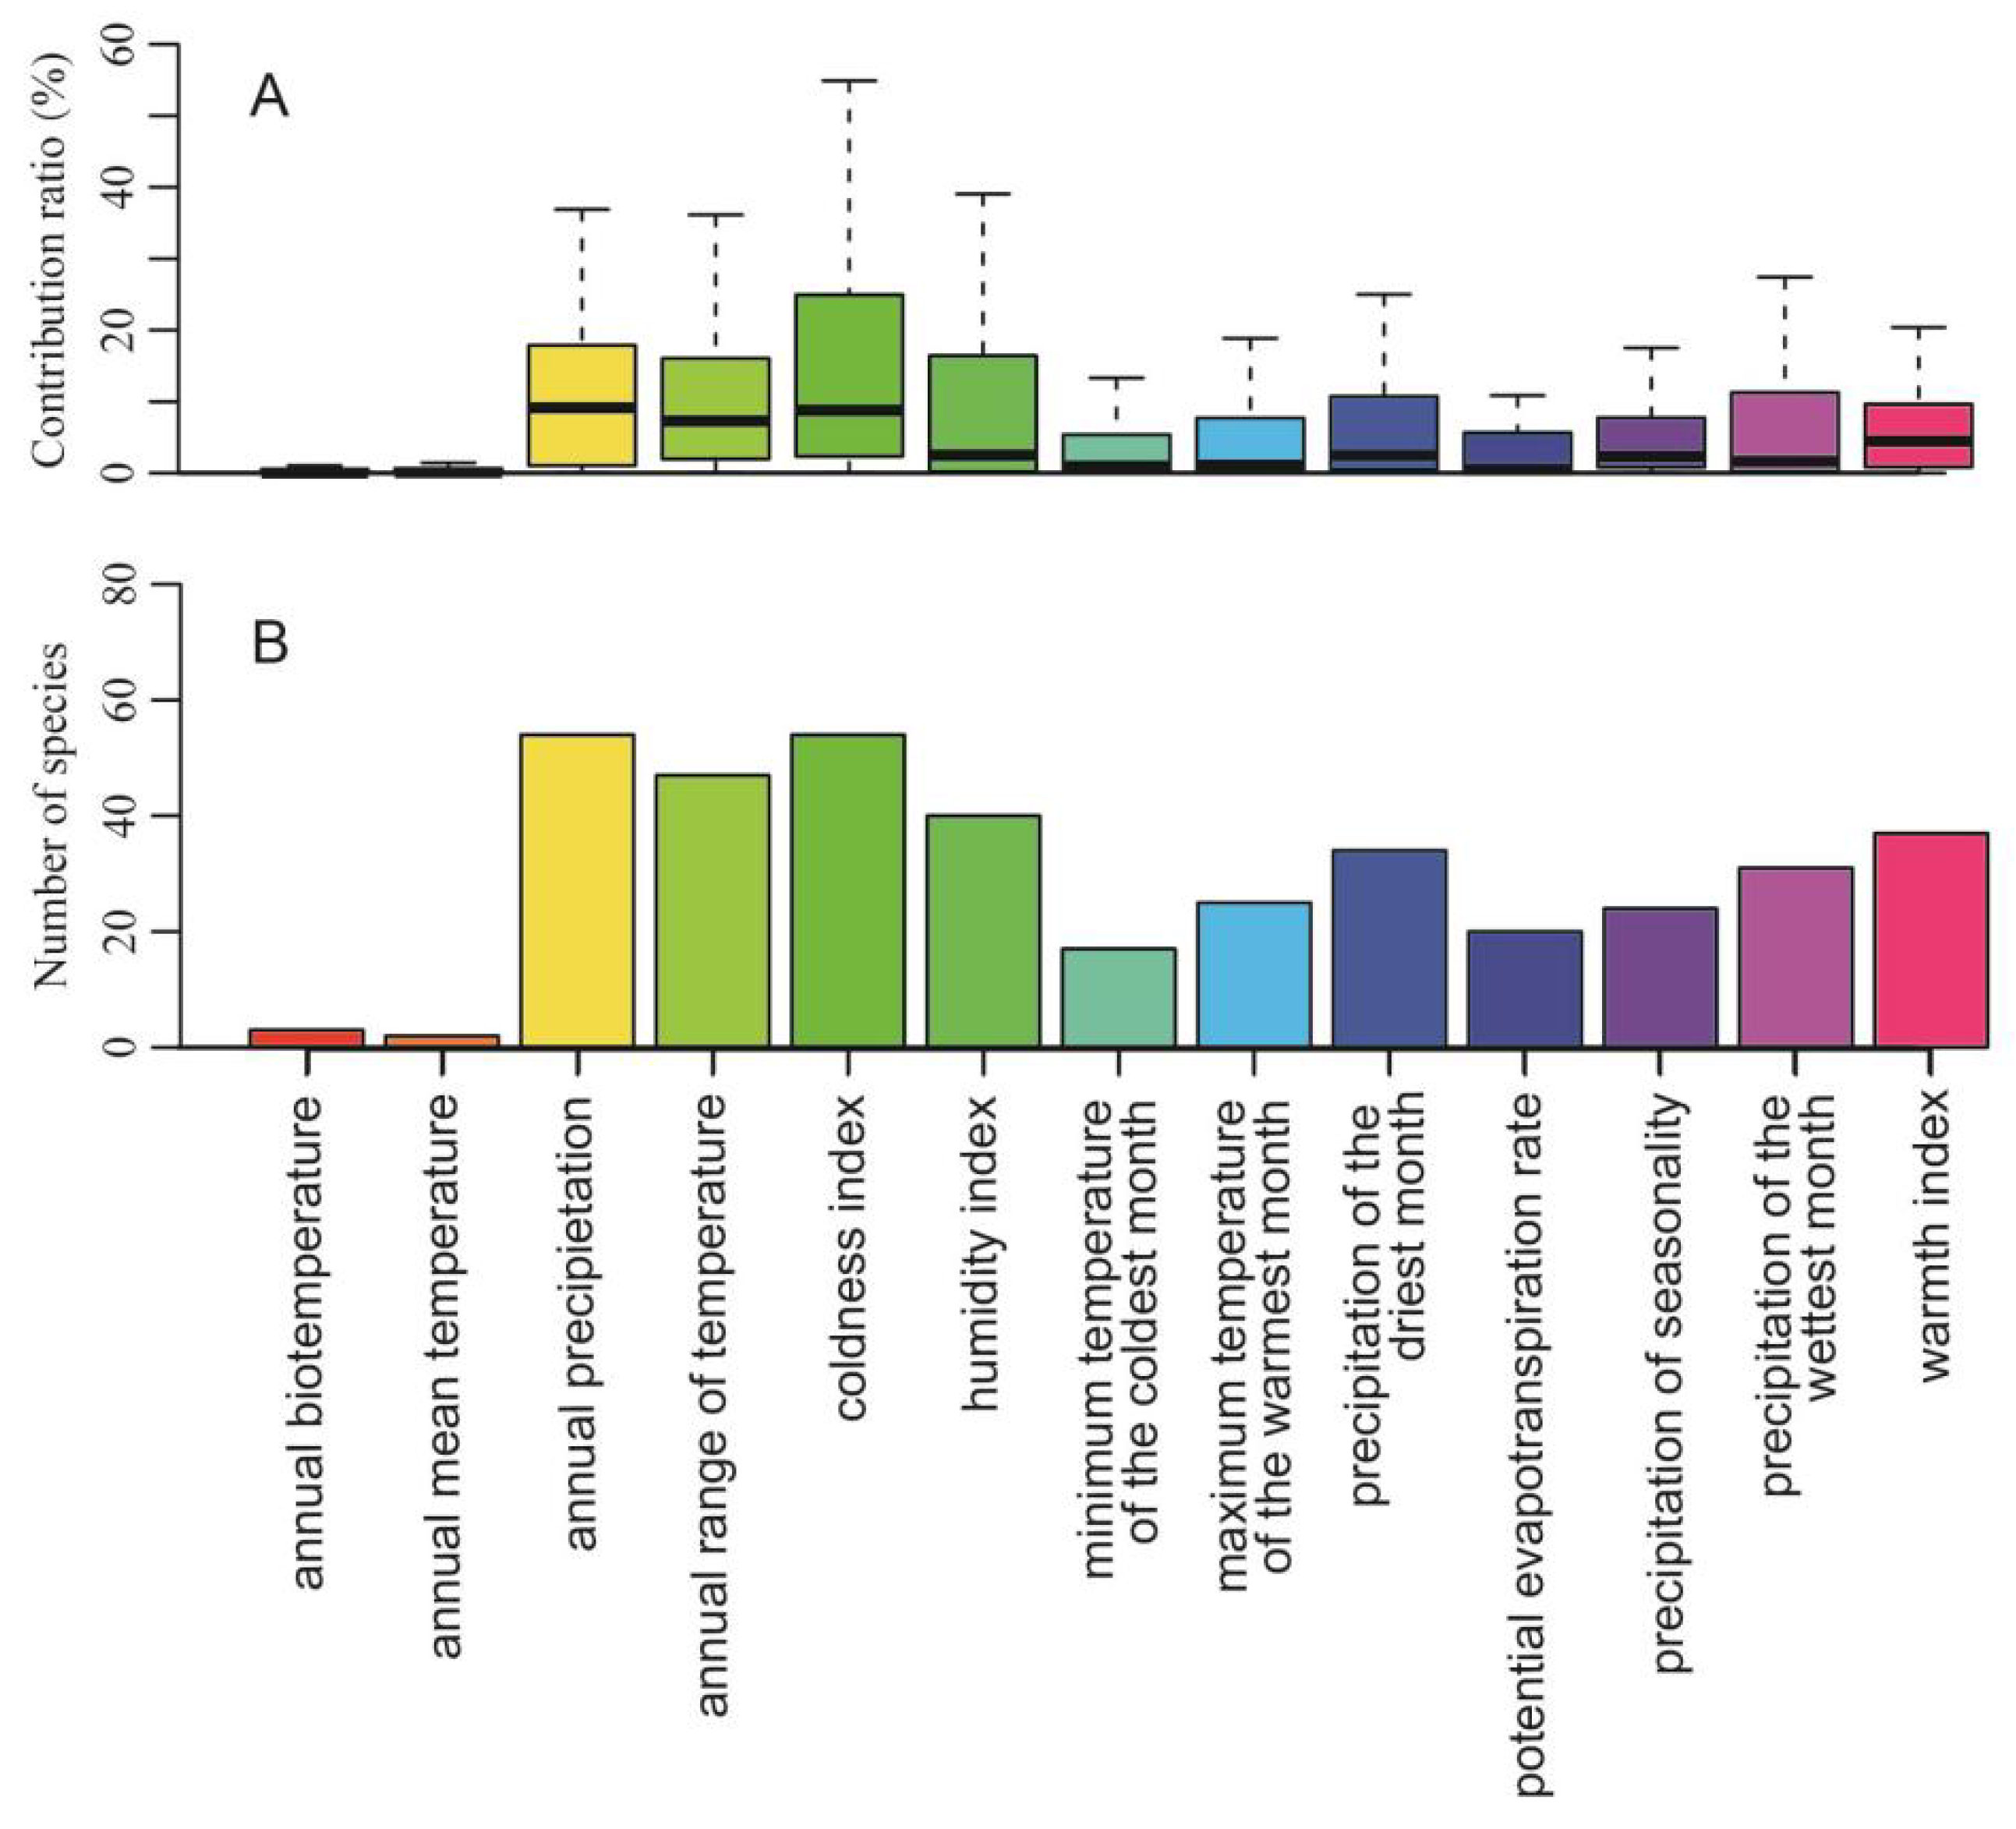
3.1. Model Performance and Important Climatic Variables

The average AUC value for the 99 tree species predicted by MaxEnt simulation was 0.96 ± 0.05, which indicated that the MaxEnt model could accurately simulate the habitat suitability of trees in China (see Supplementary File S1 for the specific simulation results). The average values of their importance are shown in Figure 2A. The coldness index, annual precipitation, humidity index, and annual temperature range were the four most important variables in determining the distribution of trees in China. The distribution frequency of important climatic variables, based on the threshold of 8%, is shown in Figure 2B. From the figure, it can be seen that the number of most species were also related to the coldness index, annual precipitation, humidity index, and annual range of temperature. Meanwhile, both methods demonstrated that AMT has relatively little influence on the distribution of tree species in China.

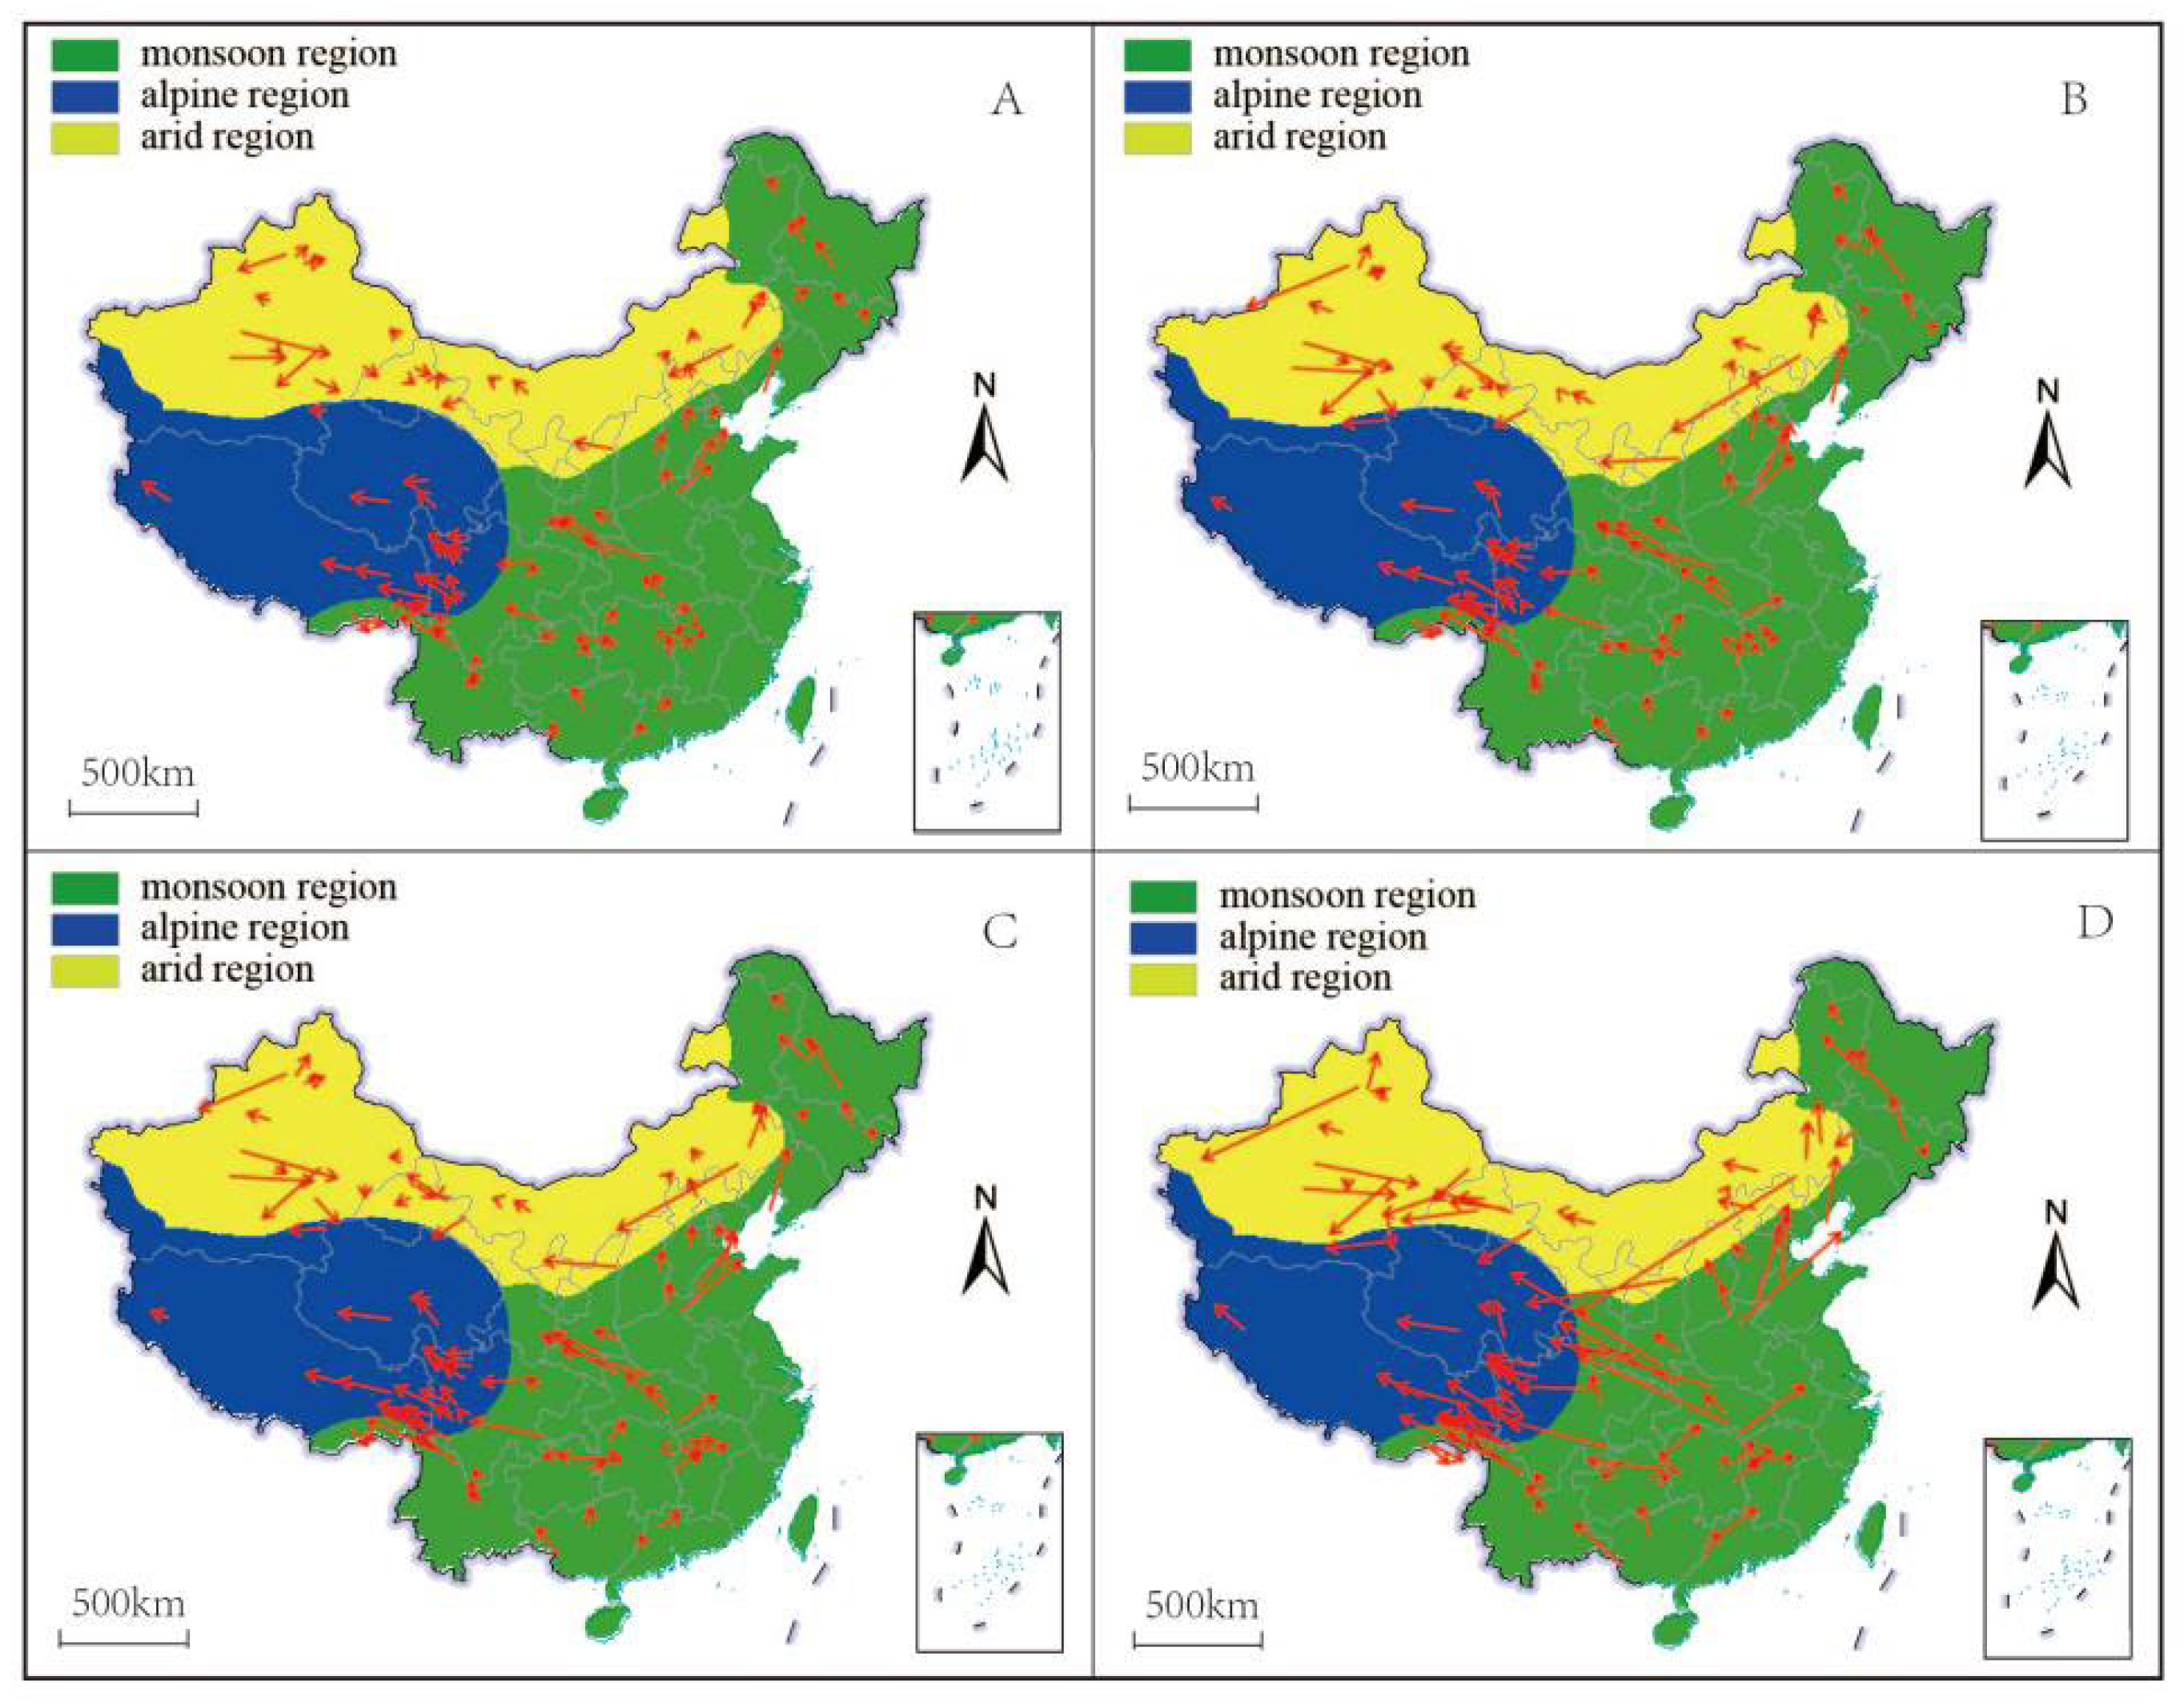
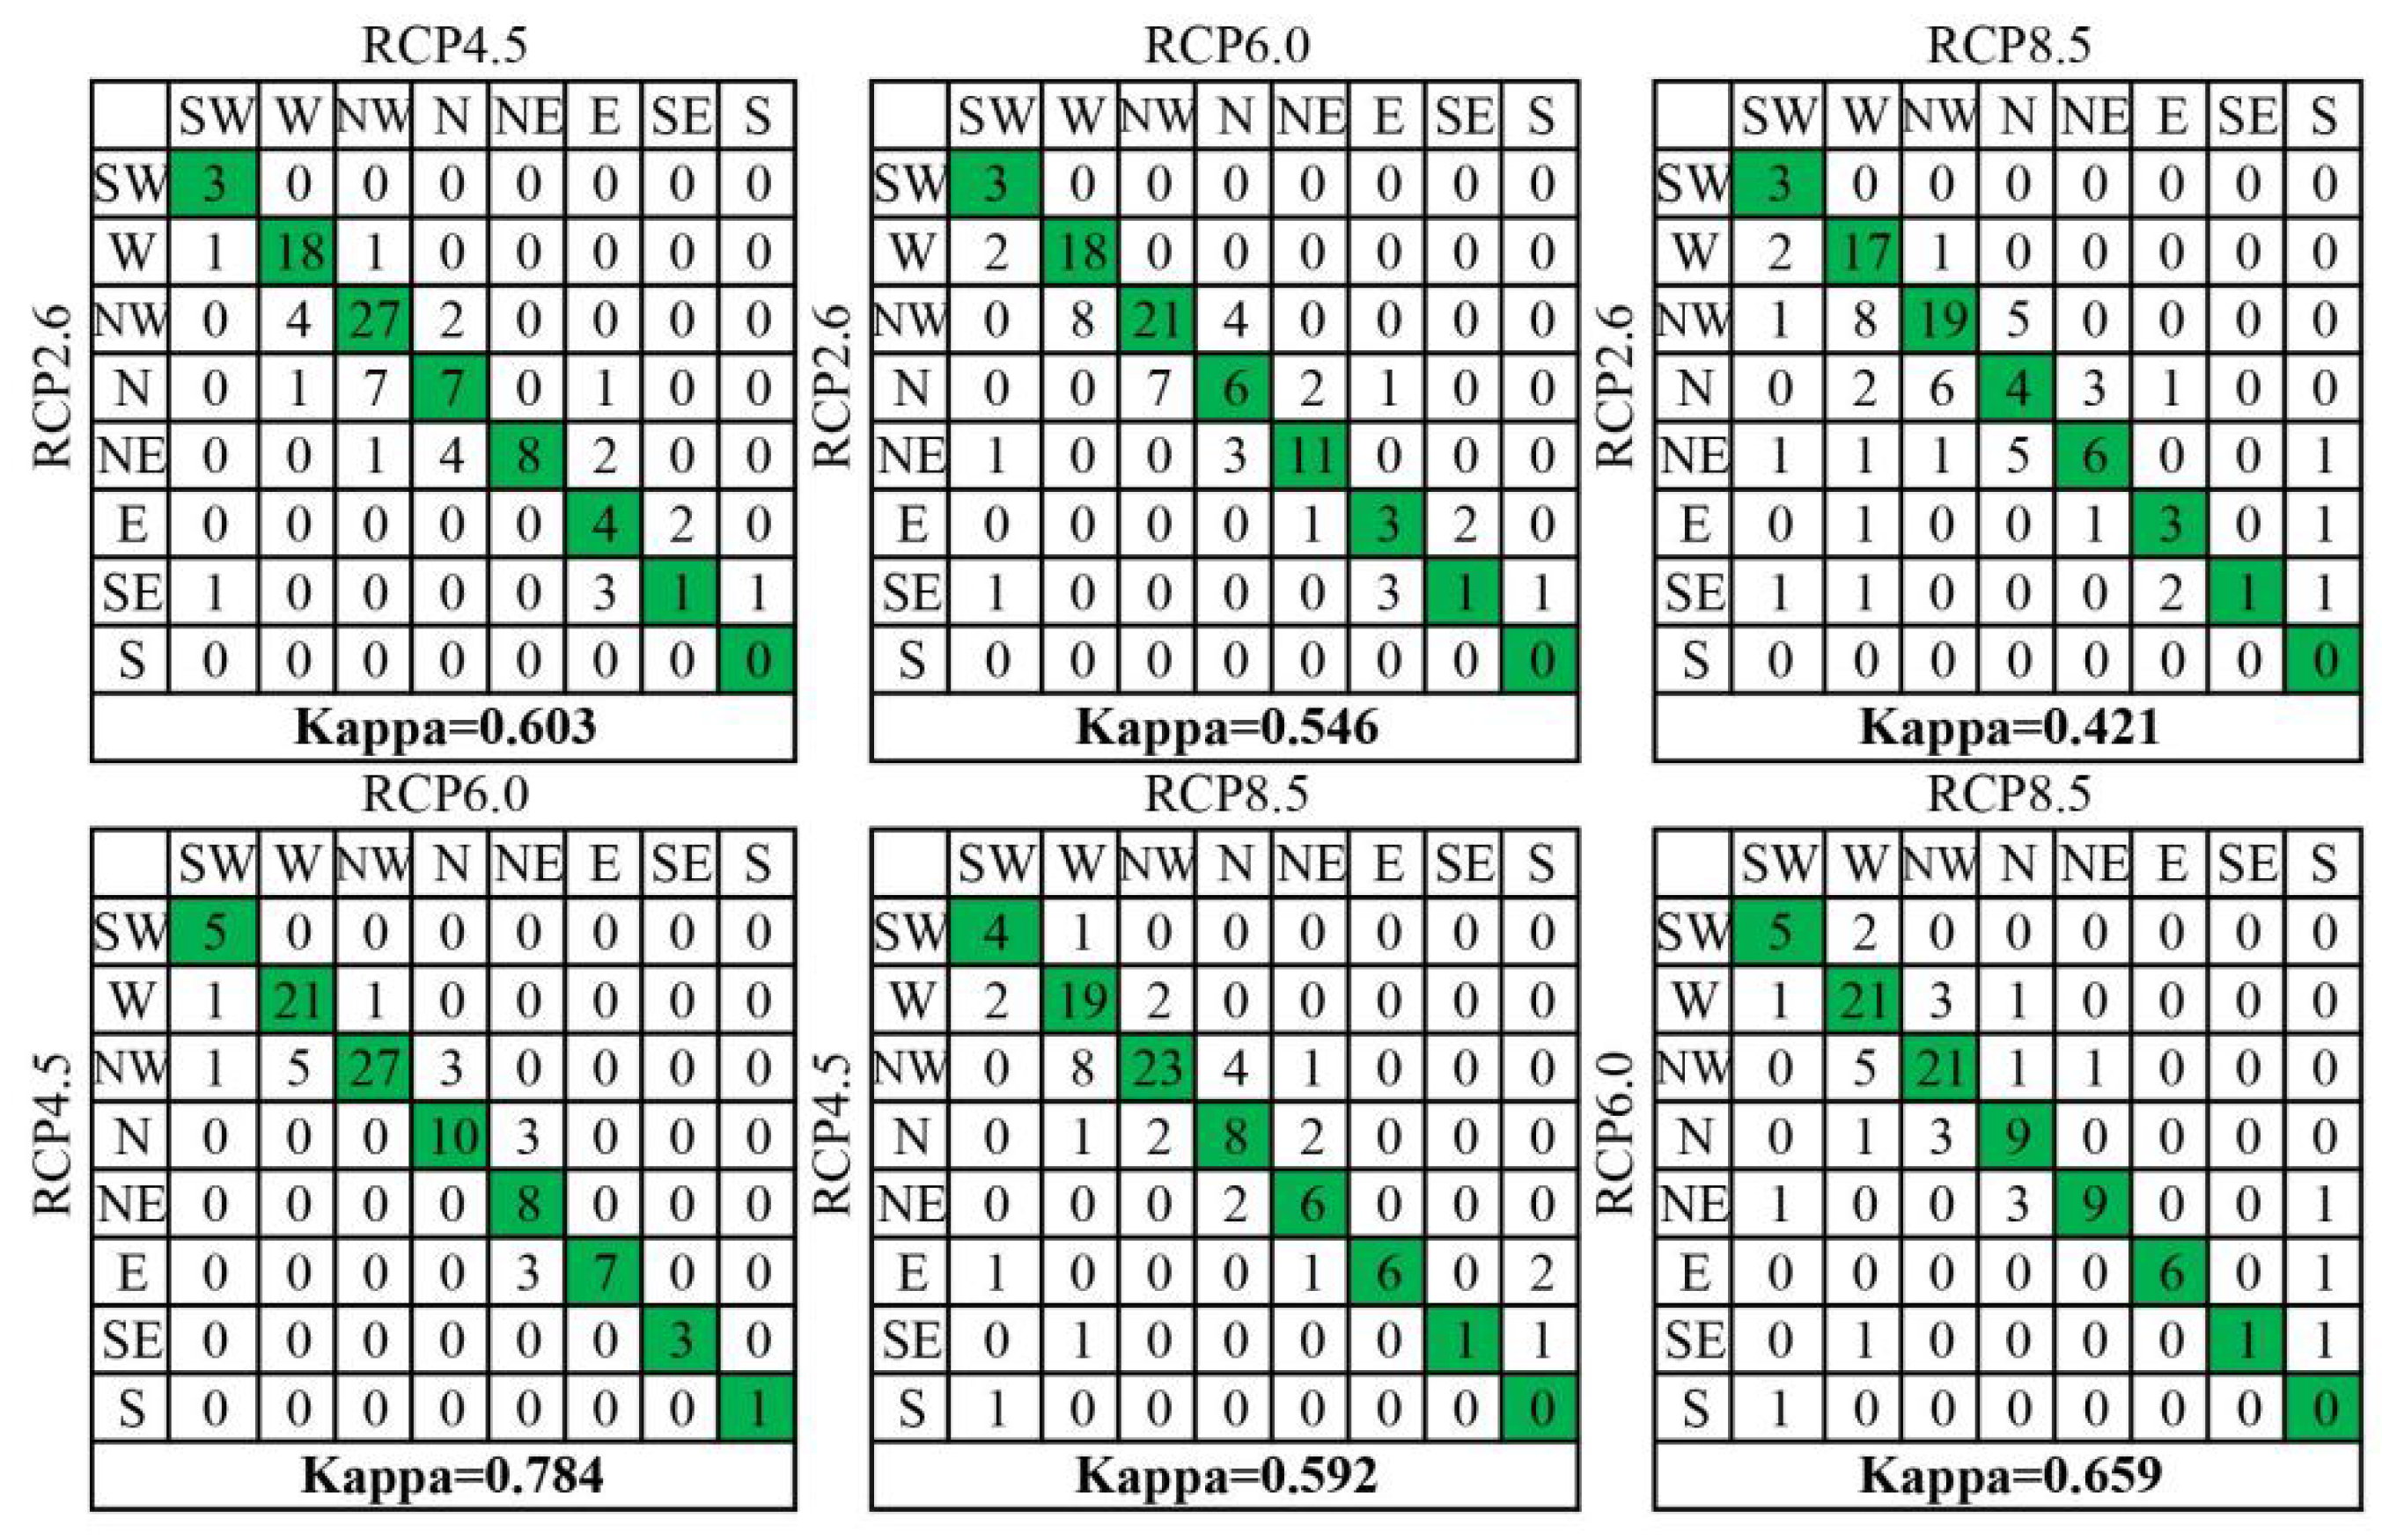
3.2. Velocity of Species Habitat Range Shifts

As shown in Figure 3 and Table 4, the shifts in the species habitat range of Chinese trees were predominantly multi-directional. The statistics indicated that, depending on the RCP scenario, 51–64 species presented northward shifts (N + NE + NW), but only 13 to 16 showed unidirectional northward shifts (N), of all 99 tree species. Westward shifts became increasingly common under the more pessimistic emissions scenarios. Furthermore, unidirectional westward shifts and northwesterly shifts were of higher magnitude than unidirectional northward shifts, regardless of the emissions scenario. By averaging the speed of each species under each directional band under the four RCP scenarios, the shift speed in the north, south, and southeast directions was relatively small, while those in the west, southwest, and east directions were at a high level. The average speed of range shift was as low as 0.71 km/year in the SE direction under RCP2.6 to as high as 5.65 km/year in the SW direction under RCP8.5.
Moreover, the species shifting to the north were mainly concentrated in the monsoon region, followed by a small number in the arid region, while almost no tree species in the alpine region strictly shifted to the north (Table 5). In terms of multi-directional range shifting, species in the monsoon region were mainly shifting to the northwest and northeast, species in the alpine region were mainly shifting to the west and northwest, whereas species in the arid region had similar shifting performance in all directions (Table 5). Among the species shifting in the western direction, the shift speed was generally fast in both low- and high-concentration paths. Species shifting to the northwest generally shifted faster under high-concentration paths. Among all species, the places with fast shift speed were mainly in the west, east, and northwest of China. Species generally shifted faster to the east in arid areas than in other regions. This indicates that the shifting speed also presented regional differences; however, the difference was smaller across geographical scale than that in the time scale under different climate change scenarios (Table 5).
The range shift direction consistency between climate scenarios is shown in Figure 4. The confusion matrices indicated that 85 out of 99 species showed similar shift directions when comparing RCP4.5 and RCP6.0, while only 53 species showed similar directions between RCP2.6 and 8.5. Although the consistency varied greatly, the Kappa values of all pairs were greater than 0.4, indicating at least a moderate degree of matching. Among them, RCP4.5–RCP6.0 had the highest matching degree, reaching kappa = 0.784, indicating substantial agreement. RCP2.6–RCP4.5 and RCP6.0–RCP8.5 also achieved substantial similarity, with kappa greater than 0.6. RCP2.6 and RCP8.5 presented the greatest difference, with the lowest kappa (0.421), as the two extreme climate change scenarios represented the most pessimistic and optimistic concentration pathways, respectively.
The test results regarding whether the occurrence probability of the shift direction was significantly greater than the random probability are shown in Figure 5. It can be seen that the probability of unidirectional northward shift (N) was significantly higher than that of random distribution (t = 21.52, df = 99, p-value < 0.05), the probability of multi-directional northward shift (NW + NE) was significantly higher than that of random distribution (t = 94.069, df = 99, p-value < 0.05), and the overall northward shift (N + NW + NE) probability was also significantly higher than that of random distribution (t = 167.47, df = 99, p-value < 0.05). These results indicate that species will predominantly shift northward, which means that our study supports the first hypothesis; that is, the range shift of most of the trees can be explained by the classical view (northward), rather than the novel view (i.e., westward, eastward, or southward).

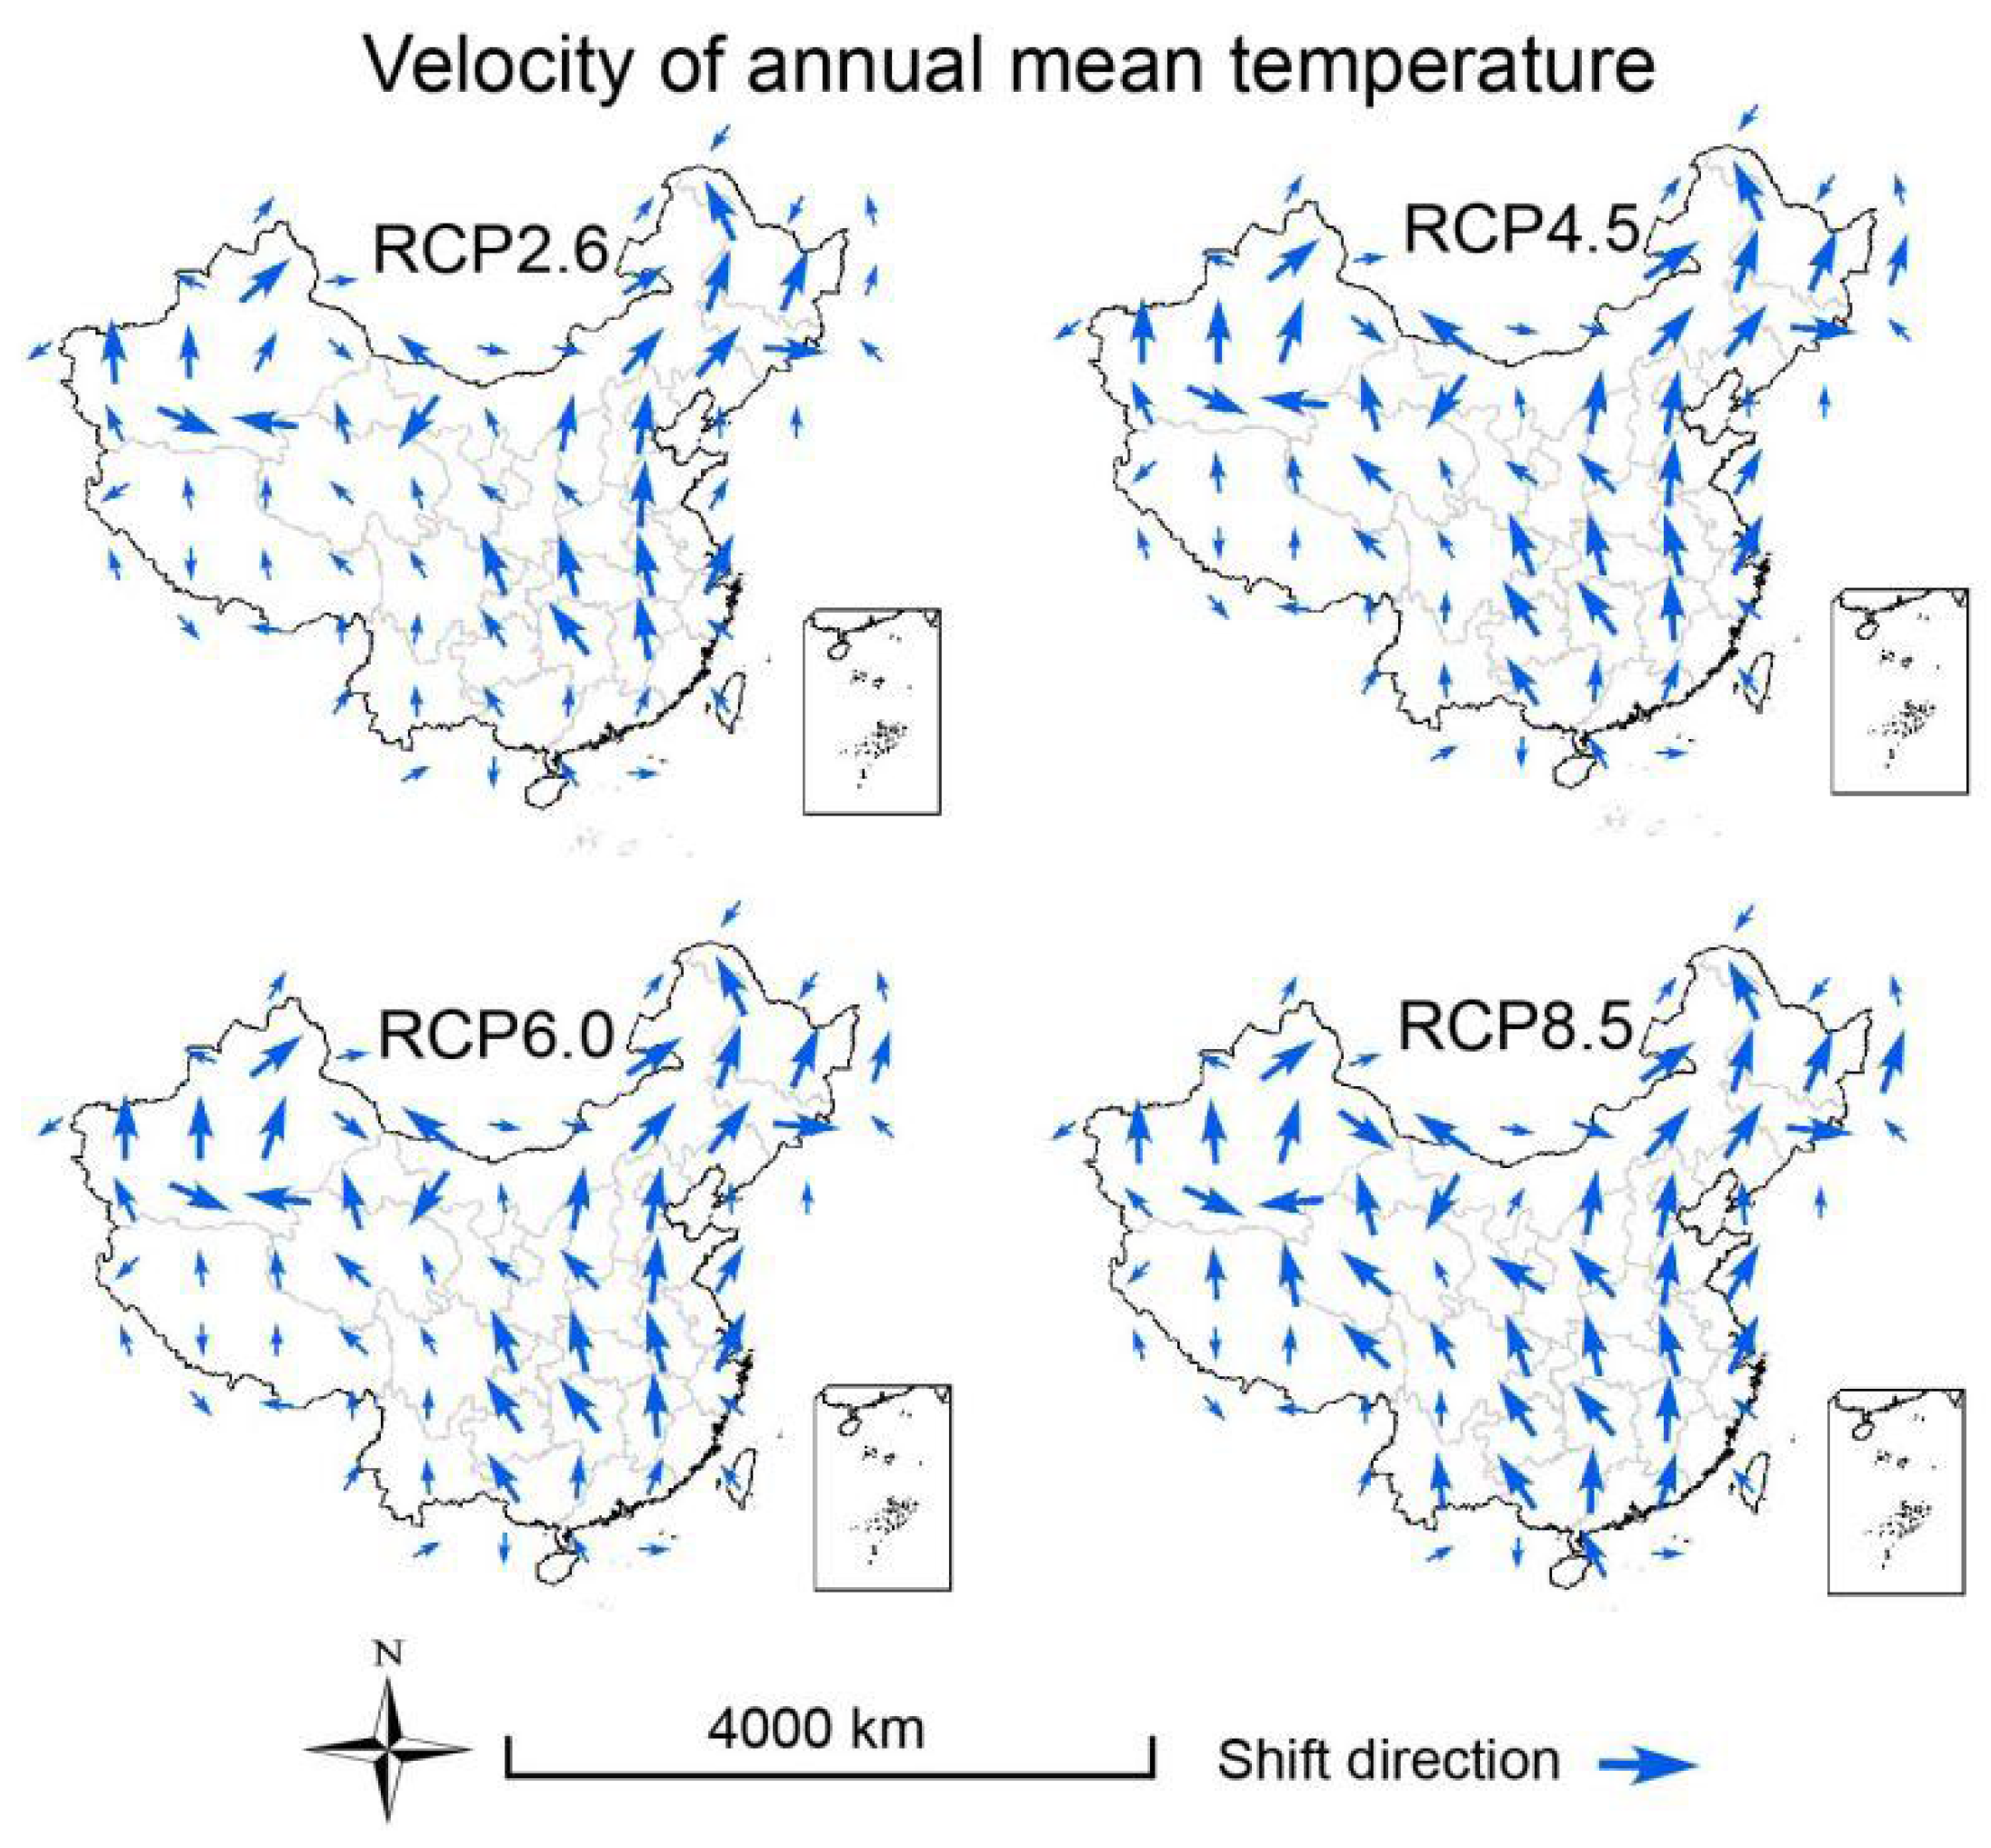
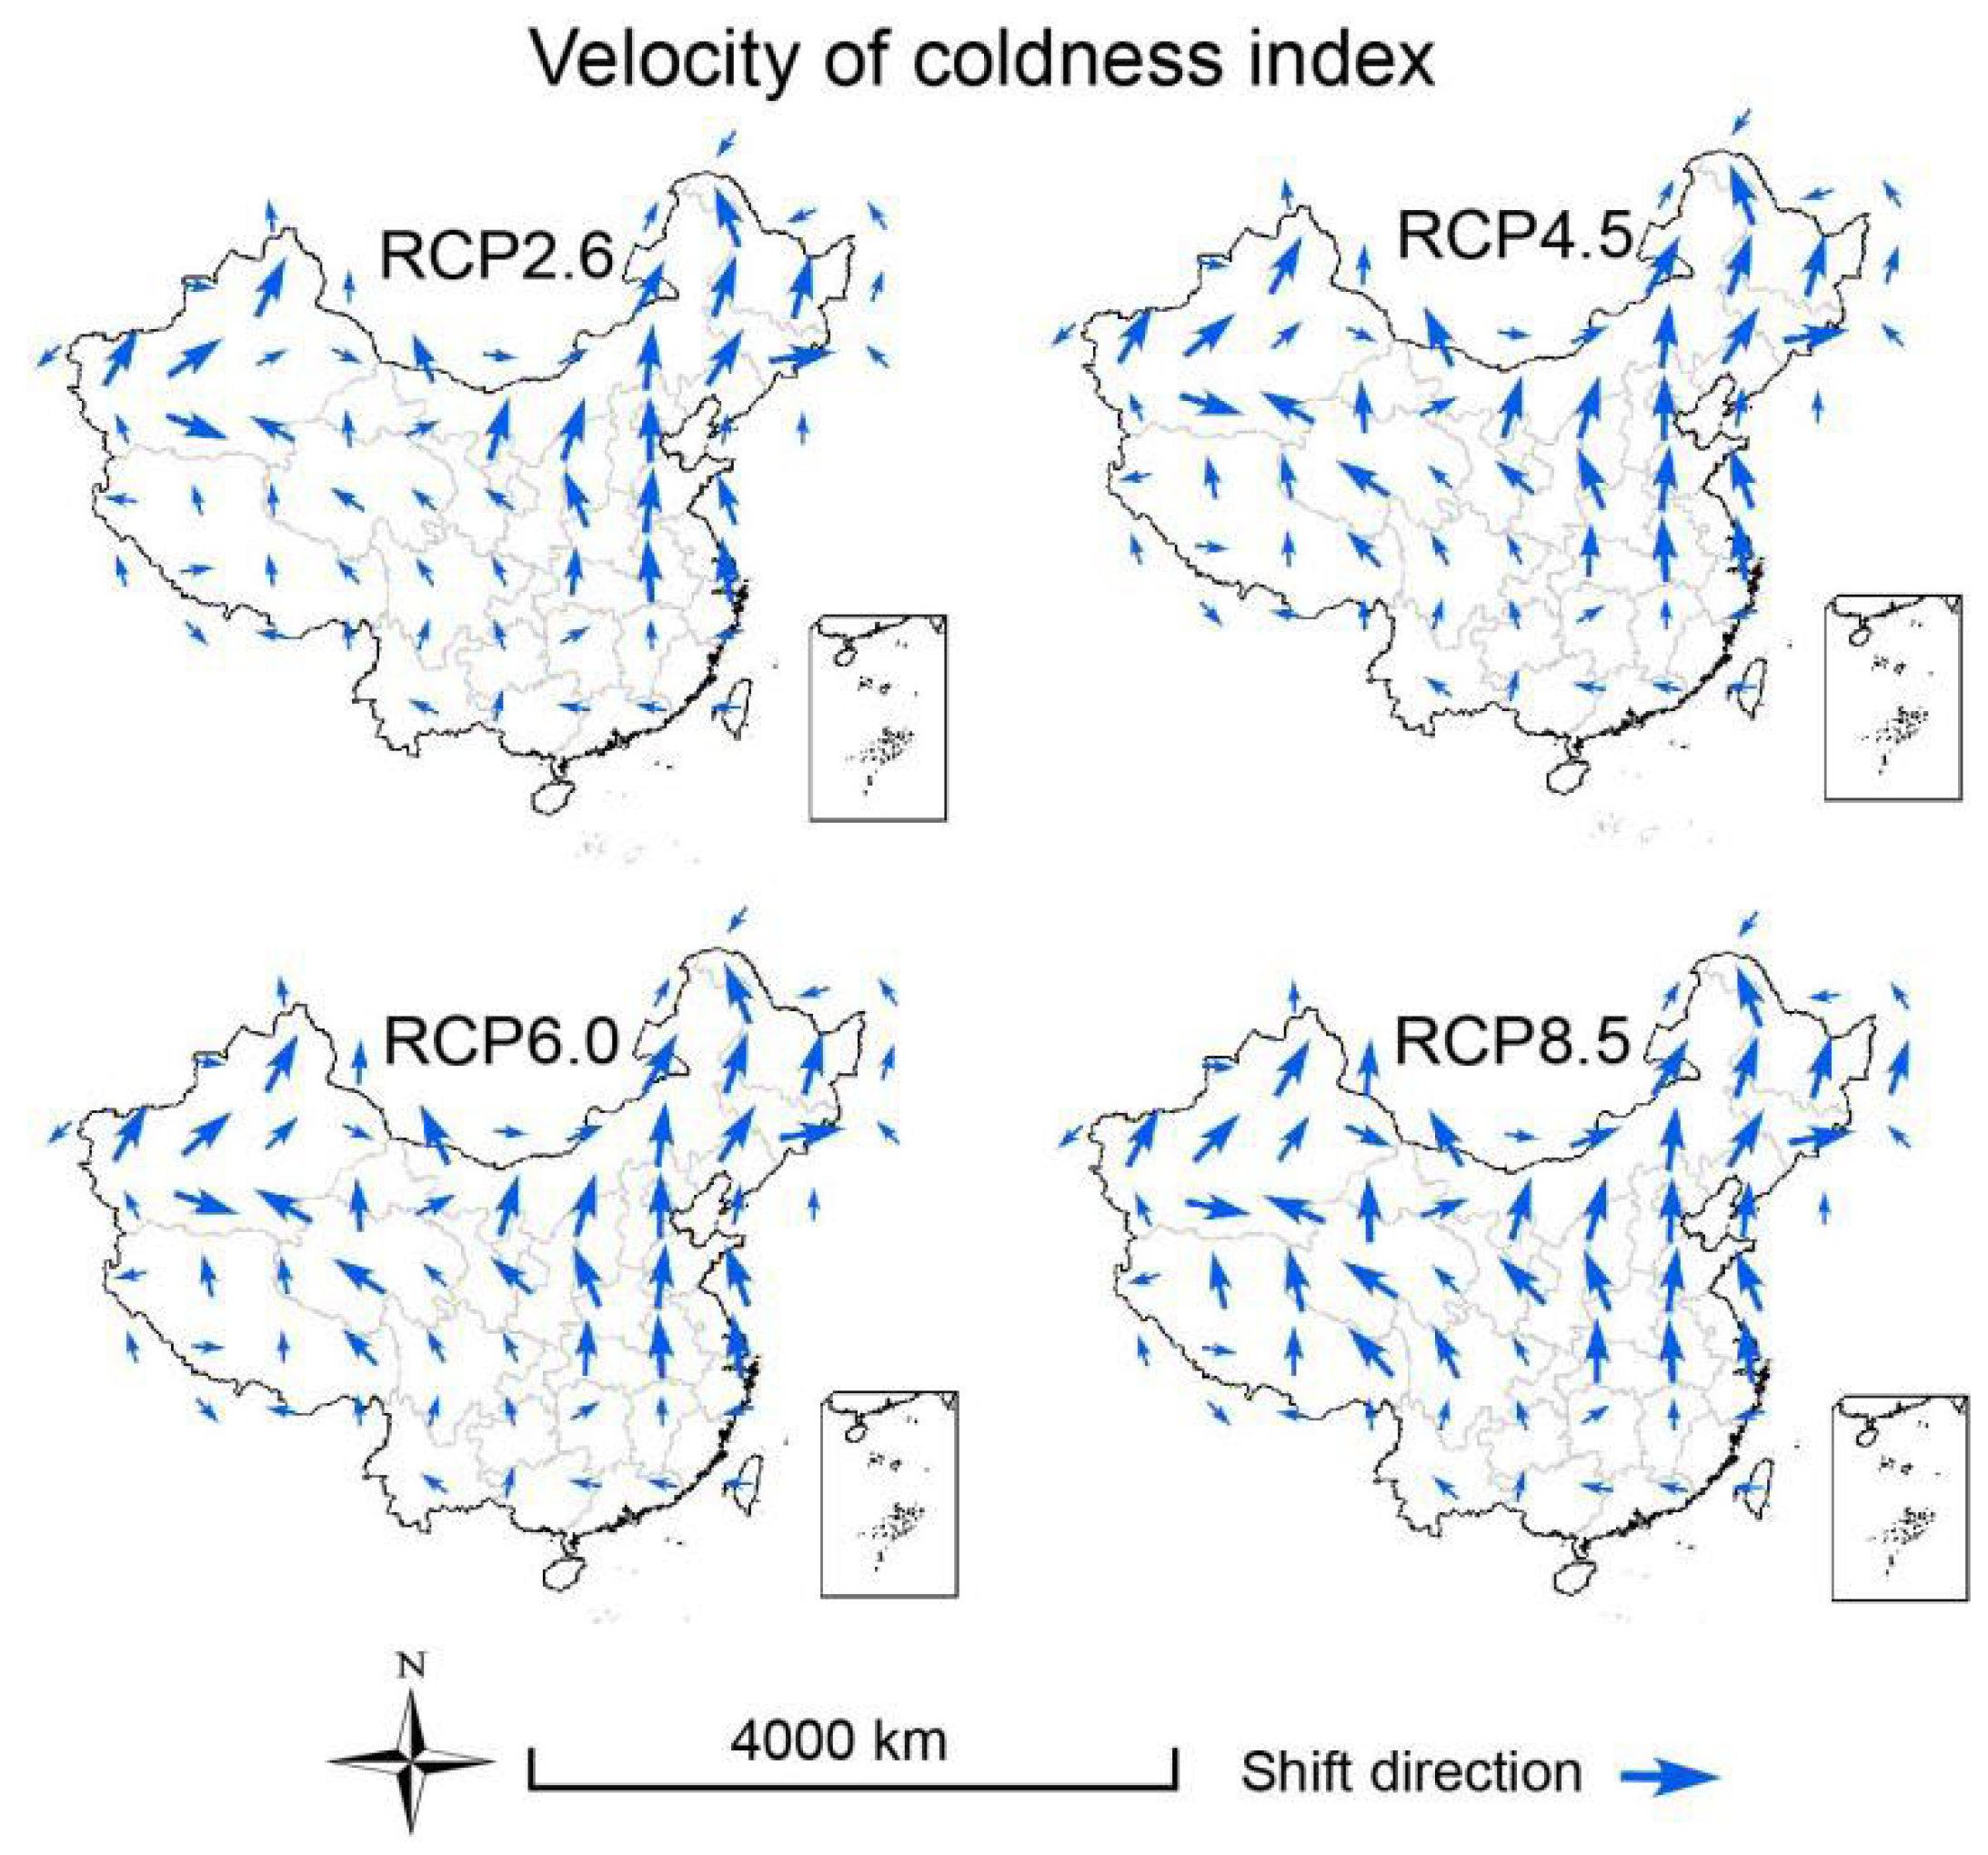
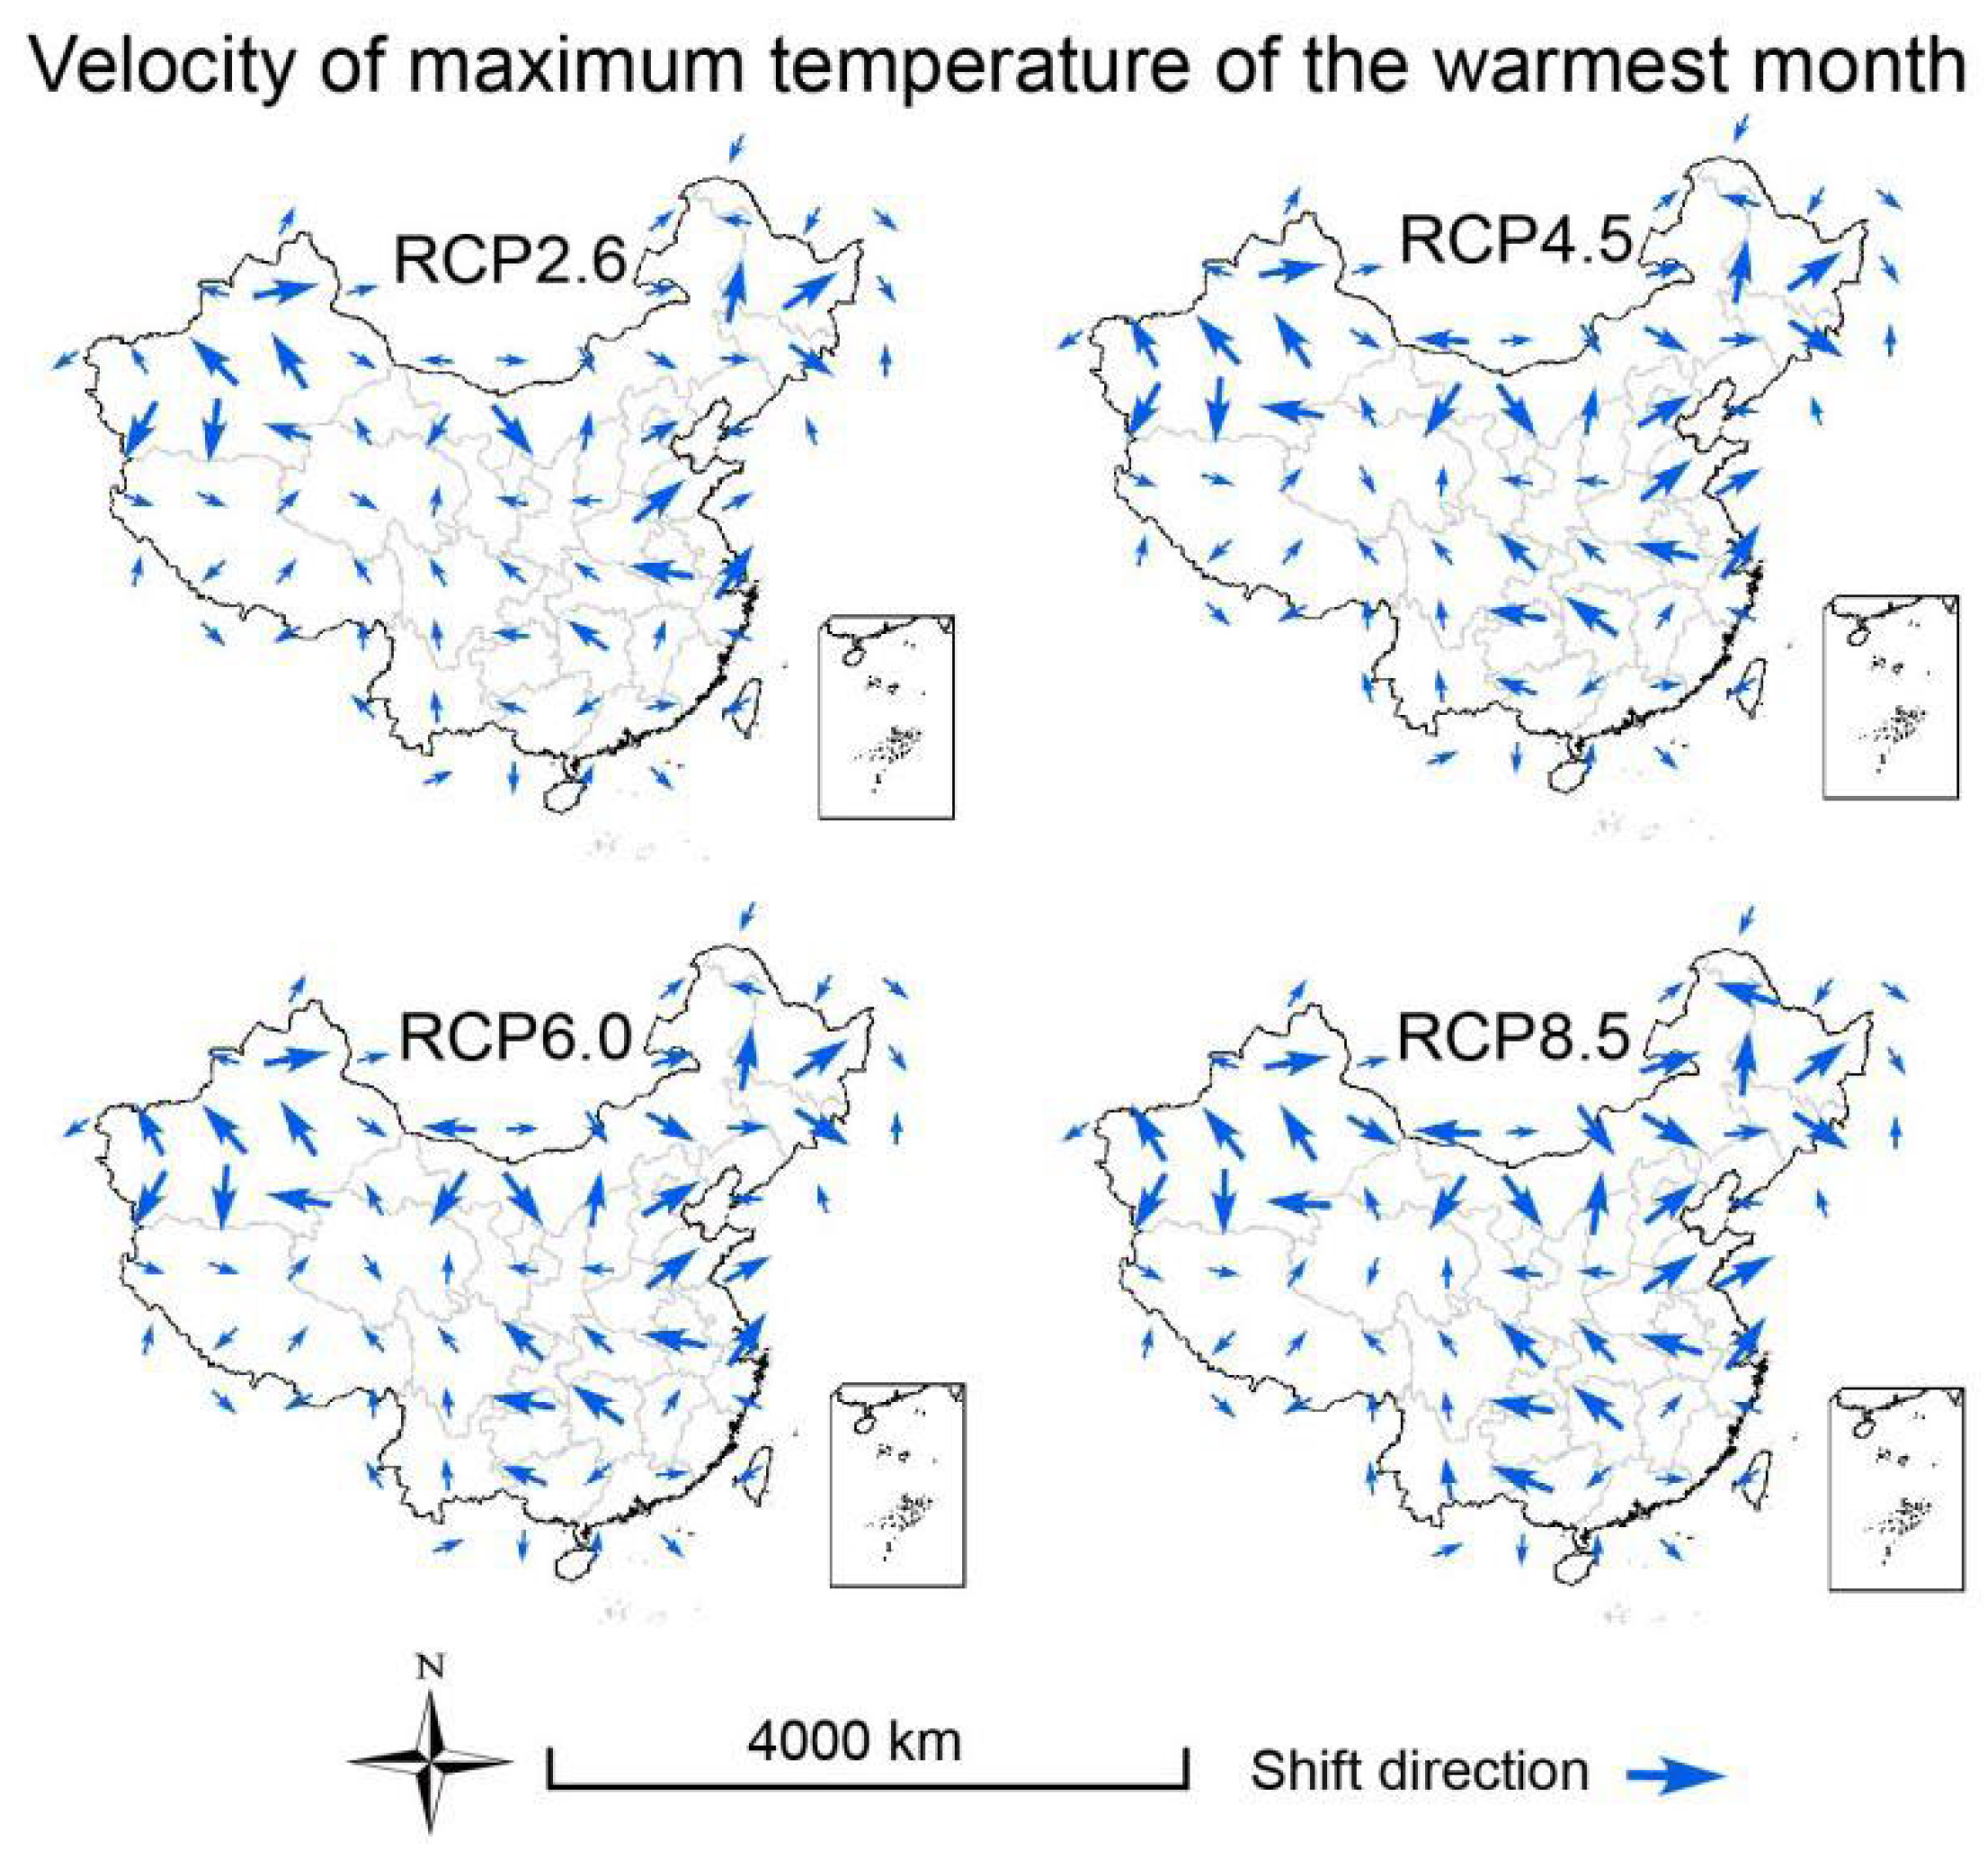
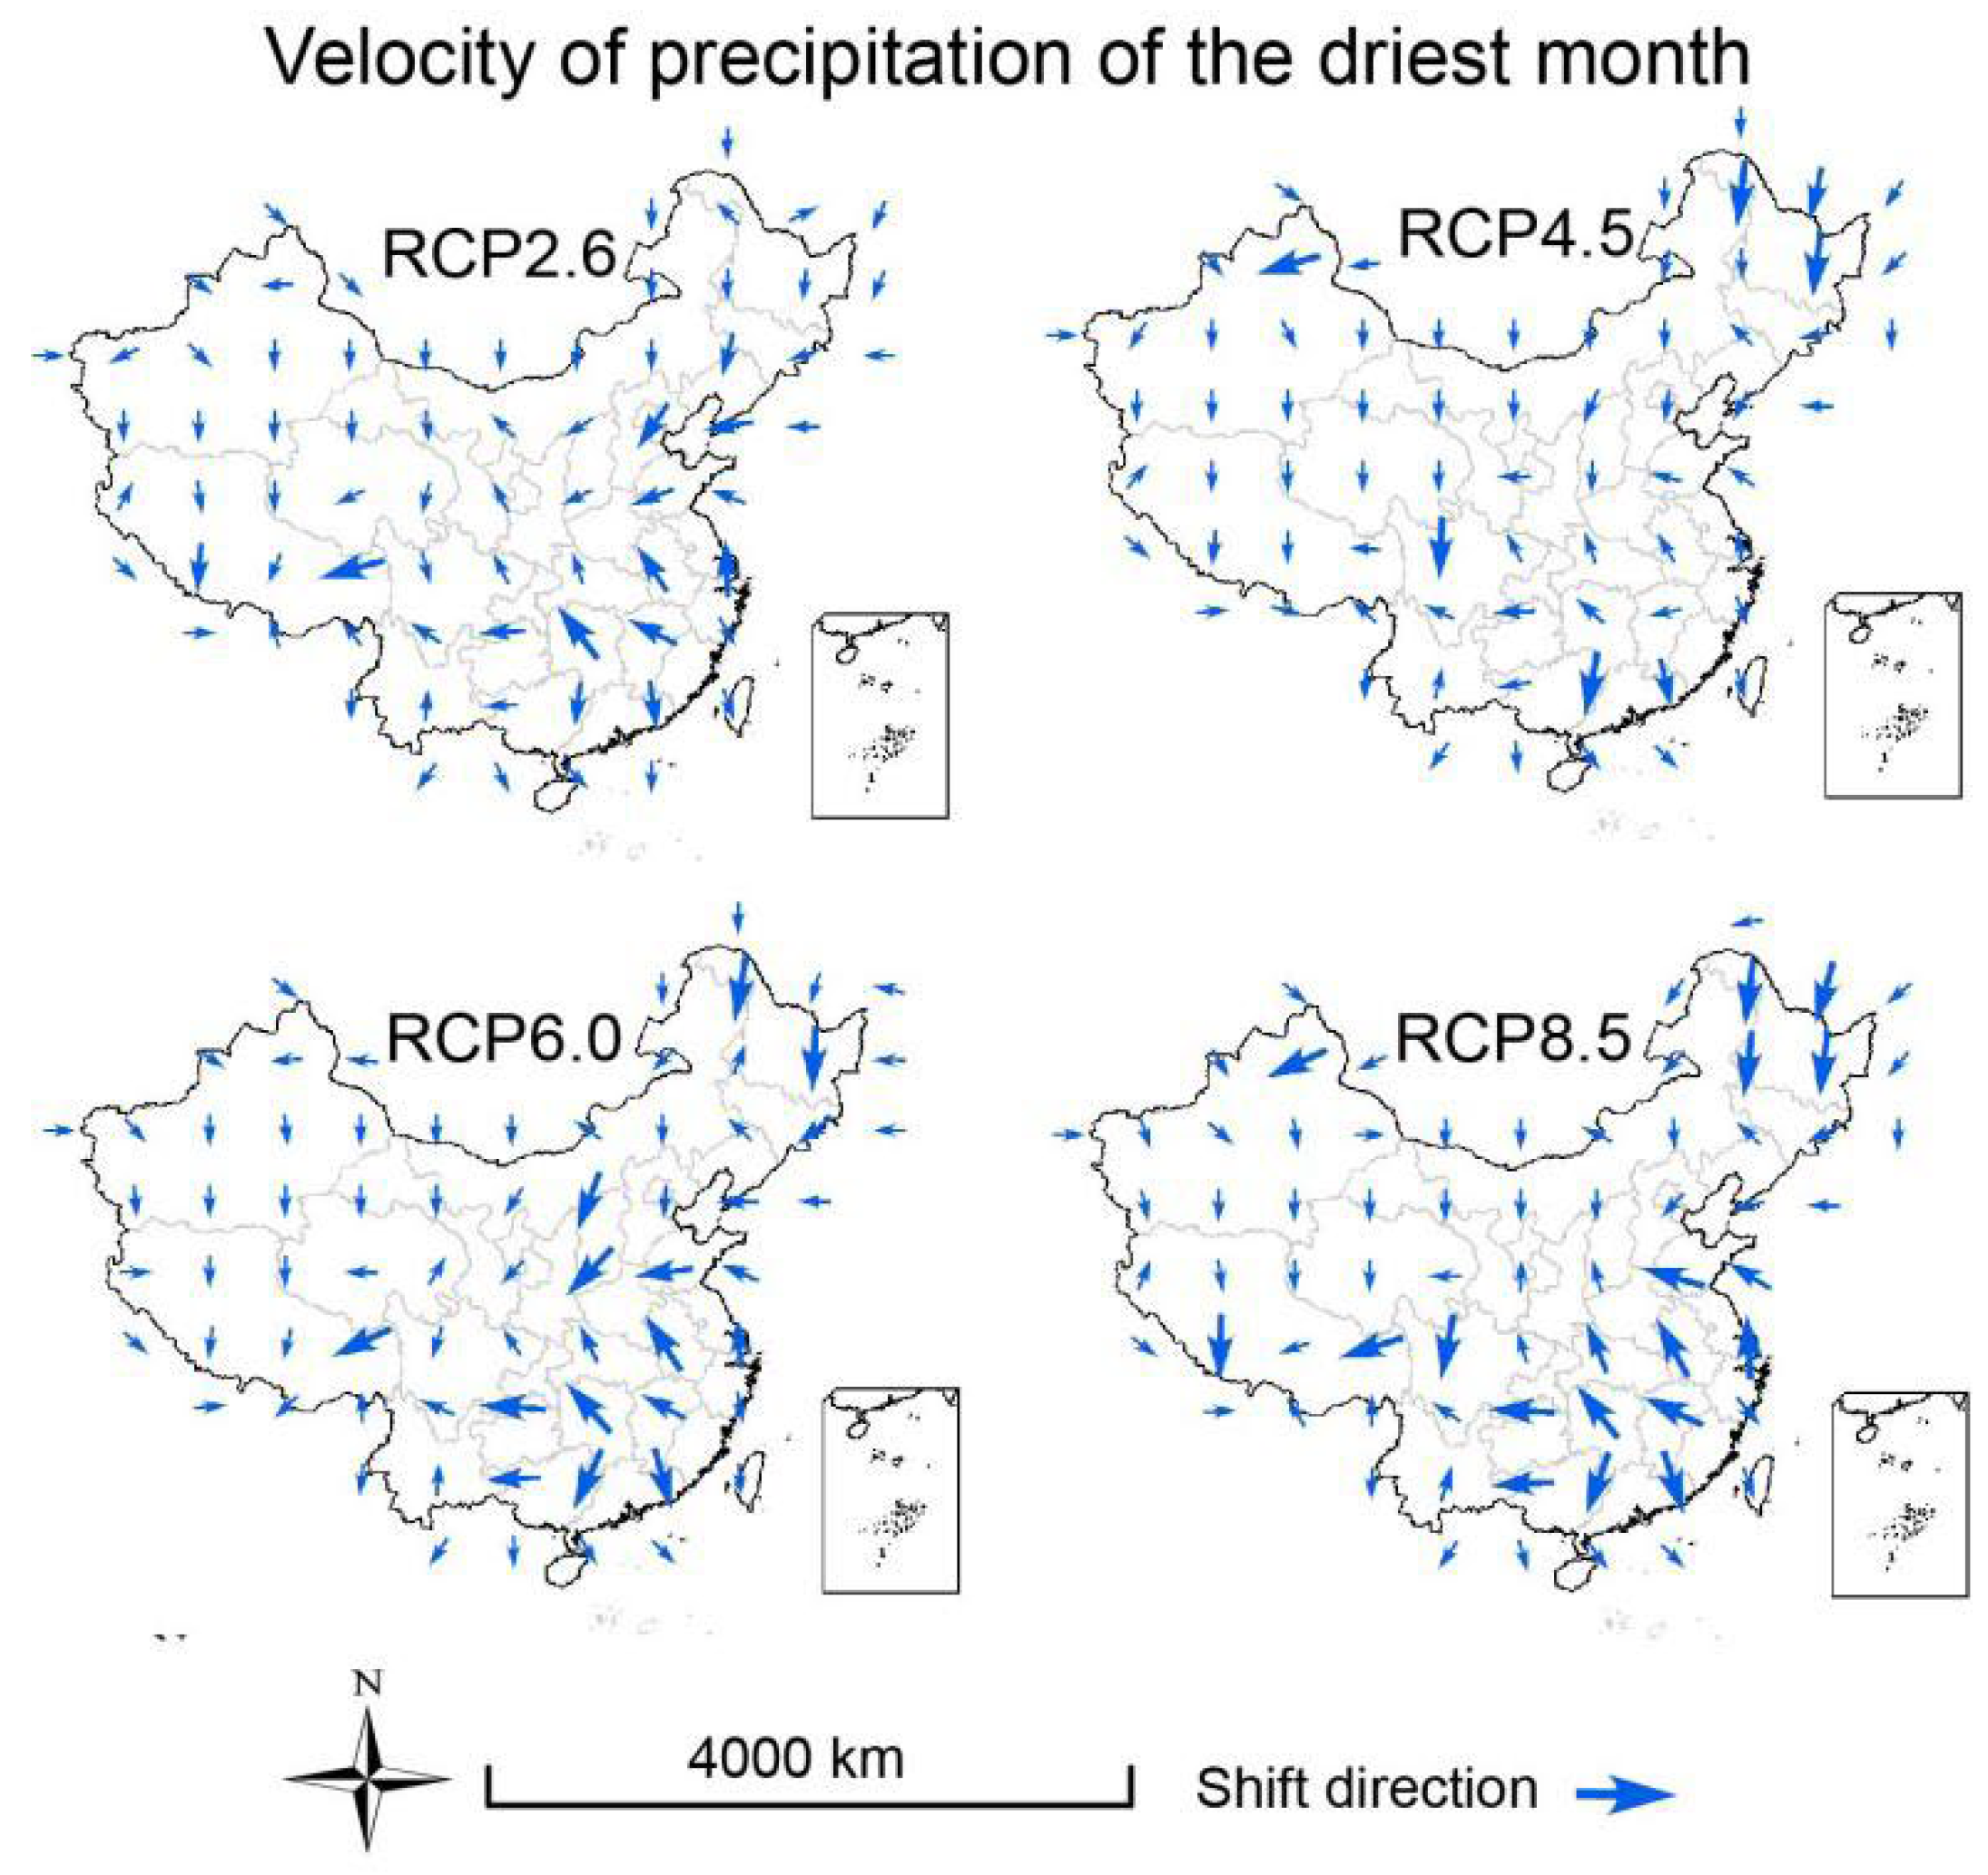
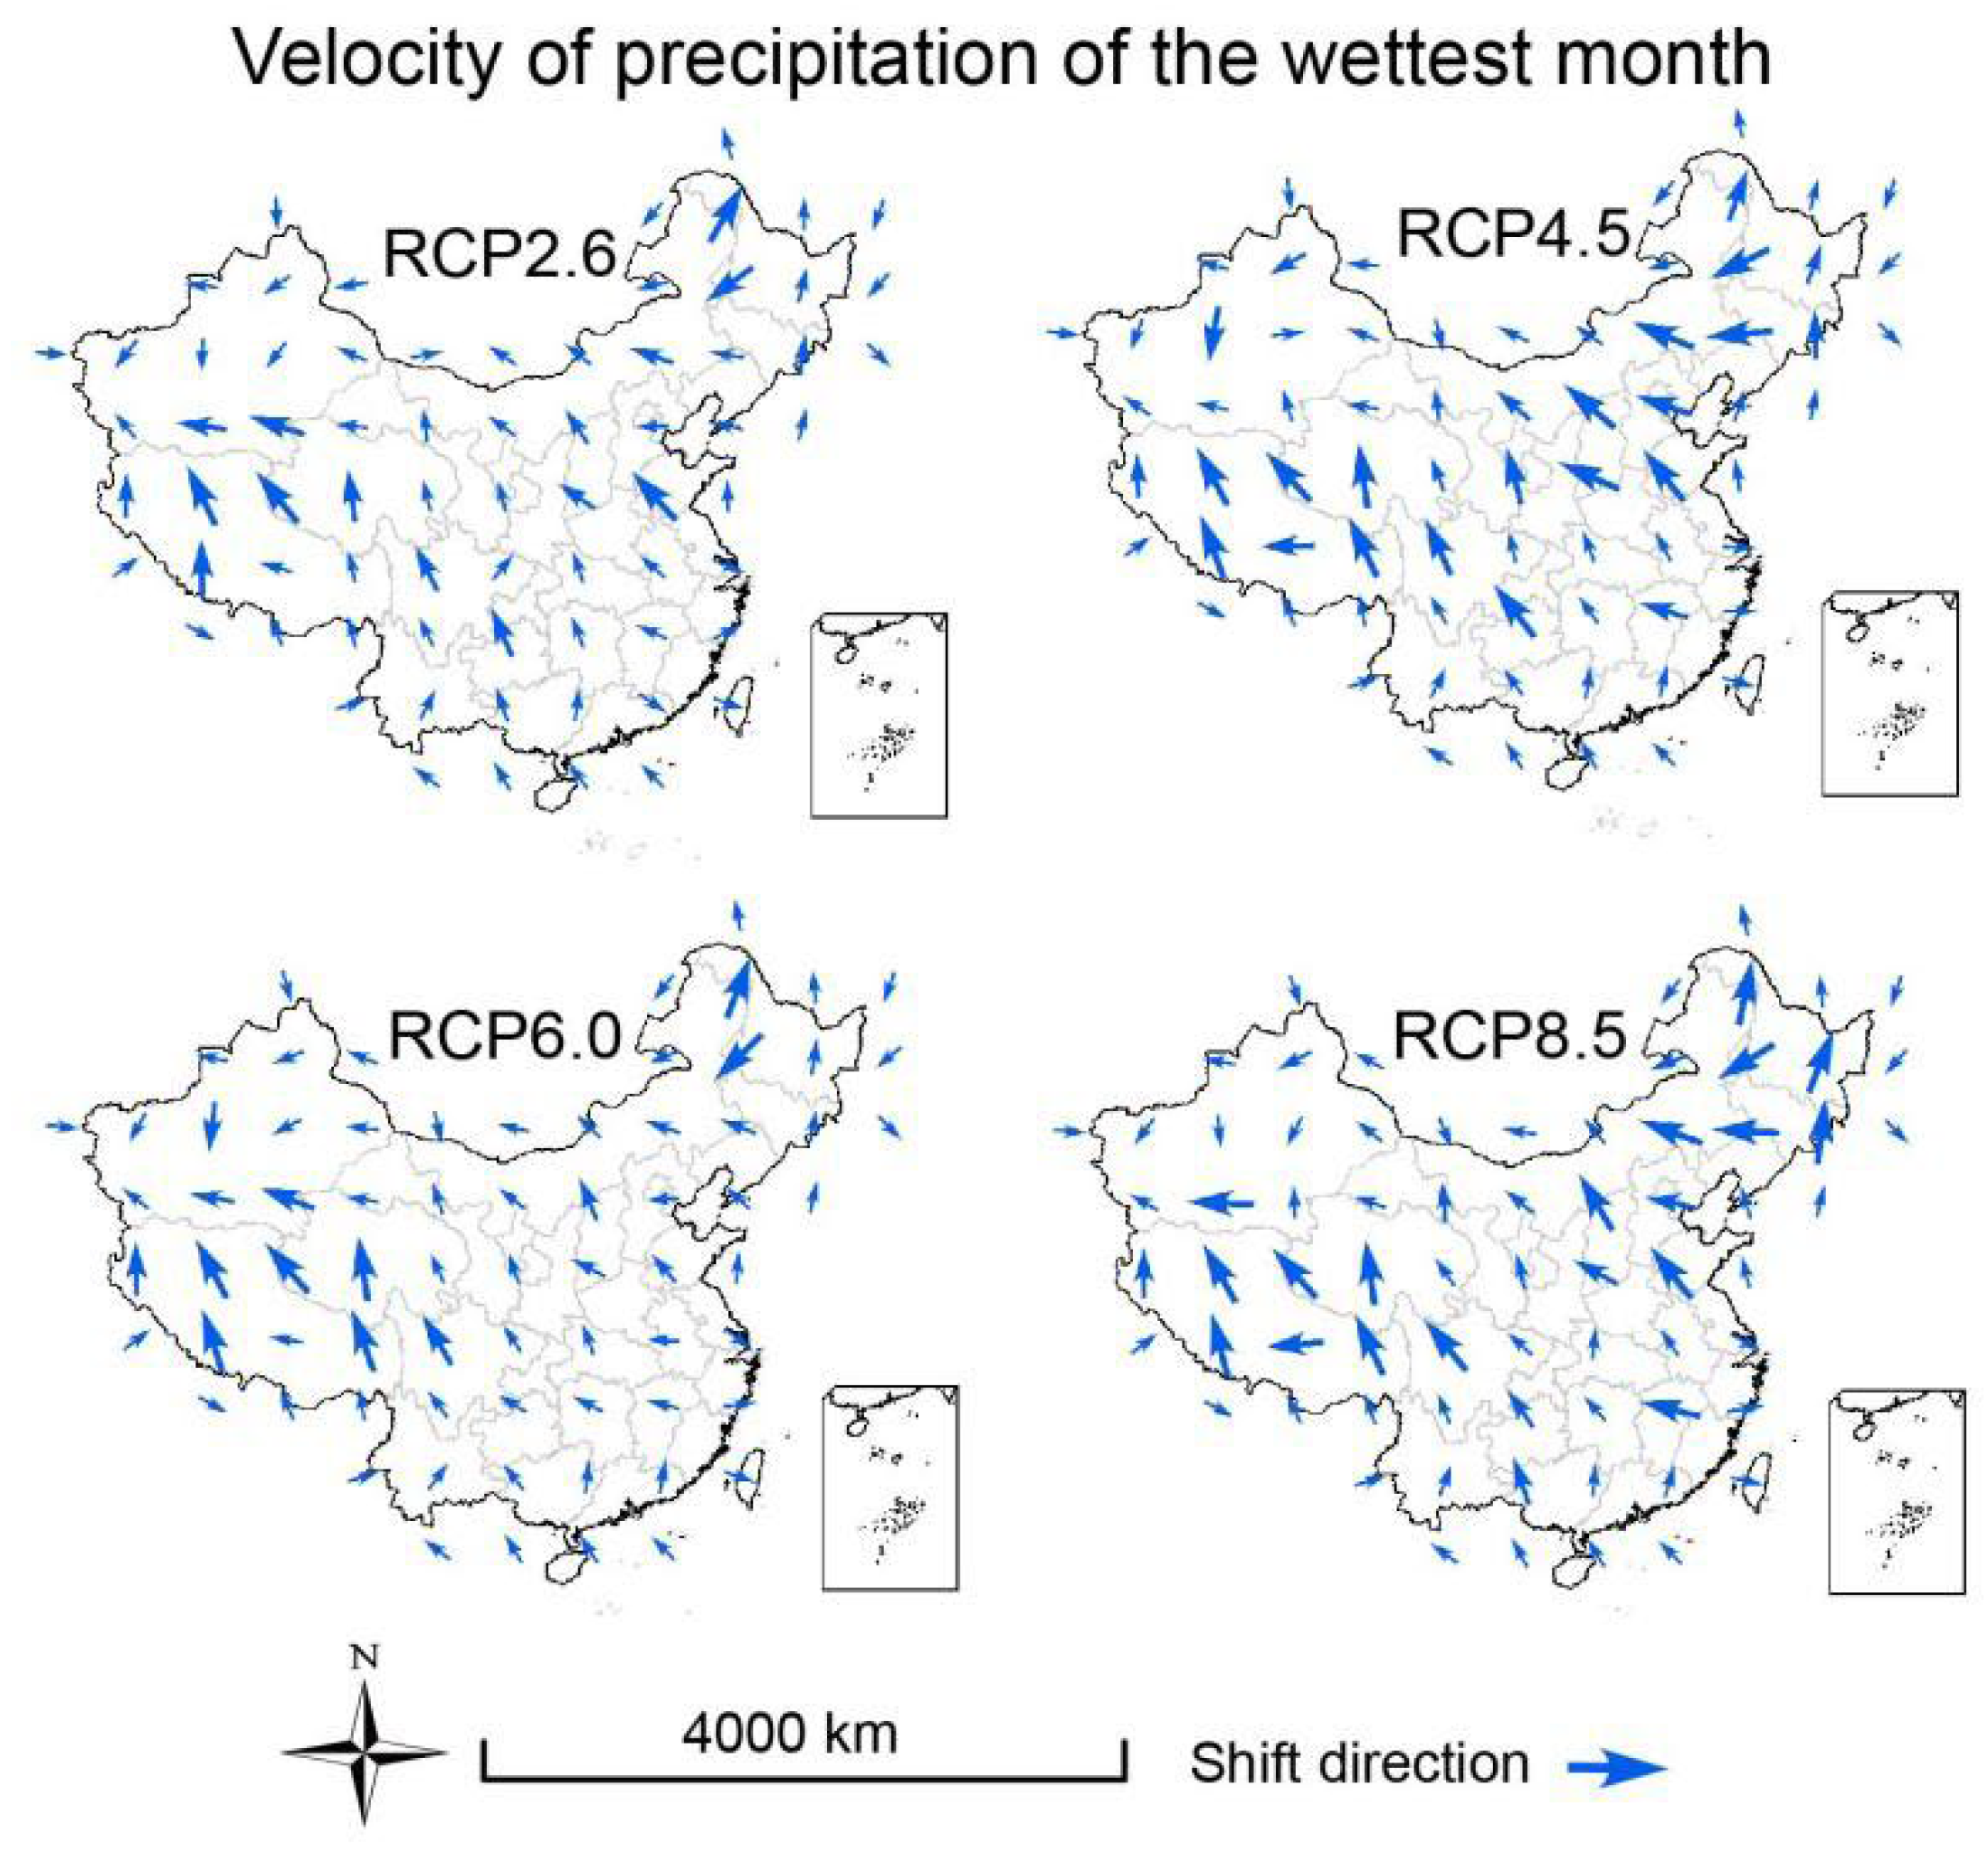
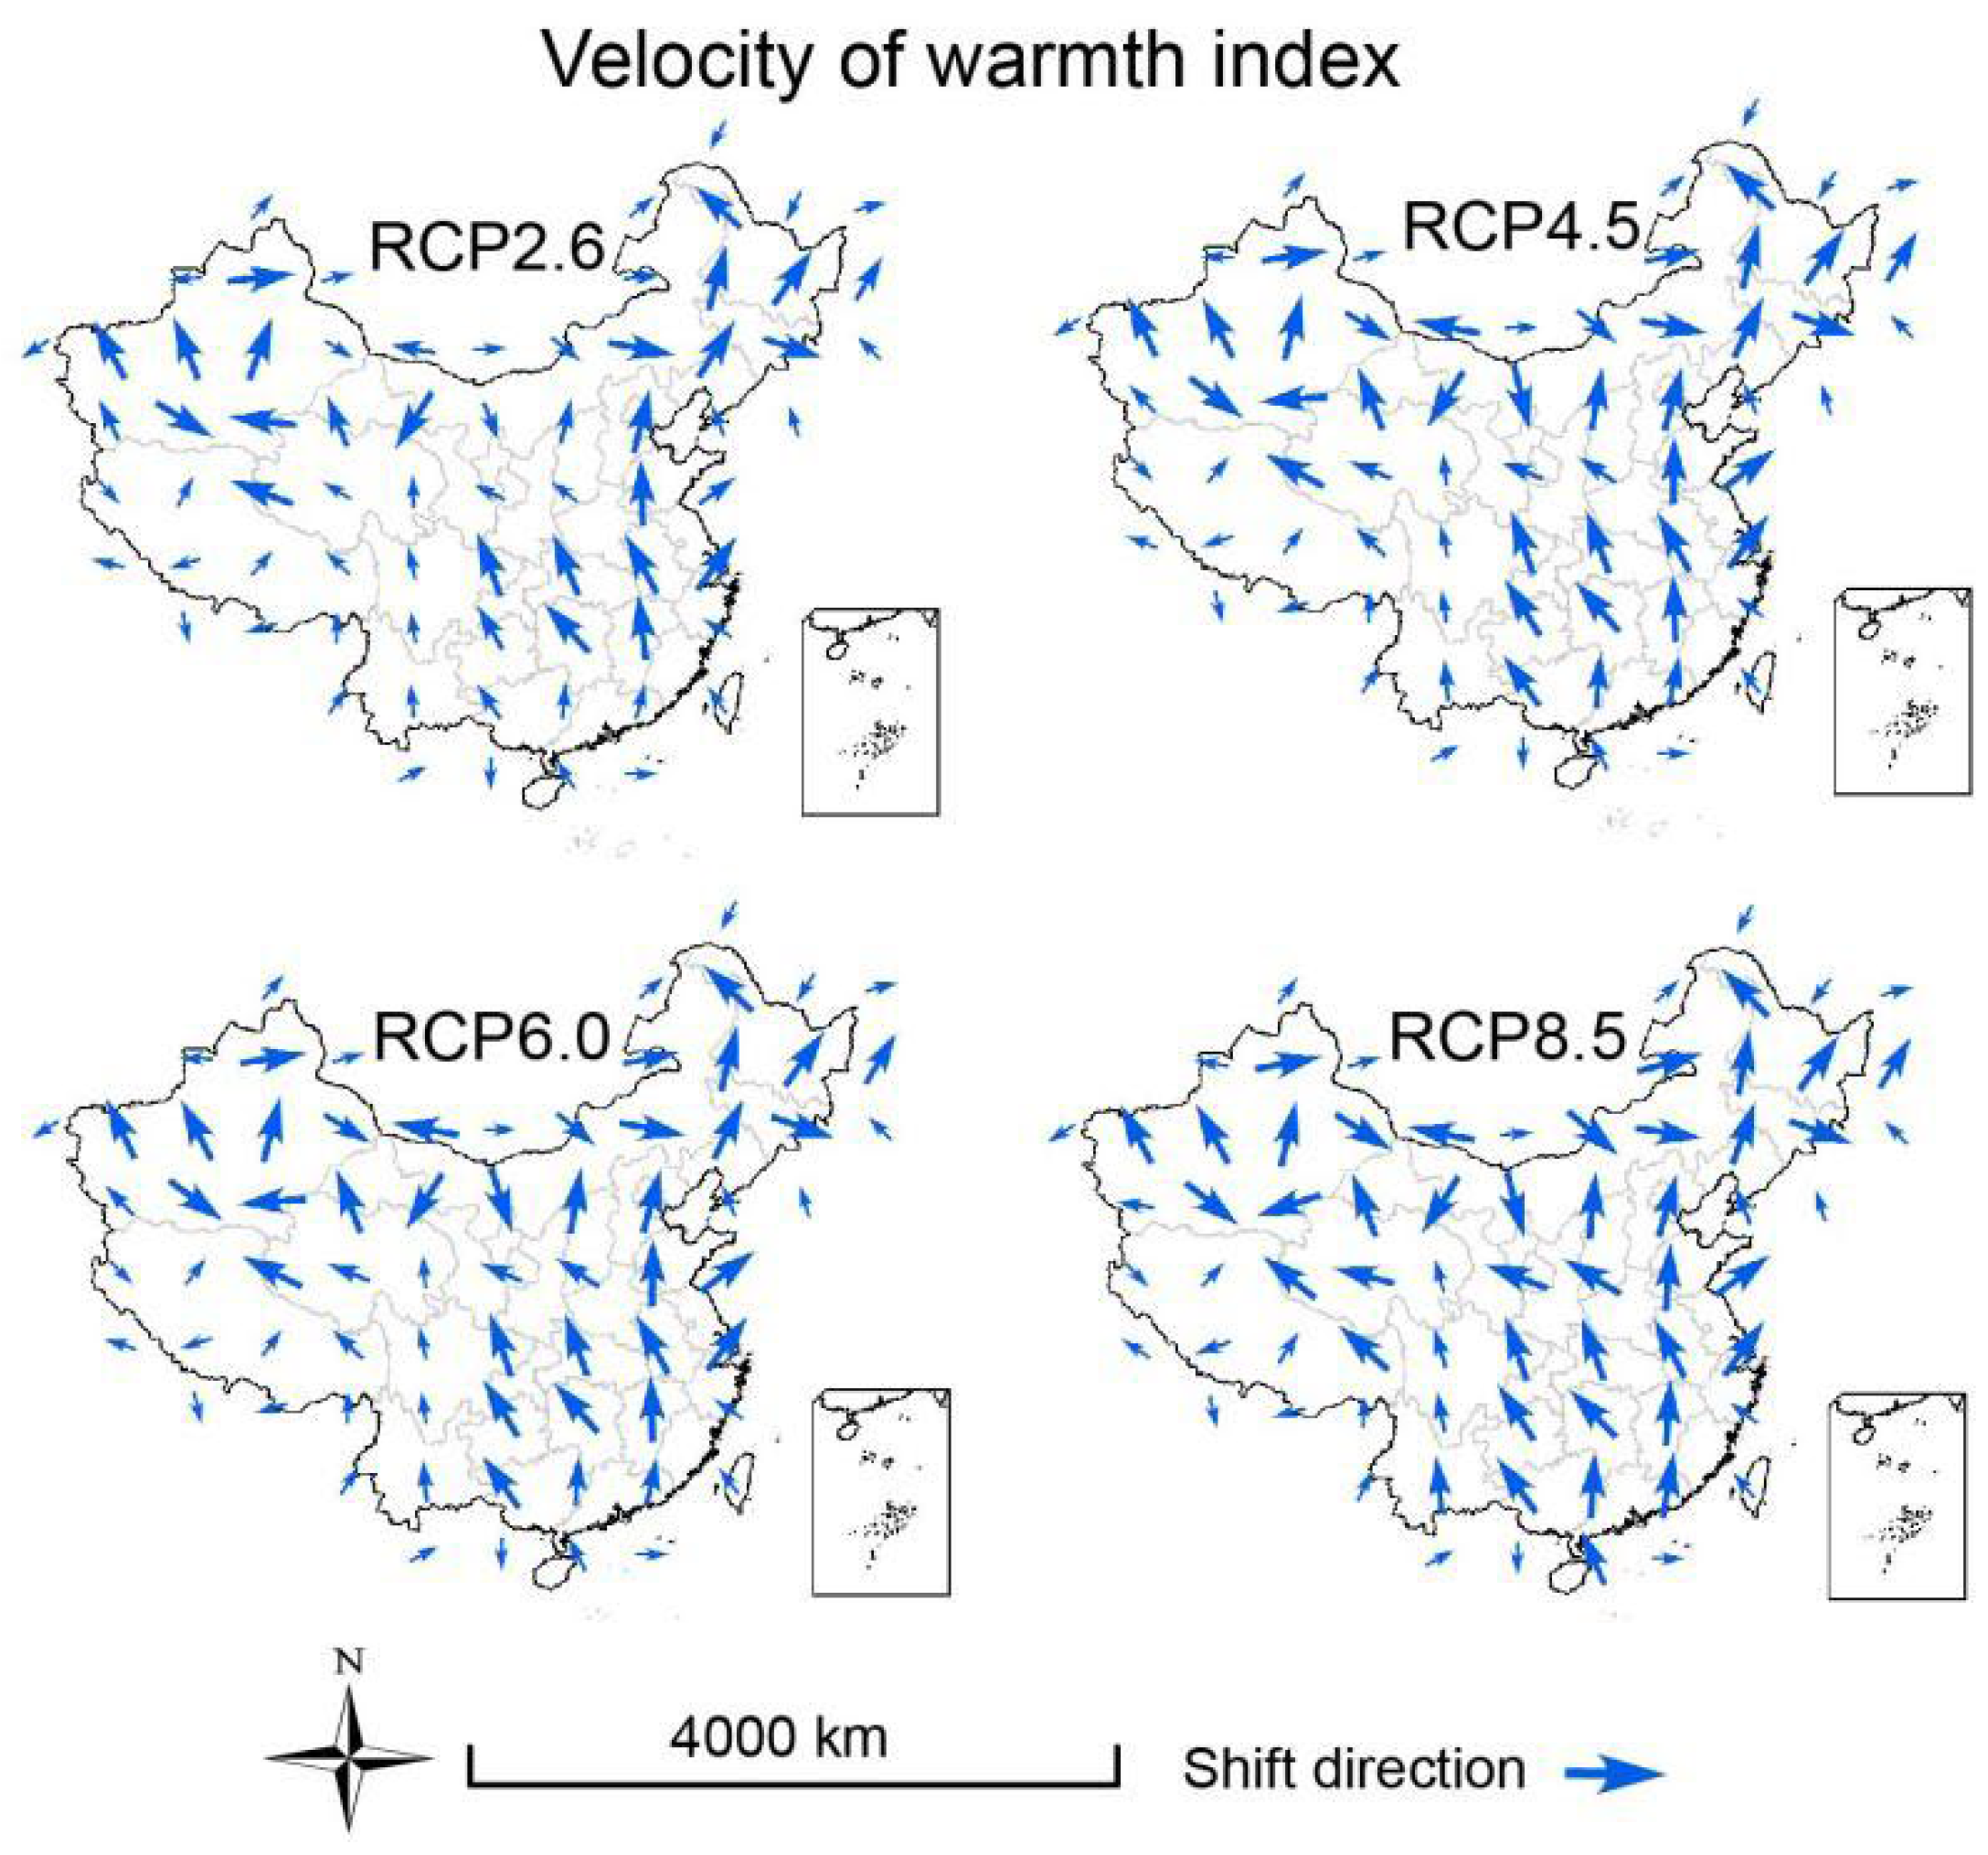
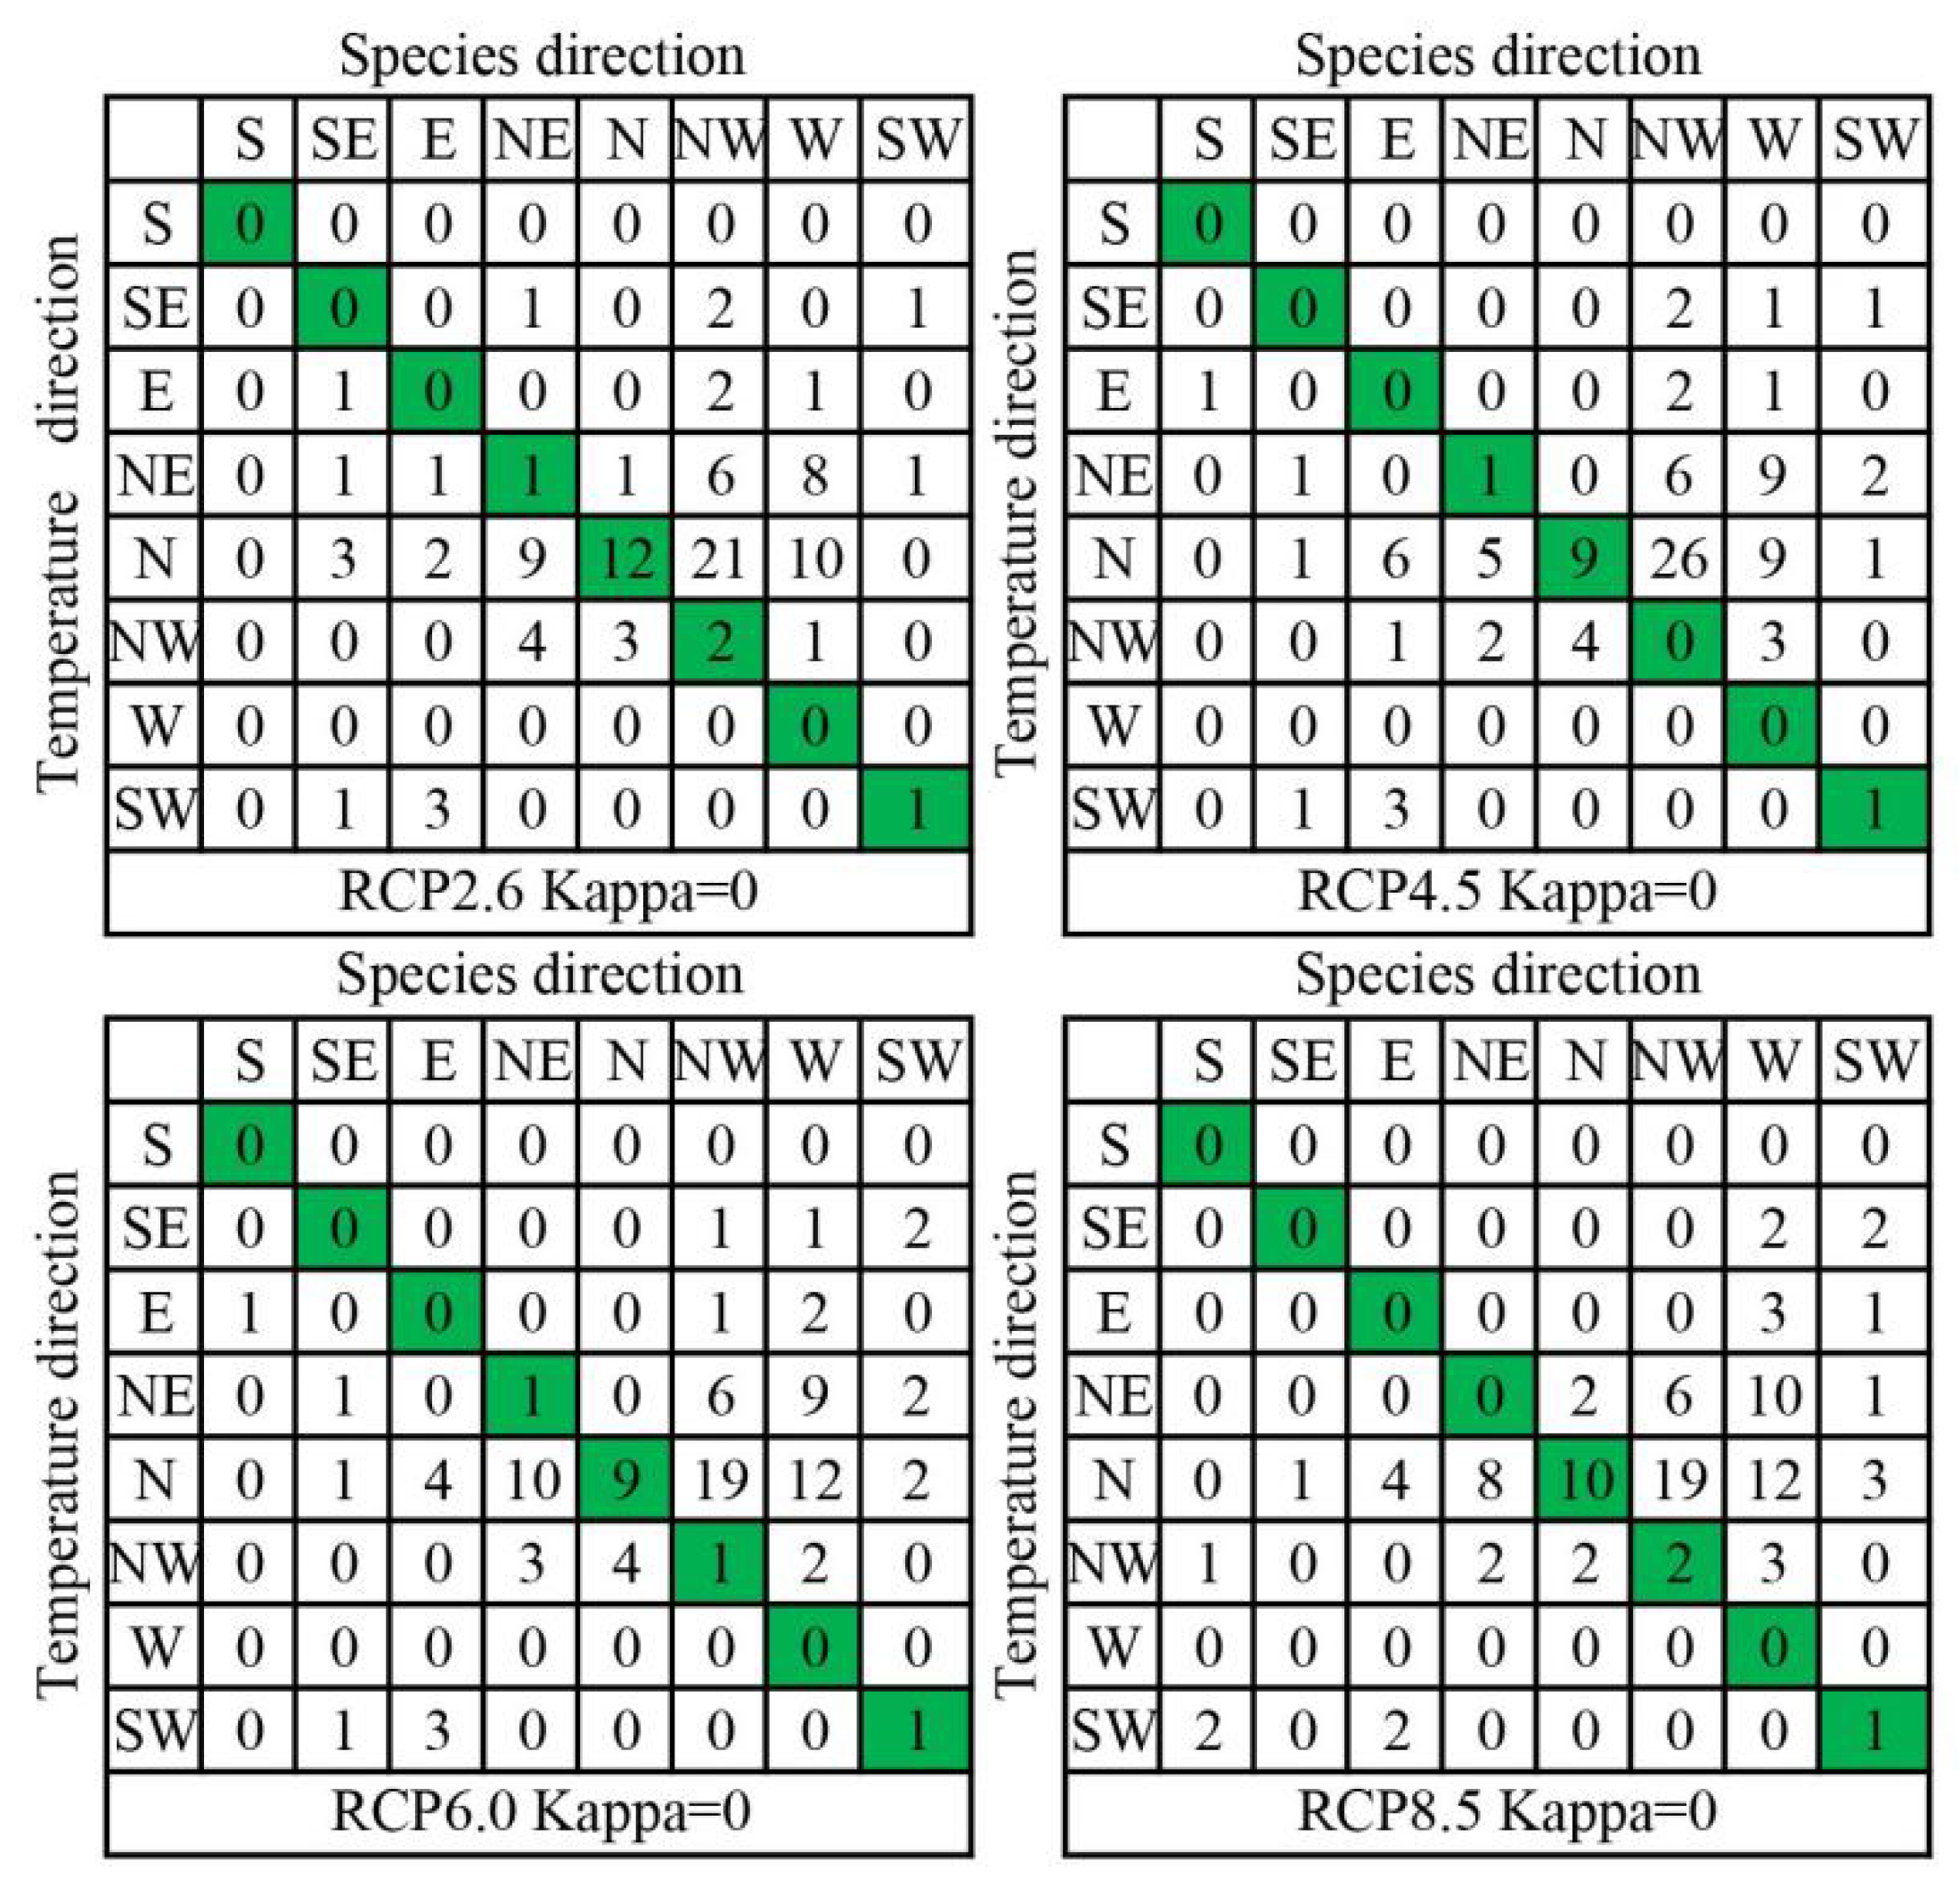
3.3. Velocities of Climate Change

The climate velocity of 13 climate variables were calculated with two grid sizes. The fine results, with 10 arc-min resolution, are provided in Supplementary File S2 (climate-velocity-file-for-13-factors). In different climate change scenarios, the boxplot maps of climate velocity for the 13 climatic variables are shown in Figure 6. The results indicate that the climate shift speed of temperature-related variables is higher than that of precipitation-related variables, and this relationship is not affected by the change of CO2 emissions concentration pathways. On average, the warmth index and mean temperature of the coldest month presented the highest average climate shift speed, both reaching more than 3.6 km/year. In contrast, the annual range of temperature presented the smallest shift speed in these temperature-related variables, with an median value of only 1 km/year. In the precipitation-related variables, the median range of shift velocity was only 0–1.2 km/year. Among them, potential evapotranspiration rate and precipitation of the wettest month had the highest shift speed, while precipitation of the driest month had the lowest shift speed. Furthermore, the variation range of the shift speed of temperature-related variables was still larger than that of precipitation-related variables, and the variation range increased with the increasing CO2 emission concentration pathways.
The coarse resolution climate shift direction maps, with 4° × 4° grid, are provided in Figure A1, Figure A2, Figure A3, Figure A4, Figure A5, Figure A6, Figure A7, Figure A8, Figure A9, Figure A10, Figure A11, Figure A12 and Figure A13 in the Appendix A for the 13 climate variables. Here, we only show the climate shift direction for annual mean temperature across scenarios as well as the vector average of all 13 climatic variables across scenarios (Figure 7). The results indicate that the annual mean temperature shift direction will point (or approximately point) to the north in North China, Central China, South China, and Southwest China, whereas it points to the northwest in the Northeast China. However, it did not present a clear direction and, so, indicates a multi-directional state for the temperature shift direction in Northwest China. The vector average state of the climate shift direction also showed a similar pattern as annual mean temperature. The main reason may be that the high temperature shift speed has a high weight in the vector calculation.
As the climate shift direction is mainly determined by the temperature, the climate shift direction of the average annual temperature across scenarios was compared with the species shift direction under the four climate scenarios. The confusion matrices and corresponding Kappa values are shown in Figure 8. The results demonstrate that only 11–16 species of the 99 species had consistency. The corresponding kappa values were all 0, indicating no agreement between all data sets. Therefore, the results support the second hypothesis that species velocity- and climate velocity-based approaches should lead to different results.

4. Discussion

4.1. Species-Projected Range Shifts Are Predominantly Multidirectional

Existing studies on tree range shift in China have mainly focused on the elevation gradient [14,15,16,17,18]. Due to a lack of long-term measured quadrat data, there is a lack of comprehensive evaluations on the migration speed and direction of tree species in latitudinal or longitudinal directions from the perspective of observation methods. To make up for this shortcoming, this study provides the first comprehensive assessment of the range shift speed and direction of Chinese trees under future climate change scenarios from the perspective of simulation methods. This study is expected to provide the public with a preliminary impression of the spatial variation of species range shift velocity in China.
Our study demonstrated that 51–64 of the 99 considered species presented northward shifts (N + NE + NW), and the t-test results indicated that the percentage of these species was significantly greater than that in a random process (p < 0.05). This supports our first hypothesis that the range shift of most of trees can be explained by the classical view (northward) rather than the novel view (westward, eastward, or southward). However, the northward range shift included three grades of directions (N + NE + NW); in this line, does the unidirectional (N) or multi-directional northward (NE + NW) dominate? Our study showed that only 13 to 16 species belong to the unidirectional northward direction category, while the remaining 37–48 species presented shifts in a multi-directional northward direction. That is to say, we can draw the conclusion that multi-directional northward may better describe the possible shift direction of tree species in China. This means that China’s tree species are similar to tree species in eastern North America, which have presented multi-directional shifts in an analysis of the abundance patterns of trees [23]. Significantly, it is possible to under-estimate the shift speed of species only based on the assumption of unidirectional northward direction shifting. Chen et al. [24] have sustained the unidirectional northward view and estimated that the average global shift speed of species is 1.69 km/year. VanDerWal et al. [25] have refuted this view and estimated that the degree of under-estimation is close to 57%, in contrast to a multidimensional view. Our study supports the viewpoint of VanDerWal et al. [25], as the under-estimation was about 64% for all species taken together.
The range shift direction of species depends on the change of external climate and depends on the tolerance of the species to climate. Therefore, the shift direction of different species should not be similar, in response to varying future temperature and precipitation conditions. Increasing CO2 concentrations has been the main driving force of China’s climate change in the past [3] and will also play a key driving role in the future. We found that both pessimistic and optimistic scenarios had similar impacts on the range shift direction of species but had various impacts on the shift speed of species. The observed phenomenon indicates that an increase in CO2 concentration mainly affects the intensity change, regarding the amplitude of temperature and precipitation, instead of changing the azimuth pattern. This means that, under the high CO2 emissions scenario, species need to make more efforts to find a suitable niche in a similar shifting direction than that in a low CO2 emissions scenario. The prediction of habitat range shifts for 134 tree species in the eastern United States also showed that species will experience higher habitat shift pressure under high CO2 emissions [61]. We can infer that, once the expected speed is greater than the dispersal ability of the species itself, rapid climate change will significantly increase the risk of extinction of the species, which may be local extinction or global extinction.
In addition to the northward shift pattern, there were still 35–48 species that were observed to shift westward, southward, and/or eastward. Two possible mechanisms can explain this phenomenon. One is that the assumptions established in the classical view are not tenable (single warming variable driven range shift). Besides temperature, precipitation is also an important factor affecting species distribution (Figure 2). The factors of precipitation in China, as well as temperature, present multi-dimensional shift characteristics in geographical space (Figure A1, Figure A2, Figure A3, Figure A4, Figure A5, Figure A6, Figure A7, Figure A8, Figure A9, Figure A10, Figure A11, Figure A12 and Figure A13). Therefore, species sensitive to precipitation likely do not satisfy the classical view. For example, in this study, it was found that most of the species in the northwest arid area of China were projected to shift to the east, south, and west; mainly because precipitation in the western arid area is the main limiting factor restricting the distribution of these species [62]. Fei et al. [23] have studied the migration dynamics of saplings of 86 tree species in the eastern United States over an observation period of 30 years, and also believed that the multi-directional migration of saplings was mainly related to precipitation, rather than temperature variables. Another explanation is that species could shift to high altitudes, instead of shifting to high latitudes, in the process of seeking a constant temperature niche; that is to say, China’s three-step topographic structure from West to East along the longitude gradient should lead to species shifting to the west to pursue a constant temperature (Figure 1). Especially considering the alpine region of the Qinghai–Tibet Plateau, which is the “roof of the world,” most of its surrounding areas showed multi-dimensional shift characteristics to the west, south, or east. Therefore, the classical northward shift view is probably not fully applicable to China’s forest ecosystems in precipitation-sensitive regions or mountainous areas with topographic heterogeneity. These two possible mechanisms may also be applicable in other regions of the world, such as western Asia and the arid regions of Africa, where similar research is still lacking.

4.2. Explaining Species Velocity Using Climate Velocity

We found that both the use of climate velocity- and species velocity-based methods indicated that, in the future, tree species habitats will generally shift northward, as well as westward, eastward, and southward. The shift velocity described by the two indicators were both similar and different in various aspects. The similarities were mainly reflected in the huge differences in the shift directions between regions and CO2 concentration paths. This indicates that we cannot view the shift direction of a species from a single point of view in different regions of China [24]. The difference between species velocity and climate velocity involves the internal assumptions in the calculation of these two indicators [19,29,30]. First, climate velocity is a physical index, which only describes the dimension of the climate itself, without considering the ecological characteristics of the species [30]. The multi-directional shift represents the speed and direction of the pursuit of constant temperature or rainfall by species and reflects inherent differences in physical properties of climate change. Furthermore, climate velocity can be characterized by many climatic variables in addition to AMT and AP [63]. However, many important climate dimensions have not been paid much attention to in past research [30,55,60]. We characterized 13 climate dimensions and found that the speed and direction are different when using different variables to describe the climate velocity.
The species velocity, calculated by the climate envelope algorithm, depicts the climate niche of species [19,29], which implies that each species has a different response to varying climate conditions. Additionally, the important climatic factors that affect the distribution of species are not necessarily AMT and AP [63]. In our study, we found that the important factors affecting the distribution of species were generally AP, ART, CI, and HI, indicating that the climate tolerance of species needs to be characterized in a multi-dimensional manner. Records of 293 species from the United States in western North America over the past 40 years have shown that species are equally likely to migrate upward and downward on the altitude gradient [64], indicating that the altitude migration of species cannot be explained only by climate warming but also depends on seasonal temperature and precipitation changes. The climate velocity assumes that there is no difference between species and that they have the same response to climate change. This internal assumption is inconsistent with the actual situation of the species, which leads to differences between the two methods in describing the direction of species range shifts [63]. Therefore, the habitat range shift speed and direction of species are not consistent with the climate velocity described by AMT. Thus, our results support the second hypothesis; that is, the results obtained from species velocity- and climate velocity-based methods are inconsistent.

4.3. Research Limitations and Future Perspective

In our research, we used a climate envelope model to study the suitable habitat areas for various species. Accurate characterization of species-specific climate tolerance is necessary for such models [20,65]. In our study, we used locations within the native range of species to characterize their climatic niche. The results of introduction and cultivation experiments have shown that some tree species may survive and reproduce under climatic conditions beyond their original areas [42,65], showing that some tree species may have a wider range of climate tolerance. This indicates that using only local occurrence data may lead to an under-estimation of climate tolerance, to a certain extent, thus under-estimating species distribution areas [66], which may affect the migration speed and direction estimates. Therefore, it is not an accurate description of the habitat range of species but an approximate possible measure. Nevertheless, this study can give the public an intuitive visual understand of climate change-induced range shift of tree species in China. It also provides reference for further study of tree species migration in China based on observation data.
In addition, the species velocity in this study refers to the shift velocity of the habitats of species, not the migration velocity of the species themselves [61]. The migration velocity of a species depends on its dispersal ability, which is closely related to its propagation characteristics as well as the availability of dispersal vectors, such as birds or other animals [12,13,67,68]. This means that the multi-dimensional shift direction obtained in this study refers to the shift direction of suitable habitats. The priority occupation effect [69], competition effect [16], soil [70], and land uses [71] may hinder the further migration of species, while moderate and intense interference are conducive to the colonization of species, including fire and logging [72]. In China, research on whether species have sufficient ability to track their climate habitat is currently largely concentrated on the elevation gradient [14,15,17,18] but rarely on the latitude or longitude gradient, which limits our reasonable evaluation of the dispersal abilities of various species. Therefore, incorporating functional traits into the assessment of species migration is an area that should be strengthened in the future [13,29]. The premise to achieve this goal is the accumulation of a large number of observation data. Interestingly, Tamme et al. [33] have proposed a method to estimate the maximum dispersal distance of species based on plant functional traits. Applying this method to Chinese tree species may be a good attempt to preliminarily understand the dispersal capacity of Chinese trees, which still requires further research. However, one thing is certain: under human-assisted migration, including afforestation and other human activities, the dispersal ability of species can be enhanced, which can serve to break the bottleneck of the speed of tree migration, and may lead to unlimited dispersal capacity. China is carrying out many prominent ecological projects [73,74], and this study may have important guiding significance for the specific shift direction of planting tree species, thus determining the potential migration route and adjusting the migration speed.
The assumptions used to characterize species velocity and climate velocity are inconsistent, which led to the difference between the two results. Both have advantages and disadvantages; for example, species velocity takes into account the climate tolerance [32,61] and the depicted shift is species-specific, but this method does not consider the impact of terrain and other surrounding environment on species dispersal [75]. By contrast, climate velocity does not consider the climate tolerance of species but considers the possible impact of local terrain differences on species dispersal [30,60]. However, previous studies that have defined climate velocity only refer to the annual mean temperature and annual precipitation [30,60], which is far from suitable for describing the multi-dimensional climate space of the realized climate niche of species [63]. In the future, it may be of more ecological significance to establish a more comprehensive climate change velocity index, based on the different weights of different climate variables. For example, Shi et al. [34] have calculated the drought index to describe the climate velocity and have evaluated the associated biodiversity threat status. However, the shift direction was not considered in the calculation process of the drought index. In the future, the development of a comprehensive vector operation, rather than scalar operation, for producing climate velocity may be a worthy research direction [31,63].
Additionally, future climate change is unpredictable and uncertain. Based on pessimistic and optimistic estimates of social development and technological development, the IPCC has designed a set of representative concentration pathways in order to reflect the uncertainty of climate change [1]. In this study, four RCPs were used to characterize such uncertainty. However, global climate models still generate uncertainties [76] and, so, we averaged seven GCM approaches to characterize the dominant trends in climate change, without considering the extremes that an individual GCM may produce. Therefore, there should be uncertainties in the results of the study. Such results cannot be used directly for policy formulation, but can provide scientific reference for policy-makers. The choice of scale may have a certain impact on the study of species velocity and climate velocity [77,78]. Although we did not assess the impact of scale on the species habitat simulation, we assessed the impact of scale on climate velocity. We speculate that scale has a certain influence on the calculation of species velocity [79,80]; however, its impact on climate velocity is huge [31]. In our study, we mapped the climate change velocity of 13 climate variables in China, with two resolutions of 10 min × 10 min and 4° × 4°. On the fine scale, the shift direction of climate was disordered and has no good regularity, but it presented good regularity at 4° × 4° resolution. Setting a higher range of resolution gradients and studying the impact of resolution on the direction of climate change are scientific questions worth further discussing in the future.

5. Conclusions

The relationship between climate change and range shift features three key points: one is population shift, one is habitat shift, and the other is climate shift. The classical view of population shift directions caused by climate change is based on the assumption that population shift is simply linearly related to the temperature shift. Here, we used habitat shift to represent population shift, based on the assumption of infinite capacity of dispersal, and evaluated the range shift directions of 99 tree species in China. Our results support the classical view; however, this view is still not absolutely correct, and there were even completely opposite cases (i.e., supporting the novel view). It is possible that the climate change-induced range shift of species should belong to a transitional state of classical and novel views, depending on terrain heterogeneity and precipitation sensitivity of the study area. This suggests that we should re-examine the three meanings of shift in the relationship between climate change and range shift. Theories and methodologies that link the three meaning of shift should be strengthened in future climate-change-induced range shift studies.

Supplementary Materials

The following supporting information can be downloaded at https://www.mdpi.com/article/10.3390/f13101619/s1: File S1. Names and records for 99 considered species as well as their MaxEnt simulation results. File S2. Climate velocity map for 13 variables at 10 min × 10 min under four climate change scenarios.

Author Contributions

Conceptualization, G.L. and J.H.; methodology, G.L. and J.H.; validation, G.L. and J.H.; data curation, G.L. and J.H; writing—original draft preparation, G.L. and J.H; writing—review and editing, G.L. and J.H; visualization, G.L. and J.H; project administration, G.L. and J.H.; funding acquisition, G.L. and J.H. All authors have read and agreed to the published version of the manuscript.

Funding

This research was funded by National Natural Science Foundation of China, grant number 31971488 and 31500449.

Institutional Review Board Statement

Not applicable.

Informed Consent Statement

Not applicable.

Data Availability Statement

Not applicable.

Acknowledgments

We are very grateful to Sylvio Péllico Netto, who made a lot of insightful and constructive comments that significantly improved the manuscript. We thank the English editor for his language polishing work.

Conflicts of Interest

The authors declare no conflict of interest.

Appendix A

Figure A1. Climate velocity of annual biotemperature in four future climate change scenarios.
Forests 13 01619 g0a1
Figure A2. Climate velocity of annual mean temperature in four future climate change scenarios.
Forests 13 01619 g0a2
Figure A3. Climate velocity of annual precipitation in four future climate change scenarios.
Forests 13 01619 g0a3
Figure A4. Climate velocity of annual range of temperature in four future climate change scenarios.
Forests 13 01619 g0a4
Figure A5. Climate velocity of coldness in four future climate change scenarios.
Forests 13 01619 g0a5
Figure A6. Climate velocity of humidity index in four future climate change scenarios.
Forests 13 01619 g0a6
Figure A7. Climate velocity of minimum temperature of the coldest month in four future climate change scenarios.
Forests 13 01619 g0a7
Figure A8. Climate velocity of maximum temperature of the warmest month in four future climate change scenarios.
Forests 13 01619 g0a8
Figure A9. Climate velocity of precipitation of the driest month in four future climate change scenarios.
Forests 13 01619 g0a9
Figure A10. Climate velocity of potential evapotranspiration rate in four future climate change scenarios.
Forests 13 01619 g0a10
Figure A11. Climate velocity of precipitation of seasonality in four future climate change scenarios.
Forests 13 01619 g0a11
Figure A12. Climate velocity of precipitation of the wettest month in four future climate change scenarios.
Forests 13 01619 g0a12
Figure A13. Climate velocity of warmth index in four future climate change scenarios.
Forests 13 01619 g0a13

References

  1. IPCC. Summary for policymakers. In Climate Change 2014: Impacts, Adaptation, and Vulnerability; Cambridge University Press: Cambridge, UK; New York, NY, USA, 2014. [Google Scholar]
  2. Qian, W.; Zhu, Y. Climate Change in China from 1880 to 1998 and its impact on the environmental condition. Clim. Chang. 2001, 50, 419–444. [Google Scholar] [CrossRef]
  3. Ding, Y.; Ren, G.; Shi, G.; Gong, P.; Zheng, X.; Zhai, P.; Zhang, D.; Zhao, Z.; Wang, S.; Wang, H.; et al. National Assessment Report of Climate Change (I): Climate change in China and its future trend. Clim. Chang. Res. 2006, 2, 3–8. [Google Scholar]
  4. Ren, G.; Ding, Y.; Zhao, Z.; Zheng, J.; Wu, T.; Tang, G.; Xu, Y. Recent progress in studies of climate change in China. Adv. Atmos. Sci. 2012, 29, 958–977. [Google Scholar] [CrossRef]
  5. Thomas, C.D.; Cameron, A.; Green, R.E.; Bakkenes, M.; Beaumont, L.J.; Collingham, Y.C.; Erasmus, B.F.N.; de Siqueira, M.F.; Grainger, A.; Hannah, L.; et al. Extinction risk from climate change. Nature 2004, 427, 145–148. [Google Scholar] [CrossRef] [PubMed] [Green Version]
  6. Dyderski, M.K.; Paz, S.; Frelich, L.E.; Jagodzinski, A.M. How much does climate change threaten European forest tree species distributions? Glob. Chang. Biol. 2018, 24, 1150–1163. [Google Scholar] [CrossRef] [PubMed]
  7. Moat, J.; Gole, T.W.; Davis, A.P. Least concern to endangered: Applying climate change projections profoundly influences the extinction risk assessment for wild arabica coffee. Glob. Chang. Biol. 2019, 25, 390–403. [Google Scholar] [CrossRef] [Green Version]
  8. Chen, X.; Zhang, X.S.; Li, B.L. The possible response of life zones in China under global climate change. Glob. Planet. Chang. 2003, 38, 327–337. [Google Scholar] [CrossRef]
  9. Yin, Y.; Ma, D.; Wu, S. Climate change risk to forests in China associated with warming. Sci. Rep. 2018, 8, 13. [Google Scholar] [CrossRef] [Green Version]
  10. Li, G.; Huang, J.; Guo, K.; Du, S. Projecting species loss and turnover under climate change for 111 Chinese tree species. For. Ecol. Manag. 2020, 477, 118488. [Google Scholar] [CrossRef]
  11. Guo, Y.; Zhao, Z.; Zhu, F.; Li, X. Climate change may cause distribution areas loss for tree species in southern China. For. Ecol. Manag. 2022, 511, 120134. [Google Scholar] [CrossRef]
  12. Aitken, S.N.; Yeaman, S.; Holliday, J.A.; Wang, T.; Curtis-McLane, S. Adaptation, migration or extirpation: Climate change outcomes for tree populations. Evol. Appl. 2008, 1, 95–111. [Google Scholar] [CrossRef] [PubMed]
  13. Aubin, I.; Munson, A.D.; Cardou, F.; Burton, P.J.; Isabel, N.; Pedlar, J.H.; Paquette, A.; Taylor, A.R.; Delagrange, S.; Kebli, H.; et al. Traits to stay, traits to move: A review of functional traits to access sensitivity and adaptive capacity of temperate and boreal trees to climate change. Environ. Rev. 2016, 24, 164–186. [Google Scholar] [CrossRef]
  14. Du, H.; Liu, J.; Li, M.H.; Buntgen, U.; Yang, Y.; Wang, L.; Wu, Z.; He, H.S. Warming-induced upward migration of the alpine treeline in the Changbai Mountains, northeast China. Glob. Chang. Biol. 2018, 24, 1256–1266. [Google Scholar] [CrossRef] [PubMed]
  15. Dang, H.; Zhang, Y.; Zhang, Y.; Zhang, K.; Zhang, Q. Variability and rapid response of subalpine fir (Abies fargesii) to climate warming at upper altitudinal limits in north-centeral China. Trees 2015, 29, 785–795. [Google Scholar] [CrossRef]
  16. Shi, H.; Zhou, Q.; Xie, F.; He, N.; He, R.; Zhang, K.; Zhang, Q.; Dang, H. Disparity in elevational shifts of upper species limits in response to recent climate change warming in the Qinling Mountains, North-central China. Sci. Total Environ. 2020, 706, 135718. [Google Scholar] [CrossRef] [PubMed]
  17. Wang, T.; Zhang, Q.B.; Ma, K. Treeline dynamics in relation to climatic variability in the central Tianshan Mountains, northwestern China. Glob. Ecol. Biogeogr. 2006, 15, 406–415. [Google Scholar] [CrossRef]
  18. Liang, E.Y.; Wang, Y.F.; Piao, S.L.; Lu, X.M.; Camarero, J.J.; Zhu, H.F.; Zhu, L.P.; Ellison, A.M.; Ciais, P.; Penuelas, J. Species interactions slow warming-induced upward shifts of treelines on the Tibetan Plateau. Proc. Natl. Acad. Sci. USA 2016, 113, 4380–4385. [Google Scholar] [CrossRef] [Green Version]
  19. Huang, J.; Li, G.; Li, J.; Zhang, X.; Yan, M.; Du, S. Projecting the Range Shifts in Climatically Suitable Habitat for Chinese Sea Buckthorn under Climate Change Scenarios. Forests 2018, 9, 9. [Google Scholar] [CrossRef] [Green Version]
  20. Li, G.; Paul, C.; Huang, J. Black locust (Robinia pseudoacacia L.) range shifts in China: Application of a global model in climate change futures. Clim. Chang. Ecol. 2021, 2, 100036. [Google Scholar] [CrossRef]
  21. Kou, X.; Li, Q.; Beierkuhnlein, C.; Zhao, Y.; Liu, S. A new tools for exploring climate change induced range shifts of conifer species in China. PLoS ONE 2014, 9, e98643. [Google Scholar] [CrossRef]
  22. LaSorte, F.A.; Thompson, F.R. Poleward shifts in winter ranges of North American birds. Ecology 2007, 88, 1803–1812. [Google Scholar]
  23. Fei, S.; Desprez, J.M.; Potter, K.M.; Jo, I.; Knott, J.A.; Oswalt, C.M. Divergence of species responses to climate change. Sci. Adv. 2017, 3, e1603055. [Google Scholar] [CrossRef] [PubMed]
  24. Chen, I.C.; Hill, J.K.; Ohlemuller, R.; Roy, D.B.; Thomas, C.D. Rapid range shifts of species associated with high levels of climate warming. Science 2011, 333, 1024–1026. [Google Scholar] [CrossRef] [PubMed]
  25. VanDerWal, J.; Murphy, H.T.; Kutt, A.S.; Perkins, G.C.; Bateman, B.L.; Perry, J.J.; Reside, A.E. Focus on poleward shifts in species’ distribution underestimates the fingerprint of climate change. Nat. Clim. Chang. 2013, 3, 239–243. [Google Scholar] [CrossRef]
  26. Lenoir, J.; Svenning, J.C. Climate-related range shifts—A global multidimensional synthesis and new research directions. Ecography 2015, 38, 15–28. [Google Scholar] [CrossRef]
  27. Boisvert-Marsh, L.; Perie, C.; Blois, S.D. Shifting with climate? Evidence for recent changes in tree species distribution at high latitudes. Ecosphere 2014, 5, 1–33. [Google Scholar] [CrossRef]
  28. Zhu, K.; Woodall, C.W.; Clark, J.S. Failure to migrate: Lack of tree range expansion in response to climate change. Glob. Chang. Biol. 2011, 18, 1042–1052. [Google Scholar] [CrossRef]
  29. Aubin, I.; Boisvert-Marsh, L.; Kebli, H.; McKenney, D.; Pedlar, J.; Lawrence, K.; Hogg, E.H.; Boulanger, Y.; Gauthier, S.; Ste-Marie, C. Tree vulnerability to climate change: Improving exposure-based assessments using traits as indicators of sensitivity. Ecospher 2018, 9, e02108. [Google Scholar] [CrossRef]
  30. Loarie, S.R.; Duffy, P.B.; Hamilton, H.; Asner, G.P.; Field, C.B.; Ackerly, D.D. The velocity of climate change. Nature 2009, 462, 1052–1111. [Google Scholar] [CrossRef]
  31. Dobrowski, S.Z.; Abatzoglou, J.; Swanson, A.K.; Greenberg, J.A.; Mynsberge, A.R.; Holden, Z.A.; Schwartz, M.K. The climate velocity of the contiguous United States during the 20th century. Glob. Chang. Biol. 2012, 19, 241–251. [Google Scholar] [CrossRef] [Green Version]
  32. Soberon, J.; Nakamura, M. Niches and distributional area: Concepts, methods, and assumptions. P. Natl. Acad. Sci. USA 2009, 106, 19644–19650. [Google Scholar] [CrossRef] [PubMed] [Green Version]
  33. Tamme, R.; Gotzenberger, L.; Zobel, M.; Bullock, J.M.; Hooftman, D.; Kaasik, A.; Partel, M. Predicting species’ maximum dispersal distances from simple plant traits. Ecology 2014, 95, 505–513. [Google Scholar] [CrossRef] [PubMed]
  34. Shi, H.; Tian, H.; Lange, S.; Yang, J.; Pan, S.; Fu, B.; Reyer, C. Terrestrial biodiversity threatened by increasing a global aridity velocity under high level warming. Proc. Natl. Acad. Sci. USA 2021, 118, e2015552118. [Google Scholar] [CrossRef]
  35. ECVC (Editorial Committee for Vegetaiton of China). Vegetation of China; Science Press: Beijing, China, 1980. [Google Scholar]
  36. Hou, X.Y. Vegetation of China with reference to its geographical distribution. Ann. Mo. Bot. Gard. 1983, 70, 509–549. [Google Scholar] [CrossRef]
  37. Gratzfeld, J.; Wen, X.; Jones, M.; Rivers, M. Safeguarding China’s native trees—A review of integrated conservation practices between 2008 and 2020. Glob. Ecol. Conserv. 2022, 35, e02101. [Google Scholar] [CrossRef]
  38. Guo, K.; Werger, M.J.A. Effect of prevailing monsoons on the distribution of beeches in continental East Asia. For. Ecol Manag. 2010, 259, 2197–2203. [Google Scholar] [CrossRef]
  39. Hou, X. 1:1,000,000 Vegetation Atlas of China. Chinese Academy of Science, the Editorial Board of Vegetation Map of China; Science Press: Beijing, China, 2001. [Google Scholar]
  40. Liu, H.Y.; Yin, Y.; Hao, Q.; Liu, G. Sensitivity of temperate vegetation to Holocene development of East Asian. Quat. Sci. Rev. 2014, 98, 126–134. [Google Scholar] [CrossRef]
  41. Wan, J.Z.; Wang, C.J.; Yu, F.H. Spatial conservation prioritization for dominant tree species of Chinese forest communities under climate change. Clim. Chang. 2017, 144, 303–316. [Google Scholar] [CrossRef]
  42. Booth, T.H. Why understanding the pioneering and continuing contributions of Bioclim to species distribution modelling is important. Austral Ecol. 2018, 43, 852–860. [Google Scholar] [CrossRef] [Green Version]
  43. Holdridge, L.R. Determination of world plant formations from simple climatic data. Science 1947, 105, 367–368. [Google Scholar] [CrossRef]
  44. Kira, T. A New Classification of Climate in Eastern Asia as the Basis for Agricultural Geography; Horticultural Institute, Kyoto University: Kyoto, Japan, 1945. [Google Scholar]
  45. Li, G.Q.; Xu, G.H.; Guo, K.; Du, S. Mapping the global potential geographical distribution of black locust (Robinia pseudoacacia L.) using herbarium data and a maximum entropy model. Forests 2014, 5, 2773–2792. [Google Scholar] [CrossRef] [Green Version]
  46. Worldclim. Global Climate Data—Free Climate Data for Ecological Modeling and GIS. Available online: http://www.worldclim.org/ (accessed on 10 May 2019).
  47. Hijmans, R.J.; Cameron, S.E.; Parra, J.L.; Jones, P.G.; Jarvis, A. Very high resolution interpolated climate surfaces for global land areas. Int. J. Climatol. 2005, 25, 1965–1978. [Google Scholar] [CrossRef]
  48. Phillips, S.J.; Anderson, R.P.; Schapire, R.E. Maximum entropy modeling of species geographic distributions. Ecol. Model. 2006, 190, 231–259. [Google Scholar] [CrossRef] [Green Version]
  49. Hernandez, P.A.; Graham, C.H.; Master, L.L.; Albert, D.L. The effect of sample size and species characteristics on performance of difference of different species distribution modeling methods. Ecography 2006, 29, 773–785. [Google Scholar] [CrossRef]
  50. Stockwell, D.; Peters, D. The GARP modelling system: Problems and solutions to automated spatial prediction. Int. J. Geogr. Inf. Sci. 1999, 13, 143–158. [Google Scholar] [CrossRef]
  51. Elith, J.; Graham, C.H.; Anderson, R.P.; Dudik, M.; Ferrier, S.; Guisan, A.; Hijmans, R.J.; Huettman, F.; Lehikoinen, A.; Lehmann, A.; et al. Novel methods improve prediction of species’ distribution from occurrence data. Ecography 2006, 29, 129–151. [Google Scholar] [CrossRef] [Green Version]
  52. Phillips, S.J.; Anderson, R.P.; Dudík, M.; Schapire, R.E.; Blair, M.E. Opening the black box: An open-source release of Maxent. Ecography 2017, 40, 887–893. [Google Scholar] [CrossRef]
  53. Fielding, A.H.; Bell, J.F. A review of methods for the assessment of prediction errors in conservation presence/absence models. Environ. Conserv. 1997, 24, 38–49. [Google Scholar] [CrossRef]
  54. Merow, C.; Smith, M.J.; Silander, J.A. A practical guide to maxent for modeling species’ distributions: What it does, and why inputs and settings matter. Ecography 2013, 36, 1058–1069. [Google Scholar] [CrossRef]
  55. Serra-Diaz, J.M.; Franklin, J.; Ninyerola, M.; Davis, F.W.; Syphard, A.D.; Regan, H.M.; Ikegami, M. Bioclimatic velocity: The pace of species exposure to climate change. Divers. Distrib. 2014, 20, 169–180. [Google Scholar] [CrossRef]
  56. Hamann, A.; Roberts, D.R.; Barber, Q.E.; Carroll, C.; Nielsen, S.E. Velocity of climate change algorithms for guiding conservation and management. Glob. Chang. Biol. 2015, 21, 997–1004. [Google Scholar] [CrossRef] [PubMed]
  57. Landis, J.R.; Koch, G.G. The measurement of observer agreement for categorical data. Biometrics 1977, 33, 159–174. [Google Scholar] [CrossRef] [PubMed]
  58. Cohen, J. A coefficient of agreement for nominal scales. Educ. Psychol. Meas. 1960, 20, 37–46. [Google Scholar] [CrossRef]
  59. Artstein, R.; Poesio, M. Inter-coder agreement for computational linguistics. Comput. Linguist. 2008, 34, 555–596. [Google Scholar] [CrossRef] [Green Version]
  60. Burrows, M.T.; Schoeman, D.S.; Richardson, A.J.; Molinos, J.G.; Hoffmann, A.; Buckley, L.B.; Moore, P.J.; Brown, C.J.; Bruno, J.F.; Duarte, C.M.; et al. Geographical limits to species-range shifts are suggested by climate velocity. Nature 2014, 507, 492–495. [Google Scholar] [CrossRef] [Green Version]
  61. Iverson, L.R.; Prasad, A.M.; Matthews, S.N.; Peters, M. Estimating potential habitat for 134 eastern US tree species under six climate scenarios. For. Ecol. Manag. 2008, 254, 390–406. [Google Scholar] [CrossRef]
  62. Zhang, Y.R.; Liu, G.; Lu, Q.; Xiong, D.Y.; Li, G.Q.; Du, S. Understanding the limiting climatic factors on the suitable habitat of Chinese Alfalfa. Forests 2022, 13, 482. [Google Scholar] [CrossRef]
  63. Garcia, R.; Cabeza, M.; Rahbek, C.; Araujo, M.B. Multiple dimensions of climate change and their implication for biodiversity. Science 2014, 344, 1247579. [Google Scholar] [CrossRef] [Green Version]
  64. Harsch, M.A.; HilleRisLambers, J. Climate warming and seasonal precipitation change interact to limit species distribution shifts across western North America. PLoS ONE 2016, 11, e0159184. [Google Scholar] [CrossRef] [Green Version]
  65. Booth, T.H. Assessing species climatic requirements beyond the realized niche: Some lessons mainly from tree species distribution modelling. Clim. Chang. 2017, 145, 259–271. [Google Scholar] [CrossRef]
  66. Li, G.Q.; Zhang, X.Q.; Huang, J.H.; Wen, Z.M.; Du, S. Afforestation and climatic niche dynamics of black locust (Robinia pseudoacacia). For. Ecol. Manag. 2018, 407, 184–190. [Google Scholar] [CrossRef]
  67. Frick, E.C.; Ordonez, A.; Rogers, H.S.; Svenning, J. The effects of defaunation on plant’s capacity to track climate change. Science 2022, 375, 210–214. [Google Scholar] [CrossRef] [PubMed]
  68. Copenhaver-Parry, P.E.; Carroll, C.J.W.; Martin, P.H.; Talluto, M.V. Multi-scale integration of tree recruitment and range dynamics in a changing climate. Glob. Ecol. Biogeogr. 2020, 29, 102–116. [Google Scholar] [CrossRef] [Green Version]
  69. Solarik, K.A.; Cazelles, K.; Messier, C.; Bergeron, Y.; Gravel, D. Priority effects will impact range shifts of temperate tree species into boreal forest. J. Ecol. 2019, 108, 1155–1173. [Google Scholar] [CrossRef]
  70. Lafleur, B.; Pare, D.; Munson, A.; Bergeron, Y. Response of northeastern North American forests to climate change: Will soil conditions constrain tree species migration. Environ. Rev. 2010, 18, 279–289. [Google Scholar] [CrossRef] [Green Version]
  71. Miller, K.M.; McGill, B.J. Land use and life history limit migration capacity of eastern tree species. Glob. Ecol. Biogeogr. 2017, 27, 57–67. [Google Scholar] [CrossRef]
  72. Brice, M.; Cazelles, K.; Legendre, P.; Fortin, M. Disturbances amplify tree community responses to climate change in a temperate-boreal ecotone. Glob. Ecol. Biogeogr. 2019, 28, 1668–1681. [Google Scholar] [CrossRef]
  73. Bryan, B.A.; Gao, L.; Ye, Y.Q.; Sun, X.F.; Connor, J.D.; Crossman, N.D.; Stafford-Smith, M.; Wu, J.G.; He, C.Y.; Yu, D.Y.; et al. China’s response to a national land-system sustainability emergency. Nature 2018, 559, 193–204. [Google Scholar] [CrossRef]
  74. Cui, W.; Liu, J.; Jia, J.; Wang, P. Terrestrial ecological restoration in China: Identifying advances and gaps. Environ. Sci. Eur. 2021, 33, 123. [Google Scholar] [CrossRef]
  75. Mascarelli, A.L. Climate zone will shift faster as world warms. Nature 2013. [Google Scholar] [CrossRef]
  76. Thuiller, W. Patterns and uncertainties of species’ range shifts under climate change. Glob. Chang. Biol. 2004, 10, 2020–2027. [Google Scholar] [CrossRef]
  77. Skidmore, A.K.; Franklin, J.; Dawson, T.P.; Pilesjo, P. Geospatial tools address emerging issues in spatial ecology: A review and commentary on the special issue. Int. J. Geogr. Inf. Sci. 2011, 25, 337–365. [Google Scholar] [CrossRef]
  78. Guisan, A.; Thuiller, W.; Zimmermann, N.E. (Eds.) 8—Ecological Scales: Issues of Resolution and Extent from Part II—Data Acquisition, Sampling Design, and Spatial Scales. In Habitat Suitability and Distribution Models with Applications in R.; Cambridge University Press: Cambridge, UK, 2017; pp. 135–150. [Google Scholar]
  79. Seo, C.; Thorne, J.H.; Hannah, L.; Thuiller, W. Scale effects in species distribution models: Implications for conservation planning under climate change. Biol. Lett. 2008, 5, 39–43. [Google Scholar] [CrossRef] [PubMed] [Green Version]
  80. Song, W.; Kim, E.; Lee, D.; Lee, M.; Jeon, S.W. The sensitivity of species distribution modeling to scale differences. Ecol. Model. 2013, 248, 113–118. [Google Scholar] [CrossRef]
Figure 1. Climatic and topographic map of China: temperature gradient (A), precipitation gradient (B), elevation gradient (C), and climate zoning map (D).
Forests 13 01619 g001
Figure 2. The relative importance of climatic variables (A) in determining the distribution of trees in China, and the distribution frequency of important climatic variables (B) with contributions greater than 0.08.
Forests 13 01619 g002
Figure 3. Change from 1975 to 2070 in the distribution centroid of the climatic habitat of Chinese tree species. The arrows represent the distance (magnitude) and direction of change of the centroid of suitable habitats over the 95-year period under four RCP scenarios: (A) RCP2.6, (B) RCP4.5, (C) RCP6.0, and (D) RCP8.5.
Forests 13 01619 g003
Figure 4. Comparative study on the consistency of species shift direction under different climate change scenarios. The green color in the figure shows the diagonal values, indicating consistency.
Forests 13 01619 g004
Figure 5. T-test of observed and expected probabilities of range shift for north, northwest + northeast, and north + northwest + northeast directions.
Forests 13 01619 g005
Figure 6. Climate velocity of climatic variables under four climate change scenarios.
Forests 13 01619 g006
Figure 7. Climate shift direction of annual temperature across climate change scenarios and average of all climate variables across scenarios.
Forests 13 01619 g007
Figure 8. Comparative study on the consistency of species shift direction between bioclimatic envelope model and climate velocity method. The green color in the figure shows the diagonal values, indicating consistency.
Forests 13 01619 g008
Table 1. Description of 13 climatic variables.
IDVariableAbbreviationUnit
1Annual mean temperatureAMT°C
2Maximum temperature of the warmest monthMTWM°C
3Minimum temperature of the coldest monthMTCM°C
4Annual range of temperatureART°C
5Annual precipitationAPmm
6Precipitation of the wettest monthPWMmm
7Precipitation of the driest monthPDMmm
8Precipitation of seasonalityPSDmm
9Annual biotemperatureABT°C
10Warmth indexWI°C
11Coldness indexCI°C
12Potential evapotranspiration ratePER-
13Humidity indexHImm/°C
Table 2. Classification of species range shift direction (unit of angle is degrees, °).
IDBearingAbbreviationCenter AngleBearing Angle
1NorthN0337.5–22.5
2NortheastNE4522.5–67.5
3EastE9067.5–112.5
4SoutheastSE135112.5–157.5
5SouthS180157.5–202.5
6SouthwestSW225202.5–247.5
7WestW270247.5–292.5
8NorthwestNW315292.5–337.5
Table 3. Kappa level of evaluation criteria of consistency.
KappaAgreement
<0.01No agreement
0.01–0.20None to slight
0.20–0.40Fair agreement
0.40–0.60Moderate agreement
0.60–0.80Substantial agreement
0.80–1.00Almost perfect agreement
Table 4. The number and shifting velocity of trees in eight directional classes under four climatic change scenarios.
DirectionNumber of SpeciesSpeed of Shift (km/year)
RCP2.6RCP4.5RCP6.0RCP8.5RCP2.6RCP4.5RCP6.0RCP8.5
N161313140.86 ± 0.451.61 ± 0.771.53 ± 0.872.41 ± 1.58
NE15814101.35 ± 0.881.63 ±1.371.79 ± 1.362.63 ± 2.47
E610762.34 ± 1.821.8 ± 1.962.3 ± 2.283.09 ± 2.49
SE63310.71 ± 0.531.52 ± 0.41.61 ± 0.432.27
S0113-0.790.801.13 ± 1.02
SW35782.59 ± 1.104.80 ± 3.243.31 ± 3.035.65 ± 5.14
W202326302.00 ± 0.992.45 ± 1.272.46 ± 1.53.81 ± 2.42
NW333628271.18 ± 0.751.84 ± 1.21.83 ± 1.043.21 ± 2.61
Average shift speed across species and directions1.40 ± 0.992.06 ± 1.542.07 ± 1.533.34 ± 2.74
Table 5. Species shift speed and numbers across directions, RCP scenario, and regions (unit of speed is km/year; numbers in brackets indicate the number of species).
RegionScenarioNNEESESSWWNW
Monsoon regionRCP2.60.87 ± 0.471.47 ± 0.890.970.77 ± 0.77--2.21 ± 1.121.52 ± 0.87
(14)(10)(1)(3)(6)(15)
RCP4.51.60 ± 0.861.88 ± 1.520.95 ± 0.871.60--3.40 ± 1.302.01 ± 1.29
(10)(6)(6)(1)(7)(19)
RCP6.01.53 ± 0.991.88 ± 1.441.13 ± 0.311.42-1.133.39 ± 1.852.09 ± 1.22
(10)(11)(3)(1)(1)(7)(16)
RCP8.52.42 ± 1.893.17 ± 2.491.35 ± 0.572.270.451.60 ± 0.136.23 ± 2.093.62 ± 3.16
(10)(8)(3)(1)(1)(2)(7)(17)
Alpine regionRCP2.6------1.81 ± 0.641.01 ± 0.54
(10)(12)
RCP4.5------2.00 ± 0.711.73 ± 0.87
(10)(12)
RCP6.0------2.37 ± 1.001.44 ± 0.48
(13)(9)
RCP8.52.21-----3.02 ± 1.272.52 ± 1.05
(1)(11)(10)
Arid regionRCP2.60.79 ± 0.221.11 ± 0.902.61 ± 1.890.64 ± 0.33-2.59 ± 1.112.14 ± 1.630.66 ± 0.32
(2)(5)(5)(3)(3)(4)(6)
RCP4.51.64 ± 0.500.85 ± 0.323.07 ± 2.581.48 ± 0.560.794.8 ± 3.242.08 ± 1.531.46 ± 1.63
(3)(2)(4)(2)(1)(5)(6)(5)
RCP6.01.52 ± 0.311.48 ± 1.163.17 ± 2.811.70 ± 0.570.803.67 ± 3.151.57 ± 1.601.55 ± 1.06
(3)(3)(4)(2)(1)(6)(6)(3)
RCP8.52.42 ± 0.150.49 ± 0.264.84 ± 2.44-1.47 ± 1.177.00 ± 5.313.11 ± 2.58-
(3)(2)(3)(2)(6)(12)
Publisher’s Note: MDPI stays neutral with regard to jurisdictional claims in published maps and institutional affiliations.

