Article

Extreme Winter Storms Have Variable Effects on the Population Dynamics of Canopy Dominant Species in an Old-Growth Subtropical Forest

1
College of Chemistry and Life Sciences, Zhejiang Normal University, Jinhua 321004, China
2
College of Information Science and Technology, Nanjing Forestry University, Nanjing 210037, China
3
Key Laboratory of National Forestry and Grassland Administration on Biodiversity Conservation in Karst Mountainous Areas of Southwestern China, Guizhou Normal University, Guiyang 550025, China
4
State Key Laboratory of Vegetation and Environmental Change, Institute of Botany, The Chinese Academy of Sciences, Beijing 100093, China
5
Ministry of Education Key Laboratory of Conservation Biology for Endangered Wildlife, College of Life Sciences, Zhejiang University, Hangzhou 310058, China
*
Authors to whom correspondence should be addressed.
These authors contributed equally to this work.
Forests 2022, 13(10), 1634; https://doi.org/10.3390/f13101634
Submission received: 30 August 2022 / Revised: 23 September 2022 / Accepted: 3 October 2022 / Published: 6 October 2022
(This article belongs to the Special Issue Long-Term Monitoring of Forest Biodiversity and Dynamics in China)

Abstract

:
Extreme climatic events are predicted to increase in frequency and magnitude as global climate change continues. Extreme climatic events have profound impacts on community structure and dynamics, but their effects on the dominant species within a community remains unclear. To explore this issue, we analyzed changes in population dynamics and dead individuals’ spatial pattern for several dominant species (Castanopsis eyrei, Schima superba, Pinus massoniana, and Daphniphyllum oldhamii) among different habitats in a subtropical forest before and after a significant winter storm that occurred in February 2008. Using the Gutianshan 24-ha forest plot as a representative sample, we found that the plot-level DBH of P. massoniana and C. eyrei significantly increased after the winter storm, while the plot-level basal area of P. massoniana and S. superba decreased significantly. In addition, P. massoniana was most affected by the storm (mortality: 9.08%; population change rate: −8.93%), followed by C. eyrei (mortality: 6.93%; population change rate: −4.91%). Small-diameter individuals experienced higher mortality rates, but the diameter structure of the dominant species at the population level remained basically stable. The number of individuals, the density of the dominant population, the number of mortalities, and the mortality rate of the dominant species differed among habitats. The spatial point patterns of the dead individuals at each life stage were mainly aggregated in distribution, and the degree of aggregation tended to decrease with increasing scale. In conclusion, the population dynamics of dominant species were significantly altered following the winter storm, but the extent of the changes varied with species. Our study suggests that analyzing the dominant species of a community contributes to a better understanding of the biological response of forest ecosystems in the face of extreme climatic events.

1. Introduction

Ongoing global climate change increases environmental fluctuations and the frequency and intensity of extreme climate events (such as extreme winter storms and heat waves) [1,2]. Extreme climatic events, characterized as extremely rare, low frequency, and intense climatic events [3], have profound impacts on species composition, community dynamics, and local scale species interactions [4,5,6]. Winter storms are one of the main types of extreme climate events, which can severely damage tree individuals in a community and cause branch breakage, stem snaps, tip ups, and even death [7,8,9]. The death or damage of these individual trees directly affects population characteristics and also changes the spatial pattern of species [9,10].
Canopy dominant species are an important part of the forest community, accounting for most individuals and most of the total biomass, and play a crucial role in forest structure and the formation of the forest environment [11,12]. Forest canopy species usually interact directly, through leaf area, with the external environment and are therefore subject to more stress and survival pressure [13,14]. Usually, when winter storms occur, large-diameter individuals in the canopy intercept large amounts of snow, resulting in extensive damage and sometimes death [15]. Therefore, canopy-dominant species reflect the extent of winter storm damage to the forest community. However, we still lack knowledge about how the population dynamics of canopy-dominant species respond differently in the face of extreme climate events.
Species could have strong habitat preference within a community due to their species characteristics and preferences for environmental factors such as nutrient and water availability, light availability, and topography [16,17]. The species distributed in habitats with high convexo-concave degree, slope, and elevation are more affected by winter storms [18]. Following winter storms, species often show different degrees of resistance due to species identity, tree diameter, and habitat differences, thus showing different mortality patterns [8,15,19,20,21]. Thus, the population dynamics of canopy-dominant species may show significant differences in different habitats following the winter storm.
The species spatial distribution pattern represents an arrangement of the individual-level structure within a community, and the degree to which individuals of species are aggregated or dispersed is crucial to understanding how a species uses environmental resources [22]. Previous study of spatial distribution patterns mostly focuses on the living individual to improve understanding of the mechanisms of species coexistence in diverse communities [23,24]. However, few studies focus on the species spatial pattern of individual dead trees following an extreme climate event such as a winter storm. Moreover, how winter storms influence the spatial pattern of dead individuals remains unknown. Therefore, considering the spatial patterns of individual dead trees caused by a winter storm could improve our understanding of the response of species to the winter storm in species-rich communities.
From 10 January to 6 February 2008, an extreme winter storm with ice and snow build-up in southern China caused massive mechanical damage to native subtropical forests [7,25]. China’s State Forestry Administration (SFA) estimated that the storm damaged 20.86 million hectares, one tenth of China’s forests and plantations [25]. The rare and extreme snow–ice storm was more damaging than the 1998 North American ice storm [7]. In the Gutianshan plot, the winter storm severely damaged one-third of trees, one-third were lightly damaged, and the remaining third were unaffected [8]. Heavy winter storms are extremely uncommon in Chinese subtropical forests, and the 2008 winter storm was the only storm observed in the region in the last fifty years [7]. To explore the effects of the winter storm on canopy dominant species populations in subtropical forests, we focused on the following questions by using the Gutianshan 24-ha forest plot as a representative sample:
(1)
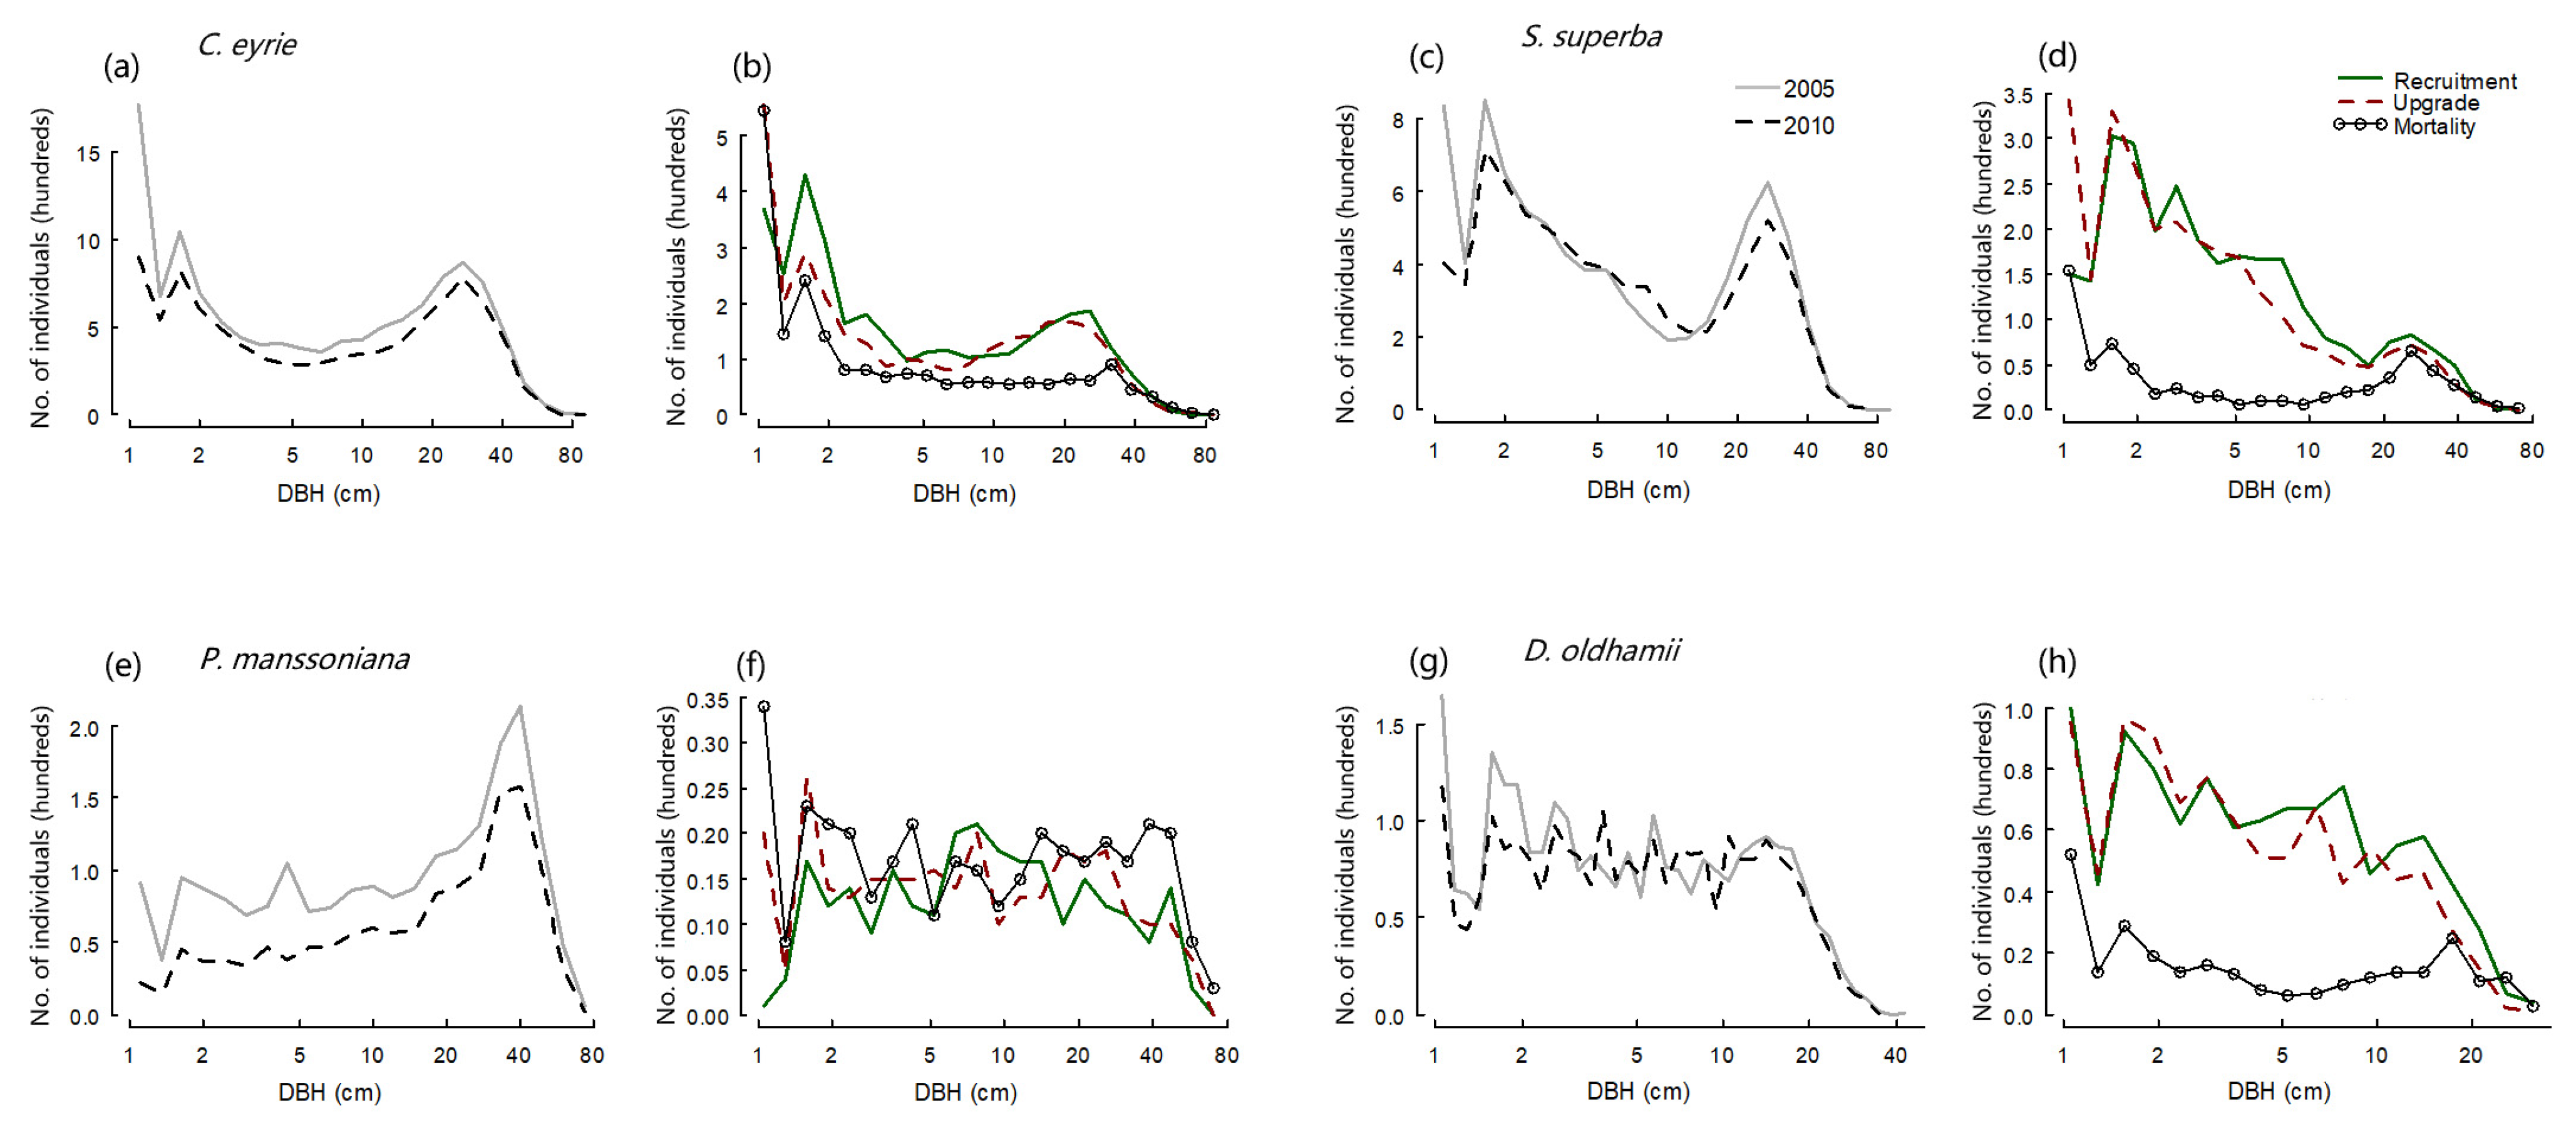
How do the population structures of the four canopy dominant species change following the winter storm?
(2)
How does damage to the four canopy dominant species caused by the winter storm vary across habitat types?
(3)
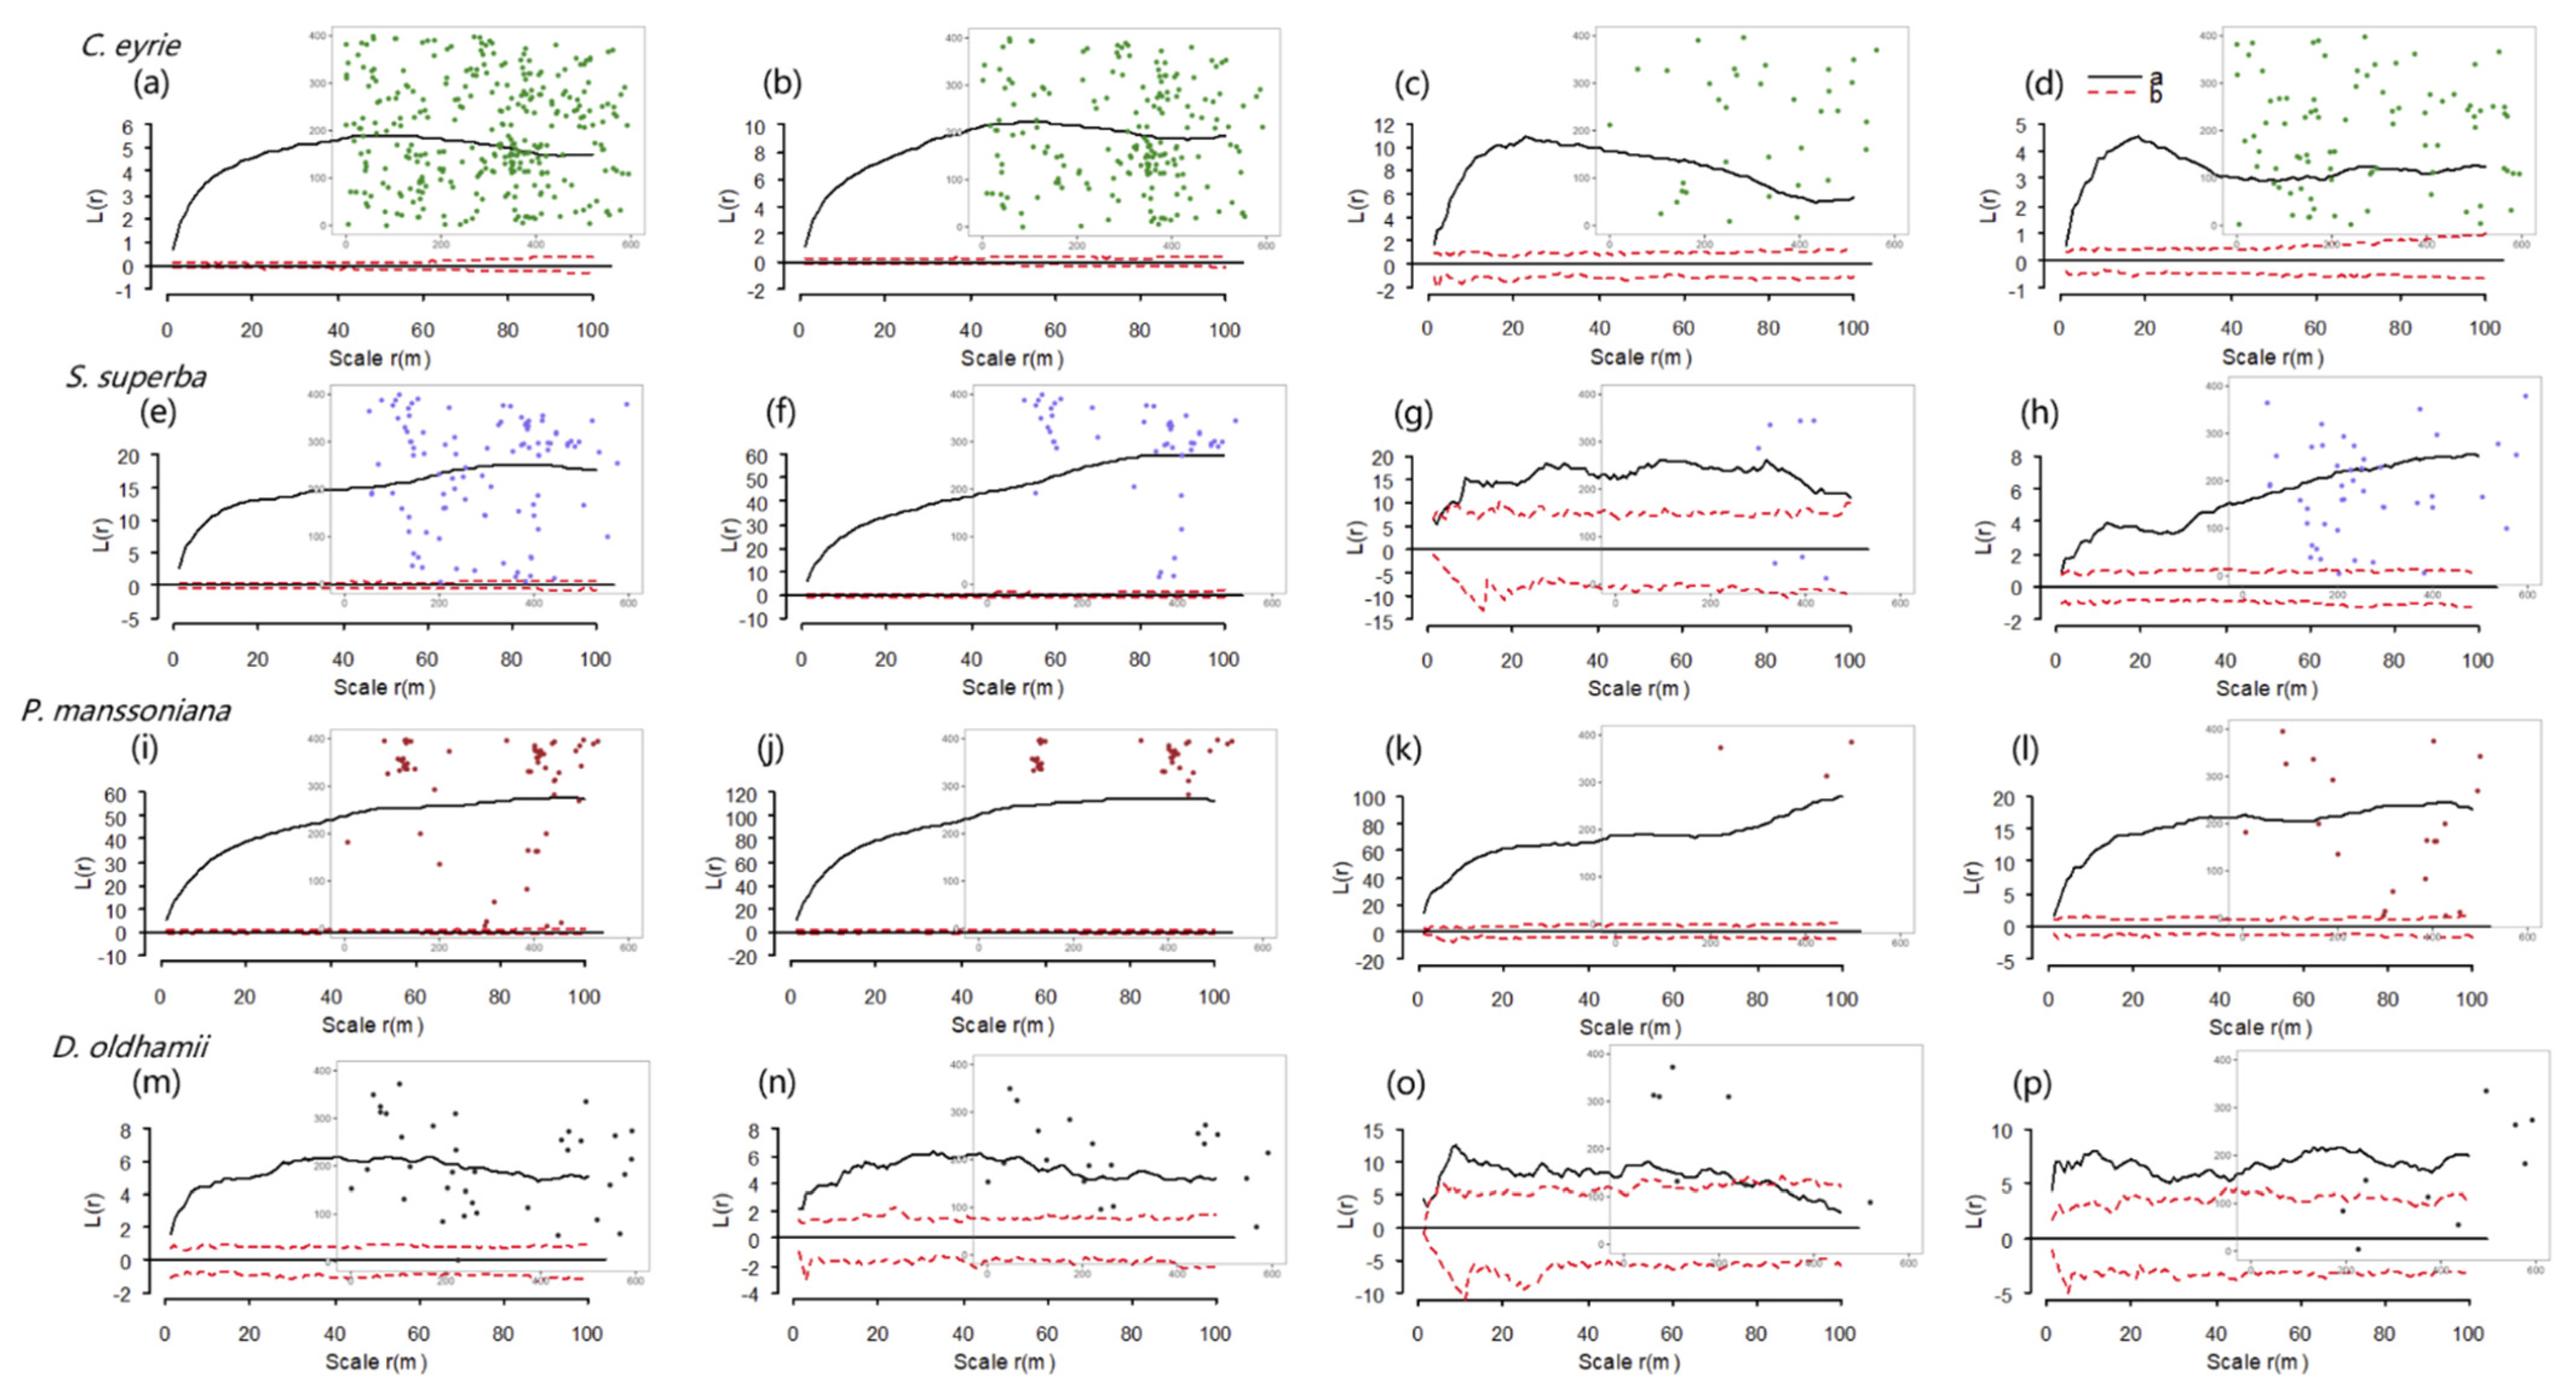
What is the spatial distribution pattern of dead individuals for the four dominant species?

2. Materials and Methods

2.1. Study Site and Tree Inventory

Qianjiangyuan National Park is located in the northwestern part of Kaihua County, Zhejiang Province, China. The national park encompasses a large, concentrated distribution of low-altitude evergreen broad-leaved old-growth forests [26]. This unique zonal top community has nationally representative forest communities. This region is located in the central humid subtropical monsoon climate zone in China. The mean annual precipitation is 1964 mm and the mean annual temperature in this region is 15.3 °C [26]. The soil is mainly red soil, yellow-red soil, red-yellow soil, and mountain meadow soil [27]. The Gutianshan Nature Reserve in Qianjiangyuan National Park has about 57% natural forest, most of which is subtropical broad-leaved evergreen forest [28].
The study was carried out in the 24-ha old-growth subtropical forest dynamic Gutianshan plot in the Qianjiangyuan National Park in China (Figure 1). The 24-ha forest plot was established in October 2005 following the GTFS-ForestGEO protocol [29]. The elevation difference within the 24-ha plot of Gutianshan is 268.6 m, the highest elevation is 714.9 m, and the lowest elevation is 446.3 m. The slope in the plot was highly variable, ranging from 12.8° to 62° [28]. The whole 24-ha plot was classified into five habitat types: low valley; low ridge; mid-slope; high slope; and high ridge (Figure S1) [30]. The first tree census in the 24-ha forest plot was conducted in 2005, and all trees with diameter at breast height (DBH) ≥1 cm were mapped, measured (measure the DBH of trunk and branch), identified, and marked. According to that survey, there were 140,700 trees in total, with 159 species belonging to 49 families and 103 genera. The dominant species were Castanopsis eyrei (Champ. ex Benth.) Hutch., Schima superba Gardn. et Champ. and Pinus massoniana Lamb. [31].

2.2. Data Collection and Statistical Analysis

2.2.1. Importance Value of Dominant Tree Species

The importance value (IV) reflects the combined status and role of species in the community. IV was calculated as one-third of the sum of relative abundance (RA), relative frequency (RF), and relative dominance (RD) [32]. The formula is as follows:
I V = R A + R F + R D / 3
R A = n i / i = 1 S n i
R F = f i / i = 1 S f i
R D = d i / i = 1 S d i
where n i is the number of individuals of a certain population i ; f i is the number of quadrats in which the population i appears; d i is the basal area at the height of 1.3 m of population i ; and S is the total number of species. Based on IV values of species, four canopy dominant species were selected as focal species in the study, including three broad-leaf species and one conifer species: C. eyrei, S. superba, P. massoniana, and Daphniphyllum oldhamii (Hemsl.) K.Rosenthal.

2.2.2. Recruitment, Upgrade, and Mortality

Data from individual tree surveys from 2005 and 2010 for the four canopy dominant species were used to analyze the dynamics of recruitment, upgrading, and mortality. Recruitment individuals refers to newly emerged individuals with DBH ≥ 1 cm during the re-examination in 2010; dead individuals refers to the individuals that died or disappeared at the time of review; upgraded individuals refers to the individuals that left a certain diameter class due to growth [9]. We obtained the change rate of those populations over the five-year period by calculating the mortality rate and recruitment rate of different diameter classes of the dominant populations. Mortality rate and recruitment rate were calculated as:
Mortality   rate :   M = l n N 0 l n S t / T
Recruitment   rate :   R = l n N t l n S t / T
where N 0 and N t are the number of individuals of a population in the first and second surveys; S t is the number of surviving individuals of population N 0 in the second survey; and T is the time interval between two surveys [33]. The population change rate is expressed as the difference between the recruitment rate and the mortality rate.

2.2.3. Diameter Structure Classes and Spatial Point Patterns

In order to explore how the spatial patterns of dead individuals caused by the winter storm for the four dominate species vary across different diameter classes, we first divide all the dead individuals into different diameter classes. According to the classification criteria of tree diameter class structure in subtropical evergreen broad-leaved forests [34], DBH size was classified into the following three categories to represent the different life stages (Figure S2): sapling (1 cm ≤ DBH < 5 cm); juvenile (5 cm ≤ DBH < 10 cm); and adult (DBH ≥ 10 cm).
The K-function proposed by Ripley [35] was used to describe the spatial point pattern of species:
K r = A n 2 i = 1 n j = 1 n 1 W ij Ir u ij i j
where n is the number of individuals; u i j is the distance between individuals i and j ; r is the scale (if u i j   r , Ir u i j = 1 ; if u i j >   r , Ir u i j = 0 ); W i j is the boundary effect correction factor, which is the proportion of the circle with individuals i as the center and u i j as the radius in area A ; and A is the area. Converting Equation (7) yields:
L r = K r / π r
L r = 0 indicates that the population is randomly distributed; L r > 0 indicates that the population is aggregated; and L r < 0 indicates that the population is uniformly distributed. The L r of the actual observed distribution deviates from the 95% envelope of the theoretical value. The confidence interval is obtained by the Monte Carlo method [36]. If L r of the actual distribution falls within the envelope, the species is randomly distributed; if it is above the envelope, the species exhibits aggregated distribution; and if it is below the envelope, it is significantly uniformly distributed. We repeated this analysis simulation 999 times.
All analyses were conducted in the R 4.1.2 statistical platform [37]. Data grouping statistics were acquired using the doBy package [38]. We used a T-test to compare the differences in plot-level DBH and plot-level basal area from 2005 to 2010. The spatial point pattern was shown using the spatstat package [39] to calculate K r and L r . The spatial point pattern of the four dominant species was shown using the ggplot2 package [40].

3. Results

3.1. Changes in Population Characteristics of Canopy Dominant Species

The plot-level (20 × 20 m) DBH of C. eyrei and P. massoniana exhibited significant increases from 2005 to 2010, while the changes for S. superba and D. oldhamii were not significant (Table 1). For plot-level basal area, S. superba and P. massoniana significantly decreased from 2005 to 2010. However, the change in C. eyrei and D. oldhamii was not significant.
The diameter structure of C. eyrei and S. superba showed bimodal distribution. Individuals of C. eyrei and S. superba mainly peaked at 2 cm and 30 cm (Figure 2a,c), while D. oldhamii showed multimodal distribution (Figure 2g). The P. massoniana population had a single peak structure to the right and tended to be aging and declining (Figure 2e). The numbers of recruitments, upgrades, and mortalities for C. eyrei, S. superba, and D. oldhamii populations all decreased with the increase in diameter classes (Figure 2b,d,h), while P. massoniana showed no significant decreasing trend in any category (Figure 2f). All the population change rates were negative (Table 2). The number of individuals in the small-diameter class (DBH 1–1.4 cm) decreased the most (Figure 2b,d,f,h).

3.2. Differences in the Distribution of Dead Trees in Different Habitats

The four dominant populations (C. eyrei, S. superba, P. massoniana, and D. oldhamii) were mainly distributed in low valleys and low ridges (Figure 3a,e,i,m). Specifically, S. superba and P. massoniana were relatively more distributed in high-altitude areas (Figure 3e,i). From low valleys to high ridges, the density of C. eyrei, S. superba, and P. massoniana populations gradually increased (Figure 3b,f,j), the mortality rate of C. eyrei and S. superba populations gradually decreased (Figure 3d,h), the death number of the C. eyrei population gradually decreased (Figure 3c), and the death number of the S. superba population decreased and then increased (Figure 3g). The death number of the P. massoniana population was higher in the high-altitude area, and the mortality rate did not change much (Figure 3k,l). The density of the D. oldhamii population was higher in the low-altitude area and, from low valleys to high ridges, the death number and mortality rate were much greater at low-altitude areas than at high-altitude areas (Figure 3n,o,p).

3.3. Spatial Point Patterns of Dead Trees across Life Stages

Dead C. eyrei, S. superba, and P. massoniana individuals, saplings, juveniles, and adults were all aggregated on the scale of 0–100 m, and the degree of aggregation from saplings to adults tended to decrease with increasing scale (Figure 4a–l). In contrast, dead D. oldhamii individuals, saplings, and adults were aggregated at the scale of 0–100 m, while dead juveniles were aggregated at 0–74 m but randomly distributed at 74–100 m (Figure 4m–p).

4. Discussion

4.1. Effects of Extreme Winter Storms on the Population Characteristics of Canopy Dominant Species

Among the 43 dominant species in the 5-ha evergreen broad-leaved forest in Gutianshan from 2002 to 2007, 31 populations were growing populations and the other 12 populations showed small negative growth [41]. Compared to the population renewal dynamics of subtropical forests under “normal” conditions, the winter storm increased the mortality rate of canopy dominant populations and decreased the recruitment rate, resulting in the population exhibiting a negative growth trend. These results are in line with those of previous studies [19,42]. The shortfall in recruitment rate may be time-related, as the recovery period (2008–2010) was only 2 years. The large number of canopy gaps after the winter storm increased the light level within the forest understory. Competition among surviving trees decreased after the windstorm and the upgrading rate exceeded the recruitment rate, resulting in an overall increase in the plot-level DBH of the dominant populations. The lack of recruitment and the high rates of tree mortality, especially among large-diameter individuals, resulted in a decrease in the plot-level basal area of the dominant populations. In general, after the extreme winter storm, the dominant populations displayed an overall trend of increasing plot-level DBH and decreasing plot-level basal area.
Extreme winter storms cause significant damage to all species in a forest, but the extent of damage varies by species [20,43,44]. For the four canopy dominant species in the 24-ha subtropical Gutianshan forest, P. massoniana was most affected by the winter storm (population growth rate: −8.93%), followed by C. eyrei (population growth rate: −4.91%), S. superba (population growth rate: −2.00%), and D. oldhamii (population growth rate: −1.72%). Broad-leaved evergreen species and conifer species may exhibit differences in sensitivity to the winter storm due to differences in crown diameter, leaf area, tree taper (D/H), and wood properties [45,46].
We found that the diameter structure of the populations of three evergreen broad-leaved species (C. eyrei, S. superba, and D. oldhamii) showed bimodal and multimodal distribution. This distribution indicates that the population has developed to more advanced stages and that the whole population is relatively stable [47]. During the time of this study, there were more individuals in the large-diameter class, which inhibits the growth of the medium-diameter class trees but does not hinder the survival of the small-diameter class individuals. It is generally believed that tree mortality is related to DBH [21]. The large-diameter trees have a more extended leaf area, representing a larger snow interception area. Small-diameter individuals do not have strong trunk support and are susceptible to mechanical damage caused by the pressure of snow and nearby large tree branches. However, in the extreme winter storm in 2008, although the degree of damage to large-diameter trees increased with the increase in DBH, more serious damage, such as collapse and breakage, decreased accordingly [8]. As such, the mortality rate of the three evergreen broad-leaved species tended to decrease with increasing diameter class.
In contrast, the recruitment, upgrade, and mortality numbers for conifer species (P. massoniana) did not decrease significantly with increasing diameter class, and there were few recruitment individuals for the small-diameter class. This may be because the P. massoniana population tends to be aging and is already dominated by large-diameter individuals. As a coniferous species, P. massoniana possesses a trunk with low strength and low elasticity, traits which increase the degree of damage caused by snow accumulation [48]. This susceptibility results in a higher mortality rate for coniferous large-diameter individuals compared to evergreen broad-leaved individuals. P. massoniana seedlings rarely appear in the forest understory under “normal” conditions [49], and the winter storm exacerbated this by covering the ground with a thick layer of litter. This litter increased soil water conservation capacity, leading to unstable hydrothermal conditions; the decomposition process of litter is also prone to harboring microorganisms that are detrimental to the germination and growth of P. massoniana seeds [50].
From 2005 to 2010, the diameter structure of all canopy dominant populations remained basically stable, but the number of individuals at each diameter class generally decreased. The recruitment rate was not sufficient to offset the loss of individuals due to upgrading and mortality, as similarly found by Ge et al. [19]. Moreover, the IV of the four dominant populations did not change much, indicating that the community structure is basically stable [9] and that the 24-ha plot in Gutianshan has a certain resistance to winter storms.

4.2. Effects of the Extreme Winter Storm on Mortality for Canopy Dominant Species in Different Habitats

The damage from winter storms inflicted on tree individuals is often caused by snow accumulation [51]. Forest disasters are directly affected by topographic factors. In Gutianshan, the high altitudes are more susceptible to snow damage than the low altitudes. Similarly, there is other literature that suggests that steep slopes are more susceptible than gentle slopes [18]. Our study found that the mortality rate of P. massoniana was higher than the other three species in all habitats, and the dead individuals were mainly concentrated on high slopes and high ridges; the highest mortality rate was found in high slopes. This may be because P. massoniana is a strong, light-demanding tree species mainly distributed in high-altitude areas. Due to the slope of high slopes and high ridges, P. massoniana may be susceptible to the establishment of asymmetric canopy cover [52], and thus suffers from the unbalanced stress of snow which causes tree breakage or death.
In high-altitudes areas, the mortality rates of the three dominant populations (C. eyrei, S. superba, and D. oldhamii) were relatively low. This result is consistent with the research of Man et al. [8]. Several factors may account for these findings. It may be that the height difference between the high- and low-altitude areas of the plot is not significant enough to produce dramatic differences. Additionally, the high-altitude area has a relatively gentle slope, which may reduce the amount of uneven snow accumulation. On the other hand, more dead individuals and higher mortality rates in low-altitude habitats may be related to the relatively complete canopy structure present there. Snow damage to so dense a canopy may further damage the understory [53].
Previous research has shown that plant mortality is affected, to a certain extent, by development and distribution density. Plants with lower densities and relatively slow growth rates tend to have higher mortality [54]. Another situation is that, due to the influence of the conspecific negative density dependence (CNDD), the mortality rate is also higher when the CNDD is higher [55,56]. C. eyrei and S. superba were widely distributed throughout the different habitats and displayed relatively high mortality rates in low-altitude areas with low density. D. oldhamii had a higher density and mortality rate in low valleys, low ridges, and middle slopes. We tentatively conclude that the relationship between the density and mortality rate varies from species to species in different habitats, and needs to be further studied.

4.3. Effects of the Winter Storm on the Spatial Point Pattern of Dead Trees

The spatial pattern of a population refers to the relatively static distribution of individuals in a given living space, as well as the adaptations of species to environmental conditions in a certain period [57]. The spatial patterns of species are strongly scale-dependent, and patterns at different scales are closely related to specific ecological processes [58]. Zhu et al. [31] showed that the distribution pattern of each dominant species in the 24-ha plot was aggregated, which aligned with the spatial point pattern of dead individuals in our study. All mortality patterns were aggregated, mainly due to the manner in which the winter storm led to clusters of dead individuals. Large amounts of snow falling from the canopy of adult trees can cause the death of individuals in lower layers and, since seeds usually fall near the parent tree [59], the fall of an adult tree can cause the death of a large number of individuals of the same species nearby.
Some studies have found that as the diameter class increases, the ability of individuals to acquire resources increases; under the influence of density constraints, this can mean that the degree of aggregation tends to decrease [60,61]. Generally, the distribution pattern of populations evolves from aggregated distribution to random distribution [62]. We found a decreasing trend in the aggregation of individual mortality patterns from saplings to adults, which was consistent with the distribution pattern of living saplings and adults. It is noteworthy that dead D. oldhamii juveniles were distributed randomly at the scale of 74–100 m, probably due in part to significant interspecific competition among the juveniles.

5. Conclusions

The changes in the population dynamics of canopy dominant species reported here indicate that extreme winter storms have variable effects on population dynamics in subtropical forests. The population dynamics of four dominant species were significantly altered following the winter storm, but the extent of the changes varied with species. More specifically, P. massoniana was most affected by the storm, followed by C. eyrei. Small-diameter individuals experienced higher mortality rates. The number of individuals, the density of the dominant population, the number of mortalities, and the mortality rate of the dominant species differed among habitats. Further studies are needed to ascertain whether there is a correlation between the density and mortality rate of a singular species that occupies different habitats and, if a correlation does exist, whether it is species-related.

Supplementary Materials

The following supporting information can be downloaded at: https://www.mdpi.com/article/10.3390/f13101634/s1, Figure S1: Map of five habitat types with multivariate regression tree analysis in a 24-ha plot. Type 1: low valley, Type 2: low ridge, Type 3: mid-slope, type 4: high slope and type 5: high ridge. More detailed information could be found in Chen et al. (2010). Figure S2: Number of dead individuals in each life stage (dead sapling; dead juvenile; dead adult) of four canopy dominant species (Castanopsis eyrei, Schima superba, Pinus massoniana, and Daphniphyllum oldhamii).

Author Contributions

Y.W., J.C. and Y.J. (Yanli Ji) conceived and designed the study; Y.Y. and Y.J. (Yanli Ji) performed statistical analyses and wrote the first draft with substantial input from Y.W. and J.C.; J.X., Y.J. (Yi Jin), X.M., M.Y., H.R. and K.M. provided data and contributed to the development of the final manuscript. All authors have read and agreed to the published version of the manuscript.

Funding

This study was financially supported by the Zhejiang Provincial Natural Science Foundation of China (LQ22C030001).

Institutional Review Board Statement

Not applicable.

Informed Consent Statement

Not applicable.

Data Availability Statement

Data are available from the authors on request.

Acknowledgments

We acknowledge the Zhejiang Qianjiangyuan Forest Biodiversity National Observation and Research Station and the Qianjiangyuan National Park Center of Ecology and Resources for support provided to this study, as well as the hard work of the hundreds of people who were involved in the collection of the vast quantity of data in the Gutianshan plot over past years. We would like to thank Courtney Buoncore at Princeton University for her assistance with English translation and grammatical editing.

Conflicts of Interest

The authors declare no conflict of interest.

References

  1. Lin, W.Q.; Chen, H.Q. Changes in the spatial-temporal characteristics of daily snowfall events over the Eurasian continent from 1980 to 2019. Int. J. Climatol. 2022, 42, 1841–1853. [Google Scholar] [CrossRef]
  2. National Academies of Sciences, Engineering, and Medicine. Attribution of Extreme Weather Events in the Context of Climate Change; National Academies Press: Washington, DC, USA, 2016. [Google Scholar]
  3. Smith, M.D. An ecological perspective on extreme climatic events: A synthetic definition and framework to guide future research. J. Ecol. 2011, 99, 656–663. [Google Scholar] [CrossRef]
  4. Aguirre-Gutierrez, J.; Oliveras, I.; Rifai, S.; Fauset, S.; Adu-Bredu, S.; Affum-Baffoe, K.; Baker, T.R.; Feldpausch, T.R.; Gvozdevaite, A.; Hubau, W.; et al. Drier tropical forests are susceptible to functional changes in response to a long-term drought. Ecol. Lett. 2019, 22, 855–865. [Google Scholar] [CrossRef] [PubMed] [Green Version]
  5. Ma, G.; Rudolf, V.H.W.; Ma, C.S. Extreme temperature events alter demographic rates, relative fitness, and community structure. Glob. Chang. Biol. 2015, 21, 1794–1808. [Google Scholar] [CrossRef] [PubMed]
  6. Wang, Y.Q.; Cadotte, M.W.; Chen, J.H.; Mi, X.C.; Ren, H.B.; Liu, J.J.; Yu, M.J.; Zhang, J.T.; Ma, K.P. Neighborhood interactions on seedling survival were greatly altered following an extreme winter storm. For. Ecol. Manag. 2020, 461, 117940. [Google Scholar] [CrossRef]
  7. Zhou, B.Z.; Gu, L.H.; Ding, Y.H.; Shao, L.; Wu, Z.M.; Yang, X.S.; Li, C.Z.; Li, Z.C.; Wang, X.M.; Cao, Y.H. The great 2008 Chinese ice storm: Its socioeconomic-ecological impact and sustainability lessons learned. Bull. Am. Meteorol. Soc. 2011, 92, 47–60. [Google Scholar] [CrossRef] [Green Version]
  8. Man, X.X.; Mi, X.C.; Ma, K.P. Effects of an ice storm on community structure of an evergreen broad-leaved forest in Gutianshan National Nature Reserve, Zhejiang Province. Biodivers. Sci. 2011, 19, 197. [Google Scholar]
  9. Jin, Y.; Chen, J.H.; Mi, X.C.; Ren, H.B.; Ma, K.P.; Yu, M.J. Impacts of the 2008 ice storm on structure and composition of an evergreen broad-leaved forest community in eastern China. Biodivers. Sci. 2015, 23, 610. [Google Scholar] [CrossRef] [Green Version]
  10. Runkle, J.R. Canopy tree turnover in old-growth mesic forests of eastern North America. Ecology 2000, 81, 554–567. [Google Scholar] [CrossRef]
  11. van den Berg, E.; Chazdon, R.; Corrêa, B.S. Tree growth and death in a tropical gallery forest in Brazil: Understanding the relationships among size, growth, and survivorship for understory and canopy dominant species. Plant Ecol. 2012, 213, 1081–1092. [Google Scholar] [CrossRef]
  12. Hardiman, B.S.; Bohrer, G.; Gough, C.M.; Curtis, P.S. Canopy structural changes following widespread mortality of canopy dominant trees. Forests 2013, 4, 537–552. [Google Scholar] [CrossRef]
  13. Ozanne, C.M.; Anhuf, D.; Boulter, S.L.; Keller, M.; Kitching, R.L.; Körner, C.; Meinzer, F.C.; Mitchell, A.; Nakashizuka, T.; Dias, P.S. Biodiversity meets the atmosphere: A global view of forest canopies. Science 2003, 301, 183–186. [Google Scholar] [CrossRef] [PubMed] [Green Version]
  14. Shi, L.L.; Wang, H.M.; Zhang, W.J.; Shao, Q.Q.; Yang, F.T.; Ma, Z.Q.; Wang, Y.D. Spatial response patterns of subtropical forests to a heavy ice storm: A case study in Poyang Lake Basin, southern China. Nat. Hazards 2013, 69, 2179–2196. [Google Scholar] [CrossRef]
  15. Duguay, S.M.; Arii, K.; Hooper, M.; Lechowicz, M.J. Ice storm damage and early recovery in an old-growth forest. Environ. Monit. Assess. 2001, 67, 97–108. [Google Scholar] [CrossRef] [PubMed]
  16. Jin, Y.; Russo, S.E.; Yu, M. Effects of light and topography on regeneration and coexistence of evergreen and deciduous tree species in a Chinese subtropical forest. J. Ecol. 2018, 106, 1634–1645. [Google Scholar] [CrossRef]
  17. Jiang, C.C.; Fu, J.Q.; Wang, Y.Q.; Chai, P.T.; Yang, Y.D.; Mi, X.C.; Yu, M.J.; Ma, K.P.; Chen, J.H. The Habitat Type and Scale Dependences of Interspecific Associations in a Subtropical Evergreen Broad-Leaved Forest. Forests 2022, 13, 1334. [Google Scholar] [CrossRef]
  18. Dobbertin, M. Influence of stand structure and site factors on wind damage comparing the storms Vivian and Lothar. For. Snow Landsc. Res. 2002, 77, 187–205. [Google Scholar]
  19. Ge, J.L.; Xiong, G.M.; Wang, Z.X.; Zhang, M.; Zhao, C.M.; Shen, G.Z.; Xu, W.T.; Xie, Z.Q. Altered dynamics of broad-leaved tree species in a Chinese subtropical montane mixed forest: The role of an anomalous extreme 2008 ice storm episode. Ecol. Evol. 2015, 5, 1484–1493. [Google Scholar] [CrossRef]
  20. Li, X.F.; Jin, L.; Zhu, J.J.; Liu, L.M.; Zhang, J.X.; Wang, Y.; Zhu, C.Y. Response of species and stand types to snow/wind damage in a temperate secondary forest, Northeast China. J. For. Res. 2018, 29, 395–404. [Google Scholar] [CrossRef]
  21. Proulx, O.J.; Greene, D.F. The relationship between ice thickness and northern hardwood tree damage during ice storms. Can. J. For. Res. 2001, 31, 1758–1767. [Google Scholar] [CrossRef]
  22. Gadow, K.V.; Zhang, C.Y.; Wehenkel, C.; Pommerening, A.; Corral-Rivas, J.; Korol, M.; Myklush, S.; Hui, G.Y.; Kiviste, A.; Zhao, X.H. Forest Structure and Diversity. In Continuous Cover Forestry; Springer: Dordrecht, The Netherlands, 2012. [Google Scholar]
  23. He, C.M.; Jia, S.H.; Luo, Y.; Hao, Z.Q.; Yin, Q.L. Spatial Distribution and Species Association of Dominant Tree Species in Huangguan Plot of Qinling Mountains, China. Forests 2022, 13, 866. [Google Scholar] [CrossRef]
  24. Yuan, Z.L.; Wei, B.L.; Chen, Y.; Jia, H.R.; Wei, Q.N.; Ye, Y.Z. How do similarities in spatial distributions and interspecific associations affect the coexistence of Quercus species in the Baotianman National Nature Reserve, Henan, China. Ecol. Evol. 2018, 8, 2580–2593. [Google Scholar] [CrossRef]
  25. Stone, R. Ecologists Report Huge Storm Losses in China’s Forests. Science 2008, 319, 1318–1319. [Google Scholar] [CrossRef] [PubMed]
  26. Hu, Z.H.; Yu, M.J.; Ding, B.Y.; Fang, T.; Qian, H.Y.; Chen, Q.C. Types of evergreen broad-leaved forests and their species diversity in Gutian Mountain National Nature Reserve. Chin. J. Appl. Environ. Biol. 2003, 9, 341–345. [Google Scholar]
  27. Du, Y.J.; Mi, X.C.; Liu, X.J.; Chen, L.; Ma, K.P. Seed dispersal phenology and dispersal syndromes in a subtropical broad-leaved forest of China. For. Ecol. Manag. 2009, 258, 1147–1152. [Google Scholar] [CrossRef]
  28. Legendre, P.; Mi, X.C.; Ren, H.B.; Ma, K.P.; Yu, M.J.; Sun, I.F.; He, F.l. Partitioning beta diversity in a subtropical broad-leaved forest of China. Ecology 2009, 90, 663–674. [Google Scholar] [CrossRef] [Green Version]
  29. Condit, R. Tropical Forest Census Plots: Methods and Results from Barro Colorado Island, Panama and a Comparison with Other Plots; Springer-Verlag: Berlin/Heidelberg, Germany; R. G. Landes Company: Georgetown, TX, USA, 1998. [Google Scholar]
  30. Chen, L.; Mi, X.C.; Comita, L.S.; Zhang, L.W.; Ren, H.B.; Ma, K.P. Community-level consequences of density dependence and habitat association in a subtropical broad-leaved forest. Ecol. Lett. 2010, 13, 695–704. [Google Scholar] [CrossRef]
  31. Zhu, Y.; Zhao, G.F.; Zhang, L.W.; Shen, G.C.; Mi, X.C.; Ren, H.B.; Yu, M.J.; Chen, J.H.; Chen, S.W.; Fang, T. Community composition and structure of Gutianshan forest dynamic plot in a mid-subtropical evergreen broad-leaved forest, East China. Chin. J. Plant Ecol. 2008, 32, 262. [Google Scholar]
  32. Liu, Z.W.; Zhu, Y.; Wang, J.J.; Ma, W.; Meng, J.H. Species association of the dominant tree species in an old-growth forest and implications for enrichment planting for the restoration of natural degraded forest in subtropical China. Forests 2019, 10, 957. [Google Scholar] [CrossRef] [Green Version]
  33. Condit, R.; Ashton, P.S.; Manokaran, N.; LaFrankie, J.V.; Hubbell, S.P.; Foster, R.B. Dynamics of the forest communities at Pasoh and Barro Colorado: Comparing two 50–ha plots. Philos. Trans. R. Soc. B 1999, 354, 1739–1748. [Google Scholar] [CrossRef] [Green Version]
  34. Zhu, Y.; Getzin, S.; Wiegand, T.; Ren, H.B.; Ma, K.P. The relative importance of Janzen-Connell effects in influencing the spatial patterns at the Gutianshan subtropical forest. PLoS ONE 2013, 8, e74560. [Google Scholar] [CrossRef] [PubMed] [Green Version]
  35. Ripley, B.D. Modelling spatial patterns. J. R. Stat. Soc. B 1977, 39, 172–192. [Google Scholar] [CrossRef]
  36. Carlo, C.M. Markov chain monte carlo and gibbs sampling. Lect. Notes EEB 2004, 581, 540. [Google Scholar]
  37. Team, R.C.R. A Language and Environment for Statistical Computing; R Foundation for Statistical Computing: Vienna, Austria, 2021; Available online: https://www.R-project.org/ (accessed on 1 November 2021).
  38. Højsgaard, S.; Halekoh, U. doBy: Groupwise Statistics, LSmeans, Linear Contrasts, Utilities. R Package Version 4.6.11. 2021. Available online: https://cran.r-project.org/web/packages/doBy/index.html (accessed on 2 May 2021).
  39. Baddeley, A.; Turner, R.; Rubak, E. spatstat: Spatial Point Pattern Analysis, Model-Fitting, Simulation, Tests. R Package Version 2.3-4. 2022. Available online: https://cran.r-project.org/web/packages/spatstat/index.html (accessed on 1 April 2022).
  40. Wickham, H.; Chang, W.; Henry, L.; Pedersen, T.L.; Takahashi, K.; Wilke, C.; Woo, K.; Yutani, H.; Dunnington, D. ggplot2: Create Elegant Data Visualisations Using the Grammar of Graphics. R Package Version 2.2.4. 2021. Available online: https://cran.r-project.org/web/packages/ggplot2/index.html (accessed on 16 June 2021).
  41. Wang, Y.H.; Mi, X.C.; Chen, S.W.; Li, M.H.; Yu, M.J. Regeneration dynamics of major tree species during 2002–2007 in a subtropical evergreen broad-leaved forest in Gutianshan National Nature Reserve in East China. Biodivers. Sci. 2011, 19, 178. [Google Scholar]
  42. Takahashi, K.; Arii, K.; Lechowicz, M.J. Quantitative and qualitative effects of a severe ice storm on an old-growth beech–maple forest. Can. J. For. Res. 2007, 37, 598–606. [Google Scholar] [CrossRef] [Green Version]
  43. Peterson, C. Damage and recovery of tree species after two different tornadoes in the same old growth forest: A comparison of infrequent wind disturbances. For. Ecol. Manag. 2000, 135, 237–252. [Google Scholar] [CrossRef]
  44. Hopkin, A.; Williams, T.; Sajan, R.; Pedlar, J.; Nielsen, C. Ice storm damage to eastern Ontario forests: 1998–2001. For. Chron. 2003, 79, 47–53. [Google Scholar] [CrossRef] [Green Version]
  45. Jalkanen, R.; Konocpka, B. Snow-packing as a potential harmful factor on Picea abies, Pinus sylvestris and Betula pubescens at high altitude in northern Finland. Eur. J. For. Pathol. 1998, 28, 373–382. [Google Scholar] [CrossRef]
  46. Yao, W.T.; Ma, Y.; Chen, F.; Xiao, Z.S.; Shu, Z.F.; Chen, L.J.; Xiao, W.H.; Liu, J.B.; Jiang, L.Y.; Zhang, S.Y. Analysis of Ice Storm Impact on and Post-Disaster Recovery of Typical Subtropical Forests in Southeast China. Remote Sens. 2020, 12, 164. [Google Scholar] [CrossRef] [Green Version]
  47. Zenner, E.K. Deriving restoration targets from diameter distributions of Dominant Biomass Strata development phases in an old-growth European beech forest. For. Ecol. Manag. 2021, 496, 119383. [Google Scholar] [CrossRef]
  48. Smolnik, M.; Hessl, A.; Colbert, J. Species-specific effects of a 1994 ice storm on radial tree growth in Delaware1. J. Torrey Bot. Soc. 2006, 133, 577–584. [Google Scholar] [CrossRef]
  49. Bistea, E.; Mahy, G. Vegetation and seed bank in a calcareous grassland restored from a Pinus forest. Appl. Veg. Sci. 2005, 8, 167–174. [Google Scholar] [CrossRef]
  50. Muscolo, A.; Bagnato, S.; Sidari, M.; Mercurio, R. A review of the roles of forest canopy gaps. J. For. Res. 2014, 25, 725–736. [Google Scholar] [CrossRef]
  51. Solantie, R. Effect of weather and climatological background on snow damage of forests in Southern Finland in November 1991. Silva Fenn. 1994, 28, 203–211. [Google Scholar] [CrossRef] [Green Version]
  52. Lang, A.C.; Härdtle, W.; Bruelheide, H.; Geißler, C.; Nadrowski, K.; Schuldt, A.; Yu, M.J.; von Oheimb, G. Tree morphology responds to neighbourhood competition and slope in species-rich forests of subtropical China. For. Ecol. Manag. 2010, 260, 1708–1715. [Google Scholar] [CrossRef]
  53. Storck, P.; Lettenmaier, D.P.; Bolton, S.M. Measurement of snow interception and canopy effects on snow accumulation and melt in a mountainous maritime climate, Oregon, United States. Water Resour. Res. 2002, 38, 5-1-5-16. [Google Scholar] [CrossRef]
  54. Chao, K.J.; Phillips, O.L.; Gloor, E.; Monteagudo, A.; Torres-Lezama, A.; Martínez, R.V. Growth and wood density predict tree mortality in Amazon forests. J. Ecol. 2008, 96, 281–292. [Google Scholar] [CrossRef]
  55. Chen, L.; Swenson, N.G.; Ji, N.N.; Mi, X.C.; Ren, H.B.; Guo, L.D.; Ma, K.P. Differential soil fungus accumulation and density dependence of trees in a subtropical forest. Science 2019, 366, 124–128. [Google Scholar] [CrossRef]
  56. Johnson, D.J.; Beaulieu, W.T.; Bever, J.D.; Clay, K. Conspecific negative density dependence and forest diversity. Science 2012, 336, 904–907. [Google Scholar] [CrossRef] [Green Version]
  57. Condit, R.; Ashton, P.S.; Baker, P.; Bunyavejchewin, S.; Gunatilleke, S.; Gunatilleke, N.; Hubbell, S.P.; Foster, R.B.; Itoh, A.; LaFrankie, J.V.; et al. Spatial patterns in the distribution of tropical tree species. Science 2000, 288, 1414–1418. [Google Scholar] [CrossRef]
  58. Hubbell, S.P. The Unified Neutral Theory of Biodiversity and Biogeography; Princeton University Press: Princeton, NJ, USA, 2001. [Google Scholar]
  59. Russell, S.K.; Schupp, E.W. Effects of microhabitat patchiness on patterns of seed dispersal and seed predation of Cercocarpus ledifolius (Rosaceae). Oikos 1998, 117, 143–152. [Google Scholar] [CrossRef]
  60. He, F.L.; Duncan, R.P. Density-dependent effects on tree survival in an old-growth Douglas fir forest. J. Ecol. 2000, 88, 676–688. [Google Scholar] [CrossRef]
  61. Zhang, J.; Hao, Z.Q.; Sun, I.F.; Song, B.; Ye, J.; Li, B.H.; Wang, X.G. Density dependence on tree survival in an old-growth temperate forest in northeastern China. Ann. For. Sci. 2009, 66, 204. [Google Scholar] [CrossRef] [Green Version]
  62. Zhang, R.B.; Ding, G.J.; Luo, X.M.; Chen, M.F. Bivariate distribution characteristics of spatial structure in five different Pinus massoniana forests. Dendrobiology 2017, 78, 75–84. [Google Scholar] [CrossRef]
Figure 1. Location map of the 24-ha Gutianshan forest plot in Qianjiangyuan National Park in China. The red point signifies the study site. The axis in the 3D plot represents the height difference of the 24-ha plot.
Forests 13 01634 g001
Figure 2. Diameter structure dynamics, recruitment, upgrades, and mortality of the four canopy dominant populations from 2005 to 2010. (a) Diameter structure dynamics of C. eyrei; (b) recruitment, upgrades, and mortality of C. eyrei; (c) diameter structure dynamics of S. superba; (d) recruitment, upgrades, and mortality of S. superba; (e) diameter structure dynamics of P. massoniana; (f) recruitment, upgrades, and mortality of P. massoniana; (g) diameter structure dynamics of D. oldhamii; (h) recruitment, upgrades, and mortality of D. oldhamii.
Forests 13 01634 g002
Figure 3. Distributions of dead individuals for each canopy dominant species in five habitats. (ad) Abundance, density, deaths, and mortality rate of C. eyrei in five habitats; (eh) abundance, density, deaths, and mortality rate of S. superba in five habitats; (il) abundance, density, deaths, and mortality rate of P. massoniana in five habitats; (mp) abundance, density, deaths, and mortality rate of D. oldhamii in five habitats.
Forests 13 01634 g003
Figure 4. Spatial point patterns of dead individuals at different life stages. (a) All dead individuals of C. eyrei; (b) dead saplings of C. eyrei; (c) dead juveniles of C. eyrei; (d) dead adults of C. eyrei; (e) all dead individuals of S. superba; (f) dead saplings of S. superba; (g) dead juveniles of S. superba; (h) dead adults of S. superba; (i) all dead individuals of P. massoniana; (j) dead saplings of P. massoniana; (k) dead juveniles of P. massoniana; (l) dead adults of P. massoniana; (m) all dead individuals of D. oldhamii; (n) dead saplings of D. oldhamii; (o) dead juveniles of D. oldhamii; (p) dead adults of D. oldhamii. Additionally, ‘a’(the black line) represents the L(r) function value, ‘b’ (the red dashed line) represents envelopes, and ‘r’ represents the radius of the sampled circle from the focal tree. The top right graph shows the spatial point pattern of individuals.
Forests 13 01634 g004
Table 1. Importance values, plot-level DBH, and plot-level basal area of the four canopy dominant species in 2005 and 2010.
SpeciesImportance ValueDBH (cm) at Plot Level Basal Area (m2) at Plot Level
2005201020052010p-Value20052010p-Value
Castanopsis eyrei0.1520.14914.495 (8.422)16.292 (9.126)0.0010.504 (0.365)0.470 (0.353)0.07
Schima superba0.0910.09320.593 (9.862)21.394 (10.253)0.5060.283 (0.172)0.268 (0.269)0.04
Pinus massoniana0.0480.04232.816 (13.741)34.033 (12.818)0.0210.297 (0.218)0.272 (0.199)0.001
Daphniphyllum oldhamii0.0220.0236.853 (4.272)7.201 (6.230)0.1910.036 (0.045)0.034 (0.041)0.445
Mean (standard deviation) of DBH or Basal area at 20 m × 20 m plot level. Variables that p-value less than 0.05 are shown in bold-type.
Table 2. Population dynamics of canopy layer dominant species from 2005 to 2010.
SpeciesIndividuals in 2005Individuals in 2010Survivors in 2005–2010Deaths in 2005–2010Recruits in 2010Mortality RateRecruitment RatePopulation Change Rate
Castanopsis eyrei12,3339651872236119296.93%2.02%−4.91%
Schima superba84707663728511853783.01%1.01%−2.00%
Pinus massoniana206013181308752109.08%0.15%−8.93%
Daphniphyllum oldhamii2711248822105012784.09%2.37%−1.72%
Publisher’s Note: MDPI stays neutral with regard to jurisdictional claims in published maps and institutional affiliations.

