Article

Radionuclides and Metals in the Parks of the City of Belgrade, Serbia: Spatial Distribution and Health Risk Assessment

1
Department of Physics, Faculty of Sciences and Mathematics, University of Priština in Kosovska Mitrovica, 38220 Kosovska Mitrovica, Serbia
2
Department of Science, Institute for Information Technologies, University of Kragujevac, 34000 Kragujevac, Serbia
3
Institute of Field and Vegetable Crops, University of Novi Sad, 21000 Novi Sad, Serbia
4
Faculty of Geography, University of Belgrade, 11000 Belgrade, Serbia
*
Author to whom correspondence should be addressed.
Forests 2022, 13(10), 1648; https://doi.org/10.3390/f13101648
Submission received: 1 September 2022 / Revised: 30 September 2022 / Accepted: 6 October 2022 / Published: 8 October 2022
(This article belongs to the Section Urban Forestry)

Abstract

:
In urban areas, forest patches and parks are usually the places where people spend most of their time outdoors. Because of poor environmental protection policy and insufficient investment in industry and energy, Serbia is often ranked among the European countries with the greatest environmental pollution. In recent years, ecological protests have been organized throughout the country with the aim of raising ecological awareness and resolving environmental issues. The topic has become particularly popular since the plans for opening new mining areas in western Serbia came to the fore. This study was conducted with the aim to investigate radioactivity levels and metals content in soil and foliage of the most popular parks in Belgrade, the capital and largest city of Serbia. Based on a GIS (geographic information system) approach, the spatial distribution maps of radionuclides (226Ra, 232Th, 40K, 7Be, and 137Cs) and metals (As, Cd, Cr, Co, Cu, Na, Ni, Pb, Zn, K, Ca, Mg, and Mn) were made. Ambient dose-equivalent rate in air was also measured. The annual effective doses and excess lifetime cancer risk from radionuclides were calculated. Health effects of exposure to heavy metals in soil were estimated by noncarcinogenic and carcinogenic risk assessment.

1. Introduction

Radionuclides are a particular issue in the environment: they can be considered as pollutants, or can be used as background traces for geochemical and transport processes [1]. Among others, the naturally occurring radionuclides 226Ra, 232Th, 40K, 7Be, and anthropogenic radionuclide 137Cs deserve special concern; various biological species are permanently exposed to these radionuclides due to the inevitable existence in almost all matter. Metals are present in all soil, waters, and living organisms, and can be also released from industrial activities and vehicular emissions, leading to potential contamination of ecosystems. Among them, As, Cd, Cr, and Pb have strong toxic characteristics. Inhalation/ingestion of soil/dust in parks and playgrounds may influence public health, especially of children (due to their activity), as they are the most sensitive target group of exposure [2]. Soil acts as a sink for radionuclides and metals released from various anthropogenic sources. It is the most important ecosystem for survival and development of humans and biota, so determining the spatial distribution of radionuclides and metals can help in identifying, assessing, and monitoring potential pollution.
In urban areas, remnants of forest ecosystems occur in small patches. This vegetation influence changes in microclimatic conditions by increasing humidity and reducing air temperature. It can also improve urban air quality, maintain biodiversity, ameliorate the urban heat island effect, and provide recreational and landscape places [3]. Remnant forests in urban areas are more influenced by human activities in comparison to natural forest in rural areas. During the last twenty years, the air quality in large cities has declined with increasing urbanization and industrialization. Owing to transportation, fossil fuel use and industrial activity pollution of urban air has become a serious problem linked with impaired health and quality of life of the citizens [4].
Vegetation plays a crucial role in removing atmospheric pollution in terrestrial ecosystems. Trees in urban forest patches (parks) may have different growing rates, which depend on the amount of atmospheric pollution. This leads to reduced biomass production, litter decomposition, and other ecosystem functions [5]. Additionally, plants interact continuously with the atmosphere and soil; this interaction is complex due to many environmental factors such as microclimate, soil conditions, air pollution, and biotic factors.
Plants uptake and accumulate radionuclides and metals through their roots and leaves. Most atmospheric particles adsorbed on leaves and other plant surfaces by processes of dry deposition are often resuspended into the atmosphere, dropped to the soil surface with leaves, and washed off by rain (wet deposition). Leaves of some plant species are useful biological indicators of environmental contamination and potential exposure to pollution [6], because of their high-density distribution [7,8]. The effectiveness/capacity of urban trees to capture and/or retain particles of pollutants vary for different plant species [9], due to their morphology (canopy volume, total leaf area, leaf structure, and plant height) [10] and chemical properties of the leaves [11]. This is essential for planning the planting design of urban parks; in this sense, urban trees with suitable canopy represent a useful option for improving air quality [12].
In recent years, the quality of environment in Serbia has become a matter of general concern. The plans for opening new mining areas in western Serbia have raised some serious questions about environmental protection and public health. However, actions to raise environmental awareness are usually taken and promoted by responsible individuals, groups, or nongovernmental organizations. Environmental issues have not yet been recognized as a priority by the authorities. The aim of this study is to investigate radioactivity levels and heavy metal content in soil and leaf samples from the parks of the city of Belgrade, to present their spatial distribution and assess radiological/health risk from both groups of pollutants.

2. Materials and Methods
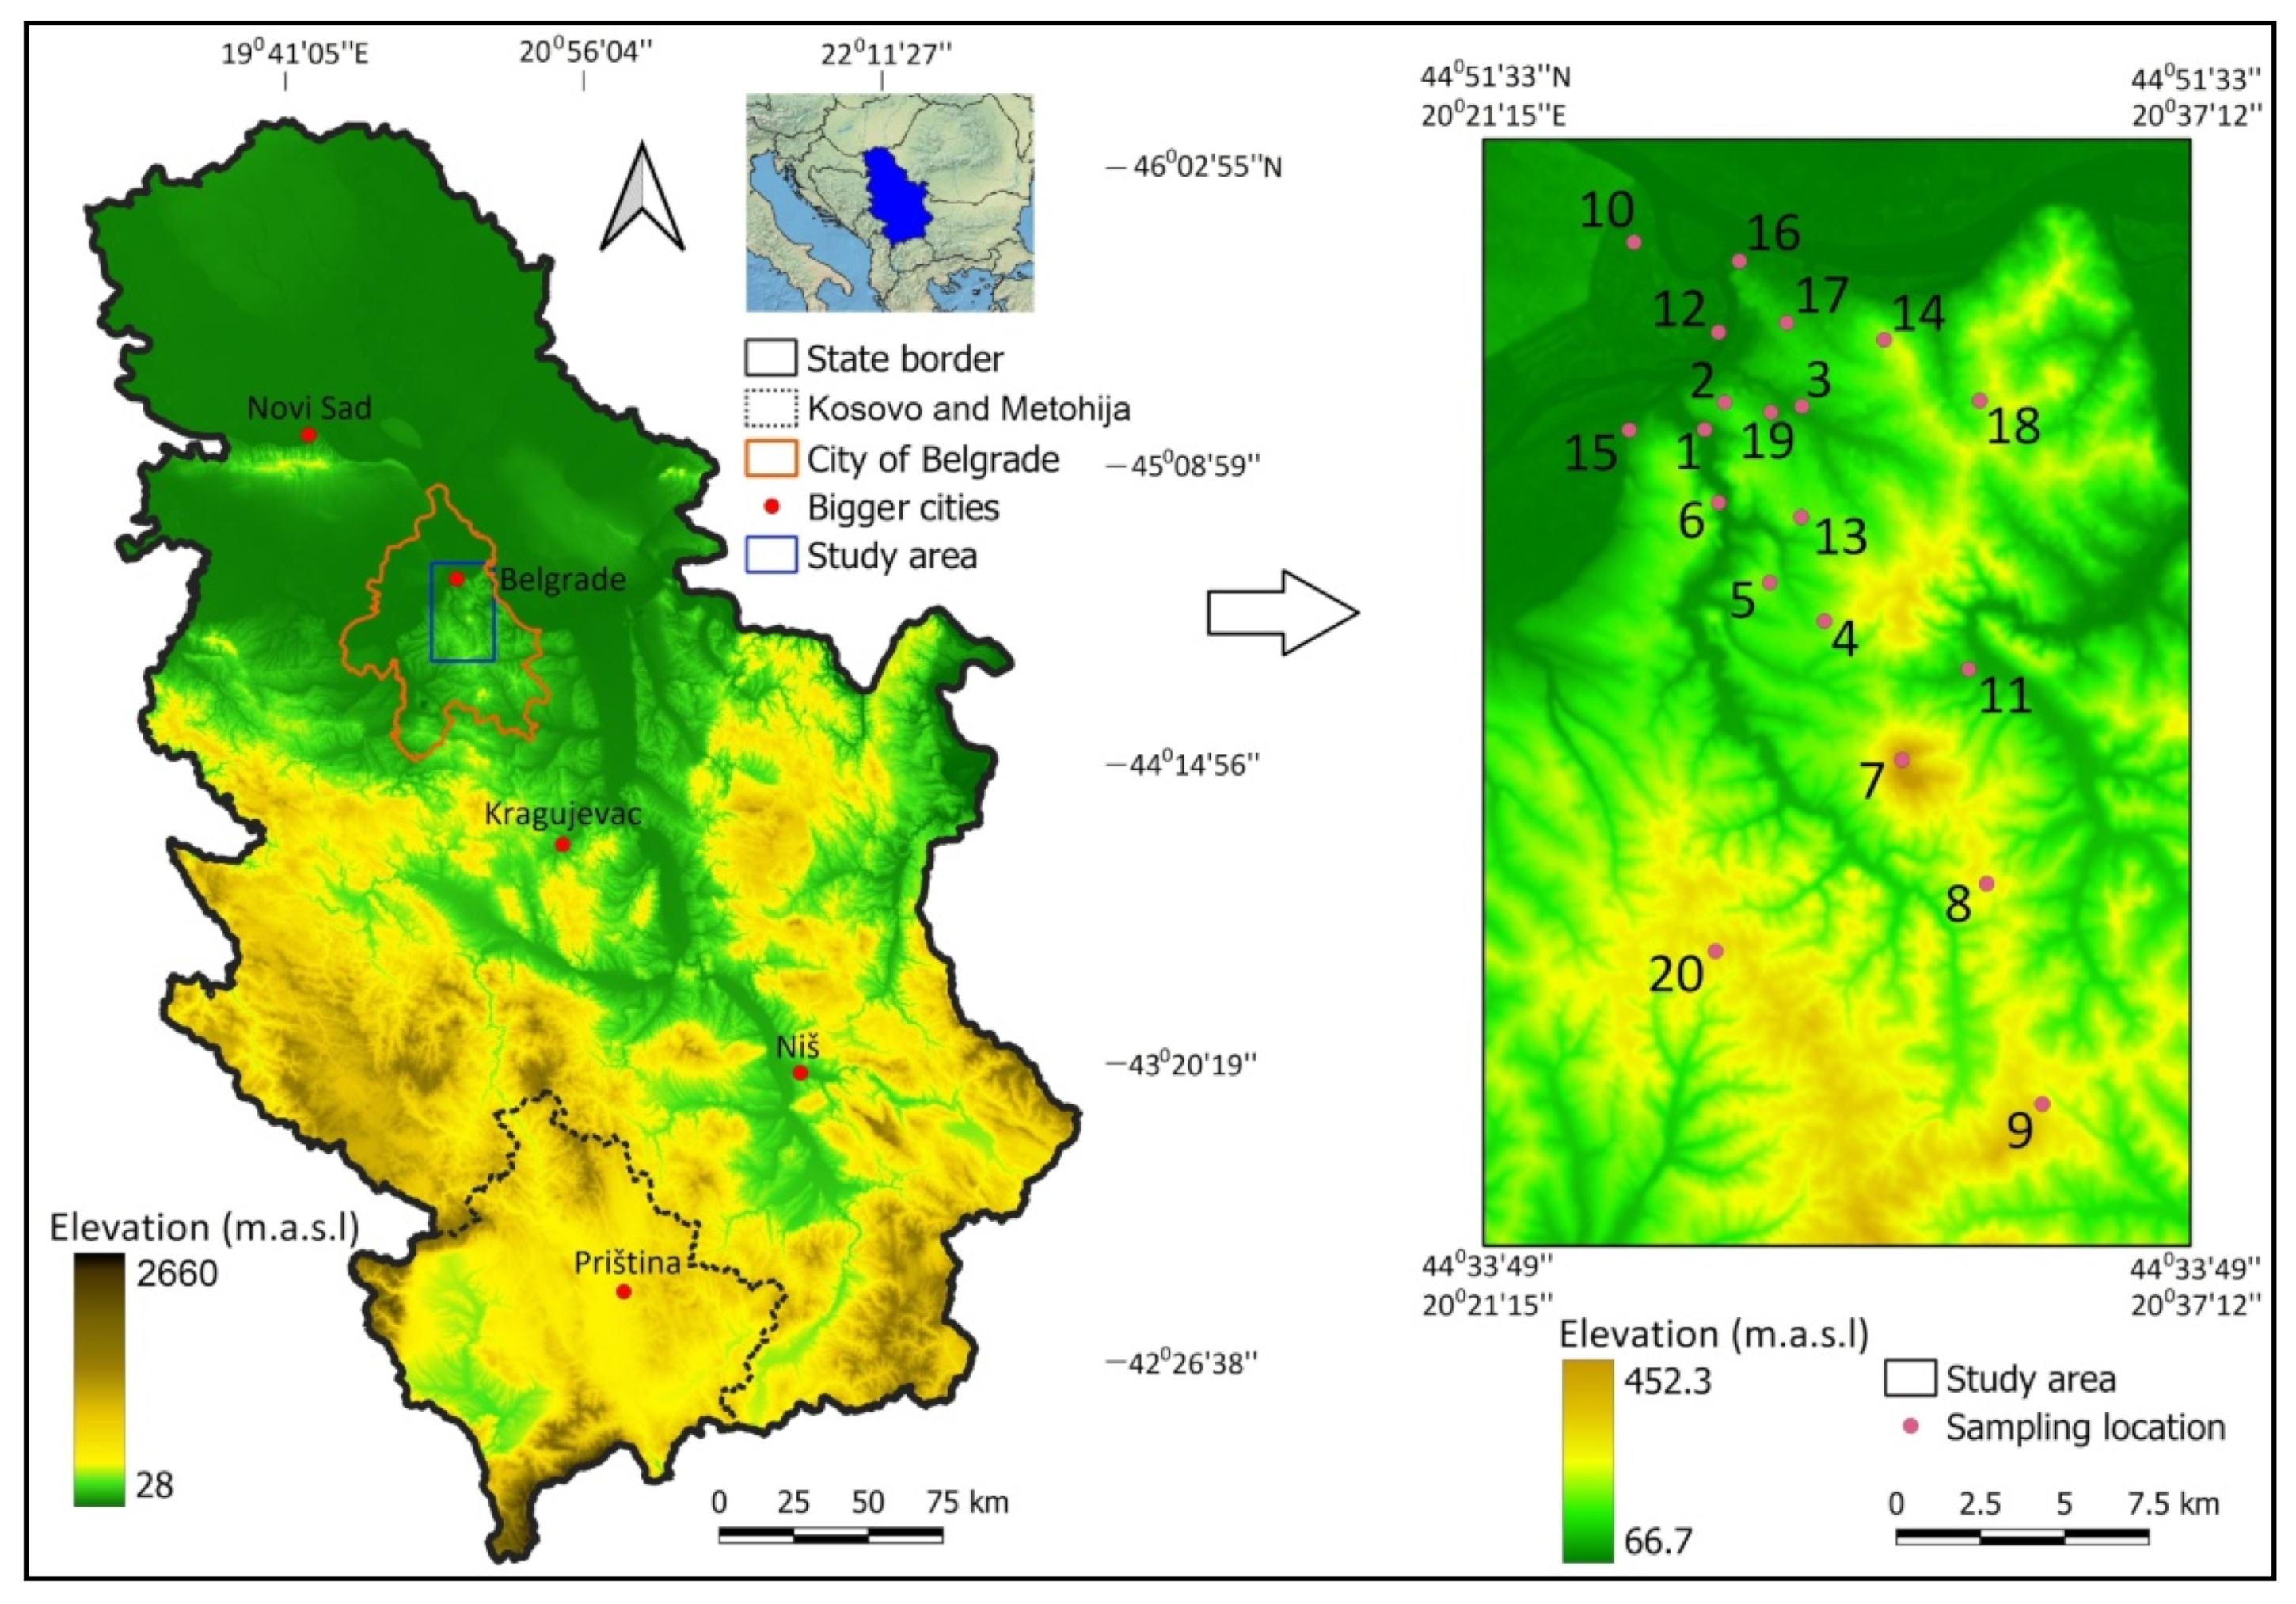
2.1. Study Area

The capital of Serbia, the City of Belgrade, is located in Southeast Europe (44°49′ N, 20°28′ N, approximately 120 m a.s.l.) at the confluence of the Sava and Danube rivers (Figure 1). It is the commercial and industrial center of the country, covering an area of about 3000 km2, divided into seventeen municipalities with more than 1.8 million inhabitants (23% of the total Serbian population). With a growing population, the environmental quality of the urban air and soil has become more important considering its health impact. The study area encompasses the densely populated territory of the city, which includes most popular parks (Figure 1).

2.1.1. Geology and Pedology

The morphological relief of the Belgrade area resulted from tectonic movements (Paleaogene and Neogene) and occurs in two distinct units: lowland terrain (north of the Sava and Danube rivers) and hilly–mountainous area (south of the Sava and Danube rivers). Intensive erosion processes formed the fluvial and hillslope relief that dominates, but there are particular remnants of the marine–limnic features [13].
In terms of pedology, in the urban Belgrade area, there are fluvic cambiosols, fluvisols, and gleysols on the lower river terraces, and many colluvial soils formed by intensive soil erosion. The heavy sediments predominantly contain clays, and sequences of regosol, leptosol, eutric cambisol, and luvisol dominate in overlying the sediments [14].

2.1.2. Climate

Belgrade has a continental climate, although as a result of urbanization, reduced vegetation, and new heat sources, the “town climate” can be assumed [15]. The average annual air temperature is 13.9 °C in Belgrade and its surroundings, and the average annual precipitation is 654.3 mm [16].

2.2. Sampling and Preparation

Soil samples were collected from twenty locations in parks and remnant forests in Belgrade and its surroundings, according to the recommendations provided by IAEA (International Atomic Energy Agency) [17]. After removing the stones and plant residues, the preparation of soil samples for analysis was: drying to constant weight, homogenizing up to the granulation less than 2mm, and packing. At the same time, twenty leaf samples from two of the most represented deciduous trees of the Quercus genus (mostly pedunculate oak) and Platanus spp. were collected at each soil sampling site. Undamaged fully developed leaves (after the vigorous growth stage) were randomly detached from a height of 2.0 m above the ground while wearing polyethylene gloves to avoid contaminating the samples. Leaves were collected from a convenient position on the outside of the crown (exposed to the full light), as the concentrations of nutrients were assumed to be steady. Sampling was done in the beginning of autumn 2021, early on five consecutive sunny days. No precipitation occurred prior to or during the sampling period. The sampled material was stored in polyethylene bags and transported to the laboratory. Samples were not washed (to estimate absorbed and deposited pollutants). Leaves were dried at room atmosphere, chopped, and homogenized. A global positioning system receiver (GPS, Garmin eTrex 30x) was used for determining geographical coordinates; elevations ranged from 31 to 431 m.

2.3. Gamma Spectrometry Analysis

Naturally occurring 226Ra, 232Th, 40K, 7Be, and anthropogenic 137Cs activity concentrations in soil and leaf samples were determined using the gamma spectrometry method. In order to ensure monthly radioactive equilibrium between 226Ra and its progeny, all samples were sealed in 450 mL Marinelli beakers. Specific activities of radionuclides in soil and leaves were measured using a coaxial HPGe detector, GEM30–70 ORTEC (Ametek, Oak Ridge, TN, USA) with 30% relative efficiency, and 1.65 keV FWHM for 60Co at 1.33 MeV; the detector was placed in a 10 cm lead shield to reduce the background radiation. A calibration source of a Marinelli mixture by Chech Metrological Institute (type MBSS 2 containing eleven radionuclides: 241Am, 109Cd, 139Ce, 57Co, 60Co, 137Cs, 113Sn, 85Sr, 88Y, 203Hg and 152Eu), was used for detector calibration. Soil samples were measured for 3 h, while leaf samples were measured for 48 h. After background subtraction, the assessment of radionuclide activity concentrations (with a decay correction to the time of sampling for 7Be) was done using intense gamma lines of nuclides [18]. The specific activity of 226Ra was obtained using the gamma lines of 214Pb (351.9 keV) and 214Bi (609.3 and 1764.5 keV). The specific activity of 232Th was estimated by the gamma lines of 228Ac at 338.3, 911.1, and 968.9 keV, and the line of 208Tl at 583.0 keV. The gamma lines at 661.6 and 1460.7 keV were used for evaluating the activities of 137Cs and 40K, respectively. The specific activity of 7Be was determined by the visible peak at 477.6 keV.

2.4. Radiological Risk Assessment

The risk from radionuclides is assessed through the annual effective dose and excess lifetime cancer risk. The sum of 226Ra, 232Th, and 40K (Bq kg1) activity concentrations in soil multiplied by corresponding dose coefficients 0.462, 0.604, and 0.0417 (nGyh−1/Bqkg−1), respectively [19], was used to calculate the absorbed dose rate D (nGy h−1) in air at 1 m above ground level due to the presence of these radionuclides. D (nGy h−1) was converted to annual effective dose DE (μSv y−1) by multiplying with the conversion coefficient 0.7 SvGy−1 and the outdoor occupancy factor of 0.2 for one year (8760 h), as follows:
DE = 1226 ∙ D
Excess lifetime cancer risk ELCR was calculated using the estimated values of DE (μSv y−1):
ELCR = DERFLF
where fatal cancer risk for the whole population RF =5.5·10−2 Sv−1 and the life expectancy LE = 70 y [20].

2.5. Determination of Physical and Chemical Characteristics

The pH of the soil was analyzed using the standardized ISO method 10390:1994 (suspension in water and in 1 M KCl). Organic matter content was determined using ISO method 14235:1998, while the free CaCO3 was analyzed using method ISO 10693:1995. Particle size distribution was analyzed by the sieving and pipetting method [21], and particles were divided in following size fractions: coarse sand (200–2000 µm), fine sand (20–200 µm), silt (20 µm), and clay (2 µm).

2.6. Analysis of Heavy Metal Content in Soil and Leaves

Thirteen elements (As, Cd, Co, Cr, Cu, Na, Ni, Pb, Zn, K, Ca, Mg, and Mn) were determined in soils and leaves collected in parks. Soil samples were treated with 9 mL of HNO3 (concentrated, 65%) and 1 mL of HCl (concentrated, 37%) and then digested in a Milestone Ethos1 microwave sample preparation system. Digested soil samples were filtered and transferred to 50 mL flasks and diluted with deionized water.
One-half gram of dried leaves was treated with a mixture of 10 mL of HNO3 (concentrated, 65%) and 2 mL of H2O2 (concentrated, 30%) in closed Teflon vessels at high pressure and temperature using the Milestone Ethos 1 digestion system. Analysis of heavy metals in prepared soil and leaf samples was performed using ICP-OES (Varian Vista Pro-axial; Varian, Mulgrave, Victoria, Australia).
Quality assurance and quality control (QA/QC) were provided by analysis of certified reference materials SRM1515 (apple leaves) and IRMM BCR 142R (light sandy soils). The results obtained achieved adequate analytical accuracy and precision.
All reagents were analytical grade or better, and blank samples were included in each extraction procedure. All calibration standards were prepared in the same acid matrix used for soil and leaf samples.

2.7. Health Risk Assessment from Heavy Metals

Noncarcinogenic and carcinogenic risks associated with the exposure to metals in soil were estimated by applying the US Environmental Protection Agency model [22]. Noncarcinogenic risk was estimated by calculating hazard index (HI) based on three possible pathways of exposure: ingestion, air inhalation, and dermal contact. In order to estimate the risk associated with each of the pathways, the average daily doses (ADDs) were calculated:
A D D i n g = C × I n g R × E F × E D B W × A T × 10 6
A D D i n h = C × I n h R × E F × E D P E F × B W × A T  
A D D d e r m a l = C × S A × A F × A B S × E F × E D B W × A T × 10 6  
where ADDing, ADDinh, and ADDdermal (in mg kg−1day−1) are average daily intake from soil ingestion, inhalation, and dermal absorption, respectively; C is the concentration of the metal in soil (mg kg−1); IngR and InhR are ingestion and inhalation rates, respectively; EF is the exposure frequency; ED is the exposure duration; BW is body weight of the exposed individual; AT is the averaging time; PEF is the emission factor; SA is the surface area of the exposed skin; AF is the adherence factor; and ABS is the dermal absorption factor. The values of all parameters were listed in previous papers [23,24,25,26].

2.8. GIS Analysis

Geographic information systems (GIS) are a powerful tool for analysis and visualization of phenomena and processes in the environment [27,28,29]. Many studies worldwide have focused on methods based on GIS and geospatial data in order to provide an adequate presentation of research results from a geochemical and geographical aspect [30,31,32]. In this study, an interpretation of results was performed using GIS and numerical analysis, i.e., a cartographic presentation of the spatial distribution of radionuclides and heavy metals in the parks of the City of Belgrade. The open-source software package Quantum GIS 3.8 was used in which data from field research were processed by the IDW (inverse distance weighted) method of interpolation; this is a mathematical (deterministic) model whose basic characteristic is that all points on the topographic surface are considered to be interdependent, based on distance [33]. In this case, twenty sampling locations were covered by interpolation, which visually determines and classifies the values of heavy metals and radionuclides. The classification was performed and mapped to 7–9 classes depending on the concentration of each heavy metal and radionuclide. The thematic maps were exported as a result of the interpolation and the values reclassified. The GPS handheld receiver used in this study was the Garmin eTrex 30x. This device is characterized by solid precision and durability in weather conditions. The minimum number of satellites that is necessary to determine the relative accuracy, i.e., relative error, is 4. In this study, the average number of satellites that were operational was 11, which gave an accuracy of 3 m.

3. Results and Discussion

3.1. Physicochemical Properties of Soil

The main physical and chemical soil properties for each sample location are presented in Table 1. The soil pH measured in 1M KCl solution ranged from acidic (3.33, at location Lipovica) to neutral (7.42, at location Beograd na vodi). The CaCO3 content showed high heterogeneity and ranged from below detection limit (detection limit = 0.2%) to 14.16% measured at location Kalemegdan. Organic matter content ranged from 2.54% (location Banjica) to 8.25% (location Avala 2). Clay content ranged from 3.36 to 25.72% relative to the particle size distribution.

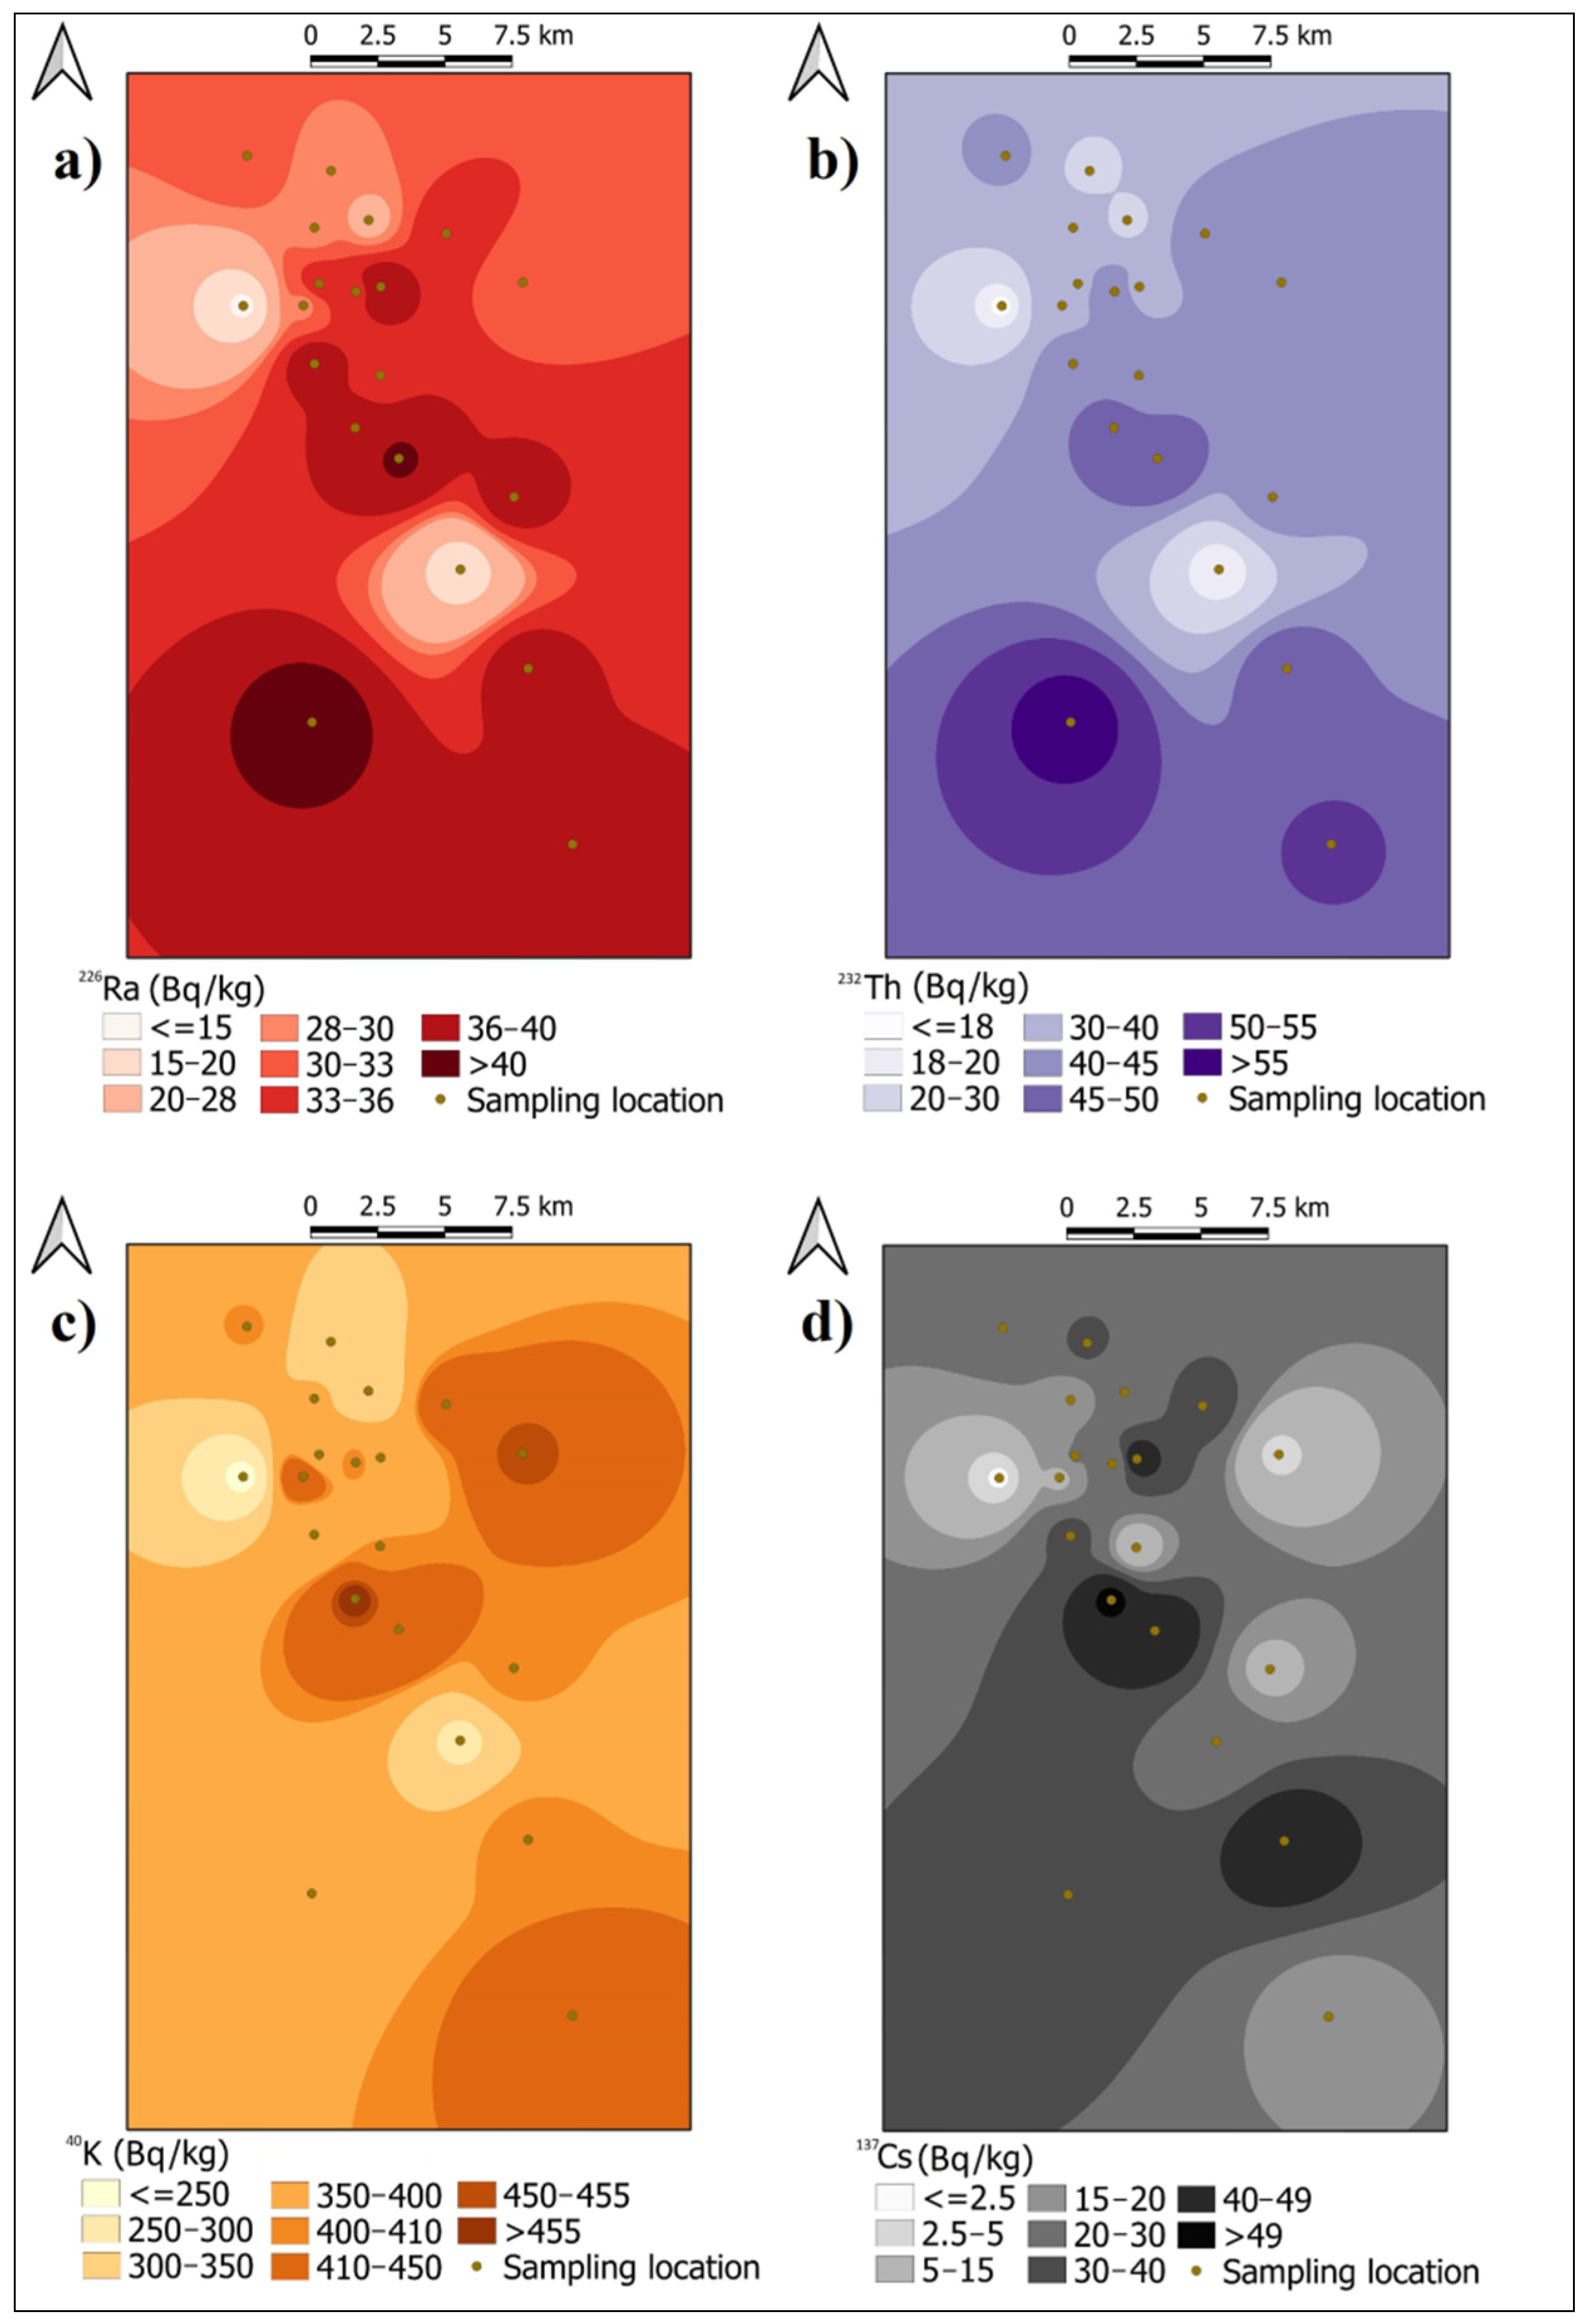
3.2. Radioactivity Levels

Based on the GIS approach, the maps showing the spatial distribution of radionuclides 226Ra, 232Th, 40K, and 137Cs in soil are presented in Figure 2. According to the data and Figure 2, quite similar spatial distributions of radionuclides 226Ra (average 32.9 Bq/kg) and 232Th (average 39.8 Bq/kg) are evident, confirming their common origin and occurrence in nature. Strong positive correlation between 226Ra and 232Th was also confirmed by Spearman correlation analysis (Spearman’s rho = 0.807).
Specific activities of 226Ra, 232Th, and 40K in soil were negatively correlated with CaCO3 and coarse sand, and positively correlated with silt and clay soil fractions. These results are in line with other studies indicating that the fine-grained soil fraction has a higher tendency for radionuclide adsorption [34,35,36].
The specific activities of 40K, 7Be, and 137Cs in leaves were determined and are presented in Table 2. The lack of correlation (Spearman’s rho = −0.150) indicates that deposition predominantly takes place as a result of wet deposition of atmospheric aerosols with precipitation. 40K activities in leaves are lower than those reported previously by Todorović et al. [37] for the parks of Belgrade, probably owing to sampling period, since potassium is essential during vigorous growth. Potassium is a macronutrient, a major inorganic cation in the cytoplasm of plants, required for the activity of various enzymes involved in primary metabolism [38]. Foliar uptake is considered as the main route for plant intake of 7Be due to its atmospheric deposition; absorption through the leaves is higher in plants with larger leaf areas [39]. Pöschl et al. found that 7Be in birch tree leaves ranged from 147 to 279.6 Bq/kg [40], while Karunakara et al. reported 7Be activity concentrations in the leaves from a tropical forest ranging from 72.5 to 1060.8 Bq/kg [39]. 137Cs activities in leaves were generally low and often close to the minimum detectable activity (MDA). Specific activities of 226Ra and 232Th in leaves were below MDAs; MDAs of 226Ra, 232Th, and 137Cs were estimated as follows: 0.7, 2.7, and 0.7 Bq/kg.

3.3. Annual Effective Dose and Excess Lifetime Cancer Risk from Radionuclides

The results of annual effective dose are presented in Table 2; the mean value of 68 µSv y−1 is quite similar to the average external exposure to natural terrestrial sources of radiation given by UNSCEAR [19].
The average value of ELCR is 2.6·10−4 (according to Table 2); this value is almost equal to the worldwide average of 2.54·10−4. According to the calculated values, there is no increased radiological risk to the population of Belgrade City.

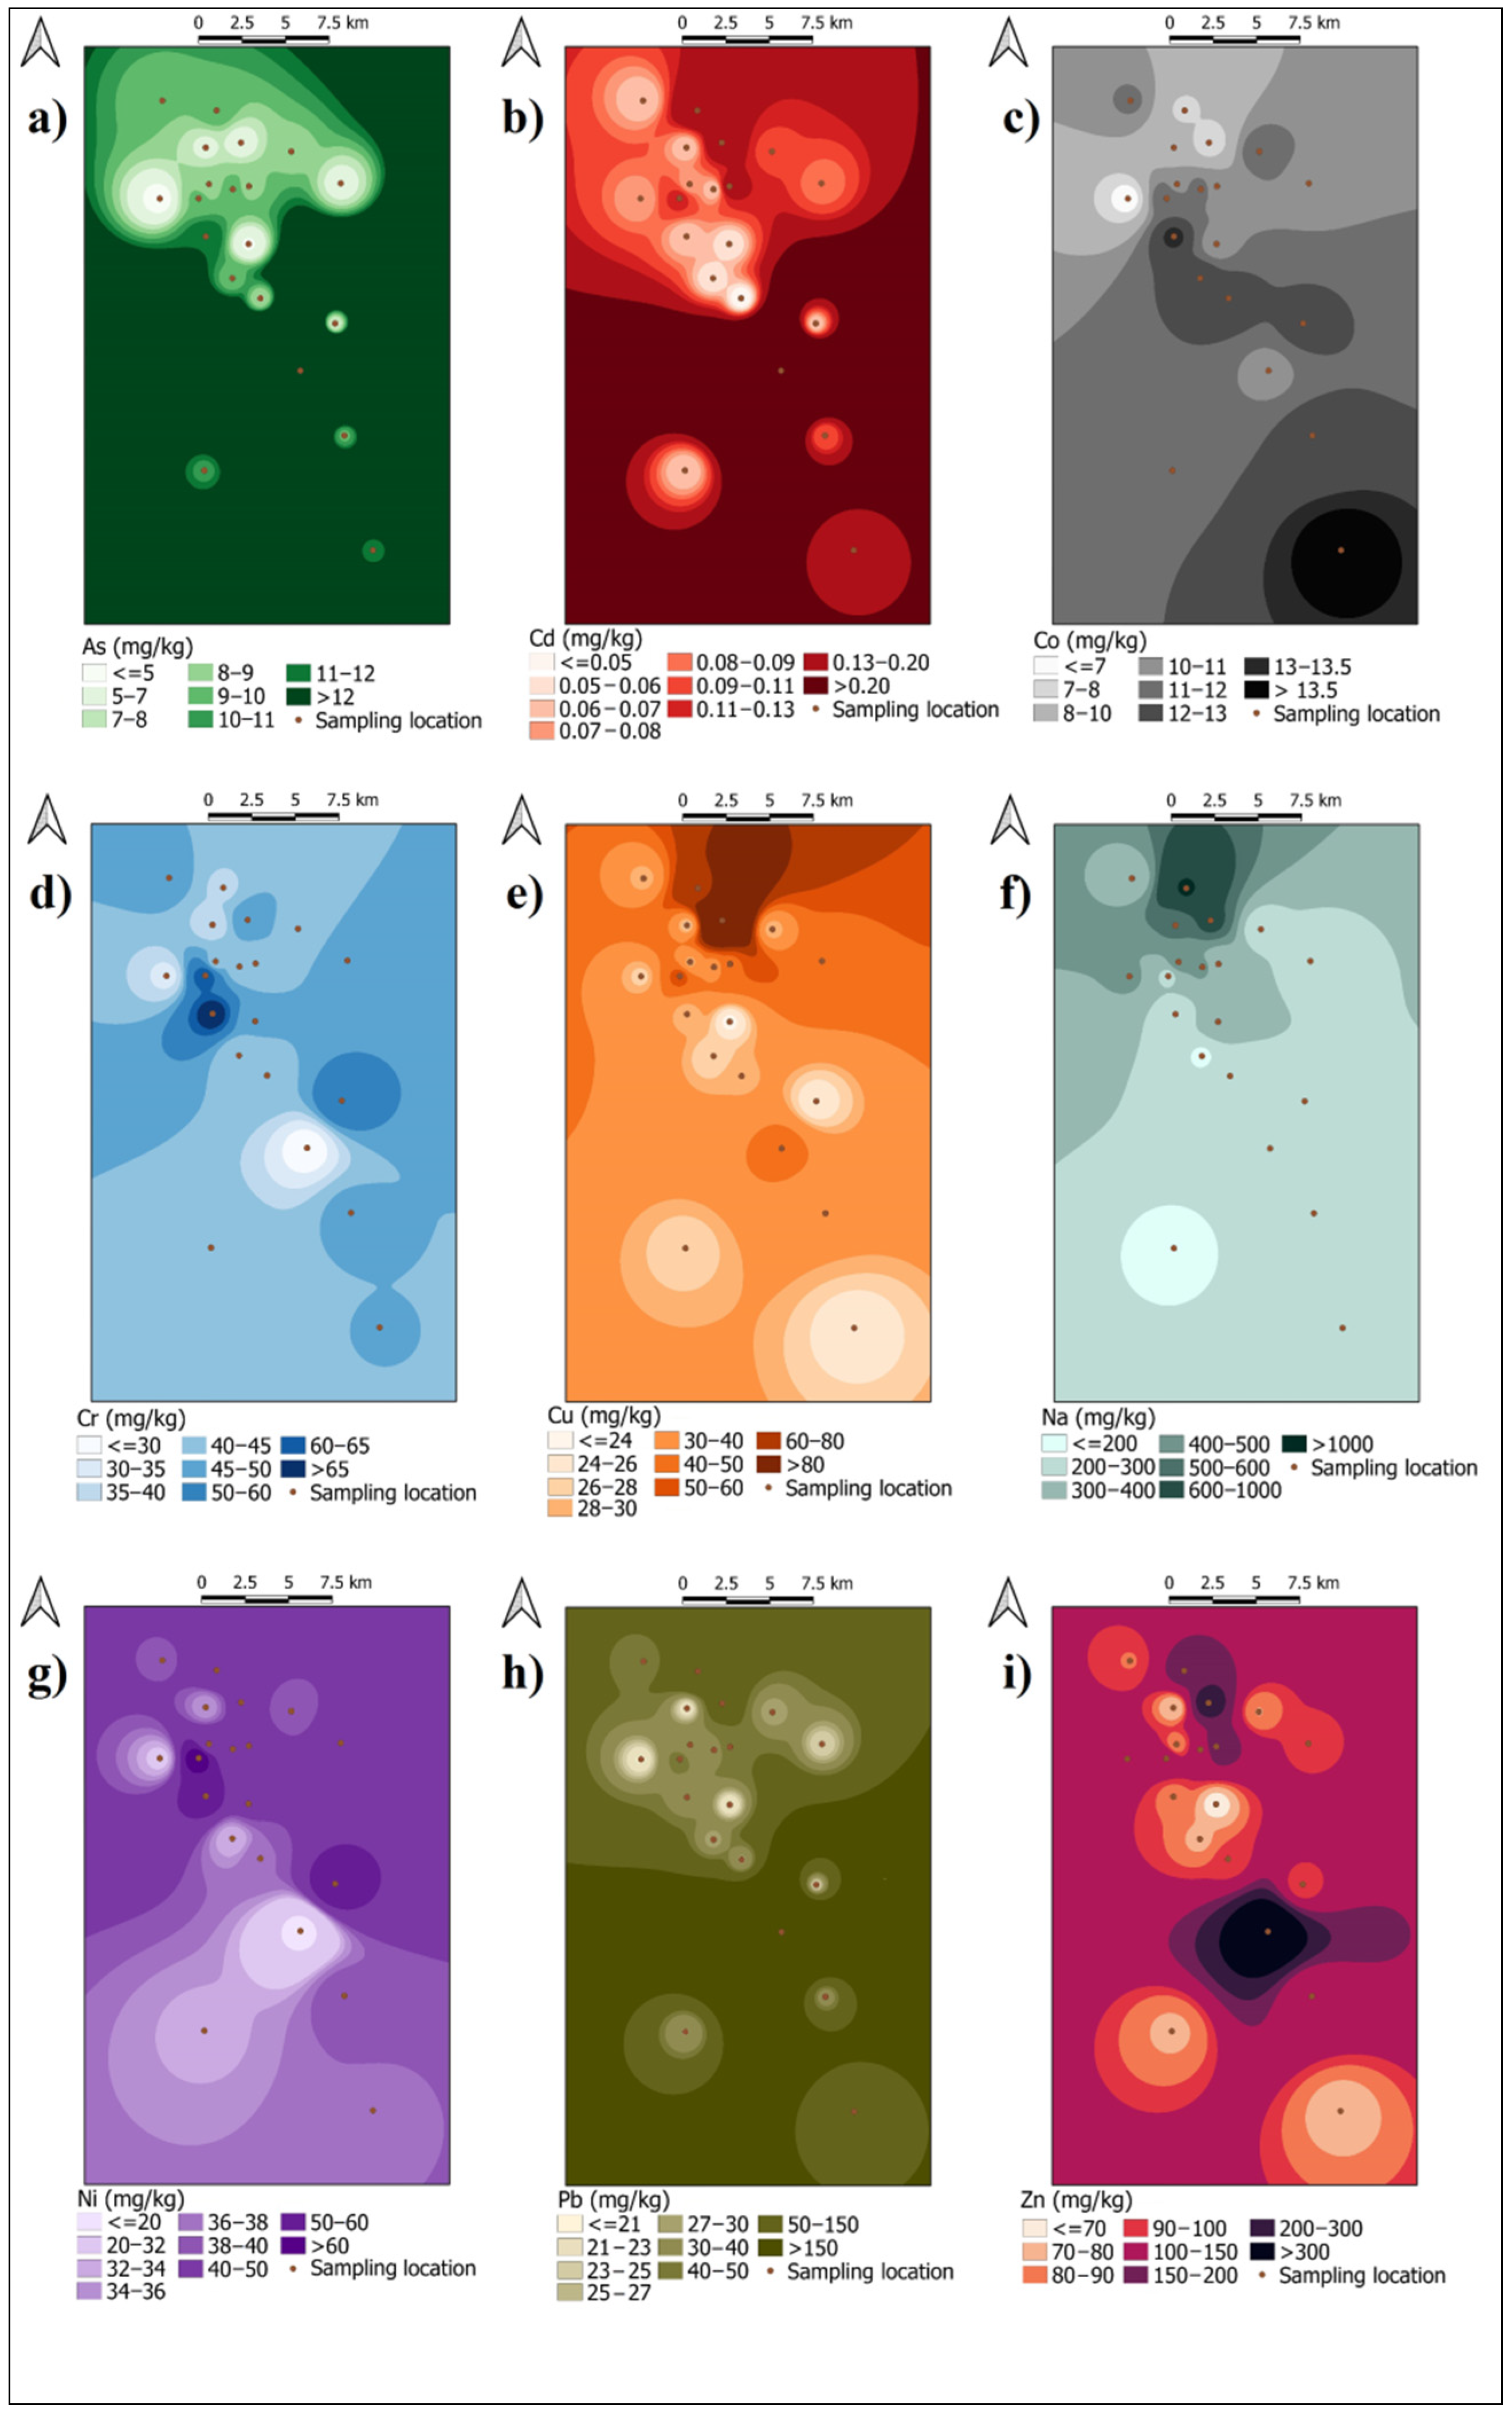
3.4. Heavy Metal Content

Metals content in analyzed soil and leaf samples are presented in Table 3 and Table 4. Maps showing the spatial distribution of As, Cd, Co, Cr, Cu, Na, Ni, Pb, and Zn are presented in Figure 3a–i, along with essential metals for plant nutrition: Ca, K, Mg, and Mn, in Figure 4a–d. Table 5 presents the Spearman correlation matrix for heavy metals and radionuclides in soil.
Target and intervention levels of As and metals proposed by Dutch standard for soil [41] and Serbian Soil Quality Regulation were corrected for each particular sample based on its organic matter and clay content [42]. Accordingly, concentrations of As (759.6 mg/kg), Cd (5.42 mg/kg), and Pb (4297 mg/kg) in soil sampled at location Avala 1 were significantly higher than remediation values, which classifies this soil as highly contaminated. However, the origin of As, Cd, and Pb at this location is probably not anthropogenic but geogenic. Parent rock from which Avala soils are formed is rich in these metals and several mines for extraction of Pb existed in Avala since ancient times and mined up to 1970. Neutral pH value of soil and high content of organic matter (at location Avala 1) help to bind metals firmly to soil fractions, which makes them less available for plant uptake. Although the concentrations of As and Cd in soil at Avala 1 location are above remediation value, their concentrations in leaves were low. However, concentration of lead in collected leaves was rather high (30.93 mg/kg), indicating that due to its high concentration in soil, which is almost ten times higher than the remediation value, a significant fraction of lead is bioavailable to plants.
Concentrations of Co, Cu, and Ni were above corrected target values in almost all soil samples. However, soils in Serbia are naturally rich in these elements and even in agricultural soil and soils that are in rural areas or distant from pollution sources have concentrations of Co, Cu and Ni higher than target values [30,43]. Concentrations of Co, Cu, and Ni in leaves collected at the soil sampling locations are low, indicating low uptake potential of Quercus and Platanus species for these metals.
Lead concentration higher than target but lower than intervention value was measured in soil samples at location Kalemegdan. The quality of soil in parks and green areas in central (urban) zone of Belgrade has been studied previously by Gržetić and Ghariani [44] and Marjanović et al. [45]. In both studies, increased concentration of lead in soil at Kalemegdan was detected and ranged from 262.9 mg/kg [44] to 535 mg/kg [45]. In these studies, urban soils near streets with heavy traffic in the vicinity of Kalemegdan were also analyzed and increased lead concentrations were found, indicating that lead is originating from anthropological sources, probably from leaded petrol used up to year 2010. Although soils at Kalemegdan are rich in lead, its uptake by plants is very low and only 0.5 mg/kg of lead was detected in leaves sampled at Kalemegdan.

3.5. Spatial Distribution of Heavy Metals

The software’s Quantum GIS 3.8.12 and SAGA (System for Geoscientific Analysis) were used to analyze spatial distribution of radionuclides and heavy metals in soil. There are few advanced spatial methods that can be used. The first ordinary method used in this research was the IDW method (method of spatial interpolation based on measured points), but it is not satisfactory in finding better spatial patterns. The other methods used in this research were the kriging and semi-kriging methods. These methods are good to improve the quality and precision of spatial analysis, and also minimized statistical errors of the measured data. Therefore, algorithms supported by kriging methods approved by GIS may render the raster in a precise and valuable form for the future manipulations [46]. Results of the spatial GIS analysis included heavy metals concentration and distribution in the soils in the area of central Belgrade, which covers 3000 km2.
The highest concentration of As (>12 mg/kg) covers an area of 2100 km2. It is in the south and east areas with geographical azimuth between 120° S and 190° S and an altitude of 298 m (Figure 3a). The average concentration (5–7 mg/kg) covers an area of 260 km2 with commonly central and western parts of the city with azimuth between 60° N and 80° N. The lowest concentrations of As are distributed in the central and eastern parts, covering a territory of 130 km2 with azimuth between 45° W and 90° W.
The highest concentration of Cd (>0.20 mg/kg) on the average altitude of 252 m (Figure 3b) covers an area of 1800 km2 with an azimuth between 110° S and 170° S (in the predominantly southern sides) of the city of Belgrade. The average concentration of Cd (0.09–0.11 mg/kg) covers a territory of 240 km2 in the southeast and west areas with an azimuth between 60° SE and 90° SE. The lowest Cd (≤0.05 mg/kg) is concentrated in central and western parts of 60 km2 with azimuth varying between 60° W and 90° W.
The highest concentration of Co (>13.5 mg/kg) covers an area of 40 km2 mostly in the south (azimuth of 90° S and 120° S); the average altitude is 402 m (Figure 3c). The average Co concentrations (8–10 mg/kg) are distributed in the central and western parts of the city with azimuth between 45° W and 90° W. The lowest concentration of Co (≤7 mg/kg) is in the western and northern parts (an azimuth between 60° N and 90° N).
The highest concentration of Cr (>65 mg/kg) covers an area of 15 km2 in the northern part of the city (azimuth of 70° N and 90° N), at an average altitude of 302 m (Figure 3d). The average concentrations of Cr (35–40 mg/kg) are distributed in the southern and central parts of the city; the azimuth varies between 90° S and 90° N. The lowest value of Cr (≤30 mg/kg) is concentrated in an area of 60 km2 (an azimuth between 45° E and 90° N).
The territory of 100 km2 with the highest concentration of Cu (>80 mg/kg) is located in the northern part of the city (Figure 3e) with the azimuth between 80° N and 90° N and an average altitude of 256 m. The average concentrations (30–40 mg/kg) are distributed in the central, eastern, and western parts of the city with the azimuth between 45° W and 45° E. The lowest concentrations of Cu (≤24 mg/kg) are distributed in the northern and central parts with an azimuth between 90° S and 45° E.
The highest Na concentration (>1000 mg/kg) is distributed in the central part of the city at the altitude of 199 m (Figure 3f) and covers an area of 10 km2 (the azimuth is between 80° N and 90° N). The average concentrations of Na (400–500 mg/kg) are distributed in central, western, and eastern parts of the city with an azimuth between 60° E and 45° W. The lowest value of Na (≤200 mg/kg) is concentrated in the southern part with the azimuth between 45° S and 90° S.
The highest concentrations of Ni (>60 mg/kg) are distributed in the central and eastern part of the city (the average altitude of 234 m) and cover an area of 30 km2 (Figure 3g). The average Ni concentrations (32–34 mg/kg) are located in the southern and central parts of the city with the azimuth between 45° E and 60° W. The lowest concentration of Ni (≤20 mg/kg) is distributed in the central part of the city; the azimuth is between 30° E and 30° W.
The highest concentrations of Pb (>150 mg/kg) are distributed in the central and northern parts of the city (an average altitude of 203 m). This area occupies 2300 km2 with an azimuth between 90° E and 90° W. The average concentrations of Pb (40–50 mg/kg) are distributed in the northern part of the city (an azimuth between 45° W and 60° E). The lowest Pb concentration (≤21 mg/kg) is distributed in the central part with an azimuth between 40° E and 40° W (Figure 3h).
The highest concentration of Zn (>300 mg/kg) is distributed in the central and south parts of the city with an area of 90 km2 and the azimuth between 20° E and 90° W (the average altitude of 305 m). The average concentrations of Zn (100–150 mg/kg) are distributed in the central and northern, western, and southern parts of the city; the azimuth varies between 10° N and 250° S. The lowest concentration of Zn (≤70 mg/kg) is distributed in the central part of the city with an azimuth between 45° E and 45° W (Figure 3i).
Generally, the spatial distribution of (As, Cd, Co, Cr, Cu, Na, Ni, Pb, and Zn) is the highest in the central and northern part of the city with average altitude of 255 m.

3.6. Hazard Index and Carcinogenic Risk from Heavy Metals

Hazard quotients for ingestion, inhalation, and dermal exposure (HQing, HQinh, and HQder, respectively) were calculated as the ratios of average daily doses to corresponding reference doses, RfD. Hazard index (HI) for each metal was then calculated as the sum of HQs obtained for the three exposure pathways. Total hazard index (THI) was obtained by summing HIs of all measured metals (Figure 5). A hazard index greater than 1 suggests that residents may experience noncarcinogenic harmful effects due to long-term exposure to heavy metals in soil [22]. THI values were in the range of 0.09–5.66 for adults and 0.73–51.93 for children. The highest THI was observed in Avala 1 due to the high concentrations of As (HIadult = 3.74 and HIchild = 34.4) and Pb (HIadult = 1.75 and HIchild = 16.24). Hazard quotients of these two metals are in the order HQing > HQder > HQinh, indicating that ingestion was the predominant exposure pathway.
Carcinogenic risk (CR) was obtained by multiplying average daily doses by the slope factors available for certain metals and certain pathways of exposure [47]. Owing to the lack of carcinogenic slope factors for other metals and other pathways, the carcinogenic risks were estimated for As (ingestion + inhalation + dermal contact), Cr (ingestion + inhalation), Ni (inhalation), and Pb (ingestion). Total carcinogenic risk (TCR) was calculated by summing the contributions of different exposure pathways for adults and children (Table 6). The values of cancer risk between 10−6 and 10−4 indicate an acceptable or tolerable risk to human health, while CR above 10−4 indicates high risk for developing a cancer due to the lifetime exposure [48]. Figure 5 presents distributions of TCRs (summed for As, Cr, Ni, and Pb) from heavy metals in the studied area.

4. Conclusions

Natural radionuclides and 137Cs pose no significant radiological risk in the parks of Belgrade. However, all locations were found to be contaminated by heavy metals. Co and Ni exceeded the target values in almost all soil samples. Concentrations of Cu higher than target values were found in 45% of samples, while increased Zn concentration was observed at five locations. The sample location Avala 1 was polluted by As, Cd, Co, Cu, Pb, and Zn (all above corrected target levels). However, since soils in Serbia are naturally rich in heavy metals, current pollution cannot be attributed solely to anthropogenic factors, but also to soil properties and the underlying geology of the area.

Author Contributions

Conceptualization, L.G. and A.V.; methodology, J.M.S. and T.Z.; software, U.D. and A.V.; formal analysis, U.D.; investigation, L.G. and A.V.; resources, A.V.; data curation, L.G. and T.Z.; writing—original draft preparation, L.G. and J.M.S.; writing—review and editing, L.G., J.M.S. and T.Z.; supervision, L.G. and J.M.S.; funding acquisition, A.V. All authors have read and agreed to the published version of the manuscript.

Funding

This work was supported by the Ministry of Education, Science and Technological Development of the Republic of Serbia (Grant No. 451-03-68/2022-14/200123, 451-03-68/2022-14/200378 and 451-03-68/2022-14/200091).

Institutional Review Board Statement

Not applicable.

Informed Consent Statement

Not applicable.

Data Availability Statement

The data are available on reasonable request from the corresponding author.

Acknowledgments

This work was supported by the Ministry of Education, Science and Technological Development of the Republic of Serbia (Grant No. 451-03-68/2022-14/200123, 451-03-68/2022-14/200378 and 451-03-68/2022-14/200091).

Conflicts of Interest

The authors declare no conflict of interest.

References

  1. Reynolds, B.C.; Wasserburg, G.J.; Baskaran, M. The transport of U- and Th series nuclides in sandy confined aquifers. Geochim. Cosmochim. Acta 2003, 67, 1955–1972. [Google Scholar] [CrossRef]
  2. Mielke, H.W.; Gonzales, C.R.; Smith, M.K.; Mielke, P.W. The Urban Environment and Children’s Health: Soils as an Integrator of Lead, Zinc, and Cadmium in New Orleans, Louisiana, USA. Environ. Res. 1999, 81, 117–129. [Google Scholar] [CrossRef] [PubMed]
  3. Jim, C.Y. Holistic research agenda for sustainable management and conservation of urban woodlands. Landsc. Urban Plan. 2011, 100, 375–379. [Google Scholar] [CrossRef]
  4. Wei, B.; Yang, L. A review of heavy metal contaminations in urban soils, urban road dusts and agricultural soils from China. Microchem. J. 2010, 94, 99–107. [Google Scholar] [CrossRef]
  5. Rademacher, P. Atmospheric Heavy Metals and Forest Ecosystems; Work Report of the Institute for World Forestry: Hamburg, Germany, 2013. [Google Scholar]
  6. Henry, H.F.; Burken, J.G.; Maier, R.M.; Newman, L.A.; Rock, S.; Schnoor, J.L.; Suk, W.A. Phytotechnologies: Preventing exposures, improving public health. Int. J. Phytoremediation 2013, 15, 889–899. [Google Scholar] [CrossRef] [PubMed] [Green Version]
  7. Celik, A.; Kartal, A.A.; Akdogan, A.; Kaska, Y. Determining the heavy metalpollution in Denizli (Turkey) by using Robinio pseudo-acacia L. Environ. Int. 2005, 31, 105–112. [Google Scholar] [CrossRef]
  8. Moreno, E.; Sagnotti, L.; Dinarès-Turell, J.; Winkler, A.; Cascella, A. Biomonitoring of traffic air pollution in Rome using magnetic properties of treeleaves. Atmos. Environ. 2003, 37, 2967–2977. [Google Scholar] [CrossRef]
  9. Liang, J.; Fang, H.; Zhang, T.; Wang, X.; Liu, Y. Heavy metal in leaves of twelve plant species from seven different areas in Shanghai, China. Urban For. Urban Green. 2017, 27, 390–398. [Google Scholar] [CrossRef]
  10. Beckett, K.P.; Freer-Smith, P.; Taylor, G. Particulate pollution capture by urban trees: Effect of species and windspeed. Glob. Chang. Biol. 2000, 6, 995–1003. [Google Scholar] [CrossRef]
  11. Gratani, L.; Crescente, M.F.; Varone, L. Long-term monitoring of metalpollution by urban trees. Atmos. Environ. 2008, 42, 8273–8277. [Google Scholar] [CrossRef]
  12. Dzierzanowski, K.; Popek, R.; Gawronska, H.; Sæbø, A.; Gawronski, S.W. Deposition of particulate matter of different size fractions on leaf surfaces andin waxes of urban forest species. Int. J. Phytoremediation 2011, 13, 1037–1046. [Google Scholar] [CrossRef] [PubMed]
  13. Menković, L.; Košćal, M.; Mijatović, M.; Živković, M. Geomorfološka karta Srbije 1:300000 s Tumačem (Geomorphological Map of Serbia 1:300000 with an Interpreter); Ministarstvo Rudarstva, Prirodnih Resursa i Prostornog Planiranja: Beograd, Serbia, 2013. (In Serbian) [Google Scholar]
  14. Ilić, M.M.; Stojković, S.; Rundić, L.; Ćalić, J.; Sandić, D. Application of the geodiversity index for the assessment of geodiversity in urban areas: An example of the Belgrade city area, Serbia. Geol. Croat. 2016, 693, 325–336. [Google Scholar] [CrossRef]
  15. Popović, Z. Odlike Gradske Klime Beograda [Characteristics of Urban Climate in Belgarde]; Ekološki Problemi Beograda, Savez Društva Inžinjera i Tehničara Beograda: Beograd, Serbia, 1990; Volume 2, pp. 307–317. (In Serbian) [Google Scholar]
  16. RHMSS, Republic Hydrometeorological Service of Serbia. Annual Report for Serbia, Year 2021. Available online: http://www.hidmet.gov.rs/podaci/meteorologija/latin/2021.pdf (accessed on 28 April 2022). (In Serbian)
  17. IAEA. Soil Sampling for Environmental Contaminants; IAEA-TECDOC-1415; IAEA: Vienna, Austria, 2004. [Google Scholar]
  18. Gulan, L.; Jakšić, T.; Milenković, B.; Stajić, J. Elemental concentrations and soil-to-moss transfer factors of radionuclides in the environment of North Kosovo and Metohija. Bull. Nat. Sci. Res. 2020, 10, 59–64. [Google Scholar] [CrossRef]
  19. United Nations. UNSCEAR 2008. Report to General Assembly, with Scientific annexes. Exposure of the Public and Workers from Various Sources of Radiation; United Nations: New York, NY, USA, 2010. [Google Scholar]
  20. ICRP. The Recommendations of the International Commissionon Radiological Protection; ICRP Publication: Pergamon, Turkey, 2007. [Google Scholar]
  21. Van Reeuwijk, L.P. Procedures for Soil Analysis, 6th ed.; ISRIC FAO Technical Paper; International Soil Reference and Information Centre: Wageningen, The Netherlands, 2002; Volume 9, pp. 12–16. [Google Scholar]
  22. USEPA. Supplemental Guidance for Developing Soil Screening Levels for Superfund Sites; U.S. Environmental Protection Agency: Washington, DC, USA, 2001.
  23. Chen, H.; Teng, Y.; Lu, S.; Wang, Y.; Wang, J. Contamination features and health risk of soil heavy metals in China. Sci. Total Environ. 2015, 512–513, 143–153. [Google Scholar] [CrossRef] [PubMed]
  24. Haribala; Hu, B.; Wang, C.; Gerilemandahu; Xu, X.; Zhang, S.; Bao, S.; Li, Y. Assessment of radioactive materials and heavy metals in the surface soil around uranium mining area of Tongliao, China. Ecotox. Environ. Saf. 2016, 130, 185–192. [Google Scholar] [CrossRef] [PubMed]
  25. Milenkovic, B.; Stajic, J.M.; Zeremski, T.; Strbac, S.; Stojic, N.; Nikezic, D. Is Kragujevac city still a “hot spot” area, twenty years after the bombing? Chemosphere 2020, 245, 125610. [Google Scholar] [CrossRef]
  26. Qing, X.; Zong, Y.; Lu, S. Assessment of heavy metal pollution and human health risk in urban soils of steel industrial city (Anshan), Liaoning, Northeast China. Ecotox. Environ. Saf. 2015, 120, 377–385. [Google Scholar] [CrossRef]
  27. Ambarwulan, W.; Nahib, I.; Widiatmaka, W.; Suryanta, J.; Munajati, L.S.; Suwarno, Y.; Turmudi, T.; Darmawan, M.; Sutrisno, D. Using Geographic Information Systems and the Analytical Hierarchy Process for Delineating Erosion-Induced Land Degradation in the Middle Citarum Sub-Watershed, Indonesia. Front. Environ. Sci. 2021, 9, 710570. [Google Scholar] [CrossRef]
  28. Valjarević, A.; Milanović, M.; Valjarević, D.; Basarin, B.; Gribb, W.; Lukić, T. Geographical information systems and remote sensing methods in the estimation of potential dew volume and its utilization in the United Arab Emirates. Arab. J. Geosci. 2021, 14, 1430. [Google Scholar] [CrossRef]
  29. Rehman, A.; Song, J.; Haq, F.; Mahmood, S.; Ahamad, M.I.; Basharat, M.; Sajid, M.; Mehmood, M.S. Multi-Hazard Susceptibility Assessment Using the Analytical Hierarchy Process and Frequency Ratio Techniques in the Northwest Himalayas, Pakistan. Remote Sens. 2022, 14, 554. [Google Scholar] [CrossRef]
  30. Stevanović, V.; Gulan, L.; Milenković, B.; Valjarević, A.; Zeremski, T.; Penjišević, I. Environmental risk assessment of radioactivity and heavy metals in soil of Toplica region, South Serbia. Environ. Geochem. Health 2018, 40, 2101–2118. [Google Scholar] [CrossRef]
  31. Durlević, U.; Novković, I.; Lukić, T.; Valjarević, A.; Samardžić, I.; Krstić, F.; Batoćanin, N.; Mijatov, M.; Ćurić, V. Multihazard susceptibility assessment: A case study—Municipality of Štrpce (Southern Serbia). Open Geosci. 2021, 13, 1414–1431. [Google Scholar] [CrossRef]
  32. Dashora, M.; Kumar, A.; Kumar, S.; Kumar, P.; Kumar, A.; Singh, K.C. Geochemical assessment of groundwater in a desertic region of India using chemometric analysis and entropy water quality index (EWQI). Nat. Hazards 2022, 112, 747–782. [Google Scholar] [CrossRef]
  33. Achilleos, A.G. The Inverse Distance Weighted interpolation method and error propagation mechanism—Creating a DEM from an analogue topographical map. J. Spat. Sci. 2011, 56, 283–304. [Google Scholar] [CrossRef]
  34. Belivermis, M.; Kilic, O.; Çotuk, Y.; Topcuoglu, S. The efects of physicochemical properties on gamma emitting natural radionuclide levels in the soil profle of Istanbul. Environ. Monit. Assess. 2010, 163, 15–26. [Google Scholar] [CrossRef]
  35. Ćujić, M.; Dragović, S.; Đorđević, M.; Dragović, R.; Gajić, B.; Miljanić, Š. Radionuclides in the soil around the largest coal-fired power plant in Serbia: Radiological hazard, relationship with soil characteristics and spatial distribution. Environ. Sci. Pollut. Res. 2015, 22, 10317–10330. [Google Scholar] [CrossRef]
  36. Dragović, S.; Gajić, B.; Dragović, R.; Janković-Mandić, L.J.; Slavković Beškoski, L.; Mihailović, N.; Momčilović, M.; Ćujić, M. Edaphic factors afecting the vertical distribution of radionuclides in the diferent soil types of Belgrade, Serbia. J. Environ. Monit. 2012, 14, 127–137. [Google Scholar] [CrossRef]
  37. Todorović, D.; Popović, D.; Ajtić, J.; Nikolić, J. Leaves of higher plants as biomonitors of radionuclides (137Cs, 40K, 210Pb and 7Be) in urban air. Environ. Sci. Pollut. Res. 2013, 20, 525–532. [Google Scholar] [CrossRef] [PubMed]
  38. Marschner, H. Mineral Nutrition of Higher Plants; Academic Press: London, UK, 1995. [Google Scholar]
  39. Karunakara, N.; Somahekarappa, H.M.; Narayana, Y.; Avadhani, D.N.; Mahesh, H.M.; Siddappa, K. 226Ra, 40K and 7Be activity concentrations in plants in the environment of Kaiga, India. J. Environ. Radioact. 2003, 65, 255–266. [Google Scholar] [CrossRef]
  40. Pöschl, M.; Brunclík, T.; Hanák, J. Seasonal and inter-annual variation of Beryllium-7 deposition in birch tree leaves and grass in the northeast upland area of the Czech Republic. J. Environ. Radioact. 2010, 101, 744–750. [Google Scholar] [CrossRef] [PubMed]
  41. VROM. Circular on Target Values and Intervention Values for Soil Remediation Annex A: Target Values, Soil Remediation Intervention Values and Indicative Levels for Serous Contamination; Dutch Ministry of Housing, Spatial Planning and Environment (VROM): The Hague, The Netherlands, 2000. [Google Scholar]
  42. Official Gazette of the Republic of Serbia 30/2018. Regulation on Limit Values of Polluting, Harmful and Dangerous Substances in Soil; Official Gazette: Belgrade, Serbia, 2018. (In Serbian) [Google Scholar]
  43. Gulan, L.; Stajić, J.; Milenković, B.; Zeremski, T.; Milić, S.; Krstić, D. Plant uptake and soil retention of radionuclides and metals in vineyard environments. Environ. Sci. Pollut. Res. 2021, 28, 49651–49662. [Google Scholar] [CrossRef]
  44. Gržetić, I.; Ghariani, R.H.A. Potential health risk assessment for soil heavy metal contamination in the central zone of Belgrade (Serbia). J. Serb. Chem. Soc. 2008, 73, 923–934. [Google Scholar] [CrossRef]
  45. Marjanović, M.; Vukčević, M.; Antonović, D.; Dimitrijević, S.; Jovanović, Đ.; Matavulj, M.; Ristić, M. Heavy metals concentration in soils from parks and green areas in Belgrade. J. Serb. Chem. Soc. 2009, 74, 697–706. [Google Scholar] [CrossRef]
  46. Valjarević, A.; Filipović, D.; Valjarević, D.; Milanović, M.; Milošević, S.; Živić, N.; Lukić, T. GIS and remote sensing techniques for the estimation of dew volume in the Republic of Serbia. Meteorol. Appl. 2020, 27, e1930. [Google Scholar] [CrossRef]
  47. Li, Z.Y.; Ma, Z.W.; van der Kuijp, T.J.; Yuan, Z.W.; Huang, L. A review of soil heavy metal pollution from mines in China: Pollution and health risk assessment. Sci. Total. Environ. 2014, 468–469, 843–853. [Google Scholar] [CrossRef] [PubMed]
  48. Wu, S.; Peng, S.; Zhang, X.; Wu, D.; Luo, W.; Zhang, T.; Zhou, S.; Yang, G.; Wan, H.; Wu, L. Levels and health risk assessments of heavy metals in urban soils in Dongguan, China. J. Geochem. Explor. 2015, 148, 71–78. [Google Scholar] [CrossRef]
Figure 1. Map of the studied area in Belgrade, Serbia.
Forests 13 01648 g001
Figure 2. The spatial distribution of (a) 226Ra, (b) 232Th, (c) 40K, and (d) 137Cs in soil.
Forests 13 01648 g002
Figure 3. The spatial distribution of (a)As, (b) Cd, (c) Co, (d) Cr, (e) Cu, (f) Na, (g) Ni, (h) Pb, and (i) Zn in soil.
Forests 13 01648 g003
Figure 4. The spatial distribution of (a) Ca, (b) K, (c) Mg, and (d) Mn in soil.
Forests 13 01648 g004
Figure 5. Total hazard indices (As + Cr + Cu + Ni + Pb + Zn + Cd) and total cancer risks (As + Cr + Ni + Pb) for children (a,b) and adults (c,d).
Forests 13 01648 g005
Table 1. Main chemical and physical characteristics of the soil (nd—not detected).
No.LocationpH in KClpH in H2OCaCO3 (%)Organic Matter (%)Coarse Sand
(200–2000 µm)
(%)
Fine Sand
(20–200 µm)
(%)
Silt
(20 µm)
(%)
Clay
(2 µm)
(%)
1.Topčider6.397.400.424.943.8235.3836.3224.48
2.Hajd park7.127.892.525.318.9938.8533.9218.24
3.Bajfordova6.807.371.385.8016.8636.3832.5614.20
4.Stepin lug5.536.330.253.773.6236.535.7624.12
5.Miljakovac4.706.02nd4.203.6441.3633.5621.44
6.Košutnjak5.216.290.175.644.4340.0534.7620.76
7.Avala 17.157.703.215.5951.1831.314.722.80
8.Avala 25.366.330.088.256.2237.1433.3623.28
9.Avala 36.657.510.346.095.2136.1936.0422.56
10.N.Beograd6.707.340.925.6715.2834.4830.7619.48
11.B. Potok6.717.510.593.6111.2234.2630.8423.68
12.BG na vodi7.428.0910.902.9518.9140.5726.613.92
13.Banjica7.388.183.352.5425.3533.0523.8417.76
14.Zvezdarska6.066.900.175.052.5343.1134.5219.84
15.Čukarica6.857.306.575.9255.6730.2510.723.36
16.Kalemegdan7.247.7914.266.0322.2946.0323.128.56
17.Taš7.297.8410.065.6936.6341.4915.766.12
18.Mirijevo6.457.190.255.3210.8440.0829.619.48
19.Stadion C.Z.7.217.804.616.4711.9843.4630.4814.08
20.Lipovica3.334.36nd6.047.2536.0331.0025.72
Table 2. Specific activities of 40K, 7Be, and 137Cs in leaves, annual effective dose, and excess lifetime cancer risk from natural radionuclides in soil. MDA—minimum detectable activity.
Leaves DE
(µSv y−1)
ELCR
×10−3
Sample40K7Be137Cs
No.LocationBq kg−1
1.Topčider80 ± 5105 ± 4<MDA680.26
2.Hajd park19 ± 3180 ± 10<MDA670.26
3.Bajfordova113 ± 5128 ± 8<MDA690.26
4.Stepin lug78 ± 6117 ± 6<MDA820.32
5.Miljakovac100 ± 7130 ± 81.6 ± 0.3790.31
6.Košutnjak60 ± 5169 ± 6<MDA720.28
7.Avala 1101 ± 7422 ± 121.1 ± 0.4390.15
8.Avala 238 ± 5350 ± 8<MDA770.30
9.Avala 354 ± 4282 ± 7<MDA810.31
10.N.Beograd33 ± 4291 ± 8<MDA690.27
11.B. Potok38 ± 5587 ± 123.4 ± 0.3740.28
12.BG na vodi113 ± 5292 ± 6<MDA600.23
13.Banjica107 ± 5395 ± 9<MDA710.27
14.Zvezdarska73 ± 6356 ± 9<MDA760.29
15.Čukarica32 ± 4272 ± 7<MDA340.13
16.Kalemegdan95 ± 6226 ± 7<MDA530.20
17.Taš77 ± 5417 ± 8<MDA520.20
18.Mirijevo22 ± 4391 ± 9<MDA740.28
19.Stadion C.Z.71 ± 6473 ± 8<MDA740.28
20.Lipovica54 ± 4399 ± 93.3 ± 0.4850.33
Table 3. Content of As, Cd, Cr, Co, Cu, Na, Ni, Pb, Zn, Ca, K, Mg, and Mn (mg/kg) in soil and the measurement uncertanties of the method. The results exceeding corrected target values are written in bold.
No.SampleAsCdCoCrCuNaNiPbZnCaKMgMn
mg/kg
1.Topčider9.120.1211.863.952.428566.741.2124753272155638547
2.Hajd park8.420.0710.842.929.244442.731.782.215,21054995970589
3.Bajfordova 8.720.1510.142.047.832042.449.119012,90049414933554
4.Stepin lug7.920.0412.743.629.623937.829.592.0505559875299671
5.Miljakovac9.200.0512.840.326.019432.128.478.0430248815231712
6.Košutnjak12.00.0613.168.528.323455.633.884.9554655905553536
7.Avala 1759 *5.42 *10.727.443.220118.34297 *48918,810233743531020
8.Avala 29.730.0912.446.230.326039.534.6103523058745470867
9.Avala 311.80.1313.845.024.926837.850.376.1695360944554963
10.N. Beograd9.050.0611.148.128.933539.543.889.6964765475337558
11.B. Potok6.860.0612.356.324.725256.423.391.5669654126679590
12.BG na vodi6.700.068.6036.327.452134.421.770.334,27049968189407
13.Banjica4.870.0510.645.223.737941.120.965.720,23051616722502
14.Zvezdarska8.410.1011.642.828.424838.227.879.8670055956163625
15.Čukarica 4.350.076.6233.527.541031.020.911525,93029686911298
16.Kalemegdan9.820.207.8739.168.0101648.314116661,46054438303429
17.Taš6.220.187.2649.2336 *63441.161.222838,94035846751374
18.Mirjevo6.370.0810.846.740.522544.723.595.7753654025233512
19.Stadion C.Z.9.390.0611.342.135.941442.734.710419,48062226796562
20.Lipovica10.60.0611.943.527.118333.329.978.5269246964509476
Percentage uncertainty (%)12.1 8.510.01.72.425.22.816.84.932.55.27.510.6
* exceeding remediation levels.
Table 4. Content of As, Cd, Cr, Co, Cu, Na, Ni, Pb, Zn, Ca, K, Mg, and Mn (mg/kg) in leaves.
Sample AsCdCoCrCuNaNiPbZnCaKMgMn
mg/kg
Topčiderndnd0.3012.5011.60116.17.082.3124.2917,81050362368104.6
Hajd parkndndnd4.379.35142.83.54nd22.8122,38013172614516.7
Bajfordova ndnd1.1737.1513.73180.010.966.9441.4615,59044452548390.4
Stepin lug0.69ndnd13.0412.59103.96.491.1526.8216,20047972568304.5
Miljakovacndndnd6.459.62126.93.950.6922.4513,67051721843910.1
Košutnjakndndnd16.9711.94116.96.451.2623.2950,35038272472351.9
Avala 1nd0.170.343.9811.14112.82.7530.9351.0234,70049953231652.9
Avala 2ndndnd1.9910.4771.83.661.2043.1413,26024631384772.5
Avala 3ndndnd2.679.9376.54.550.7024.3818,09031642472587.4
N. Beogradndndnd2.3311.1892.61.560.6410.2120,5601392163835.7
B. Potokndndnd3.7011.15113.86.851.7033.8621,27023472791425.8
BG na vodindndnd4.7412.62362.12.03nd40.4826,6206670199388.9
Banjicandndnd3.6511.13130.61.850.4721.2131,0605865362353.1
Zvezdarskandndnd3.8710.2387.72.111.0419.1226,88045533328360.9
Čukarica ndndnd4.679.75167.92.391.1921.0617,6102434166543.7
Kalemegdanndndnd2.738.5284.42.050.5310.6117,7704747159131.5
Tašndndnd7.9655.46192.32.118.3823.5232,36052173841127.0
Mirjevondndnd3.4616.8392.11.860.6116.4720,5902022210156.8
Stadion C.Z.ndndnd5.3114.19152.51.980.9520.5525,8704795382959.9
Lipovicandndnd6.7518.1079.56.601.0128.5514,620258323091186.0
Table 5. Spearman correlation matrix of heavy metals and radionuclides in soil.
AsCdCoCrCuMnNiPbZn226Ra232Th40K137Cs
As10.2490.512 *−0.0510.1130.483 *−0.0440.638 **0.0780.3210.280−0.0180.477 *
Cd 1−0.370−0.1490.647 **0.0140.0970.679 **0.637 **−0.414−0.438−0.339−0.047
Co 10.429−0.3930.657 **0.039−0.013−0.4100.726 **0.817 **0.666 **0.364
Cr 1−0.021−0.0150.624 **0.009−0.0770.2800.3040.392−0.158
Cu 1−0.1160.3290.656 **0.845 **−0.378−0.409−0.1890.186
Mn 1−0.1910.242−0.0780.3970.480 *0.484 *0.383
Ni 10.1230.2300.058−0.1050.170−0.251
Pb 10.583 **−0.071−0.174−0.2360.329
Zn 1−0.384−0.526 *−0.3260.063
226Ra 10.807 **0.462 *0.483 *
232Th 10.707 **0.394
40K 10.116
137Cs 1
* correlation is significant at the 0.05 level; ** correlation is significant at the 0.01 level.
Table 6. Total carcinogenic risk (TCR) from As, Cr, Ni, and Pb in adults and children.
MetalsAsCrNiPb
ChildAdultChildAdultChildAdultChildAdult
Minimum7.61 × 10−64.14 × 10−61.51 × 10−58.16 × 10−64.72 × 10−101.33 × 10−91.95 × 10−71.04 × 10⁻⁷
Maximum1.33 × 10−37.22 × 10−43.76 × 10−52.04 × 10−51.72 × 10−94.84 × 10−94.00 × 10−52.14 × 10⁻⁵
Average8.03 × 10−54.37 × 10−52.48 × 10−51.34 × 10−51.06 × 10−92.99 × 10−92.35 × 10−61.26 × 10⁻⁶
Publisher’s Note: MDPI stays neutral with regard to jurisdictional claims in published maps and institutional affiliations.

