
Woodfuel Consumption in Refugee Hosting Areas and Its Impact on the Surrounding Forests—The Case of Uganda

 ,
,
Abstract
:1. Introduction
2. Methodology
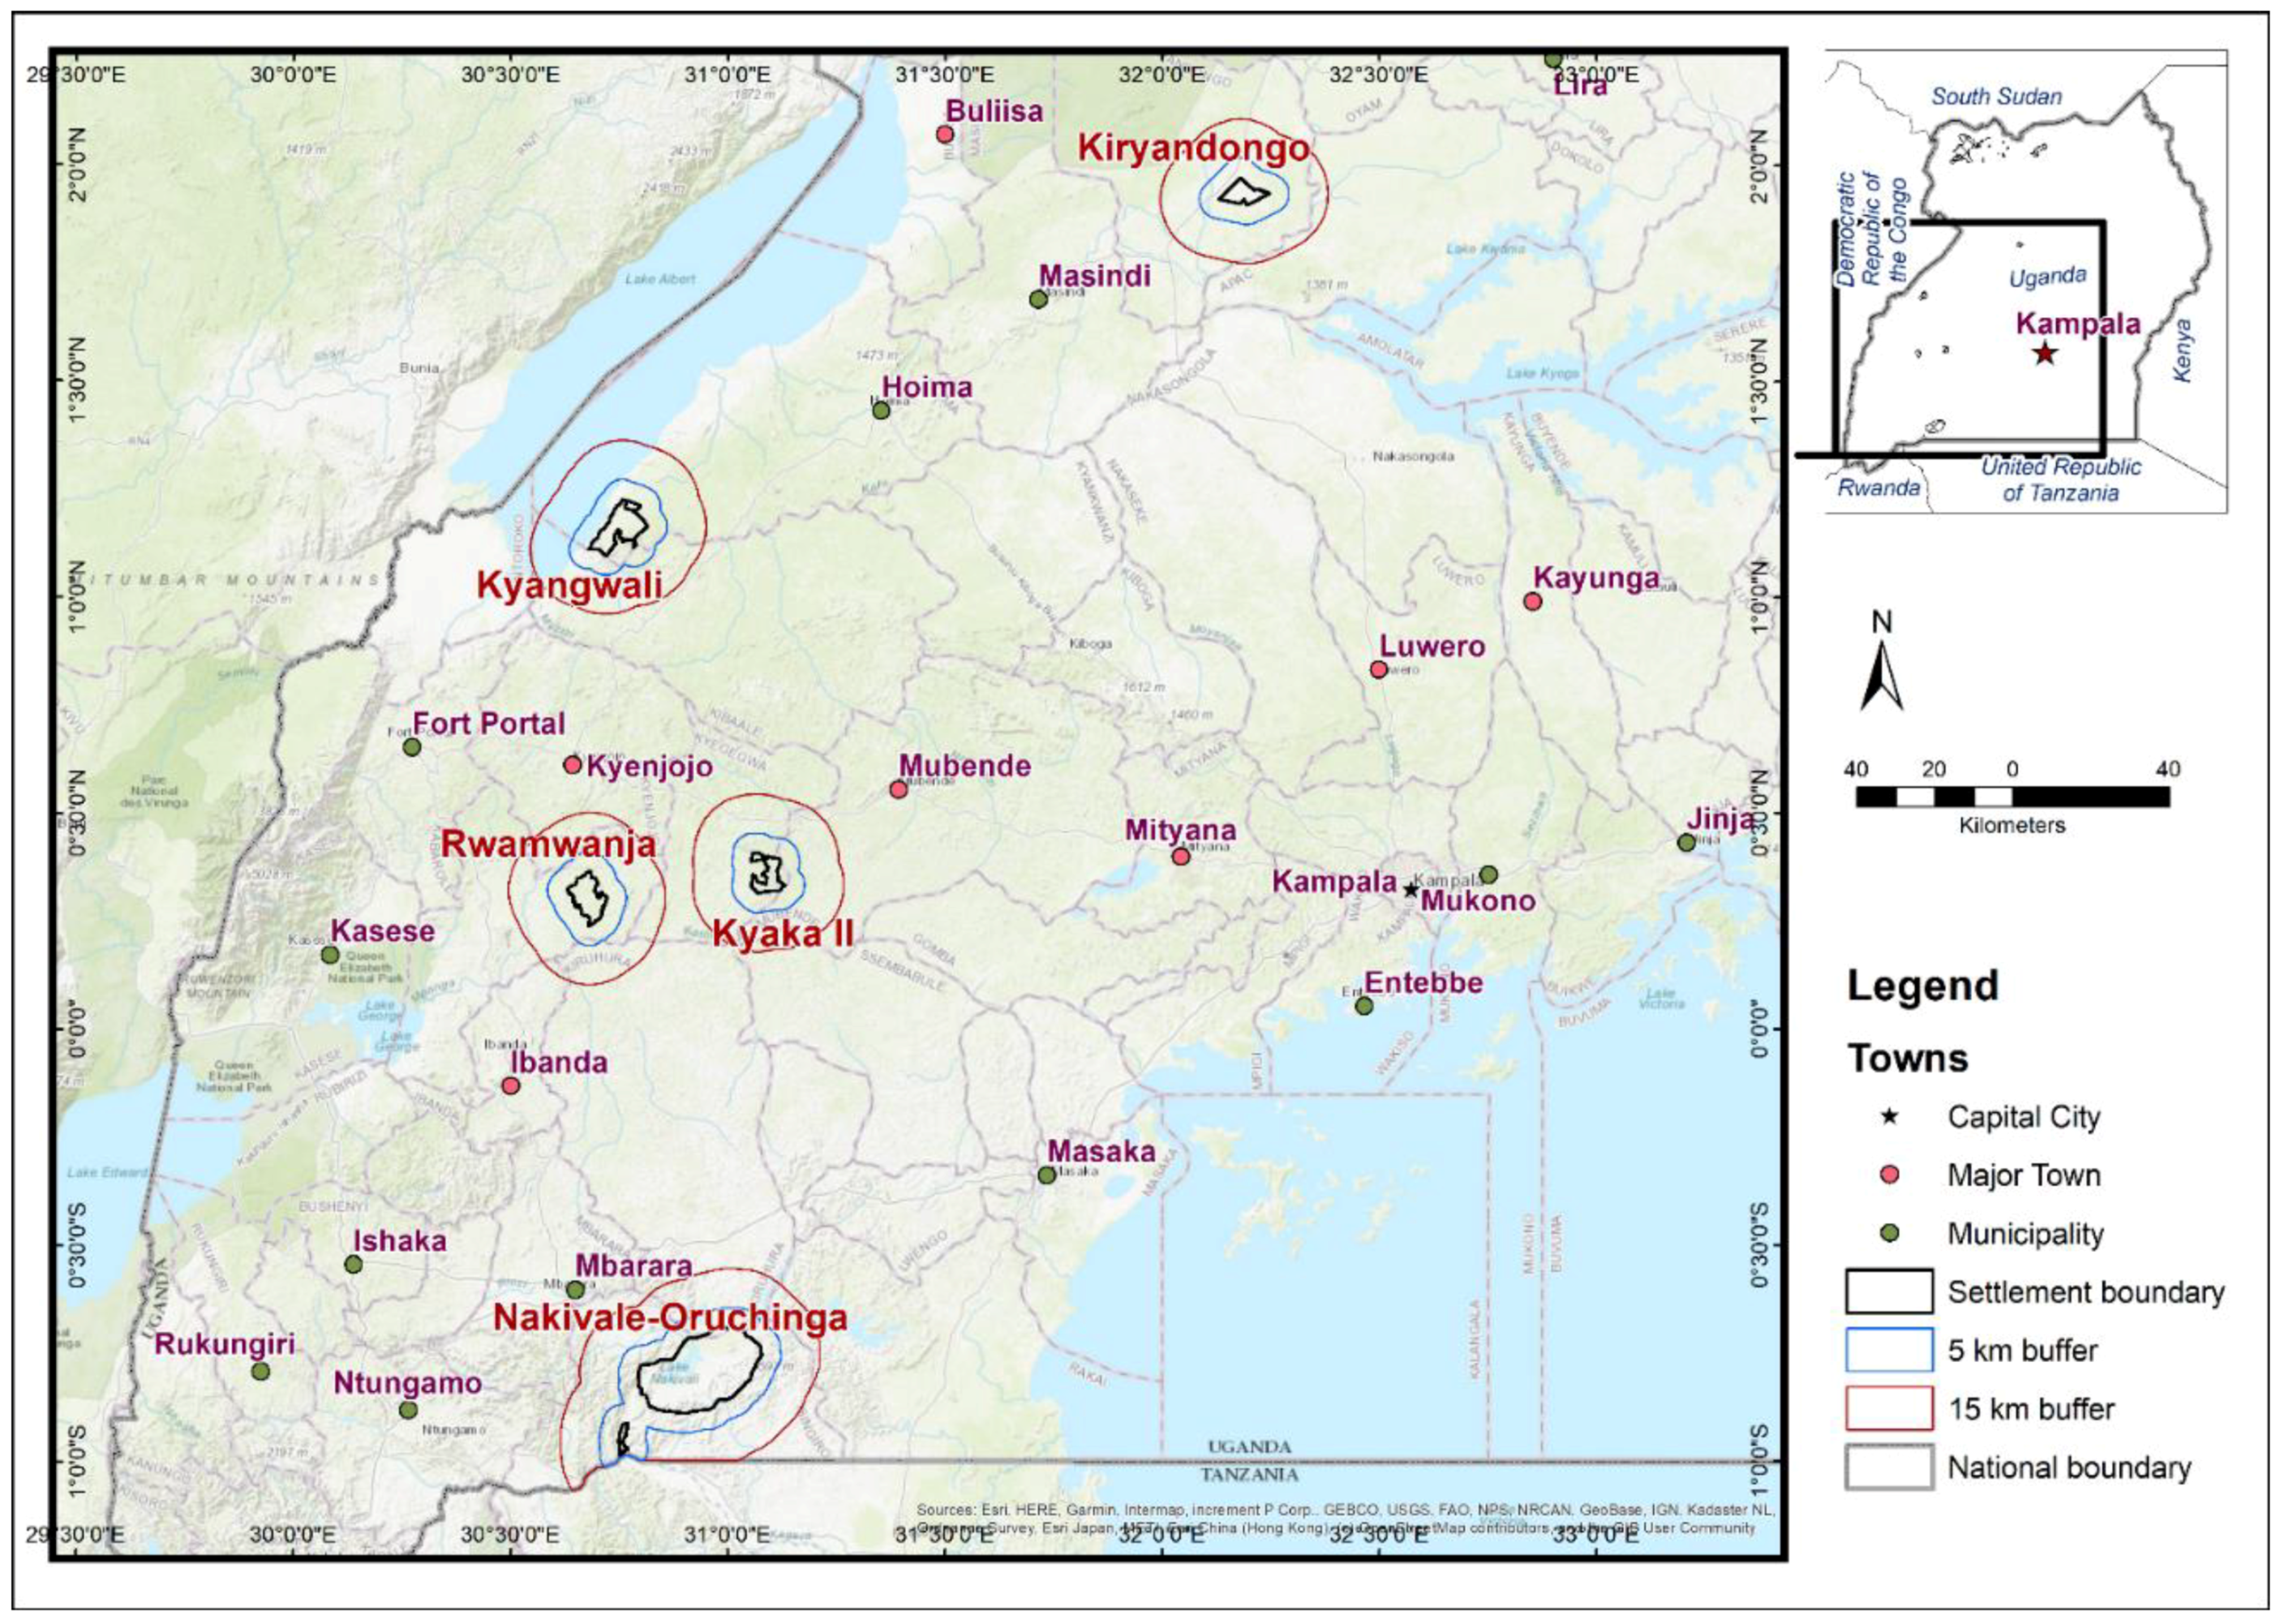
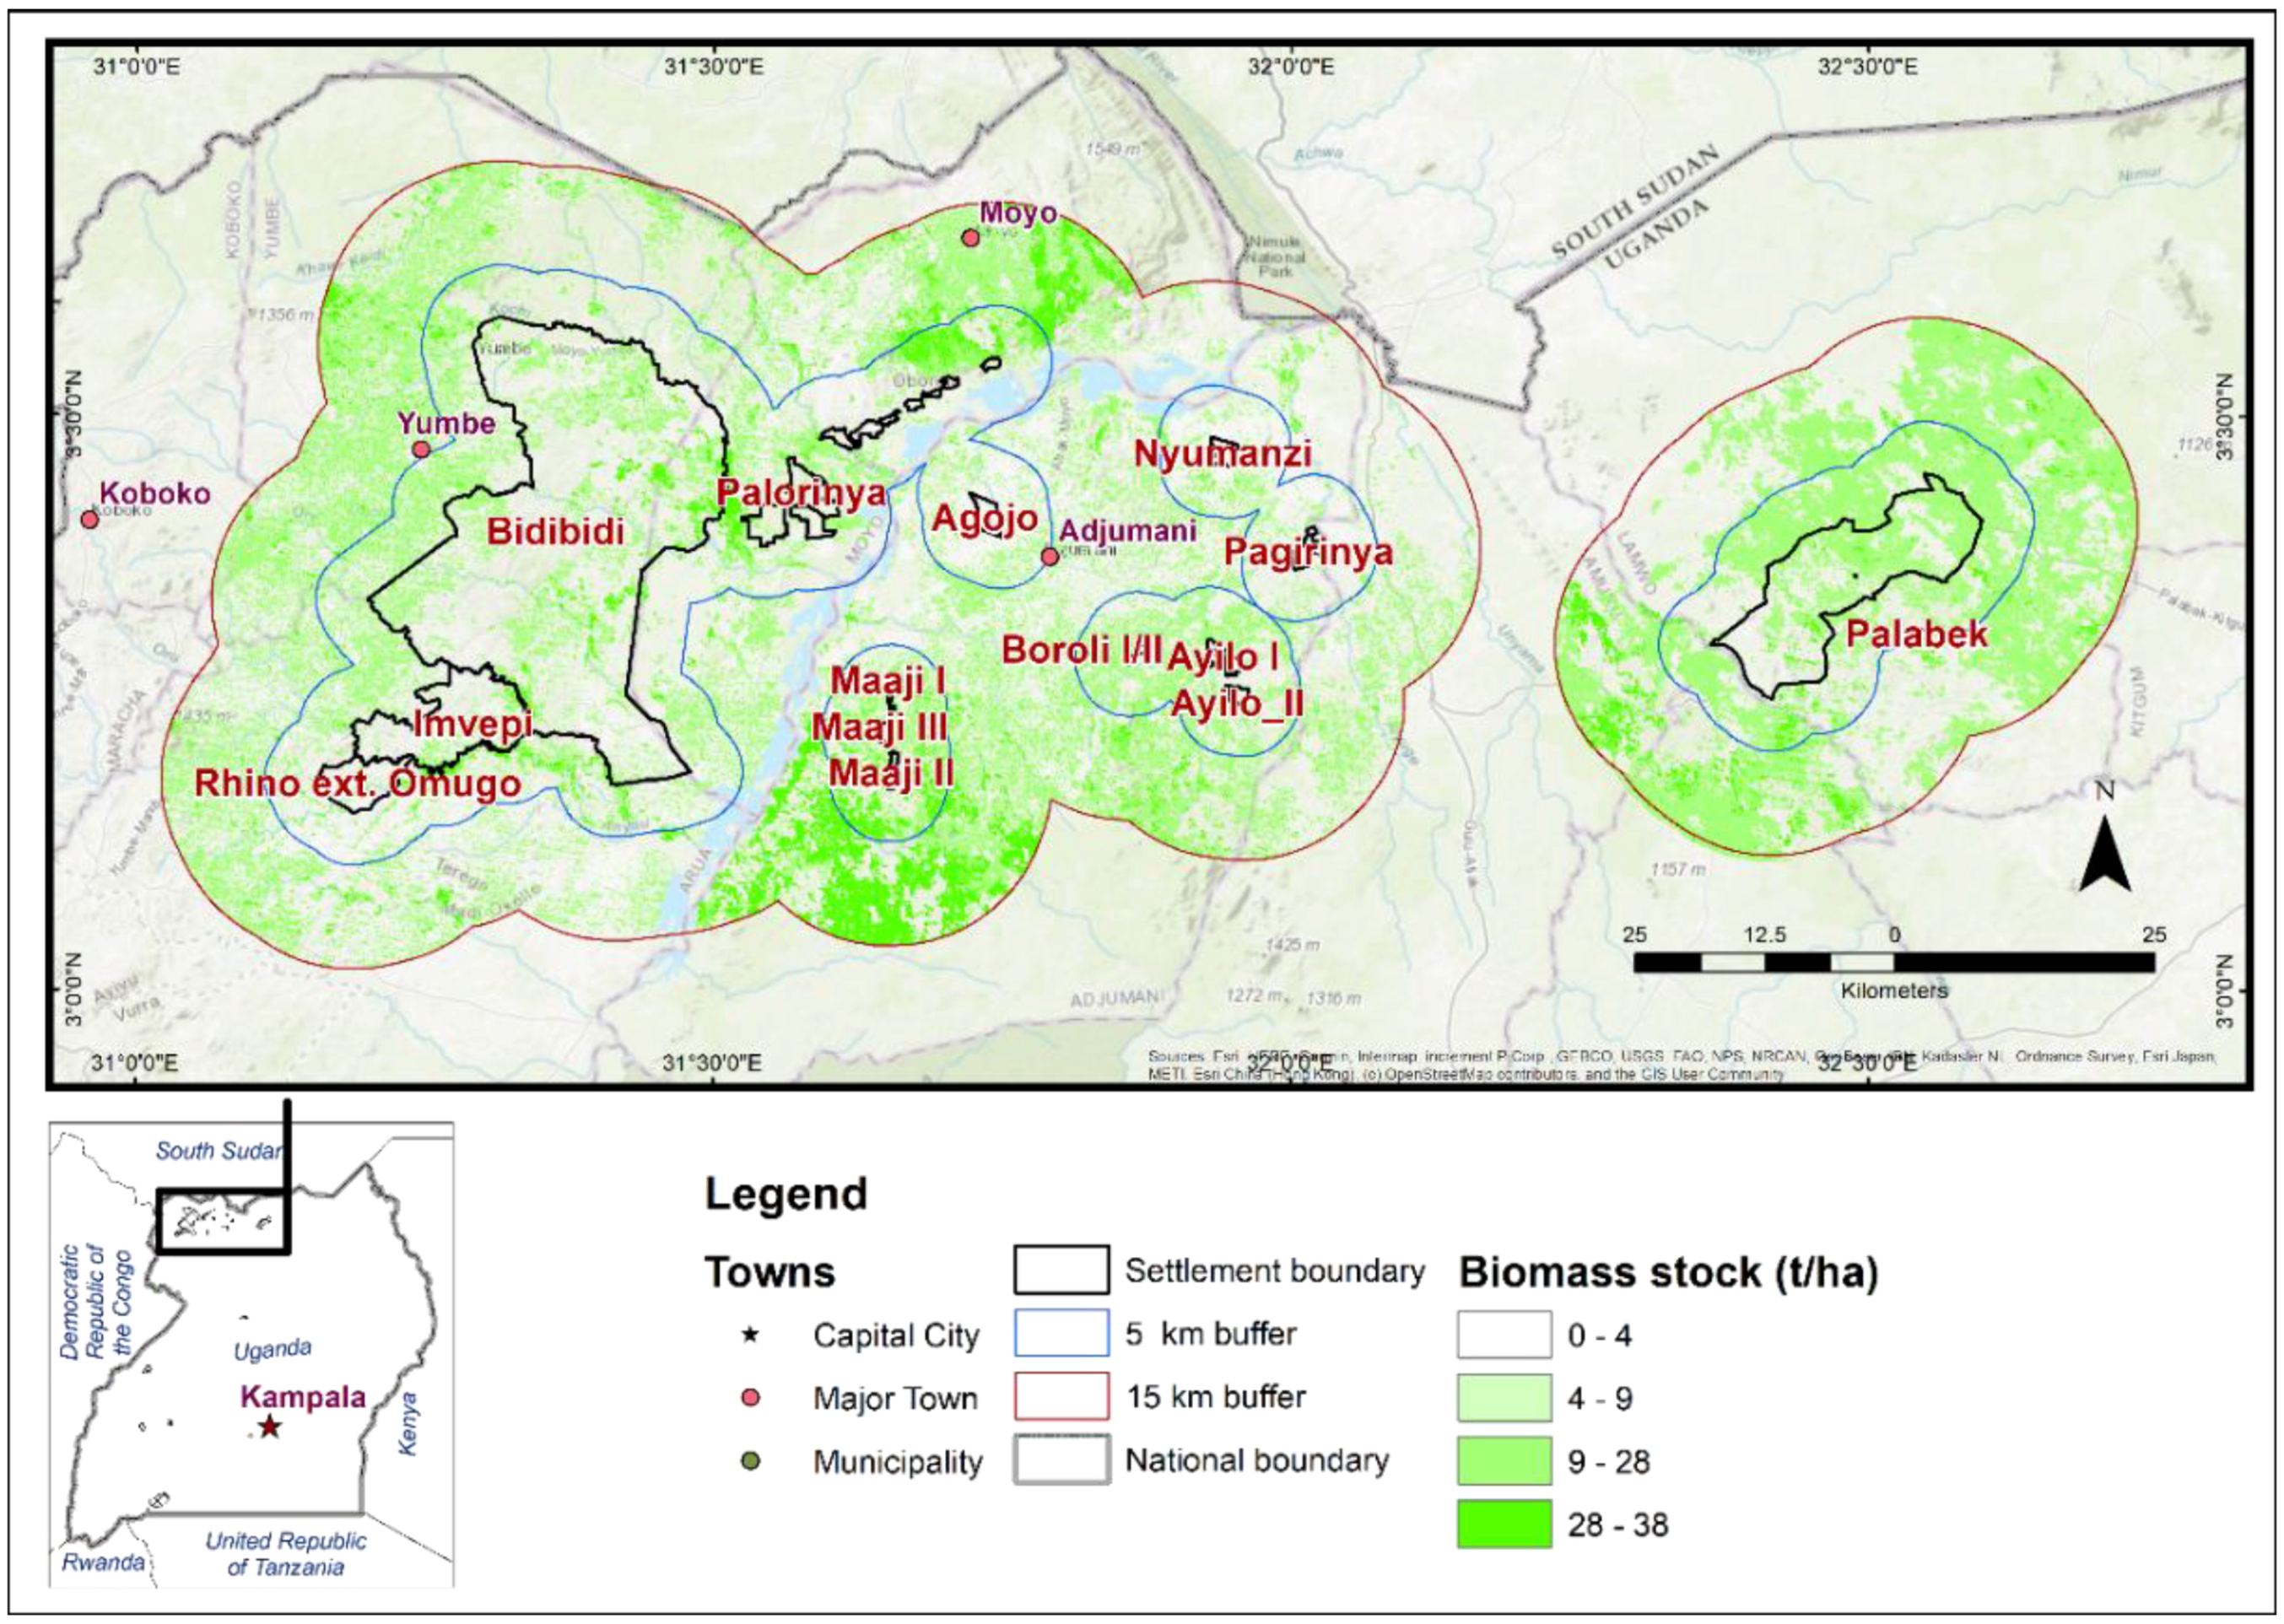
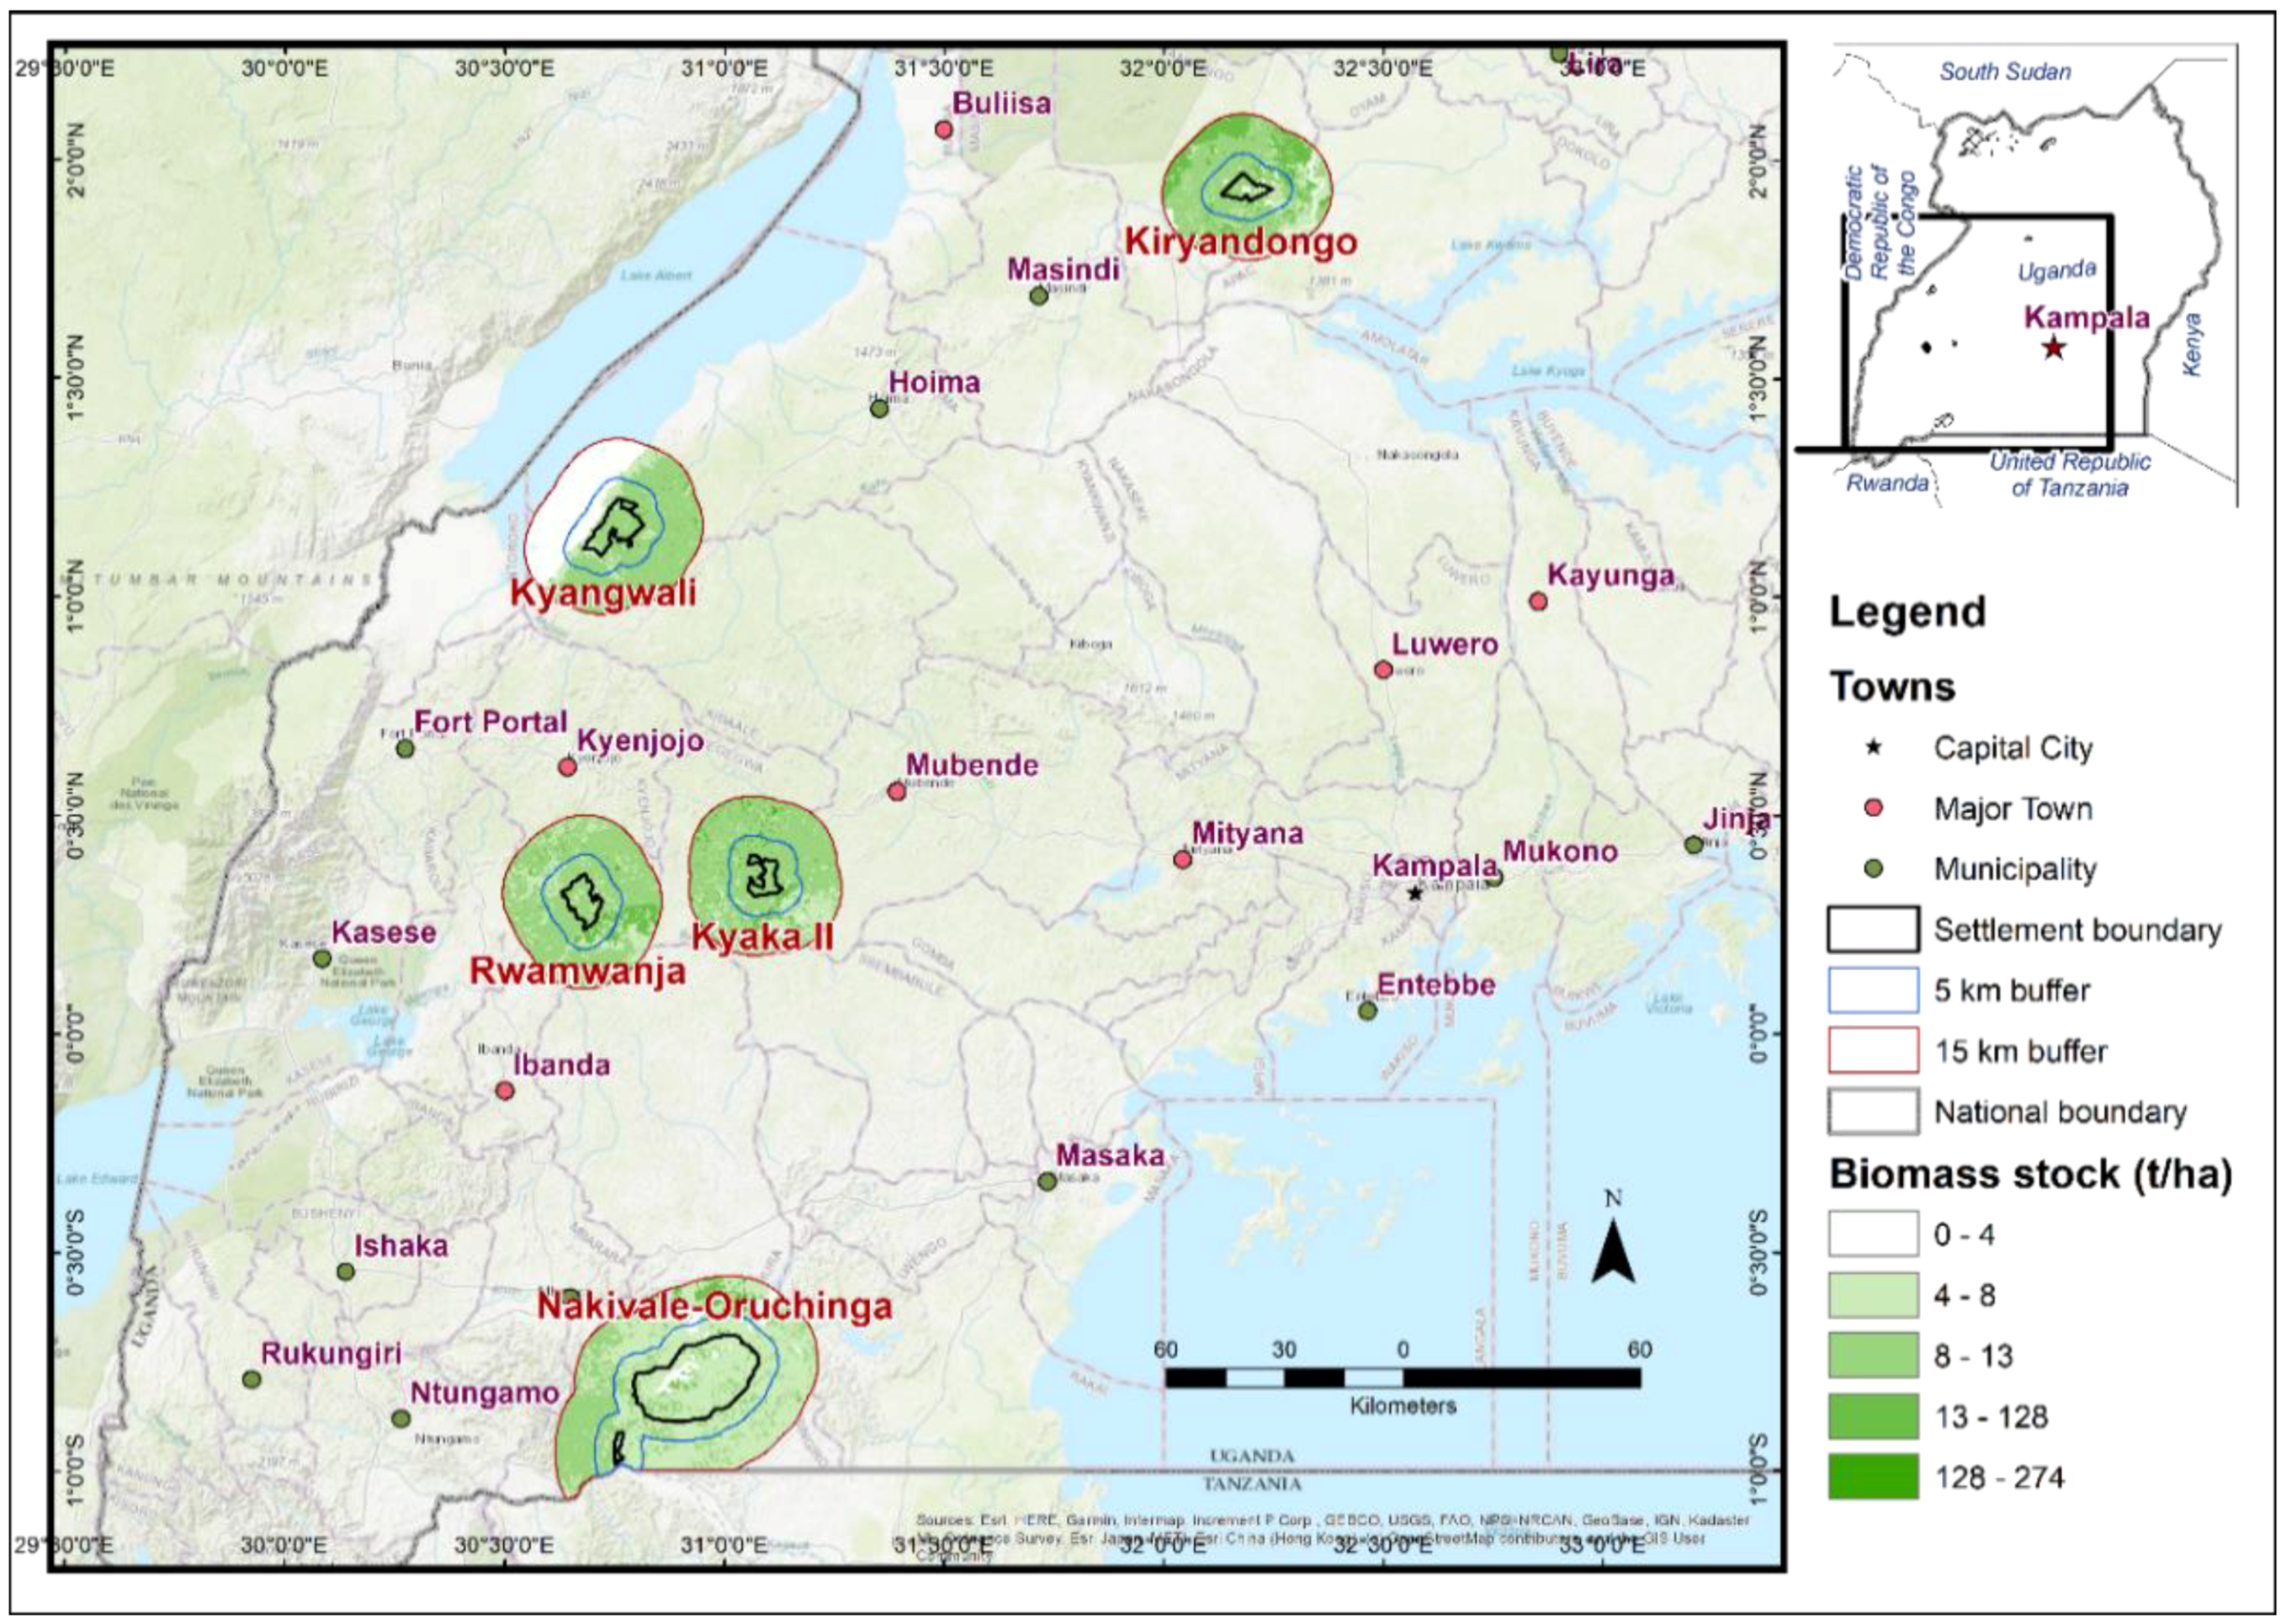
2.1. Study Sites
2.2. Woodfuel Data Collection and Analysis
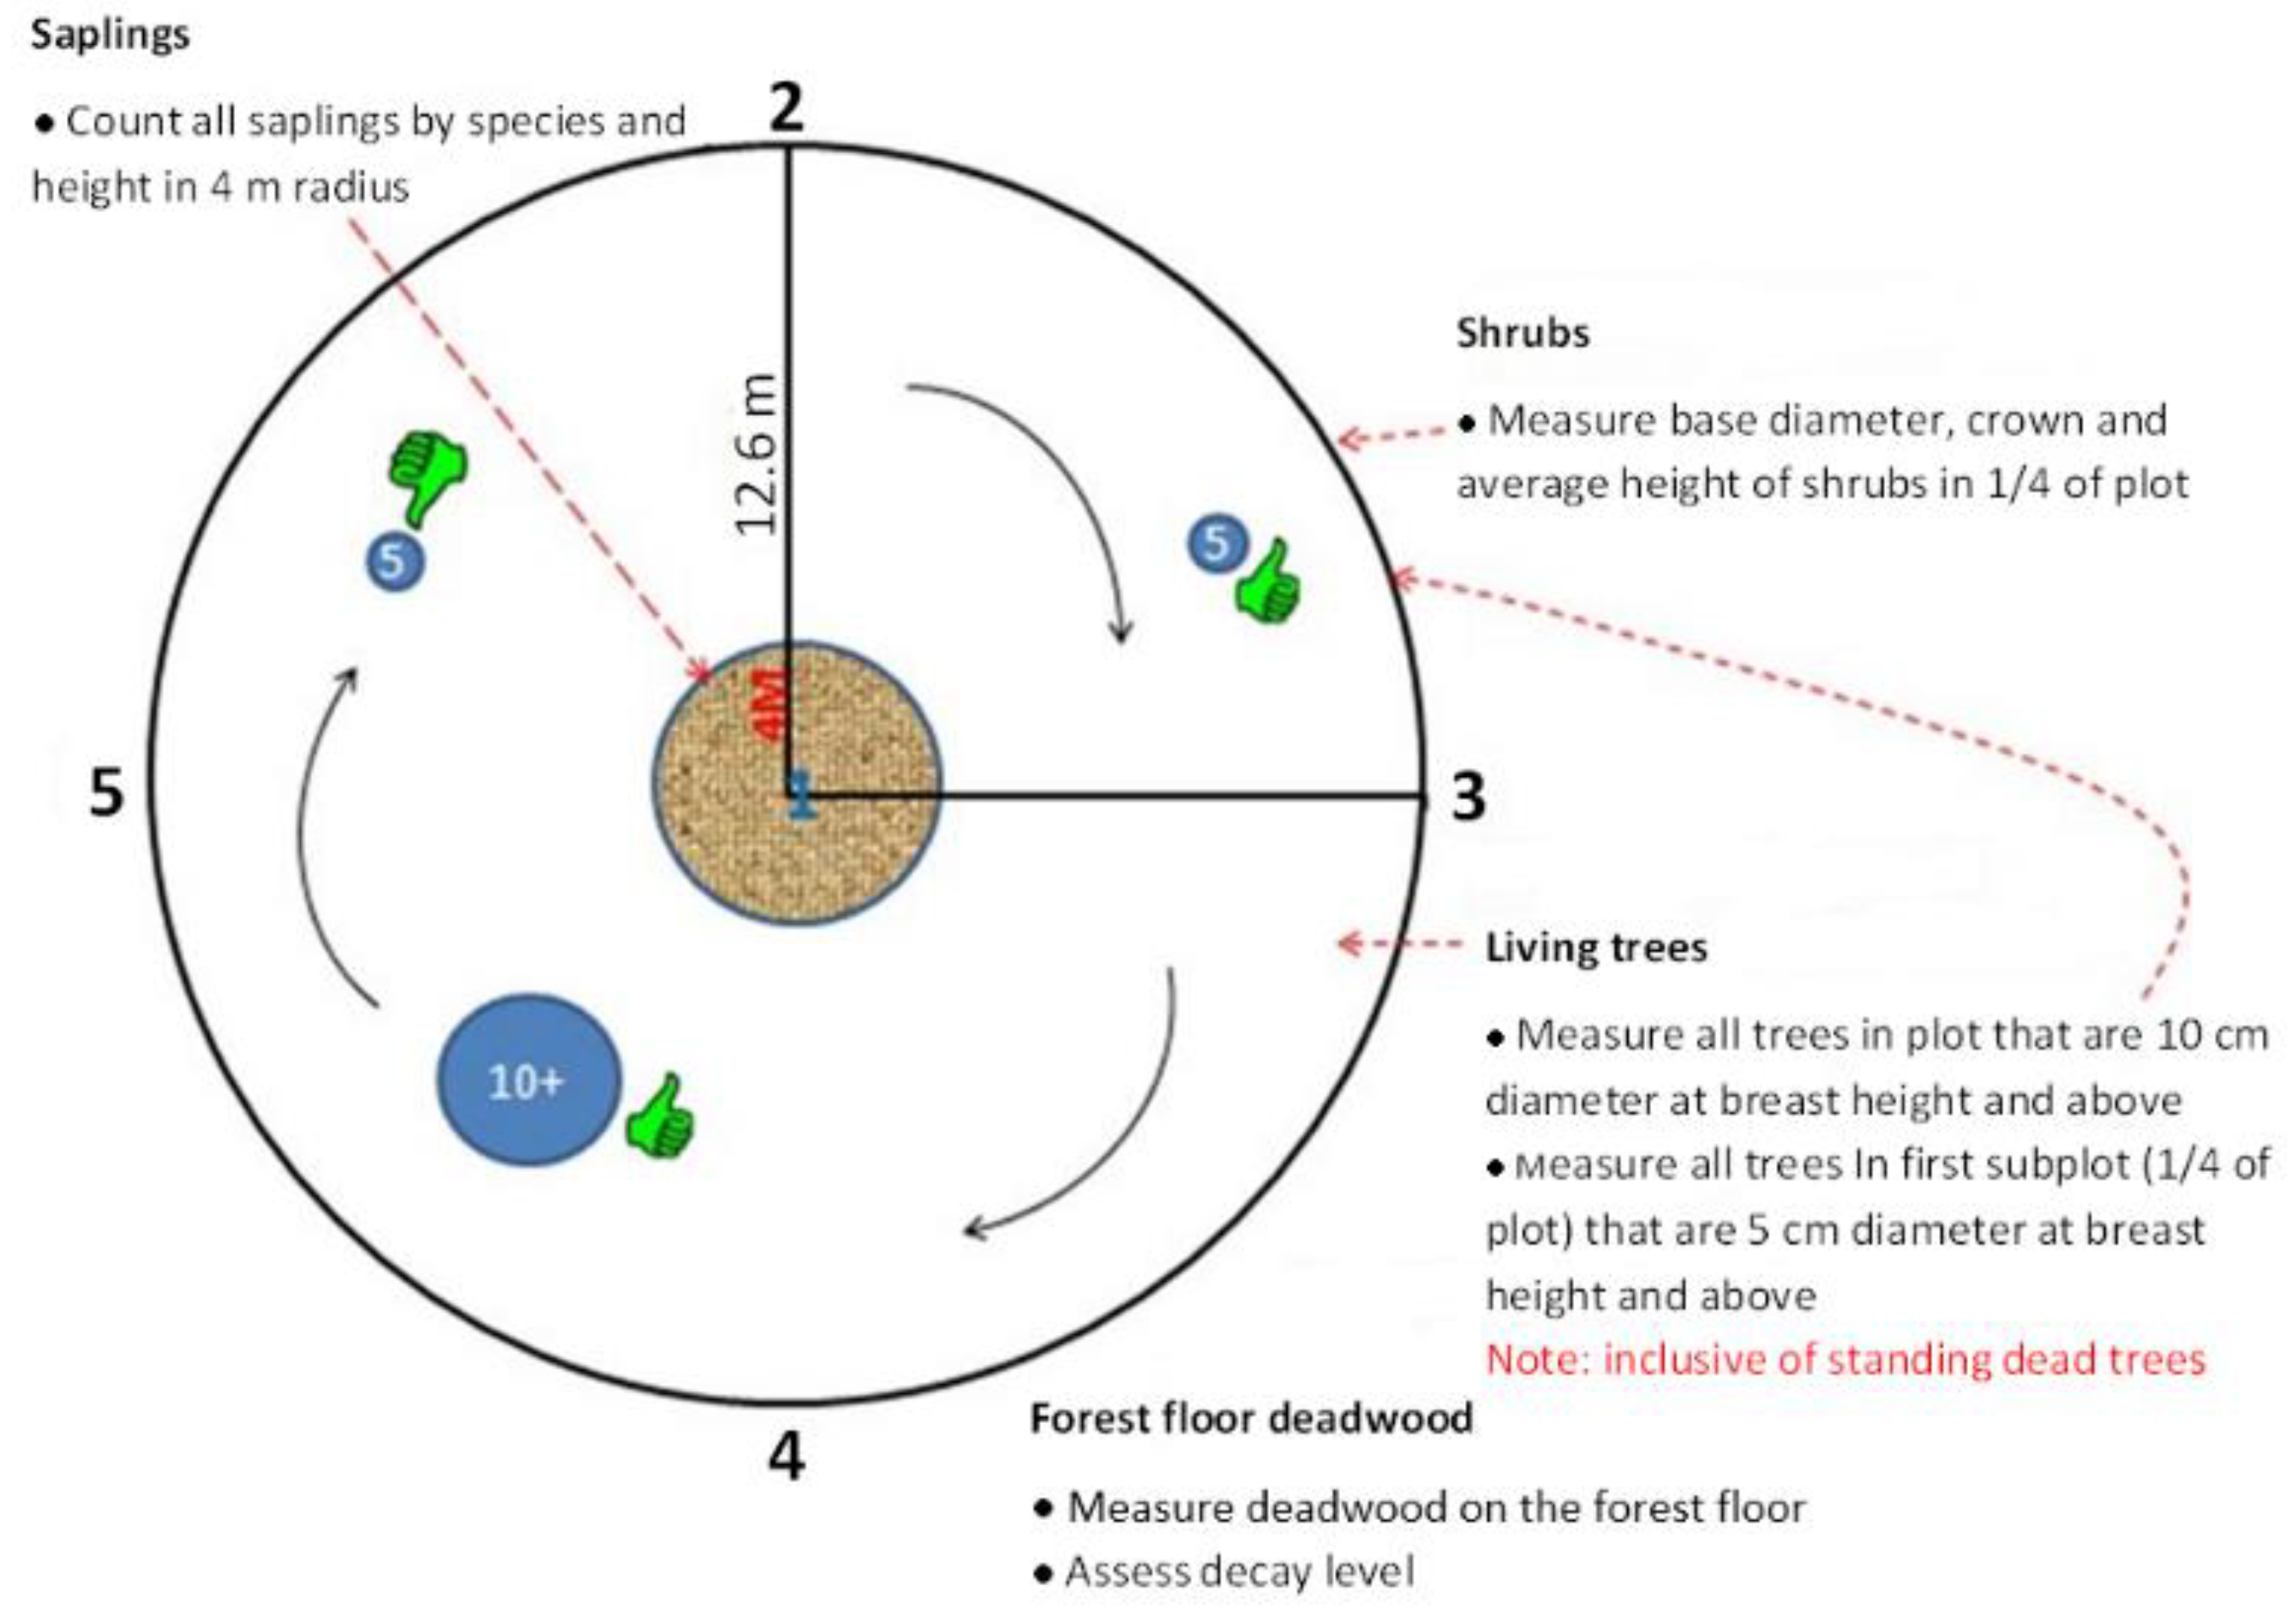
2.3. Biophysical Field Inventory and Analysis
2.4. Biomass Stock Changes
- For the changes between 2010 and 2013:
- ○
- Beginning of historical period: 1 January 2005
- ○
- Beginning of monitoring period: 1 January 2010
- ○
- End of monitoring period: 31 December 2013
- For the changes between 2014 and 2018:
- ○
- Beginning of historical period: 1 January 2010
- ○
- Beginning of monitoring period: 1 January 2014
- ○
- End of monitoring period: 16 April 2018
3. Results
3.1. Assessing Woodfuel Consumption
3.2. Total Refugee Woodfuel Consumption
3.3. Assessing the Supply of Woodfuel
3.4. Biomass Stock Changes
3.5. Linking Woodfuel Demand and Supply
4. Discussion
- Development of agroforestry systems on household plots and farmland, where trees and woody perennials are interplanted along boundaries and/or with crops for energy, food, and fodder. This intervention should target the residential plots assigned to refugees and the cultivated fields of both host and refugee communities surrounding refugee settlements.
- Establishment of woodlots for energy and other purposes, such as building material. This intervention should target areas owned by host communities and individuals, degraded areas managed by the NFA, and areas assigned for refugee settlements.
- Rehabilitation of degraded forests using both natural and assisted regeneration. This intervention should target areas owned by host communities and individuals, degraded areas managed by the NFA, and areas assigned for refugee settlements.
- Enhancement of energy efficiency to reduce the demand for woodfuel through more efficient cooking practices and charcoal production techniques. This intervention should target both host and refugee populations.
5. Conclusions
Author Contributions
Funding
Institutional Review Board Statement
Informed Consent Statement
Data Availability Statement
Acknowledgments
Conflicts of Interest
References
- OPM/UNHCR. Uganda–Refugee Statistics. May 2022. Available online: https://data.unhcr.org/en/documents/download/93683 (accessed on 15 July 2022).
- UNHCR. Global Trends: Forced Displacement in 2021; UNHCR: Geneva, Switzerland, 2022; Available online: https://www.unhcr.org/62a9d1494/global-trends-report-2021 (accessed on 15 July 2022).
- UNHCR. Global Trends: Forced Displacement in 2016; UNHCR: Geneva, Switzerland, 2017; Available online: https://www.unhcr.org/5943e8a34.pdf (accessed on 15 July 2022).
- UNHCR. The Democratic Republic of the Congo: 2018 Regional Refugee Response Plan–End of Year Report; UNHCR: Geneva, Switzerland, 2019; Available online: https://data.unhcr.org/en/documents/download/69260 (accessed on 15 July 2022).
- Barasa, B.; Turyabanawe, L.; Akello, G.; Gudoyi, P.M.; Nabatta, C.; Mulabbi, A. The Energy Potential of Harvested Wood Fuel by Refugeed in Northern Uganda. Sci. World J. 2022, 2022, 1569960. [Google Scholar] [CrossRef] [PubMed]
- van Blerk, L.; Cutler, M.; Hewitson, L.; Hunter, J.; Bamutaze, Y.; Kintu, I.M.; Bukenya, B.; Nakaiza, J.K. Displaced Communities, Environmental Change and Sustainable Livelihoods in Uganda; University of Dundee: Dundee, UK, 2021. [Google Scholar] [CrossRef]
- FAO. Global Forest Resources Assessment 2020: Main Report; FAO: Rome, Italy, 2020. [Google Scholar] [CrossRef]
- van Hove, E.; Johnson, N.G. Refugee settlements in transition: Energy access and development challenges in Northern Uganda. Energy Res. Soc. Sci. 2021, 78, 102103. [Google Scholar] [CrossRef]
- FAO. Global Forest Resources Assessment 2000; FAO: Rome, Italy, 2001. [Google Scholar]
- FAO. Manual on Deforestation, Degradation, and Fragmentation Using Remote Sensing and GIS; FAO: Rome, Italy, 2007; Available online: https://www.fao.org/3/ap163e/ap163e.pdf (accessed on 4 July 2022).
- Bamwesigye, D.; Kupec, P.; Chekuimo, G.; Pavlis, J.; Asamoah, O.; Darkwah, S.A.; Hlaváčková, P. Charcoal and Wood Biomass Utilization in Uganda: The Socioeconomic and Environmental Dynamics and Implications. Sustainability 2020, 12, 8337. [Google Scholar] [CrossRef]
- FAO; UNHCR (United Nations High Commissioner for Refugees). Assessing Woodfuel Supply and Demand in Displacement Settings; FAO: Rome, Italy; UNHCR: Geneva, Switzerland, 2016; Available online: http://www.fao.org/3/a-i5762e.pdf (accessed on 4 July 2022).
- FAO. Wood Fuel Surveys: Forestry for Local Community Development Programme; FAO: Rome, Italy, 1983; Available online: http://www.fao.org/docrep/Q1085e/Q1085e00.htm (accessed on 15 July 2022).
- Masera, O.; Ghilardi, A.; Drigo, R.; Trossero, M.A. WISDOM: A GIS-based supply demand mapping tool for woodfuel management. Biomass Bioenergy 2006, 30, 618–637. [Google Scholar] [CrossRef]
- Forest Department. National Biomass Study; Technical Report; Ministry of Water Lands and Environment: Kampala, Uganda, 2002.
- Chave, J.; Rejou-Mechain, M.; Burquez, A.; Chidumayo, E.; Colgan, M.S.; Delitti, W.B.C.; Duque, A.; Eid, T.; Fearnside, P.M.; Goodman, R.C.; et al. Improved allometric models to estimate the aboveground biomass of tropical trees. Glob. Change Biol. 2014, 20, 3177–3190. [Google Scholar] [CrossRef]
- FAO; UNHCR. Rapid Woodfuel Assessment: 2017 Baseline for the Bidibidi Settlement, Uganda; FAO: Rome, Italy; UNHCR: Geneva, Switzerland, 2017; Available online: http://www.fao.org/3/a-i7849e.pdf (accessed on 15 July 2022).
- BFAST (Breaks for Additive Seasonal and Trend). Spatial R Package. 2010. Available online: http://www.loicdutrieux.net/bfastSpatial/ (accessed on 4 July 2022).
- DeVries, B.; Pratihast, A.K.; Verbesselt, J.; Kooistra, L.; Herold, M. Characterizing Forest Change Using Community-Based Monitoring Data and Landsat Time Series. PLoS ONE 2016, 11, e0147121. Available online: http://www.ncbi.nlm.nih.gov/pmc/articles/PMC4809496/pdf/pone.0147121.pdf (accessed on 4 July 2022). [CrossRef] [PubMed]
- Dutrieux, P.L.; Verbesselt, J.; Kooistra, L.; Herold, M. Monitoring Forest Cover Loss Using Multiple Data Streams, a Case Study of a Tropical Dry Forest in Bolivia. ISPRS J. Photogram. Remote Sens. 2015, 107, 112–125. [Google Scholar] [CrossRef]
- Verbesselt, J.; Hyndman, R.; Newnham, G.; Culvenor, D. Detecting Trends and Seasonal Changes in Satellite Image Time Series. Remote Sens. Environ. 2010, 114, 106–115. [Google Scholar] [CrossRef]
- Hansen, M.C.; Potapov, P.V.; Moore, R.; Hancher, M.; Turubanova, S.A.; Tyukavina, A.; Thau, D.; Stehman, S.V.; Goetz, S.J.; Loveland, T.R.; et al. High-Resolution Global Maps of 21st-Century Forest Cover Change. Science 2013, 342, 850–853. [Google Scholar] [CrossRef] [Green Version]
- WorldPop (School of Geography and Environmental Science, University of Southampton; Department of Geography and Geosciences, University of Louisville; Departement de Geographie, Universite de Namur) and Center for International Earth Science Information Network (CIESIN), Columbia University. Global High Resolution Population Denominators Projec—Funded by The Bill and Melinda Gates Foundation. 2018. Available online: www.worldpop.org (accessed on 15 July 2022).
- UBOS (Uganda Bureau of Statistics). UBOS 2015–2030 Population Projections by Subcounty and Sex; Uganda Bureau of Statistics: Kampala, Uganda, 2015.
- Uganda Towns. 2016. Available online: http://www.energy-gis.ug/gis-data (accessed on 15 July 2022).
- Uganda National Household Survey 2016/17. September 2017. Available online: https://africaopendata.org/dataset/uganda-national-household-survey-2016-2017 (accessed on 15 July 2022).
- UBOS. Uganda National Household Survey 2016/2017; UBOS: Kampala, Uganda, 2018; Available online: https://www.ubos.org/wp-content/uploads/publications/03_20182016_UNHS_FINAL_REPORT.pdf (accessed on 15 July 2022).
- Uganda Districts Boundaries. July 2018. Available online: http://ubos.geo-solutions.it/layers/geonode:uganda_districts_2018#more (accessed on 15 July 2022).
- World Bank; FAO. Rapid Assessment of Natural Resource Degradation in Refugee Impacted Areas in Northern Uganda; World Bank: Washington, DC, USA; FAO: Rome, Italy, 2020; Available online: http://www.fao.org/3/CA7656EN/CA7656EN.pdf (accessed on 15 July 2022).
- World Bank; FAO. Assessment of Forest Resource Degradation and Intervention Options in Refugee-Hosting Areas of Western and Southwestern Uganda; World Bank: Washington, DC, USA; FAO: Rome, Italy, 2020; Available online: http://www.fao.org/3/CA7832EN/CA7832EN.pdf (accessed on 15 July 2022).


| Settlement Name | District | Establishment Date | |
|---|---|---|---|
| Refugee settlements in northern Uganda | |||
| 1 | Bidibidi | Yumbe | August 2016 |
| 2 | Imvepi | Arua | February 2017 |
| 3 | Rhino extension—Omugo | Arua | January 2017 |
| 4 | Agojo | Adjumani | January 2016 |
| 5 | Ayilo I | Adjumani | January 2015 |
| 6 | Ayilo II | Adjumani | July 2014 |
| 7 | Boroli I/II | Adjumani | January 2014 |
| 8 | Maaji I a | Adjumani | January 1997 |
| 9 | Maaji II a | Adjumani | January 1997 |
| 10 | Maaji III a | Adjumani | January 1997 |
| 11 | Nyumanzi | Adjumani | January 2014 |
| 12 | Pagirinya | Adjumani | January 2016 |
| 13 | Palorinya | Moyo | December 2016 |
| 14 | Palabek | Lamwo | April 2017 |
| Refugee settlements in western and southwestern Uganda | |||
| 15 | Kyaka II | Kyegegwa | 2005 |
| 16 | Kyangwali | Kikuube | 1960 |
| 17 | Rwamwanja | Kamwenge | 1964; closed 1995; reopened 2012 |
| 18 | Kiryandongo | Kiryandongo | 1990; closed 1996; reopened 2014 |
| 19 | Nakivale | Isingiro | 1960 |
| 20 | Oruchinga | Isingiro | 1961 |
| LULC Class | No. of Plots | Average AGB (t/ha) | Brif Description |
|---|---|---|---|
| Woodland | 15 | 38 ± 7 | Trees and shrubs (average height > 4 m) |
| Bushland | 10 | 27.8 ± 5 | Bushes, thickets, shrubs (average height < 4 m) |
| Cropland | 21 | 9.14 ± 5.23 | Mixed farmland, small holdings, in use or recently used, with or without trees |
| Degraded woodland | 7 | 25.3 ± 18.5 | Woodland with partial removal of vegetation |
| Degraded bushland | 14 | 3.94 ± 3.95 | Bushland with partial removal of vegetation |
| Class in LULC Map | Average AGB (t/ha) |
|---|---|
| Plantations, broad-leaved | 90.6 |
| Plantations, coniferous | 53.9 |
| THF well-stocked | 273.7 |
| THF low-stocked | 127.6 |
| Woodland | 12.6 |
| Bushland | 7.6 |
| Grassland | 5.3 |
| Wetland | 1.6 |
| Subsistence farmland | 10.1 |
| Commercial farmland | 10.1 |
| Built-up areas | 4.1 |
| Water | 0.0 |
| Impediment (bare soil, bare rock, and so on) | 0.7 |
| LULC Class | National Averages (t/ha) | Semi-Moist Lowland (t/ha) |
|---|---|---|
| Built-up areas | 3 | - |
| Bushland | 1 | 0.3 |
| Grassland | 1 | 1 |
| Plantations, broad-leaved | 13 | - |
| Subsistence farmland | 1 | 1.4 |
| THF well-stocked | 15 | - |
| THF low-stocked | 11 | - |
| Woodland | 5 | 3.6 |
| AoI | Population Using Firewood (%) a | Firewood Consumption (kg pppd) b | Population Using Charcoal (%) a | Charcoal Consumption (kg pppd) | Total Woodfuel (kg pppd Wood Equivalent) c |
|---|---|---|---|---|---|
| Refugees—Adjumani | 94.3 | 1.73 | 25.3 | 0.25 | 1.95 |
| Refugees—Yumbe | 98.9 | 1.57 | 8.0 | 0.28 | 1.66 |
| Hosts—Adjumani | 98.8 | 2.14 | 7.2 | 0.27 | 2.21 |
| Hosts—Yumbe | 96.5 | 2.13 | 4.7 | 0.25 | 2.11 |
| Refugees—Kyaka II | 31.5 | 0.9 | 77.5 | 0.6 | 2.6 |
| Refugees—Kyangwali | 75.5 | 2.0 | 35.4 | 0.7 | 2.7 |
| Hosts—Kyaka II | 78.8 | 1.6 | 22.0 | 0.9 | 2.2 |
| Hosts—Kyangwali | 92.5 | 2.2 | 16.0 | 0.7 | 2.6 |
| Settlement | Refugee Population (2019) | Total Woodfuel Consumption (t/yr) |
|---|---|---|
| Bidibidi | 225,808 | 149,262 |
| Imvepi | 57,758 | 38,178 |
| Rhino extension—Omugo | 24,533 | 16,217 |
| Agojo | 6661 | 4403 |
| Ayilo I | 23,837 | 15,757 |
| Ayilo II | 13,722 | 9070 |
| Boroli I/II | 14,841 | 9810 |
| Maaji I | 518 | 342 |
| Maaji II | 16,174 | 10,691 |
| Maaji III | 14,947 | 9880 |
| Nyumanzi | 39,505 | 26,113 |
| Pagirinya | 35,803 | 23,666 |
| Palorinya | 119,587 | 79,049 |
| Palabek | 43,238 | 28,581 |
| Total | 636,932 | 421,019 |
| Settlement | Refugee Population (2019) | Host Population within 5 km (2019) | Total Woodfuel Consumption (t/yr) |
|---|---|---|---|
| Kiryandongo | 63,365 | 52,950 | 105,310 |
| Kyaka II | 113,023 | 61,004 | 158,652 |
| Kyangwali | 115,488 | 90,308 | 186,527 |
| Rwamwanja | 70,493 | 48,000 | 107,637 |
| Total | 362,369 | 252,262 | 558,126 |
| Settlement | District | AGB Stock (t) | AGB Growth (t/yr) |
|---|---|---|---|
| Refugee settlements in northern Uganda | |||
| Bidibidi | Yumbe | 1,093,157 | 29,214 |
| Imvepi | Arua | 282,189 | 7913 |
| Rhino ext.—Omugo | Arua | 111,908 | 2486 |
| Agojo | Adjumani | 92,674 | 379 |
| Ayilo I | Adjumani | 125,180 | 793 |
| Ayilo II | Adjumani | 98,216 | 890 |
| Boroli I/II | Adjumani | 114,172 | 793 |
| Maaji I | Adjumani | 60,270 | 1244 |
| Maaji II | Adjumani | 197,082 | 11,549 |
| Maaji III | Adjumani | 118,157 | 4553 |
| Nyumanzi | Adjumani | 78,584 | 870 |
| Pagirinya | Adjumani | 51,597 | 364 |
| Palorinya | Moyo | 423,178 | 18,170 |
| Palabek a | Lamwo | 404,230 | 6767 |
| Total | 3,250,598 | 85,984 | |
| Refugee settlements in western and southwestern Uganda | |||
| Kiryandongo | Kiryandongo | 272,229 | 29,384 |
| Kyaka II | Kyegegwa | 432,578 | 39,394 |
| Kyangwali | Kikuube | 1,436,480 | 83,300 |
| Nakivale & Oruchinga | Isingiro | 650,888 | 80,426 |
| Rwamwanja | Kamwenge | 380,139 | 41,961 |
| Total | 3,172,314 | 274,466 | |
| 5 km Buffer | 15 km Buffer | |||||||
|---|---|---|---|---|---|---|---|---|
| Loss and Degradation | 2010–2013 | 2014–2018 | 2010–2013 | 2014–2018 | ||||
| Total Area (ha) | AGB Stock (t) | Total Area (ha) | AGB Stock (t) | Total Area (ha) | AGB Stock (t) | Total Area (ha) | AGB Stock (t) | |
| Loss in woodland | 157 | 5961 | 3288 | 124,950 | 536 | 20,358 | 9253 | 351,614 |
| Loss in bushland | 703 | 19,532 | 6998 | 194,543 | 1428 | 39,696 | 14,015 | 389,624 |
| Loss in cropland | 1060 | 10,521 | 23,826 | 236,591 | 2141 | 21,255 | 54,311 | 539,306 |
| Total loss | 1919 | 36,015 | 34,112 | 556,084 | 4104 | 81,309 | 77,579 | 1,280,544 |
| Degraded woodland | 1425 | 36,088 | 10,558 | 267,427 | 4073 | 103,164 | 25,872 | 655,341 |
| Degraded bushland | 4240 | 16,704 | 19,047 | 75,044 | 8797 | 34,660 | 38,787 | 152,822 |
| Total degradation | 5664 | 29,604 | 12,870 | 64,660 | ||||
| Loss in degraded woodland | — | 27,169 | — | 201,336 | — | 77,668 | — | 493,381 |
| Loss in degraded bushland | — | 44,728 | — | 200,942 | — | 92,809 | — | 409,207 |
| Total loss from degraded land | — | 71,897 | — | 402,277 | — | 170,477 | — | 902,588 |
| Total biomass loss | 107,912 | 958,361 | 251,786 | 2,183,132 | ||||
| 2010–2013 | 2014–2018 | |||||
|---|---|---|---|---|---|---|
| Settlement | Degradation (ha) | Loss (ha) | % Loss and Degradation | Degradation (ha) | Loss (ha) | % Loss and Degradation |
| Bidibidi | 1916 | 646 | −1.6 | 12,555 | 9895 | −13.9 |
| Imvepi | 307 | 193 | −1.2 | 3223 | 3682 | −16.5 |
| Rhino ext.—Omugo | 90 | 35 | −0.5 | 1876 | 1237 | −13.6 |
| Agojo | 173 | 92 | −1.8 | 638 | 2921 | −24.4 |
| Ayilo I | 402 | 240 | −4.6 | 1501 | 2073 | −25.6 |
| Ayilo II | 381 | 188 | −4.9 | 1710 | 2252 | −34.0 |
| Boroli I/II | 119 | 134 | −2.3 | 1044 | 532 | −14.2 |
| Maaji I | 116 | 50 | −2.1 | 450 | 738 | −15.1 |
| Maaji II | 228 | 79 | −2.4 | 471 | 435 | −7.2 |
| Maaji III | 638 | 2921 | −30.4 | 860 | 1032 | −16.2 |
| Nyumanzi | 101 | 22 | −0.9 | 1242 | 1254 | −19.3 |
| Pagirinya | 545 | 135 | −4.6 | 615 | 1602 | −15.1 |
| Palorinya | 1728 | 483 | −4.5 | 7771 | 4426 | −24.6 |
| Palabek a | 521 | 90 | −0.9 | 1878 | 7727 | −14.1 |
| Average (%) | −4.5 | Average (%) | −18.1 | |||
| AoI | Refugee Woodfuel Demand (t/yr) | AGB Stock (t) | AGB Growth (t/yr) | AGB Change (t/ yr) | Annual Change (%) |
|---|---|---|---|---|---|
| Bidibidi | 122,395 | 1,093,157 | 29,214 | −93,181 | −8.5% |
| Imvepi | 31,306 | 282,189 | 7913 | −23,393 | −8.3% |
| Rhino extension—Omugo | 13,298 | 111,908 | 2486 | −10,812 | −9.7% |
| Agojo | 3610 | 92,674 | 379 | −3232 | −3.5% |
| Ayilo I | 12,921 | 125,180 | 793 | −12,128 | −9.7% |
| Ayilo II | 7437 | 98,216 | 890 | −6548 | −6.7% |
| Boroli I/II | 8044 | 114,172 | 793 | −7251 | −6.4% |
| Maaji I | 280 | 60,270 | 1244 | 964 | 1.6% |
| Maaji II | 8767 | 197,082 | 11,549 | 2782 | 1.4% |
| Maaji III | 8102 | 118,157 | 4553 | −3548 | −3.0% |
| Nyumanzi | 21,413 | 78,584 | 870 | −20,543 | −26.1% |
| Pagirinya | 19,406 | 51,597 | 364 | −19,042 | −36.9% |
| Palorinya | 64,820 | 423,178 | 18,170 | −46,651 | −11.0% |
| Palabek | 23,436 | 404,230 | 6767 | −16,669 | −4.1% |
| Total | 345,236 | 3,250,598 | 85,984 | −259,251 | −8.0% |
| AoI | Refugee and Hosts Woodfuel Demand (t/yr) | AGB Stock (t) | AGB Growth (t/yr) | AGB Change (t/yr) | Annual Change (%) |
|---|---|---|---|---|---|
| Kiryandongo | 92,902 | 272,229 | 29,384 | −63,518 | −23 |
| Kyaka II | 128,189 | 432,578 | 39,394 | −88,795 | −21 |
| Kyangwali | 164,446 | 1,436,480 | 83,300 | −81,146 | −6 |
| Rwamwanja | 86,566 | 380,139 | 41,961 | −44,605 | −12 |
| Total | 472,103 | 2,521,426 | 194,039 | −278,063 | −11 |
Publisher’s Note: MDPI stays neutral with regard to jurisdictional claims in published maps and institutional affiliations. |
© 2022 by the authors. Licensee MDPI, Basel, Switzerland. This article is an open access article distributed under the terms and conditions of the Creative Commons Attribution (CC BY) license (https://creativecommons.org/licenses/by/4.0/).
Share and Cite
Gianvenuti, A.; Bedijo, N.G.; Jalal, R.; Hitimana, L.; Walter, S.; Linhares-Juvenal, T.; Xia, Z. Woodfuel Consumption in Refugee Hosting Areas and Its Impact on the Surrounding Forests—The Case of Uganda. Forests 2022, 13, 1676. https://doi.org/10.3390/f13101676
Gianvenuti A, Bedijo NG, Jalal R, Hitimana L, Walter S, Linhares-Juvenal T, Xia Z. Woodfuel Consumption in Refugee Hosting Areas and Its Impact on the Surrounding Forests—The Case of Uganda. Forests. 2022; 13(10):1676. https://doi.org/10.3390/f13101676
Chicago/Turabian StyleGianvenuti, Arturo, Nelly Grace Bedijo, Rashed Jalal, Leonidas Hitimana, Sven Walter, Thais Linhares-Juvenal, and Zuzhang Xia. 2022. "Woodfuel Consumption in Refugee Hosting Areas and Its Impact on the Surrounding Forests—The Case of Uganda" Forests 13, no. 10: 1676. https://doi.org/10.3390/f13101676