Article

Phosphorus Nutrition and Water Relations of European Beech (Fagus sylvatica L.) Saplings Are Determined by Plant Origin

by
Nevenka Ćelepirović
1,*,
Sanja Bogunović
1,
Aikaterini Dounavi
2,
Florian Netzer
3,
Monika Eiblmeier
3,
Michael Dannenmann
4,
Stephanie Rehschuh
4,
Heinz Rennenberg
3,5 and
Mladen Ivanković
1,*
1
Division for Genetics, Forest Tree Breeding and Seed Science, Croatian Forest Research Institute, Cvjetno Naselje 41, 10450 Jastrebarsko, Croatia
2
Department of Forest Protection, Forest Research Institute of Baden-Württemberg, Wonnhaldesttr. 4, 79100 Freiburg, Germany
3
Institute for Forest Sciences, Albert-Ludwigs-University Freiburg, Georges-Köhler-Allee 53/54, 79110 Freiburg, Germany
4
Division of Biogeochemical Processes, Institute of Meteorology and Climate Research, Atmospheric Environmental Research (KIT/IMK-IFU), Campus Alpin, Karlsruhe Institute of Technology (KIT), Kreuzeckbahnstraße 19, 82467 Garmisch-Partenkirchen, Germany
5
Center of Molecular Ecophysiology (CMEP), College of Resources and Environment, Southwest University, No. 2, Tiansheng Road, Beibei District, Chongqing 400715, China
*
Authors to whom correspondence should be addressed.
Forests 2022, 13(10), 1683; https://doi.org/10.3390/f13101683
Submission received: 26 August 2022 / Revised: 23 September 2022 / Accepted: 3 October 2022 / Published: 13 October 2022
(This article belongs to the Section Forest Ecophysiology and Biology)

Abstract

:
Climate change, specifically the increasing frequency and intensity of summer heat and drought, has severe influences on the performance of beech forests, including decline in growth, reduced nutrient turnover, enhanced mortality, and a shift in spatial distribution northwards and towards higher elevations. The present study aimed to characterize the physiological responses of Croatian beech saplings originating from 10 natural forest stands to experimentally applied water deprivation in a common-garden experiment. The aim was to evaluate the extent to which external factors such as climate, as well as nitrogen (N) and phosphorus (P) availability in the soil of the natural habitats, control the response of beech saplings to water deprivation. For this purpose, beech saplings from 10 forest stands that differed in terms of soil type, chemical soil properties, as well as climate were collected in winter, cultivated in an artificial soil substrate under controlled conditions for one year, and then subjected to 29 days of water deprivation. Responses to water deprivation were observed in the antioxidative system (total ascorbate, reduced ascorbate, oxidized ascorbate, and redox state) in leaves and fine roots. The latter allowed us to categorize saplings as adapted or sensitive to water deprivation. P over N availability in the soil rather than climatic conditions in the natural habitats controlled the response of beech saplings to the water-deprivation event. The categorization of saplings as adapted or sensitive to water deprivation was related to genetic parameters. The results of this multidisciplinary study (tree physiology, climate, and genetic data) are considered to be highly significant and beneficial for the adaptation of European beech forests to changing climatic conditions.

1. Introduction

Beech (Fagus sylvatica L.) constitutes the dominant broadleaf tree species in many forests in Europe [1,2]. It is also widespread on calcareous soils in Croatia [3], where beech occupies 47% of forested land and is found in 13 different ecosystems [4]. Therefore, beech is of high ecological and economic importance in Croatian forestry [5]. The ecological relevance of beech is substantial because of its broad ecological range, including its ability to clean the air, filter water supplies, manage erosion and floods, maintain biodiversity, and conserve genetic resources. It is utilized as wood-processing material, firewood, and charcoal because of the high quality of the wood [1]. Increasing duration, frequency, and intensity of summer heat and drought [6] have already reduced the productivity of European beech forests and are projected to reduce the performance of beech trees even more severely in the future.
In a modelling approach, Dannenmann et al. [3] estimated that the potential distribution of productive beech forests on calcareous soil in Europe could decline by 78% until the year 2080, with Croatian beech forests most severely affected. According to Glavač [7], in the microhabitats under the beech canopy, the supply of water and the correct mineral substances from the leaves are more favourable. With the increase in industrialization in the middle of the 20th century, favourable microlocations disappeared due to atmospheric pollution. The same author stated that the beech forest damage caused by atmospheric pollution is manifested as a direct impact on leaves and assimilation, the introduction of substances into the soil via dry and wet deposition and their influence on physiological processes, indirect damage caused by a changed climate, and increased susceptibility of trees to extreme climatic, edaphic, and biotic conditions. Previous studies of Croatian beech provenances include research on quantitative genetic variation and adaptation related to change in climatic environment [8,9,10,11,12,13,14,15].
A cross-exchange experiment with beech saplings in typical beech stands on calcareous soil in SW Germany revealed that under future climatic conditions: (a) gross nitrification will decrease; (b) the availability of nitrate (NO3), the most important N source of beech saplings in the soil, will decrease; and (c) reduced NO3 uptake will mediate decreased growth. From these results, it was concluded that ecosystem N turnover could become a bottleneck for the growth and development of beech forests upon increasing exposure to heat and drought in regions not affected by chronic atmospheric N deposition [3]. These observations also explain the well-documented sensitivity of beech to drought, especially on calcareous soil [16,17,18]. As a consequence of this sensitivity, the spatial and altitudinal distribution of beech was found to shift towards areas with sufficient water supply at a higher elevation and in Northern Europe [19,20].
While N nutrition of beech has been intensively studied [21,22], only recently has the P nutrition of beech trees [23,24], P cycling in beech forests, and adaptation to scarce P resources come into the focus of forest research [25,26]. As observed for N nutrition, P nutrition of beech saplings is negatively affected by water deprivation, as indicated by decreasing total P (Ptot) and inorganic P (Pi) in leaves, stems, and roots [27,28]. Among the foliar contents and partitioning of major nutrients of beech ecotypes, phosphorus was most affected by water deprivation [28]. Due to the vast distribution area of Fagus sylvatica across Central Europe, beech had to adapt to various atmospheric and pedospheric conditions in its habitats during its evolution. This adaptation has led to the formation of genetically distinct ecotypes differing in sensitivity to water deprivation [27,29,30,31]. Among beech ecotypes, beech saplings from well-watered habitats showed negative effects on P nutrition that finally determined the saplings’ capacity for using ascorbate to scavenge reactive oxygen species and, thus, the saplings´ sensitivity to water deprivation [26].
As previously observed for NO3 [3], retarded phosphate (Pi) acquisition could also be an ‘Achilles heel’ for the nutrition of beech saplings during drought. This may be a consequence of (a) reduced diffusion of Pi in the soil [32] or to the root surface and, thus, declining replenishment of Pi, depleted by root uptake in the rhizosphere [33,34,35,36,37]; and (b) reduced microbial recycling of Porg in the soil [25]. However, different from N turnover [3], reduced microbial recycling of Porg in the soil has not been shown for beech forests in response to water deprivation. Despite a significant number of common-garden experiments with beech saplings originating from sites along precipitation gradients (e.g., [29,31,37,38,39]), according to the authors’ knowledge, soil properties in natural habitats have not been related to the sensitivity of beech ecotypes to drought.
Therefore, the present study aimed at characterizing the responses of beech saplings to experimentally applied water deprivation during summer in a common-garden experiment using saplings from different beech forests in Croatia, reflecting a climate gradient, an elevation gradient, and a gradient in soil properties (N and P availability). We hypothesized that (a) water relations of beech saplings are determined by water availability at the site of origin; (b) P nutrition differs between saplings originating from P-rich and P-poor habitats during water deprivation, even when cultivated in the same soil substrate; (c) soil P resources are a driver for the anti-oxidative capacity of beech saplings; (d) N availability in the soil is less important for the response of beech saplings to water deprivation; and (e) genetic ancestry and environmental adaptation shape the responses of Croatian beech saplings to water deprivation in the area under study. To test these hypotheses, total N, total C, δ13C signatures, Pi contents, and Asc levels, including redox states, were determined in the leaves and fine roots of 10 ecotypes of beech saplings under water deprivation and well-watered conditions. The physiological data were complemented by genetic characterization based on eight EST (expressed sequence tag) microsatellite markers.

2. Materials and Methods

2.1. Experimental Design and Plant Materials

Beech saplings from 10 Croatian natural beech forest stands were collected for the present study (Table 1 and Table 2). The origin habitats of the 10 selected beech ecotypes, representing the distribution area of beech in Croatia, were located along a precipitation and elevation gradient on different soil types (Table 1). Growth conditions at the forest sites are given in Table 1. At each forest site, 5 trees (at a minimal distance of 50 m) were selected. Two- to three-year-old beech saplings under the selected trees were dug out of the soil without destroying the root systems during the winters of 2014 and 2015. Adherent soil was removed from the roots by rinsing with tap water. After collection, saplings were planted into pots (11.3 × 11.3 × 21.5 cm) filled with commercial soil substrate (organic content 60%; salt in g/L KCl—1, N in mg/L CaCl2—140, P2O5 in mg/L CAL—160, K2O in mg/L CAL—180, Mg in mg/L CaCl2—100, S in mg/L CaCl2, pH 5.8; light peat 0–40 mm—70%, black peat 0–40 mm—30%; N-P-K—14-16-18; Stender Spezialsubstrat MC 510, Stender AG, Schermbeck, Germany).
Beech saplings were cultivated under field conditions near the greenhouse facilities of the Croatian Forest Research Institute in Jastrebarsko (Croatia) and transferred into the greenhouse on the 9 May 2016 (one month before the start of the experiment).
In the greenhouse, saplings were watered twice a week with 130 mL of tap water. Pots were arranged in a completely randomized design with two treatments (control and water deprivation). After 1 month of adaptation to greenhouse conditions, saplings with fully developed leaves were separated into a control (continuously well-watered) and a water-deprivation group. During the cultivation of the saplings in the greenhouse, the daily mean air temperature was 27 ± 3 °C, with a daily minimum and maximum air temperature of 19 ± 2 °C and 40 ± 5 °C, respectively. The intensity of solar radiation was below 300 W/m2, because at this value of solar radiation, shading was activated inside the greenhouse. The daily mean, maximum, and minimum air humidities amounted to 66 ± 6%, 89 ± 1%, and 31 ± 9%, respectively. At the beginning of the experiment on the 8 June 2016 (the 1st harvest), 4 well-watered plants per ecotype were harvested. Twenty-nine days later, well-watered controls and drought-stressed saplings cultivated under water deprivation were harvested on the 6 July 2016 (2nd harvest), in either 4 (well-watered controls) or 5 replicates (water deprivation) per ecotype.
At both harvests, the height of all saplings was measured, and leaf, stem, and root fresh weight were determined separately and combined to determine the total fresh weight per plant. For the determination of root biomass, the soil was removed from the roots with tap water. Fully expanded leaves and 1 g of the fine roots (diameter < 2 mm) per sapling were collected, pooled, frozen in liquid nitrogen, and stored at 80 °C until analyses. The plant material was homogenized under liquid nitrogen using a mortar and pestle. Aliquots of all tissue samples were dried (60 °C, ca. 72 h until weight constancy) to calculate the total dry weight of the saplings.
In parallel with the water-deprivation treatment, the second set of well-watered saplings was cultivated to test whether water deprivation affected the growth performance of the beech ecotypes. For this purpose, the absolute and relative increases in height (the height at the end of the experiment [cm] − the height at the start of the experiment [cm])/height at the start of the experiment [cm]) × 100) during the 29 days of the experiment were calculated.

2.2. Plant Tissue Analyses

2.2.1. Determination of Total C, Total N, and δ13C in Leaves and Fine Roots by IRMS

Total C and N abundances and δ13C signatures were determined in the fine roots and leaves by EA-IRMS, as described by Simon et al. [40]. For this purpose, 1.5–2.0 mg of oven-dried (60 °C, ca. 72 h) and homogenized leaf or fine root powder were weighed into tin capsules (4 × 6 mm, IVA Analysentechnik, Meerbusch, Germany) using a precision scale (AT21 Comparator, Mettler Toledo Int. Columbus, OH, USA). Samples were analyzed in an element analyzer (EA) (NA 2500; CE Instruments, Milan, Italy) coupled to an isotope ratio mass spectrometer (IRMS) (Delta Plus; Finnigan MAT GmbH, Bremen, Germany) via a Conflo II interface (Finnigan MAT GmbH, Bremen, Germany). Glutamic acid was used as a working standard (every 10th sample) to detect a potential instrument drift over time. Working standards were calibrated against the primary L-glutamic acids standards (USGS 40 and USGS 41). To determine C isotopes and the C and N elemental compositions of the samples, the standards USGS 25 (for C) and USGS 41 (for N) were used, respectively [30].

2.2.2. Pi analyses of Leaves and Fine Roots

Pi (PO43−) contents in leaves and fine roots were determined in aqueous extracts [26]. For this purpose, approximately 10 to 20 mg frozen, homogenized leaf or fine root powder were added to a 2 mL tube containing 1.5 mL ddH2O and 100 mg washed PVPP (Polyvinylpolypyrrolidone, SIGMA-Aldrich, Steinheim, Germany) [41]. Samples were shaken for 1 h at 8 °C in a cold room, boiled in a water bath (96 °C, 10 min), and cooled on ice. To receive a clear extract, samples were centrifuged two times (10 min, 21,500× g, 4 °C). Pi contents were determined using the molybdenum blue test [42] adapted to a multimode microplate reader [18]. The absorbance of the molybdenum blue complex was determined at a wavelength of 700 nm (TriStar2 LB 942, Berthold Technologies, Bad Wildbad, Germany). Pi contents were calculated using linear regression of a series of dilutions (0, 1, 2, 5, 10, and 20 µmol L−1 Pi).

2.2.3. Ascorbate Determination in Leaves and Fine Roots

The method of Okamura [43] modified by Knörzer et al. [44] was used to determine the contents of total ascorbate (total Asc) and reduced ascorbate (red. Asc). For this purpose, 30 to 40 mg of frozen, homogenized leaf powder or 60 to 80 mg of fine root powder were weighed into 2 mL tubes and kept on ice. The samples (500 µL) were treated with 5% meta-phosphoric acid (m-H3PO4) before being mixed and centrifuged (15 min, 17.200× g, 4 °C). Red. Asc and total Asc were determined separately, each in a 100 µL extract. Extracts for both determinations were neutralized by adding 20 µL triethanolamine (1.5 M) and mixed with 100 µL sodium phosphate buffer (150 mM, pH 7.4). To determine red. Asc, 100 µL of ddH20 was added to the extracts. To achieve the complete reduction of Asc for the determination of total Asc, 50 µL of 10 mM dithiothreitol was added instead of ddH2O. After 15 min at room temperature, 50 µL N-ethylmaleinimid (0.5%) was added and samples were mixed again. Finally, trichloroacetic acid (10%), ortho-phosphoric acid (44%), and 2.1‘dipyridil (4%), 200 µL of each, and 100 µL of Fe (III) chloride (3%), were added to the extracts for the determination of both reduced and total ascorbate. Samples were incubated at 37 °C for 60 min in a water bath to facilitate the formation of the Fe2+-α-α’dipyridyl chelate complex. The absorption of the complex was measured at 525 nm [43] with a spectrophotometer (UV-DU 650, Beckman, Fullerton, CA, USA). Concentrations of total Asc or red. Asc were calculated using the linear regression of standard curves ranging between 0 and 0.120 µmol total Asc mL−1. The amount of oxidized ascorbate (dehydroascorbate, DHA) was calculated using Equation (1), and the redox state of Asc was calculated according to Haberer et al. [45] with Equation (2).
DHA [µmol g−1 FW] = total Asc. [µmol g−1 FW] − reduced Asc. [µmol g−1 FW]
redox state (%) = (reduced Asc. [µmol g−1 FW]/total Asc. [µmol g−1 FW]) × 100

2.3. Genetic Analyses

Leaves of 50 individuals of each beech ecotype (Table 1) were sampled and total DNA was extracted using a NucleoSpin Plant II kit (Macherey Nagel, Düren, Germany). Eight gene-based EST (expressed sequence tag) microsatellite markers (acc. nos.: FcC00468, FcC00483, FcC00927, FcC01009, FcC00730, FcC01877, FcC02208, FcC03095, FcC03300) were analyzed to estimate genetic differences between ecotypes [46]. PCRs were performed using fluorescently labelled primers, according to Dounavi et al. [29]. Capillary electrophoresis, performed with an ABI PRISM-3130xl Genetic Analyzer, was used to score alleles, and the software GeneMapper v4.0 (Applied Biosystems, ThermoFisher Scientific, Waltham, MA, USA) was applied to perform fragment analysis. Genetic diversity within and differentiation between regions were calculated with the software Genalex [47]. A PCA plot based on population pairwise distances was used to represent patterns of genetic relationships.

2.4. Soil Sampling and Soil Analyses

2.4.1. Soil Sampling

The soil of the 10 beech forests of origin was sampled to determine available N and Pi. At each forest site, mineral soil down to 10 cm depth and the organic layer, including litter, were collected in five replicates per layer. One aliquot of field moist soil was used for the determination of available N. For Pi analyses, another aliquot of dried (60 °C, ca. 72 h) and sieved (2 mm) soil was used [48].

2.4.2. Determination of Available Mineral N in the Soil

Five replicated samples of mineral soil (30 g) and the organic soil layer (10 g) were extracted with 0.5 M K2SO4 [3]. For this purpose, samples were shaken for one hour in 250 mL plastic bottles (Carl Roth GmbH, Karlsruhe, Germany) at 170 rpm at a soil/solution ratio of 1:2 (mineral soil) and 1:5 (organic soil layer). Subsequently, extracts were filtered using a vacuum pump through Whatman-GF/A glass fiber filters in porcelain funnels. The filtered extracts were further passed through a syringe filter (0.45 µm, Schleicher and Schuell, Dassel, Germany) and frozen immediately until analysis. Concentrations of NH4+ and NO3 were analyzed by a commercial laboratory (Dr. Janssen´s laboratory, Gillersheim, Germany) according to VD LUFA method A 6141 [49]. Residual soil was used to determine water content gravimetrically by drying the soil at 105 °C until constant weight. NO3 and NH4+ in the mineral soil are referred to as NO3min, and NH4+min, respectively, while NO3 and NH4+ in the organic soil layer are referred to as NO3org and NH4+org, respectively.

2.4.3. Determination of Soil Pi Content

Aliquots of 30 to 50 mg of dried and sieved soil from both layers were used for Pi extractions. For this purpose, the soil material was mixed with 1.5 mL of ddH2O and shaken in a cold room (48 h, 8 °C, 120 rpm). Pi in aqueous extracts was determined as described above for plant tissues. Based on the Pi concentrations contents in the extracts, the Pi content of the soil was calculated. Throughout the manuscript, Pi in the mineral soil is termed Pimin and Pi in the organic soil layer is termed Piorg.

2.5. Statistics

One-way ANOVAs of the data were conducted to elucidate significant differences between beech saplings originating from different habitats in the well-watered and water-deprivation treatments. Before ANOVAs, the data were tested for normal distribution (Shapiro–Wilk test) and homogeneity of variances (Levens2 test). The level of significance for all subsequent tests was set to p < 0.01 in order to achieve statistically reliable results. When data failed one of the requirements for parametric ANOVA, non-parametric ANOVAs (Kruskal–Wallis ANOVAs) were conducted. The effects of water deprivation on growth and physiological parameters were tested by comparing well-watered control plants with saplings exposed to water deprivation (drought) using the non-parametric Mann–Whitney test. To investigate which environmental parameters control the saplings’ responses to water deprivation, correlation analyses including 6 soil parameters (NO3-N, NH4+-N, and Pi for both the organic and the mineral soil, and total available N and Pi), 11 climatic parameters at the site of origin, and physiological parameters determined for the ecotypes in the control and the water-deprivation treatment were conducted. Statistical analyses were performed using Origin PRO 9.1 software (OriginLab Corporation, Northampton, MA, USA).

3. Results

3.1. Growth Conditions in the Habitats of Sapling Origin

For the present experiment, saplings originating from 10 Croatian beech forest stands were selected. The original beech habitats differed in growth conditions, i.e., in precipitation, elevation, air temperature, and the prevailing soil type, with different P and N availabilities (Table 1 and Table 2).
While NO3min was similar in all habitats of seedling origin, NH4+ min was higher in Sk compared to all other soils, except for Za, where intermediate NH4+ min contents were observed. Pimin was highest in Ča and lowest in To and Se. Additionally, nutrients in the organic layer differed between the beech forest stands. NO3org was highest in Za and significantly lower in Vd, Vg, Ča, Sk, DL, and To. Piorg was highest in Vg, Ča, and Sk, and lowest in To. Thus, To and Se constituted the P-poorest habitats and were also among the N-poorest habitats.
To structure the dataset, minimum values, 1st quartile, median, 3rd quartile, and maximum values were calculated for each soil parameter (Table S1a,b). According to these values, the beech forest stands selected for the collection of beech saplings were categorized as having low, moderately low, moderately high, and high soil NO3, NH4+, and Pi availabilities, irrespective of other soil properties (Table 1 and Table S1a,b). With this classification, Vg (Dystric Cambisol), Ve (Luvisol), and Sk (Rendzic Leptosol) were classified as rich in Pimin, while Ča (Eutric Cambisol) and DL (Rendzic Leptosol) were categorized as Piorg rich. In contrast, Vd (Dystric Cambisol), Se (Chromic Cambisol developed from limestone and dolomite), and To (Dystric Cambisol) were classified as Pimin poor, while Ve (Luvisol), Se (Chromic Cambisol developed from limestone and dolomite) and To (Dystric Cambisol) were classified as Piorg poor. Za (Dystric Cambisol) was classified as rich in NO3min, NH4+min, NO3org, and NH4+org. Furthermore, Ot and Sk (both Rendzic Leptosols) were found to be rich in NO3min and NH4+min, respectively. Additionally, Ot (Dystric Cambisol) and Vg (Rendzic Leptosol) were rich in both NO3org and NH4+org. In contrast, Se (Chromic Cambisol developed from limestone and dolomite) was classified as poor in the N pools analyzed. To (Dystric Cambisol) was poor in all N pools except for NO3min, while Vd (Dystric Cambisol) and Ča (Eutric Cambisol) were poor in both NO3 in mineral and organic soil. Additionally, Ot (Dystric Cambisol) and Sk (Rendzic Leptosol) were categorized as poor in NH4+min and NH4+org, respectively. This categorization of forest sites according to nutrient contents in the soil showed that soil type alone does not control soil properties. Concerning climatic conditions (Table 1), Ot was classified as the forest site with the highest precipitation, while Ve represented the habitat with the lowest precipitation included in the present study.

3.2. Biomass, Root/Shoot Ratio, and Tree Height

The biomasses of leaves, stems, and fine roots, the root/shoot ratio, as well as the height of the well-watered saplings (1st harvest before the drought treatment) and controls and drought-stressed saplings harvested after 29 days of water deprivation (2nd harvest) were determined to detect differences in the growth performances of the beech saplings ecotypes. At the end of the well-watered treatment, the total biomass of Sk saplings was the highest (10.3 ± 4.1 g dw) and was significantly lower for Vg (2.7 ± 0.9 g dw), Se (2.5 ± 1.5 g dw), and To (1.9 ± 0.6 g dw). Hence, total biomass was the lowest for saplings from the two P-poorest habitats of origin (Table 2). Similar to total biomass, stem biomass was highest for Sk saplings in the well-watered treatment (4.6 ± 1.7 g dw) and significantly lower for Vg (1.1 ± 0.3 g dw), Ve (1.5 ± 0.4 g dw), Se (0.7 ± 0.2 g dw), and To (1.3 ± 0.8 g dw). Additionally, fine root biomasses differed between the ecotypes in the well-watered treatment. It was highest for Ot (5.9 ± 1.9 g dw) and significantly lower for Vg (1.6 ± 0.6 g dw) and Se (1.4 ± 0.6 g dw). Foliar biomass, tree height, as well as the root/shoot ratio did not differ between the ecotypes in the well-watered treatment. For the saplings harvested after 29 days of exposure to drought, neither leaf, stem, fine root, and total biomasses nor root/shoot ratios showed statistically significant differences between the beech ecotypes (results of one-way ANOVA at p < 0.01) (Table 3).
In parallel with the drought treatment, the second set of well-watered saplings was cultivated to test whether drought affects the growth performance of the beech ecotypes. For this purpose, the absolute and the relative increases in height (the height at the end of the experiment [cm] − the height at the start of the experiment [cm])/height at the start of the experiment [cm]) × 100) during the 29 days of the experiment were calculated. For well-watered saplings and drought-stressed individuals, neither absolute nor relative height increases differed significantly between ecotypes. The comparison of growth rates between the treatments for each ecotype revealed that neither the relative nor absolute height increases of the saplings were reduced by drought compared to well-watered conditions (p > 0.05) (Table 4).
Since the homogeneity of growth and biomass parameters described above eliminated the possibility that different growth performances caused different responses to drought, the dataset provided here specifically allows analysis of physiological responses to drought in beech saplings.

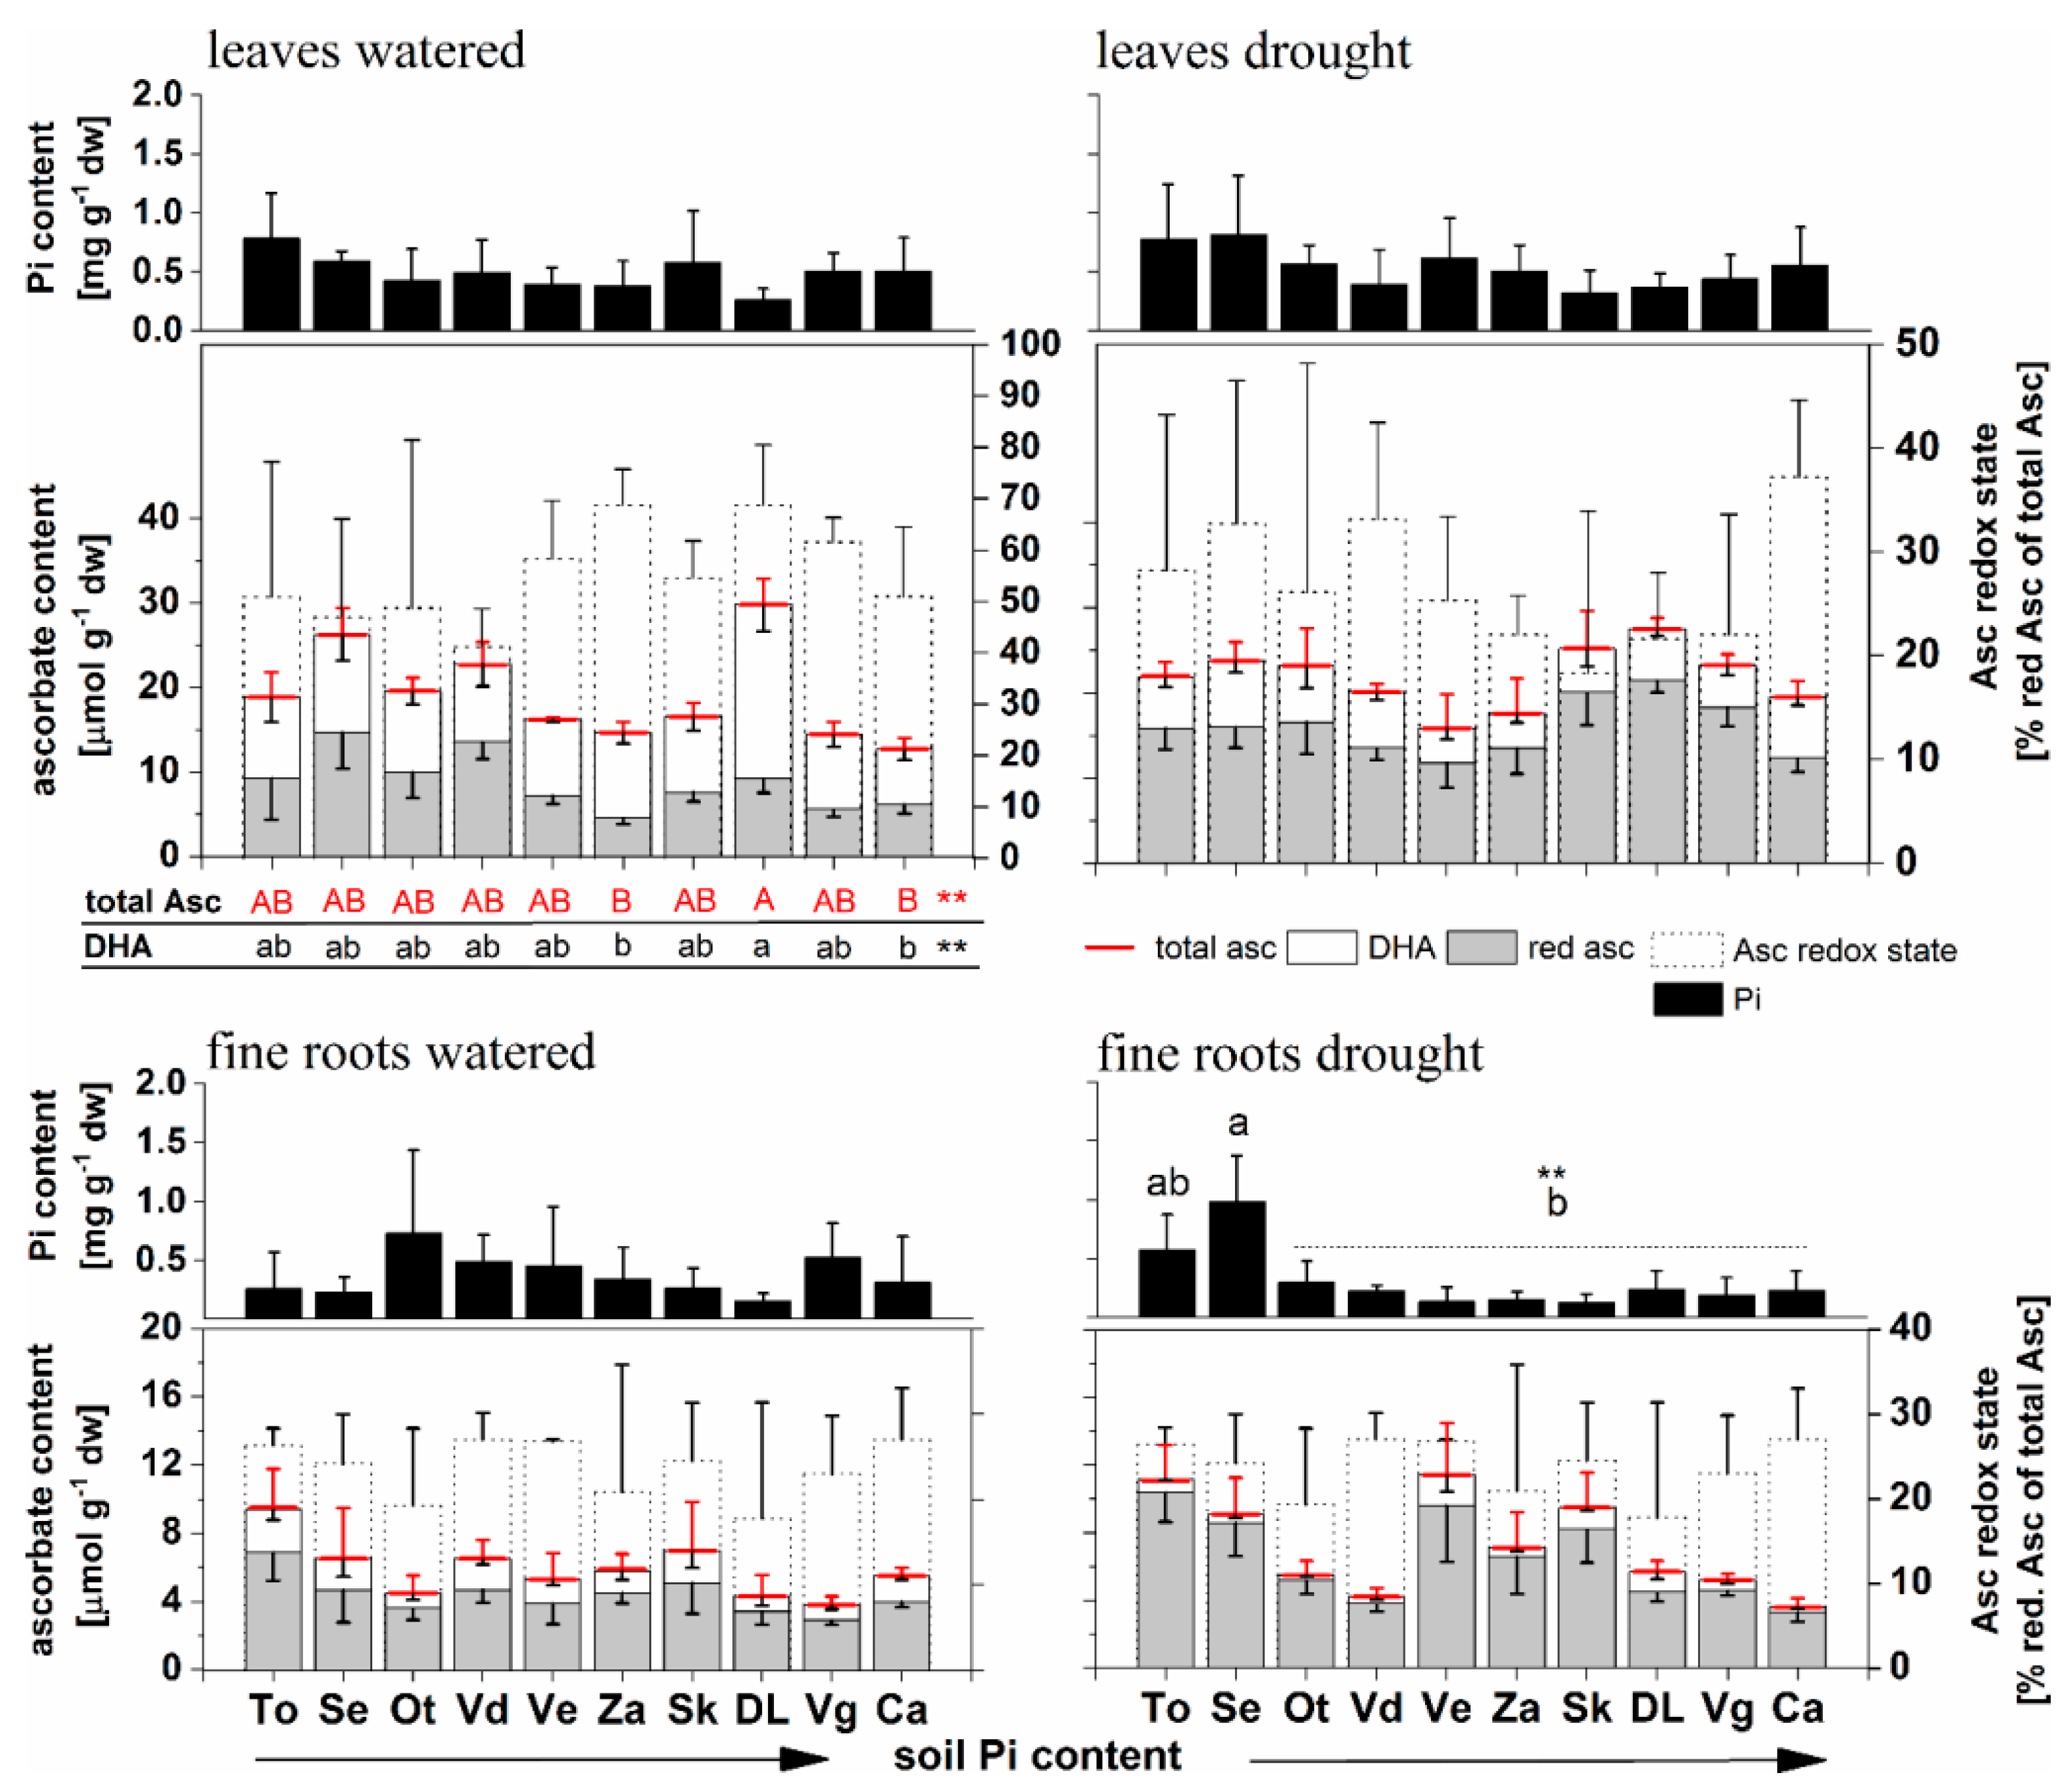
3.3. Physiological Parameters in Leaves and Fine Roots in the Well-Watered Treatment

In the well-watered treatment, differences between the ecotypes in leaves and fine roots were scarce due to the high variability of the parameters tested (Figure 1, Table 5). In leaves of well-watered DL saplings, DHA and total Asc were significantly higher compared to the Za and Ča ecotypes (p < 0.01, Figure 1). δ13C was significantly higher (less negative) in the leaves of well-watered Se saplings compared to all other ecotypes, except for To (p < 0.01) (Table 5). In the fine roots of well-watered saplings, significant differences between the ecotypes were not observed for the physiological parameters studied (Figure 1, Table 5). Furthermore, the DW–FW ratios and, thus, the water contents of the fine roots and leaves did not differ between the ecotypes (p < 0.01 level, Table S2).

3.4. Correlation Analyses for the Well-Watered Conditions

3.4.1. Pimin and Piorg in the Soil of the Habitat of Origin Correlated with Nutrient and Asc Contents in Well-Watered Saplings

Correlation analyses were conducted to investigate whether soil-derived properties determine nutrient and/or Asc contents in leaves and fine roots. Pimin and Piorg were found to constitute the predominant factors controlling both nutrient and Asc contents in leaves and fine roots under well-watered conditions (Figure 2), while in the leaves of beech saplings of different habitats, red Asc and total Asc were negatively correlated with Pimin and foliar total N was negatively correlated with Piorg. In the leaves of the saplings, δ13C was negatively correlated with Pimin and Piorg, while the C/N ratio was positively dependent on Piorg. In the fine roots, δ13C, as well as red Asc, were negatively correlated with Pimin and Piorg. Furthermore, total Asc was negatively correlated with Pimin. While total N was negatively related to Piorg, the C/N ratio was positively correlated with Piorg.

3.4.2. Climatic Parameters in the Habitat of Origin Are Less Important for Nutrient and Asc Contents in Well-Watered Saplings

In contrast to these correlations with soil properties, significant correlations with climatic variables in the habitat of origin were weaker for nutrient and Asc contents of the leaves under well-watered conditions. The redox state of Asc and the C/N ratio were negatively correlated with MAT (mean annual temperature, °C). Pearson’s P and levels of significance are given in Table S3a. MCMT positively affected the red Asc content, the redox state of Asc, and total N. The C/N ratio was negatively correlated with MCMT. In the leaves of well-watered saplings, total Asc content and δ13C abundance were negatively related to TD (see Appendix A). In the fine roots of well-watered saplings, the C/N ratio was negatively dependent on MAT. As observed for the leaves, the N content and the C/N ratio of the fine roots correlated negatively with MCMT, and δ13C negatively correlated with TD. These results show that climatic parameters are less significant than soil Piorg and Pi in explaining the observed differences in physiological parameters between beech ecotypes of different origins in Croatia under well-watered conditions.

3.5. Physiological Parameters in Leaves and Fine Roots in the Drought Treatment

The water contents of fine roots and leaves did not significantly vary between the ecotypes in the drought treatment, nor did the DW/FW ratios (Table S2). However, δ13C in leaves and fine roots revealed differences between the ecotypes in the drought treatment. Foliar δ13C was highest (less negative) for Se and significantly lower (more negative) for Ča, DL, Za, Ve, and Ot (p < 0.01). In fine roots, δ13C was significantly higher for Se compared to Vd, Vg, Ča, Ve, and Za. Further, δ13C was higher in Ot compared to Vg, Ča, and Ve, higher in To and DL compared to Vg and Ča, and higher in Sk compared to Vg (p < 0.01) (Table 5).
Asc pools, as well as the redox state of Asc, did not differ between the ecotypes in the drought treatment in leaves or fine roots. Similar results were obtained for Pi in the leaves. However, during the drought treatment, Pi was significantly higher in the roots of Se saplings (the second-Pi-poorest habitat) compared to all other ecotypes except for To, where intermediate Pi concentrations were found (Figure 1). Since the DW/FW ratios and, hence, the water statuses of the saplings did not differ between the ecotypes in the drought treatment, all beech ecotypes seem to be adapted to drought by specific strategies. To elucidate these strategies, the physiological parameters determined were compared.

3.6. Correlation Analyses for the Drought-Stressed Conditions

3.6.1. Pimin and Piorg Control Nutrients and Asc in Drought-Treated Saplings

While in well-watered plants, total N and the C/N ratios in leaves and fine roots were correlated with Pi in the soil in the habitats of origin, these parameters did not show significant correlations in the drought treatment (Figure 2). Instead, total C in leaves and fine roots correlated significantly with soil properties in the origin habitats. As observed in the well-watered treatment, Pimin and Piorg were the most important variables in determining the nutrient concentrations and the Asc redox states in the leaves and fine roots in the drought treatment. In the leaves of drought-stressed saplings, δ13C was negatively correlated with Pimin and Piorg, while foliar Pi and total C contents were negatively related to Piorg. In the fine roots, both Pi and δ13C were negatively correlated with Pimin and Piorg. Additionally, total C and total Asc contents were negatively correlated with Piorg.

3.6.2. Climatic Parameters Hardly Explain Nutrient and Asc Contents in Drought-Treated Saplings

During drought stress, climatic factors in the habitats of origin had a greater influence on the physiological parameters of beech saplings compared to well-watered conditions. In the leaves, the redox state of Asc and δ13C correlated negatively with elevation, while red Asc was positively related to elevation (Pearson’s P and levels of significance are given in Table S3b). Further, the redox state of Asc and δ13C were positively correlated with MAT and MWMT. MCMT positively influenced Pi content and δ13C abundance in the leaves. Furthermore, total Asc and red Asc in leaves were negatively related to TD during the drought treatment. Red Asc and the redox state of Asc positively correlated with AHM (see Appendix A). Eref (see Appendix A) positively affected the redox state of Asc and δ13C in the leaves upon drought.
In the fine roots, Pi was positively related to MAT, MWMT, and MCMT in the drought treatment. Further, δ13C in the fine roots was negatively related to AHM upon drought. During water deprivation, TD had a strong negative effect on δ13C in fine roots. Across the entire dataset, MAP only had a weak positive influence on δ13C but a negative effect on total C content in the fine roots of saplings exposed to drought. As observed for the well-watered treatment, these results show that Piorg and Pimin in the habitats of origin are important factors for explaining differences between beech saplings from different forest sites in Croatia in response to drought compared to climatic parameters.

3.7. Significance of Drought for Physiological Parameters in Beech Saplings

In order to visualize the effects of drought on the beech saplings, fold changes between well-watered and drought treatments were calculated (Table 6). In general, the effects of drought on the physiological parameters of beech saplings were low, and significant differences were scarcely observed. However, the anti-oxidative system of the leaves and fine roots was more influenced by drought than by nutrient contents.

3.7.1. Effects of Drought in Leaves: Redox State of Asc Most Affected

Drought stress affected the nutrient contents less than the antioxidative system in the leaves of the beech saplings (Table 6). While total Asc increased for Vg and red Asc increased for Vg and DL, DHA decreased upon water deprivation for Vg, DL, and Za. The redox state of Asc was the leaf parameter most affected by drought. It decreased in the leaves of Vd, Vg, Ve, Sk, DL, and Za. While foliar Pi and total N were not affected by drought, total C decreased for Vd, Ča, and DL. The decrease in total C observed for DL resulted in an increased foliar C/N ratio. During the drought, foliar δ13C significantly increased for Ve and Sk.

3.7.2. Effects of Drought on Fine Roots: The Redox State of Asc Most Affected

As observed for the leaves, the effect of drought on fine roots was low, and the anti-oxidative system was more affected than nutrient contents (Table 6). During drought, total Asc decreased in the fine roots of Ča, and DHA decreased for Vd and Ča. Similar to leaves, the redox state was the parameter most affected in roots by drought and decreased for Vd, Ča, Ot, To, and Se. While foliar Pi was unaffected by drought, Pi in the fine roots increased during drought for Se and To, but, due to a high standard deviation, the latter was not statistically significant. This finding is highly remarkable, since the habitats of these ecotypes were classified as the two P-poorest included in the present study (Table 2). Next to Pi, the total N of fine roots was also affected by drought. It decreased in the fine roots of Vg but increased for Za. Total C increased in the fine roots of Ča and Se in the drought treatment. The C/N ratios in the fine roots of Vg and To increased, while δ13C in the fine roots of Vg decreased upon drought.

3.8. Pi Availability in the Soil in the Habitat of Origin Explains Physiological Responses to Drought

3.8.1. The Sensitivity of Ecotypes to Drought Is Driven by Pi in the Soil in the Habitat of Origin

In order to elucidate which parameter in the habitat of origin explains the observed effects of drought on physiological parameters (Table 6), calculated fold changes were subjected to correlation analyses. Despite foliar δ13C exhibiting only scarce sensitivity to drought, the observed changes between well-watered and drought-treated plants were correlated with Pi in the soil in the habitat of origin. Fold changes of foliar δ13C across the dataset (Table 6) correlated positively with Pimin, Piorg, and TD (correlation coefficients and levels of significance are given in Table S4). Thus, the more Pi available in the soil in the habitat of origin, the higher was the δ13C abundance found in the leaves upon drought. In the fine roots, the number of significant correlations (15 in the fine roots vs. 3 in leaves) showed that growth conditions in the habitat of origin had a strong influence on the Pi contents of the saplings (8 out of 15 significant correlations). The fold changes of Pi in the fine roots were the most strongly negatively correlated with Pimin, Piorg, NHorg, and mean summer precipitation (MSP). Thus, the richer the soil in Pimin, Piorg, and NHorg and the more precipitation in summer, the more severe the decline in fine root Pi, or vice versa, and the poorer the soil in Pimin, Piorg, and NHorg and the drier the summers, the stronger the increase in fine root Pi during drought. Furthermore, fold changes of Pi in the fine roots were positively correlated with MCMT, MAT, Eref, and MWMT. While fold changes of N contents were positively correlated with NHmin, fold changes of the C/N ratio were positively correlated with MAT and negatively related to Piorg. In addition, δ13C in the fine roots was positively correlated with MAP. Obviously, in addition to soil parameters, climatic factors, especially parameters related to temperature and humidity, also determine the physiological responses to drought.

3.8.2. The Strength of Physiological Responses of Ecotypes to Drought Is Dependent on Soil Pi in the Habitat of Origin

To summarize the current findings, the number of significant changes reported in Table 6 was used as an indicator for the strength of ecotype responses to drought. These numbers amounted to Ča (4,3,1), Vg (7,4,3), Sk (2,2,0), DL (5,5,0), Ve (2,2,0), Za (2,1,1), Vd (4,2,2), Ot (1,0,1), Se (2,0,2), and To (2,0,2) (x, y, z: x = total significant changes, y = significant changes in leaves, z = significant changes in fine roots). The previous finding that Pi in the soil in the habitat of origin drives the response to drought was confirmed by PCA analyses based on correlation matrices. In these PCA plots, the number of significant changes (termed “observations”) for each ecotype clustered mainly with Pimin and Piorg (and NHorg) for total changes, changes in the leaves, and, to a lower extent, also for changes in the fine roots (Figure 3).
Since PCA analyses were conducted based on correlation matrices, correlation analyses were used to verify the results presented in Figure 3. Indeed, correlation analyses confirmed Pi in the soil as the main driver of the saplings´ responses to drought in the present study. Furthermore, correlation analyses ruled out that different soil types found in the saplings´ natural habitats were responsible for the observations in the present study (for details, see Table S1a,b).

3.9. Do Genetic Relationships between Beech Ecotypes Explain the Dependencies of Physiological Parameters on Growth Conditions in the Habitats of Origin?

The significance of genetic differences between ecotypes for the dependencies of physiological parameters on growth conditions in their origin habitats was investigated using EST-SSR analyses. All investigated EST-SSRs were polymorphic, with a total number of alleles between 5 and 19, and locus FcC00483 possessed the lowest number of alleles (Table S5). The observed heterozygosity (Ho) and genetic diversity (He) were generally high, with locus FcC00483 showing the lowest (0.020 to 0.086) and locus FcC00927 the highest values (0.686 to 0.919) (Table S5). The population Vd was the most variable, while the population Sk showed the lowest genetic variation (Table S6).
The genetic distances among populations were relatively small, with the population Sk most differentiated from populations Vg and Ča, as shown by the PCA (Figure 4). The PCA indicated two groups of populations, while To differed distinctly from all other populations. Apparently, the Croatian populations did not show high genetic differentiation between each other. Nevertheless, a spatial genetic structuring was observed, with the eastern populations (Vd, Vg, Ča and Ve) being more similar to each other than the populations in the western part of the country.
Beech ecotypes of cluster 1 (Sk, Ot, and Za—dotted line) colonized forest sites with the highest MAP and MSP but the lowest AHM, SHM (see Appendix A), CMD, and Eref and, thus, the wettest habitats. Beech ecotypes in this cluster only scarcely reacted to drought (Table 6). In contrast, beech ecotypes in cluster 2 (DL, Vd, Ča, Vg, Ve, and Se—solid line) colonized the drier habitats, specifically the habitats lower in MAP and MSP compared to cluster 1. Furthermore, AHM, SHM, CMD, and Eref were higher compared to cluster 1. In cluster 2, Ve was the ecotype with the lowest MAP and MSP but the highest AHM, SHM, Eref, CMD, and TD (Table 1). Physiological responses to drought were frequently observed for ecotypes in cluster 2 (Table 6). For Ve, unlike all other members of cluster 2, the physiological responses to drought stress were limited (Table 6). Additionally, Se, genetically closely related to Ve, revealed only a slight physiological response to drought (Table 6). The ecotype To that colonized the P-poorest habitat did not cluster with any other ecotypes. Clusters 1 and 2 did not show explicit preferences in terms of soil properties, in contrast to a clear separation by climatic variables (Table 1 and Table 2). However, when the clusters formed in Figure 4 were transferred to a map of Croatia, they reflected a separation by the spatial origin of the ecotypes. Ecotypes of cluster 1 were located in northwestern and southwestern Croatia, while members of cluster 2 were found in northeastern and southeastern Croatia. Only Se (cluster 2) deviated from this spatial pattern and was found in southwestern Croatia, near the Mediterranean Sea. To, neither a member of cluster 1 nor of cluster 2, was geographically isolated and originated from Central Croatia (Figure 4). These results indicate the importance of recolonization routes after the last ice age and afforestation practices.

4. Discussion

Do genetic relationships between ecotypes explain the responses of beech saplings to drought?
The colonization of Europe by beech trees after the last ice age resulted in the development of ecotype clusters, as emphasized by PCA analyses in the present study (Figure 4). Two main clusters were identified, one including DL, Vd, Ča, Vg, Ve, and Se that preferred comparably dry habitats, and another including Ot, Za, and Sk that preferred wet habitats. Only To did not fit into this concept and obviously was not genetically related to cluster 1 or cluster 2.
Cluster formation has been suggested as a driver of the response of beech trees to drought [28]. In the present study, cluster membership explains some but not all of the observations reported in Table 6. Specifically, ecotypes in cluster 1 (Ot, Sk, and Za) showed only a slight response to drought, while DL, Vd, Ča, and Vg (cluster 2) showed much stronger responses. Beech ecotypes originating from relatively dry ecosystems (cluster 2) established an antioxidative system well-adapted to drought, while beech ecoytypes from wet ecosystems (cluster 1) did not. Still, two exceptions were observed: Se and Ve (cluster 2) were genetically closely related to each other but scarcely reacted to drought, despite both ecotypes originating from extremely dry ecosystems. Together with Vd and Ča, the ecotypes Se and Ve originated from P-poor ecosystems (Table 2 and Table S1b), highlighting the significance of P availability in the soil for the responses of beech ecotypes to drought. Apparently, Pimin as well as Piorg (and NHorg) constitute drivers of the drought sensitivity of beech saplings, while NOorg, as well as both N pools in the mineral soil, climatic factors, and elevation of the forest habitats, were of minor importance for the observed responses to drought stress. These results support the view that population structure, adaptive potential, and reaction to stress are results of both past and present processes. Thus, colonization routes, migration events, and gene flow are responsible for the ability of beech populations to cope with stress situations such as drought. Beech, like most tree species, is characterized by long-distance pollen-mediated gene flow, which could promote adaptive evolution to novel environments [50,51].
Does the present study provide evidence for drought-adapted ecotypes in Croatia?
For the present study, saplings were collected from natural forests. Despite careful collection of the saplings according to height, age, etc., variability was higher than if the plants had been taken from a nursery. Therefore, the small differences in biomass observed cannot be taken as characteristic of drought-sensitivity or -resistance. However, absolute and relative growth did not differ between the ecotypes, indicating that the drought stress applied did not affect tree growth in the present study. Thus, physiological responses to drought have to provide hints for drought-sensitivity or -resistance.
Drought-adapted beech ecotypes have previously been described at the southern distribution limit of the species, e.g., in Greece. These beeches showed morphological adaptation of leaves to xeric habitats [52] and a strong reaction of the antioxidative system upon drought [29] as adaptation strategies. Apparently, the establishment of a highly efficient antioxidative system constitutes the most important physiological adaptation of beech saplings to drought. In the present study, saplings collected at forest sites with high soil Pi and dry growth conditions, e.g., DL, Vd, Ča, and Vg, showed strong reactions of the antioxidative system in the leaves upon water deprivation, indicating that these ecotypes were the ones best-adapted to drought.
In a previous study that included Croatian beech saplings [27], Za was characterized as well-adapted to drought, since the reaction of the antioxidative system was comparable to Greek beech ecotypes. In the same study, Go (Ot in the present study) did not exhibit any reaction to drought. The present study partially confirms these results: Ot only rarely responded to drought, whereas Za’s antioxidative system showed a weak but significant response, as previously observed [27]. Thus, Za was characterized as an ecotype adapted to drought, probably due to its close genetic relationship to beeches from Greece and Southern Germany [29]. In the present (Table 6) and in a previous study [29], N in the fine roots of Za saplings increased upon drought, probably due to the formation of osmolytes such as proline [53,54]. This increase can be considered an additional drought-adaptation strategy to the upregulation of the antioxidative system. Nonetheless, Za belonged to cluster 1 (Figure 4), which colonized rather wet habitats and only barely responded to drought.
δ13C can become less negative in leaves upon drought due to a reduced CO2 influx caused by stomatal closure [55] and, therefore, is frequently used to identify drought stress (e.g., [29]). In the present study, such an increase in δ13C in leaves and fine roots was hardly observed and was significant only for leaves of Sk and Ve. Since the antioxidative systems of these ecotypes showed only weak reactions to drought, the increase in foliar δ13C of Sk and Ve suggests that these ecotypes are not well-adapted to drought. Analyses of δ13C in phloem-transported sugars might provide a more powerful tool to test this assumption in future studies.
In the fine roots of Vg, the N content decreased upon drought (Table 6), indicating a disturbance to N nutrition. Such a disturbance has previously been observed by Dannemann et al. [3], including reduced NO3 acquisition during drought as a consequence of impaired ecosystem N turnover. This ecosystem effect of drought was discussed as the major reason for the strong decline in beech from Croatian forests until 2080, as predicted via a modelling approach [3]. Consequently, Vg can be considered less well-adapted to drought than DL, Vd, and Ča.
How does Pi in the soil control the reaction of leaves to drought stress?
Linear regression analyses identified Pimin and Piorg in the habitat of origin as drivers of the observed responses of beech saplings to drought (Figure 4 and Table S1a,b). Especially saplings originating from the southwestern distribution limit of the study area (Figure 4, Table 2), i.e., DL, Ča, and Vg, were comparably Pi- and mainly Piorg-rich and showed strong reactions to drought. Since growth conditions were equal for all saplings, these ecotype-specific responses to drought must have been triggered by adaptation strategies developed in the natural habitats [23,56,57,58]. The nature of these most likely genetically determined adaptation strategies requires further study. For such studies, beech saplings of the To and Se ecotypes, originating from the P-poorest habitats, may be particularly useful, because these saplings increased Pi in the fine roots upon drought.
In the present study, foliar C contents were influenced by drought. In leaves of DL, Vd, and Ča, C contents decreased, indicating respiratory C loss during drought stress. Respiratory Pi supply might be of high relevance in P-rich environments and of low significance in low-P environments [59]. Consequently, DL, Vd, and Ča ecotypes alleviating oxidative stress by efficient ROS scavenging via the antioxidative system might have consumed additional energy by respiration and, thereby, might have recycled bound Pi in order to facilitate these processes. The strong response of the antioxidative system in DL, Vd, and Ča ecotypes may also be a consequence of reduced P uptake upon drought. The concept of [60] on P nutrition assumes that reduced soil moisture upon drought causes a decline in P mineralization and diffusion and, hence, a reduction in plant-available P (and N) pools. Reduced Pi acquisition might have reduced C assimilation [61,62] and stimulated respiratory processes. Further experiments, including the measurement of leaf gas exchange, are required to test this hypothesis.
Recent publications showed that beech saplings from P-rich habitats took up P in summer (when the drought experiment took place in the present study), while saplings from P-poor habitats took up P in spring (when saplings were well-watered in the present experiment) and in autumn [56,58]. Although P acquisition was not determined in the present experiments, evidence for reduced P acquisition can be adduced from the finding that, upon drought, Pi in the fine roots was negatively correlated with soil Pimin and Piorg and, furthermore, Pi in the leaves was negatively correlated with Piorg in the soil. Thus, the more Pi in the soil, the less Pi in tree tissues during the drought treatment. A similar relationship was not observed in the well-watered treatment. In summer, Pi contributes ~ 40% of total phosphorus in the leaves of deciduous trees [23,24] and constitutes the most variable P pool in plants [63]. Thus, to investigate the effect of drought on the P nutrition of beech saplings, P fractions, such as sugar-P and P-lipids, that are reported to decrease in plants upon P deficiency [62,64] should be analyzed in future studies. Piorg rather than Pimin in the soil in the habitat of origin was found to be the main driver of the responses of beech saplings to drought stress. The organic soil layer is an important source of P for beech trees [26,49,65]. If an inhibited release of Pi from Porg fractions [32,66] is the key step that determines the reaction of beech saplings to drought, future studies under controlled field conditions are required.
In the drought treatment, total C in the fine roots was higher the lower the Piorg in the soil in the habitats of origin (Figure 2). A similar result was not obtained in the well-watered treatment. Thus, preferential investment of C in the rooting system in order to improve soil exploitation [67,68], especially for ecotypes from P-poor systems, is highly indicated. The finding that Piorg was the driver for this C investment emphasizes the high significance of the organic soil layers for P nutrition in beech [66]. Despite this relationship, enhanced root biomass formation or increased root shoot ratios were not observed. Probably, the duration of the experiment should be longer for such observations. However, the finding that the fine roots of saplings from the three P-poorest systems (Ot, Se, and To) tended to be more enriched in 13C in the drought treatment compared to the other ecotypes studied indicates enhanced C allocation to belowground biomass. The latter may also be concluded from the high total N contents in the fine roots of saplings from P-poor sites that may be used for the synthesis of osmolytes, such as proline [53,54], and/or Pi transporters [69]. Therefore, it appears feasible that To and Se saplings were able to switch from low-affinity uptake to high-affinity uptake of Pi by the roots [69] and that this enabled the plants to acquire scarce P in the soil.
Only Se and To saplings showed a strong increase in Pi (significant for Se only due to a high standard deviation for To) in the fine roots upon drought. At first glance, this observation is contradictory to what was observed by Peuke and Rennenberg [28], where P in the fine roots decreased upon drought. Studies by Yang et al. [57] and Hofmann et al. [49] showed that saplings from a P-rich site exhibited faster growth rates and higher P concentrations in leaves, bark, wood, fine roots, and coarse roots compared to saplings from a P-poor site. P fertilization decreased P resorption from senescent leaves and phosphatase activity in the rhizosphere of saplings at the P-poor but not at the P-rich site. These findings indicate that beech saplings from P-poor habitats can adapt their P-uptake strategies. Therefore, the observed response of the rooting system mainly to Se and To may constitute an adaptation to low P in the soil in the natural habitat or origin of the beech saplings.

5. Conclusions

The study presented provided a novel approach to test the performances of beech saplings in response to experimentally applied summer drought in a common-garden experiment. For the first time, soil parameters from the natural habitats of origin were applied to identify drought-adapted beech ecotypes. The reaction of the antioxidative system to drought was shown to differentiate well the adapted and not-adapted beech saplings. The reaction upon drought was strongest for saplings originating from P-rich ecosystems and weakest for saplings originating from P-poor ecosystems. Hence, P availability in the soil was identified as the key factor determining the response of beech saplings to drought. Thus, the interaction of genetic, climatic, and soil-born parameters seems to explain the responses of beech to drought (hypotheses a, b, c, and e, partially accepted). Two main strategies were observed for coping with drought stress: beech saplings from P-rich (dry) ecosystems alleviated oxidative stress by activating the antioxidative system in the leaves; beech saplings from P-poor (dry and wet) ecosystems appeared to respond by changes in root morphology [67,68] in order to maintain P-nutrition (hypothesis d, accepted). Based on the present results, Vg and DL ecotypes can be considered well-adapted to drought. This assumption is based on the strong reaction of the antioxidative system (Table 6) and the origin of the comparably dry and P-rich soil.

Supplementary Materials

The following supporting information can be downloaded at: https://www.mdpi.com/article/10.3390/f13101683/s1, Table S1a: Categorization of habitats into nutrient rich or poor ecosystems. Minimum values (min), 1st quartile (Q1), the median, 3rd quartile (Q3) and maximum values (Max) were calculated for soil properties given in Table 2 of the main manuscript. These indicators were used to categorize the beech forests in to low, moderately low, moderately high and high in soil NO3-N, NH4+-N and Pi availability separately for both soil layers. Table S1b: Categorization of beech ecotypes into low, moderately low, moderately high, and high supply of soil nutrients according to Table S1a. The bold line represents the median. Table S2: DW/FW in leaves and fine roots of watered beech seedlings in comparison to DW/FW of seedlings grown at water deprivation. A significant increase is considered an indicator of drought stress in the present study, p represents results of non-parametric Mann-Whitney-Tests; * p < 0.05. Table S3a: Correlation coefficients (Parsons’s P) of physiological parameters and external growth conditions at the seedlings habitat determined for leaves (top) and fine roots (bottom) in the well- watered treatment: MAT (mean annual temperature), MCMT (mean coldest month temperature), and TD (temperature difference between MWMT and MCMT). Table S3b: Correlation coefficients (Parsons’s P) of physiological parameters and external growth conditions at the seedlings habitat determined for leaves (top) and fine roots (bottom) in the drought treatment: MAT (mean annual temperature), MCMT (mean coldest month temperature), and TD (temperature difference between MWMT and MCMT or continentality), AHM (annual heat/moisture index), Eref (Hargreaves reference evaporation), and MAP (mean annual precipitation). Table S4: Correlation coefficients (Parsons’s P) of significant fold changes of physiological parameters in leaves and fine roots upon drought (Table 6 in the main manuscript). Physiological parameters were correlated to growth conditions at the seedlings habitat. Table S5: Genetic diversity parameters for the studied microsatellites: AT (total number of alleles), NE (effective number of alleles), HO (observed heterozygosity) and HE (expected heterozygosity). Table S6: Population genetic parameters of the EST microsatellites for the six studied provenances: N (number of studied individuals), AT (total number of alleles), NE (effective number of alleles), HO (observed heterozygosity), and HE (expected heterozygosity). Table S7: Nei’s genetic distances between the ecotypes.

Author Contributions

Conceptualization, N.Ć., A.D., H.R. and M.I.; Data curation, S.B., A.D., F.N., M.E., M.D. and S.R.; Formal analysis, S.B., A.D., F.N., M.D. and S.R.; Funding acquisition, M.E., H.R. and M.I.; Investigation, N.Ć., S.B., A.D., M.E. and M.I.; Methodology, N.Ć., A.D., H.R. and M.I.; Resources, A.D., H.R. and M.I.; Validation, A.D., H.R. and M.I.; Writing—original draft, S.B., A.D. and F.N.; Writing—review and editing, N.Ć., S.B., A.D. and H.R. All authors have read and agreed to the published version of the manuscript.

Funding

This research was funded by the Croatian Science Foundation under project no. IP-2013-11-8131, and CH was financially supported by the Deutsche Forschungsgemeinschaft (DFG) under contract no. HE3003/6-2.

Data Availability Statement

Not applicable.

Acknowledgments

The authors thank Ramona Skozilas for technical support.

Conflicts of Interest

The authors declare no conflict of interest. The funders had no role in the design of the study; in the collection, analyses, or interpretation of data; in the writing of the manuscript; or in the decision to publish the results.

Appendix A

Aridity indices: AHM = annual heat/moisture index (MAT + 10)/(MAP/1000)),
CMD = Hargreaves climatic moisture deficit, Eref = Hargreaves reference evaporation, SHM = summer heat/moisture index ((MWMT)/(MSP/1000)), TD = temperature difference between MWMT and MCMT, or continentality (°C).

References

  1. Durrant, T.H.; de Rigo, D.; Caudullo, G. Fagus sylvatica in Europe: Distributon, habitat, usage and threats. In European Atlas of Forest Tree Species; San-Miguel-Ayanz, J., de Rigo, D., Caudullo, G., Durrant, T.H., Mauri, A., Eds.; The Publications Office of the European Union: Luxembourg, 2016. [Google Scholar]
  2. Ellenberg, H. Vegetation Mitteleuropas mit den Alpen in Ökologischer, Dynamischer und Historischer Sicht, 5th ed.; Ulmer: Stuttgart, Germany, 1996. [Google Scholar]
  3. Dannenmann, M.; Bimüller, C.; Gschwendtner, S.; Leberecht, M.; Tejedor, J.; Bilela, S.; Gasche, R.; Hanewinkel, M.; Baltensweiler, A.; Kögel-Knabner, I.; et al. Climate Change Impairs Nitrogen Cycling in European Beech Forests. PLoS ONE 2016, 11, e0158823. [Google Scholar] [CrossRef] [PubMed] [Green Version]
  4. Pilaš, I.; Medved, I.; Medak, J.; Tadić, M.P.; Medak, D. Ecological, Typological Properties and Photosynthetic Activity (FAPAR) of Common Beech (Fagus sylvatica L.) Ecosystems in Croatia. South-East Eur. For. 2017, 8, 67. [Google Scholar] [CrossRef] [Green Version]
  5. Gračan, J. Achievements in the breeding of common beech in Croatia. In Common Beech (Fagus sylvatica L.) in Croatia. Matić, Slavko (EIC); Academy of Forestry Sciences: Zagreb, Croatia, 2003; pp. 278–325. [Google Scholar]
  6. IPCC. Climate Change: The Physical Science Basis. In Contribution of Working Group I to the Fifth Assessment Report of the Intergovernmental Panel on Climate Change; Stocker, T.F., Qin, D., Plattner, G.-K., Tignor, M., Allen, S.K., Boschung, J., Nauels, A., Xia, Y., Bex, V., Midgley, P.M., Eds.; Cambridge University Press: Cambridge, UK; New York, NY, USA, 2013. [Google Scholar]
  7. Glavač, V. Contribution to recognizing ecophysiological properties of beech in the light of recent forest damage. In Common Beech (Fagus sylvatica L.) Croatia; Matić, S., Ed.; Academy of Forestry Sciences: Zagreb, Croatia, 2003; pp. 170–2012. [Google Scholar]
  8. Ivanković, M.; Bogdan, S.; Božič, G. Varijabilnost visinskog rasta obične bukve (Fagus sylvatica L.) u testovima provenijencija u Hrvatskoj i Sloveniji. Šumarski List. 2008, 132, 529–541. [Google Scholar]
  9. Ivanković, M.; Popović, M.; Katičić, I.; Wuehlisch, G.V.; Bogdan, S. Quantitative genetic variation of European beech (Fagus sylvatica L.) provenances from the Southeastern Europe. Šumarski List. 2011, 135, 25–36. [Google Scholar]
  10. Stojnić, S.; Orlović, S.; Ballian, D.; Ivanković, M.; Šijačić-Nikolić, M.; Pilipović, A.; Bogdan, S.; Kvesić, S.; Mataruga, M.; Daničić, V.; et al. Provenance by site interaction and stability analysis of European beech (Fagus sylvatica L.) provenances grown in common garden experiments. Silvae Genet. 2015, 64, 133. [Google Scholar] [CrossRef] [Green Version]
  11. Ivanković, M.; Bogdan, S.; Littvay, T. Genetic variation of flushing and winter leaf retention in European Beech provenance test in Croatia. In Proceedings of the 8th IUFRO International Beech Symposium Organized by IUFRO Working Party 1.01.07 “Ecology and Silviculture of Beech”, Hokkaido, Japan, 8–13 September 2008; Kazuhiko, T., Palle, M., Sagheb-Talebi, K., Eds.; Nanae: Hokkaido, Japan, 2008; pp. 28–30. [Google Scholar]
  12. Mátyás, C.; Božić, G.; Gömöry, D.; Ivanković, M.; Rasztovits, E. Transfer analysis reveals macroclimatic adaptation of European beech (Fagus sylvatica L.). Acta Silv. Lignaria Hung. 2009, 5, 47–62. [Google Scholar]
  13. Mátyás, C.; Bozic, G.; Gömöry, D.; Ivankovic, M.; Rasztovits, E. Juvenile growth response of European beech (Fagus sylvatica L.) to sudden change of climatic environment in SE European trials. iForest-Biogeosci. For. 2009, 2, 213–220. [Google Scholar] [CrossRef] [Green Version]
  14. Bogunović, S.; Bogdan, S.; Lanšćak, M.; Ćelepirović, N.; Ivanković, M. Use of a Common Garden Experiment in Selecting Adapted Beech Provenances for Artificial Stand Restoration. South-East Eur. For. 2020, 11, 1–10. [Google Scholar] [CrossRef]
  15. Gavranović, A.; Bogdan, S.; Lanšćak, M.; Čehulić, I.; Ivanković, M. Seed Yield and Morphological Variations of Beechnuts in Four European Beech (Fagus sylvatica L.) Populations in Croatia. South-East Eur. For. 2018, 9, 17–27. [Google Scholar] [CrossRef] [Green Version]
  16. Ciais, P.; Reichstein, M.; Viovy, N.; Granier, A.; Ogée, J.; Allard, V.; Aubinet, M.; Buchmann, N.; Bernhofer, C.; Carrara, A.; et al. Europe-wide reduction in primary productivity caused by the heat and drought in 2003. Nature 2005, 437, 529–533. [Google Scholar] [CrossRef]
  17. Gessler, A.; Keitel, C.; Kreuzwieser, J.; Matyssek, R.; Seiler, W.; Rennenberg, H. Potential risks for European beech (Fagus sylvatica L.) in a changing climate. Trees 2006, 21, 1–11. [Google Scholar] [CrossRef]
  18. Rennenberg, H.; Seiler, H.; Matyssek, R.; Gessler, A.; Kreuzwieser, J. Die Buche (Fagus sylvatica L.)—Ein Waldbaum ohne Zukunft im südlichen Mitteleuropa? Allg. Forst Jagdztg. 2004, 10/11, 210–224. [Google Scholar]
  19. Hanewinkel, M.; Cullmann, D.A.; Schelhaas, M.-J.; Nabuurs, G.-J.; Zimmermann, N.E. Climate change may cause severe loss in the economic value of European forest land. Nat. Clim. Chang. 2013, 3, 203–207. [Google Scholar] [CrossRef]
  20. Kramer, K.; Degen, B.; Buschbom, J.; Hickler, T.; Thuiller, W.; Sykes, M.T.; de Winter, W. Modelling exploration of the future of European beech (Fagussylvatica L.) under climate change—Range, abundance, genetic diversity and adaptive response. For. Ecol. Manag. 2010, 259, 2213–2222. [Google Scholar] [CrossRef]
  21. Rennenberg, H.; Dannenmann, M. Nitrogen Nutrition of Trees in Temperate Forests—The Significance of Nitrogen Availability in the Pedosphere and Atmosphere. Forests 2015, 6, 2820–2835. [Google Scholar] [CrossRef]
  22. Simon, J.; Dannenmann, M.; Pena, R.; Gessler, A.; Rennenberg, H. Nitrogen nutrition of beech forests in a changing climate: Importance of plant-soil-microbe water, carbon, and nitrogen interactions. Plant Soil 2017, 418, 89–114. [Google Scholar] [CrossRef]
  23. Netzer, F.; Schmid, C.; Herschbach, C.; Rennenberg, H. Phosphorus-nutrition of European beech (Fagus sylvatica L.) during annual growth depends on tree age and P-availability in the soil. Environ. Exp. Bot. 2017, 137, 194–207. [Google Scholar] [CrossRef]
  24. Netzer, F.; Herschbach, C.; Oikawa, A.; Okazaki, Y.; Dubbert, D.; Saito, K.; Rennenberg, H. Seasonal Alterations in Organic Phosphorus Metabolism Drive the Phosphorus Economy of Annual Growth in F. sylvatica Trees on P-Impoverished Soil. Front. Plant Sci. 2018, 9, 723. [Google Scholar] [CrossRef] [PubMed]
  25. Lang, F.; Bauhus, J.; Frossard, E.; George, E.; Kaiser, K.; Kaupenjohann, M.; Krüger, J.; Matzner, E.; Polle, A.; Prietzel, J.; et al. Phosphorus in forest ecosystems: New insights from an ecosystem nutrition perspective. J. Plant Nutr. Soil Sci. 2016, 179, 129–135. [Google Scholar] [CrossRef]
  26. Lang, F.; Krüger, J.; Amelung, W.; Willbold, S.; Frossard, E.; Bünemann, E.K.; Bauhus, J.; Nitschke, R.; Kandeler, E.; Marhan, S.; et al. Soil phosphorus supply controls P nutrition strategies of beech forest ecosystems in Central Europe. Biogeochemistry 2017, 136, 5–29. [Google Scholar] [CrossRef] [Green Version]
  27. Netzer, F.; Thöm, C.; Celepirovic, N.; Ivankovic, M.; Alfarraj, S.; Dounavi, A.; Simon, J.; Herschbach, C.; Rennenberg, H. Drought effects on C, N, and P nutrition and the antioxidative system of beech seedlings depend on geographic origin. J. Plant Nutr. Soil Sci. 2016, 179, 135–150. [Google Scholar] [CrossRef]
  28. Peuke, A.D.; Rennenberg, H. Carbon, nitrogen, phosphorus, and sulphur concentration and partitioning in beech ecotypes (Fagus sylvatica L.): Phosphorus most affected by drought. Trees 2004, 18, 639–648. [Google Scholar] [CrossRef]
  29. Dounavi, A.; Netzer, F.; Celepirovic, N.; Ivanković, M.; Burger, J.; Figueroa, A.; Schön, S.; Simon, J.; Cremer, E.; Fussi, B.; et al. Genetic and physiological differences of European beech provenances (F. sylvatica L.) exposed to drought stress. For. Ecol. Manag. 2016, 361, 226–236. [Google Scholar] [CrossRef]
  30. Kempf, M.; Konnert, M. Distribution of genetic diversity in Fagus sylvatica at the north-eastern edge of the natural range. Silva Fenn. 2016, 50, 1663. [Google Scholar] [CrossRef]
  31. Rose, L.; Leuschner, C.; Köckemann, B.; Buschmann, H. Are marginal beech (Fagus sylvatica L.) provenances a source for drought tolerant ecotypes? Eur. J. For. Res. 2009, 128, 335–343. [Google Scholar] [CrossRef] [Green Version]
  32. Plassard, C.; Dell, B. Phosphorus nutrition of mycorrhizal trees. Tree Physiol. 2010, 30, 1129–1139. [Google Scholar] [CrossRef] [Green Version]
  33. Bieleski, R.L. Phosphate Pools, Phosphate Transport, and Phosphate Availability. Annu. Rev. Plant Physiol. 1973, 24, 225–252. [Google Scholar] [CrossRef]
  34. Clarkson, D.T.; Hanson, J.B. The Mineral Nutrition of Higher Plants. Annu. Rev. Plant Physiol. 1980, 31, 239–298. [Google Scholar] [CrossRef]
  35. Passioura, J.B. ‘Soil conditions and plant growth’. Plant Cell Environ. 2002, 25, 311–318. [Google Scholar] [CrossRef]
  36. Rausch, C.; Bucher, M. Molecular mechanisms of phosphate transport in plants. Planta 2002, 216, 23–37. [Google Scholar] [CrossRef] [PubMed]
  37. Schachtman, D.P.; Reid, R.J.; Ayling, S.M. Phosphorus Uptake by Plants: From Soil to Cell. Plant Physiol. 1998, 116, 447–453. [Google Scholar] [CrossRef] [PubMed] [Green Version]
  38. Bolte, A.; Czajkowski, T.; Cocozza, C.; Tognetti, R.; De Miguel, M.; Pšidová, E.; Ditmarová, Ĺ.; Dinca, L.; Delzon, S.; Cochard, H.; et al. Desiccation and Mortality Dynamics in Seedlings of Different European Beech (Fagus sylvatica L.) Populations under Extreme Drought Conditions. Front. Plant Sci. 2016, 7, 751. [Google Scholar] [CrossRef] [PubMed] [Green Version]
  39. Cocozza, C.; De Miguel, M.; Pšidová, E.; Ditmarová, L.; Marino, S.; Maiuro, L.; Alvino, A.; Czajkowski, T.; Bolte, A.; Tognetti, R. Variation in Ecophysiological Traits and Drought Tolerance of Beech (Fagus sylvatica L.) Seedlings from Different Populations. Front. Plant Sci. 2016, 7, 886. [Google Scholar] [CrossRef] [PubMed] [Green Version]
  40. Simon, J.; Dannenmann, M.; Gasche, R.; Holst, J.; Mayer, H.; Papen, H.; Rennenberg, H. Competition for nitrogen between adult European beech and its offspring is reduced by avoidance strategy. For. Ecol. Manag. 2011, 262, 105–114. [Google Scholar] [CrossRef]
  41. Loomis, W.; Battaile, J. Plant phenolic compounds and the isolation of plant enzymes. Phytochemistry 1966, 5, 423–438. [Google Scholar] [CrossRef]
  42. Murphy, J.A.; Riley, J.P. A modified single solution method for the determination of phosphate in natural waters. Anal. Chim. Acta 1962, 27, 31–36. [Google Scholar] [CrossRef]
  43. Okamura, M. An improved method for determination of L-ascorbic acid and L-dehydroascorbic acid in blood plasma. Clin. Chim. Acta Int. J. Clin. Chem. 1980, 103, 259–268. [Google Scholar]
  44. Knörzer, O.C.; Burner, J.; Boger, P. Alterations in the antioxidative system of suspension-cultured soybean cells (Glycine max) induced by oxidative stress. Physiol. Plant. 1996, 97, 388–396. [Google Scholar] [CrossRef]
  45. Haberer, K.; Herbinger, K.; Alexou, M.; Rennenberg, H.; Tausz, M. Effects of drought and canopy ozone exposure on antioxidants in the fine roots of mature European beech (Fagus sylvatica). Tree Physiol. 2008, 28, 713–719. [Google Scholar] [CrossRef] [Green Version]
  46. Ueno, S.; Taguchi, J.; Tomaru, N.; Tsumura, J. Development of EST-SSR markers from an inner bark cDNA library of Fagus crenata (Fagacaea). Conserv. Genet. 2009, 10, 1477–1485. [Google Scholar] [CrossRef]
  47. Peakall, R.; Smouse, P.E. genalex 6: Genetic analysis in Excel. Population genetic software for teaching and research. Mol. Ecol. Notes 2006, 6, 288–295. [Google Scholar] [CrossRef]
  48. Schlotter, D.; Schack-Kirchner, H.; Hildebrand, E.E.; von Wilpert, K. Equivalence or complementarity of soil-solution extraction methods. J. Plant Nutr. Soil Sci. 2012, 175, 236–244. [Google Scholar] [CrossRef]
  49. Hofmann, K.; Heuck, C.; Spohn, M. Phosphorus resorption by young beech trees and soil phosphatase activity as dependent on phosphorus availability. Oecologia 2016, 181, 369–379. [Google Scholar] [CrossRef] [PubMed]
  50. Kremer, A.; Ronce, O.; Robledo-Arnuncio, J.J.; Guillaume, F.; Bohrer, G.; Nathan, R.; Bridle, J.R.; Gomulkiewicz, R.; Klein, E.K.; Ritland, K.; et al. Long-distance gene flow and adaptation of forest trees to rapid climate change. Ecol. Lett. 2012, 15, 378–392. [Google Scholar] [CrossRef] [PubMed] [Green Version]
  51. Oddou-Muratorio, S.; Davi, H. Simulating local adaptation to climate of forest trees with a Physio-Demo-Genetics model. Evol. Appl. 2014, 7, 453–467. [Google Scholar] [CrossRef] [PubMed]
  52. Garciaplazaola, J.I.; Becerril, J. Effects of drought on photoprotective mechanisms in European beech (Fagus sylvatica L.) seedlings from different provenances. Trees 2000, 14, 485–490. [Google Scholar] [CrossRef]
  53. Peuke, A.D.; Schraml, C.; Hartung, W.; Rennenberg, H. Identification of drought-sensitive beech ecotypes by physiological parameters. New Phytol. 2002, 154, 373–387. [Google Scholar] [CrossRef]
  54. Rennenberg, H.; Loreto, F.; Polle, A.; Brilli, F.; Fares, S.; Beniwal, R.S.; Gessler, A. Physiological Responses of Forest Trees to Heat and Drought. Plant Biol. 2006, 8, 556–571. [Google Scholar] [CrossRef]
  55. Farquhar, G.D.; Ehleringer, J.R.; Hubick, K.T. Carbon Isotope Discrimination and Photosynthesis. Annu. Rev. Plant Physiol. Plant Mol. Biol. 1989, 40, 503–537. [Google Scholar] [CrossRef]
  56. Spohn, M.; Zavišić, A.; Nassal, P.; Bergkemper, F.; Schulz, S.; Marhan, S.; Schloter, M.; Kandeler, E.; Polle, A. Temporal variations of phosphorus uptake by soil microbial biomass and young beech trees in two forest soils with contrasting phosphorus stocks. Soil Biol. Biochem. 2018, 117, 191–202. [Google Scholar] [CrossRef] [Green Version]
  57. Yang, N.; Zavišić, A.; Pena, R.; Polle, A. Phenology, photosynthesis, and phosphorus in European beech (Fagus sylvatica L.) in two forest soils with contrasting P contents. J. Plant Nutr. Soil Sci. 2016, 179, 151–158. [Google Scholar] [CrossRef]
  58. Zavišić, A.; Polle, A. Dynamics of phosphorus nutrition, allocation and growth of young beech (Fagus sylvatica L.) trees in P-rich and P-poor forest soil. Tree Physiol. 2017, 38, 37–51. [Google Scholar] [CrossRef] [Green Version]
  59. Ellsworth, D.S.; Crous, K.Y.; Lambers, H.; Cooke, J. Phosphorus recycling in photorespiration maintains high photosynthetic capacity in woody species. Plant, Cell Environ. 2015, 38, 1142–1156. [Google Scholar] [CrossRef] [Green Version]
  60. He, M.; Dijkstra, F.A. Drought effect on plant nitrogen and phosphorus: A meta-analysis. New Phytol. 2014, 204, 924–931. [Google Scholar] [CrossRef]
  61. Rychter, A.; Rao, I. Role of Phosphorus in Photosynthetic Carbon Metabolism. In Handbook of Photosynthesis, 2nd ed.; Books in Soils, Plants, and the Environment; Pessarakli, M., Ed.; CRC Press: Boca Raton, FL, USA, 2005. [Google Scholar] [CrossRef]
  62. Warren, C.R. How does P affect photosynthesis and metabolite profiles of Eucalyptus globulus? Tree Physiol. 2011, 31, 727–739. [Google Scholar] [CrossRef] [PubMed] [Green Version]
  63. Veneklaas, E.J.; Lambers, H.; Bragg, J.; Finnegan, P.; Lovelock, C.; Plaxton, W.; Price, C.A.; Scheible, W.-R.; Shane, M.W.; White, P.; et al. Opportunities for improving phosphorus-use efficiency in crop plants. New Phytol. 2012, 195, 306–320. [Google Scholar] [CrossRef] [PubMed]
  64. Lambers, H.; Hayes, P.E.; Laliberté, E.; Oliveira, R.S.; Turner, B.L. Leaf manganese accumulation and phosphorus-acquisition efficiency. Trends Plant Sci. 2015, 20, 83–90. [Google Scholar] [CrossRef] [PubMed] [Green Version]
  65. Zavišić, A.; Nassal, P.; Yang, N.; Heuck, C.; Spohn, M.; Marhan, S.; Pena, R.; Kandeler, E.; Polle, A. Phosphorus availabilities in beech (Fagus sylvatica L.) forests impose habitat filtering on ectomycorrhizal communities and impact tree nutrition. Soil Biol. Biochem. 2016, 98, 127–137. [Google Scholar] [CrossRef]
  66. George, T.S.; Giles, C.D.; Menezes-Blackburn, D.; Condron, L.M.; Gama-Rodrigues, A.; Jaisi, D.; Lang, F.; Neal, A.; Stutter, M.I.; Almeida, D.; et al. Organic phosphorus in the terrestrial environment: A perspective on the state of the art and future priorities. Plant Soil 2017, 427, 191–208. [Google Scholar] [CrossRef]
  67. Lynch, J.P.; Brown, K.M. Topsoil foraging—An architectural adaptation of plants to low phosphorus availability. Plant Soil 2001, 237, 225–237. [Google Scholar] [CrossRef]
  68. Lynch, J.P. Root Phenes for Enhanced Soil Exploration and Phosphorus Acquisition: Tools for Future Crops. Plant Physiol. 2011, 156, 1041–1049. [Google Scholar] [CrossRef] [PubMed] [Green Version]
  69. Chiou, T.-J.; Lin, S.-I. Signaling Network in Sensing Phosphate Availability in Plants. Annu. Rev. Plant Biol. 2011, 62, 185–206. [Google Scholar] [CrossRef]
Figure 1. Asc content, its redox state, and Pi contents in leaves and fine roots of well-watered and drought-stressed beech saplings. Beech habitats on the x-axis are ordered according to total Pi availability in the soil (sum of Pimin and Piorg). The bars show means ± S.D.s of four replicates in the well-watered treatment and five replicates in the drought treatment. Black bars = Pi; grey bars + negative whiskers = red Asc; white bars + negative whiskers = DHA; red line + positive whiskers = total Asc (sum of red Asc and DHA); dashed bars + positive whiskers = Asc redox state. Different capital letters indicate statistically significant differences in foliar total Asc between the ecotypes. Minor letters represent statistically significant differences in foliar DHA between the ecotypes. Ns = not significant. Results were derived from one-way ANOVAs at ** p < 0.01.
Forests 13 01683 g001
Figure 2. Correlation of physiological parameters in leaves (left) and fine roots (right) with Pi and Piorg in the soil in the habitat of origin in well-watered (top) as well as drought-treated beech saplings. The diagrams show the parameters determined in leaves and fine roots and their dependencies on Pimin (black filled circles) and Piorg (red filled circles) in the soil of the respective habitats of 10 Croatian beech forest stands under well-watered conditions (white background) and the drought treatment (grey background). X-axes show Pearson’s correlation coefficients. * p ≤ 0.05; ** p ≤ 0.01; *** p ≤ 0.001. Zero lines are given in blue.
Forests 13 01683 g002
Figure 3. PCA analyses of fold changes of physiological parameters and growth conditions in the natural habitats of the beech saplings analyzed. Red dots and red numbers indicate the total number of significant fold changes upon drought (A), in leaves (B), and in the fine roots (C). Parameters describing growth conditions in the habitats of origin are given in black. The data are taken from Table 6.
Forests 13 01683 g003
Figure 4. PCA based on Nei’s genetic distances among populations. Alleles per locus and population were used for the analysis. Dashed lines represent clusters determined by Nei’s genetic distances (Table S7). The map below the PCA plot shows the origins of the Croatian beech ecotypes. Underlined ecotypes belong to the cluster formed on the right side of the PCA plot. The remaining ecotypes formed a cluster on the left site of the PCA plot. Only To did not cluster with any of the other ecotypes. Ecotypes shown in dark red = P-rich; ecotypes shown in red = moderately P-rich; ecotypes shown in blue = moderately P-poor; ecotypes shown in black = P-poor (Table S1b). Numbers in brackets indicate significant fold changes (Table 6).
Forests 13 01683 g004
Table 1. Climatic conditions and soil types of the 10 beech habitats of origin. Long. (longitude); Lat. (latitude), Elev. (elevation), MAP (mean annual precipitation), MSP (mean summer precipitation), MAT (mean annual air temperature), MWMT (mean warmest month temperature), MCMT (mean coldest month temperature), mm (millimeters), CMD (see Appendix A), °C (degrees Celsius), m (meters). Growth conditions at the sites were gathered from the Forest Management Plan of Croatian Forests Ltd.
Forest SiteAbb.Long.Lat.Elev
(m)
MAP (mm)MSP
(mm)
MAT
(°C)
MWMT
(°C)
MCMT
(°C)
CMDSoil Type
ČaglinČa45.28715817.97337632081739510.320.3−0.5212Eutric Cambisol
Donji LapacDL44.60708915.93717280011574218.318−1.5127Rendzic Leptosol
OtočacOt44.5996815.08256170518966189.419073Rendzic Leptosol
SenjSe44.95194415.063888585.5121247810.119.70.7106Chromic Cambisol
SkradSk45.42194414.91222291217826698.117.8−1.121Rendzic Leptosol
TopuskoTo45.23210615.85488237106846711.121.10.8149Dystric Cambisol
Velika (dore)Vd45.48369517.668177403.59534641020.1−0.7122Dystric Cambisol
Veliki GrđevacVe45.7926317.131775196.579637311.221.40.5237Luvisol
Velika (gore)Vg45.51178317.64547461011655398.918.8−1.637Dystric Cambisol
ZagrebZa45.89540115.945519978.513176166.516.6−3.711Dystric Cambisol
Table 2. Plant available N and Pi in the soil at 10 beech forest sites in Croatia. p indicates results of one-way ANOVAs at p < 0.01. Different minor letters represent statistically significant differences between ecotypes at p < 0.01.
SiteTotal Pi
mg kg−1
Mineral Soil (mg kg dw−1)Organic Layer (mg kg dw−1)
NOminpNHminpPiminpNOorgpNHorgpPiorgp
Ča383 (86)0.3 (0.1)ns6 (4)b151 (21)a3 (1)b71 (20)ns232 (69)a
Vg347 (39)2 (2)7 (3)b165 (36)ab5 (1)b84 (12)182 (32)a
DL314 (35)2 (2)7 (2)b107 (50)ab5 (2)b47 (9)202 (64)ab
Sk308 (65)4 (4)22 (6)a152 (29)ab5 (2)b33 (7)162 (32)a
Za277 (46)7 (8)14 (7)ab128 (31)ab31 (10)a98 (13)149 (80)ab
Ve277 (81)2 (2)6 (6)b153 (24)ab7 (3)ab79 (23)124 (40)ab
Vd257 (71)0.3 (0.3)8 (2)b98 (53)ab4 (2)b46 (13)159 (63)ab
Ot250 (54)4 (2)4 (2)b119 (38)ab20 (5)ab44 (18)131 (27)ab
Se169 (75)1 (1)4 (1)b91 (54)b11 (5)ab35 (6)79 (33)ab
To103 (23)4 (3)5 (3)b46 (17)b2 (0.2)b42 (11)57 (24)b
Table 3. Dry biomass of saplings originating from 10 forest stands in Croatia. The weights (g) of dry biomass (48 h, 60 °C) constitute mean values + S.D.s of four replicates in the well-watered treatment (harvested before water deprivation) and five replicates in the drought treatment (harvested after 29 days of drought exposure). p = results of one-way ANOVA for the well-watered or drought treatments between ecotypes (p < 0.01). Different minor letters represent statistically significant differences between ecotypes at p < 0.01. Beech ecotypes are organized according to decreasing total Pi.
Biomass (g Dry Weight)
SiteWell-WateredWater Deprivation
LeavespStempFine
Roots
pTotalpRoot/
Shoot
pLeavespStempFine RootspTotalpRoot/
Shoot
p
Ča0.3 (0.4)ns2.2 (0.8)ab2.7 (2.0)ab5.2 (3.1)ab1.0 (0.4)ns0.3 (0.2)ns1.5 (0.5)ns2.2 (0.9)ns4.0 (1.6)ns1.2 (0.3)ns
Vg0.1 (0.0)1.1 (0.3)b1.6 (0.6)b2.7 (0.9)bc1.3 (0.3)0.4 (0.1)2.2 (0.4)3.3 (0.3)5.8 (0.2)1.3 (0.3)
DL0.5 (0.3)2.8 (1.6)ab4.1 (1.4)ab7.4 (3.1)abc1.4 (0.4)0.3 (0.1)2.8 (0.7)3.2 (0.6)6.2 (1.0)1.1 (0.3)
Sk0.5 (0.4)4.6 (1.7)a5.2 (2.0)ab10.3 (4.1)a1.0 (0.1)0.5 (0.2)3.3 (1.8)4.1 (2.4)7.9 (4.3)1.0 (0.3)
Za0.8 (0.6)3.1 (0.7)ab4.1 (1.9)ab8.0 (3.1)abc1.0 (0.3)0.4 (0.3)2.0 (0.6)3.6 (1.5)6.1 (2.3)1.5 (0.4)
Ve0.3 (0.2)1.5 (0.4)b2.1 (0.9)ab3.8 (1.5)abc1.2 (0.1)0.6 (0.2)2.6 (0.2)2.8 (1.0)5.9 (1.7)0.9 (0.2)
Vd0.6 (0.4)2.4 (1.0)ab2.6 (1.0)ab5.6 (2.1)abc1.0 (0.4)0.4 (0.2)1.8 (0.6)2.9 (1.6)5.0 (2.2)1.3 (0.3)
Ot0.7 (0.4)2.9 (0.8)ab5.9 (1.9)a9.5 (3.0)ab1.6 (0.1)0.5 (0.7)2.9 (2.1)3.9 (1.9)7.3 (4.6)1.3 (0.3)
Se0.2 (0.2)0.7 (0.2)b1.4 (0.6)b2.5 (1.5)bc0.9 (0.1)0.3 (0.1)1.7 (0.7)2.2 (0.4)4.2 (1.1)1.2 (0.3)
To0.1 (0.0)1.3 (0.8)b1.1 (0.3)ab1.9 (0.6)c1.4 (0.2)0.3 (0.1)1.5 (0.2)2.4 (0.5)4.2 (0.6)1.3 (0.3)
Table 4. Tree heights and absolute and relative height increases of beech saplings. The mean values + S.D.s of five replicates in the well-watered control (2nd harvest) and in the drought treatment are shown. Height start = tree height prior to the onset of 29 day of water deprivation, height end = tree height after 29 days of water deprivation. p = results of one-way ANOVA in the well-watered or the drought treatment between the sites (p < 0.01). Different minor letters represent statistically significant differences between the ecotypes at p < 0.01. Beech ecotypes are organized according to decreasing total Pi.
Tree Height and Growth (cm)
Well-WateredWater Deprivation
SiteHeight
Start
pHeight
End
pRel
Inc
pAbs
Inc
pHeight
Start
pHeight
End
pRel
Inc
pAbs
Inc
p
cm cm % cm cm cm % cm
Ča27.2 (3.3)ns28.7 (4.0)ns5.4 (4.0)ns1.5 (1.2)ns24.2 (6.1)ns25.0 (6.4)ns3.3 (0.6)ns0.8 (0.3)ns
Vg23.1 (3.0)24.0 (2.7)4.1 (2.3)0.9 (0.4)26.9 (1.1)28.1 (1.7)4.4 (2.7)1.2 (0.8)
DL30.0 (3.1)31.1 (3.2)3.7 (0.6)1.1 (0.2)26.7 (6.4)28.0 (5.7)5.9 (6.6)1.3 (1.0)
Sk32.8 (5.3)33.9 (5.4)3.4 (0.5)1.1 (0.2)31.3 (3.0)32.1 (3.1)2.5 (0.8)0.8 (0.3)
Za27.9 (5.7)29.1 (5.8)4.4 (3.9)1.2 (1.1)22.5 (5.5)23.5 (5.2)4.9 (2.9)1.0 (0.5)
Ve25.7 (7.2)26.5 (7.2)3.3 (2.2)0.8 (0.4)27.5 (3.1)28.6 (2.8)4.2 (2.6)1.1 (0.5)
Vd21.0 (4.5)23.3 (3.2)12.7 (11.1)2.3 (1.8)21.8 (2.8)23.0 (2.6)5.6 (2.5)1.2 (0.4)
Ot28.1 (6.6)28.9 (6.8)2.8 (1.3)0.8 (0.4)30.9 (3.8)31.8 (3.5)3.1 (2.6)0.9 (0.7)
Se31.6 (4.0)32.5 (4.1)2.9 (2.0)0.9 (0.7)29.2 (4.8)30.1 (5.1)3.0 (1.8)0.9 (0.7)
To25.5 (2.3)26.5 (2.5)3.9 (3.5)1.0 (0.9)27.1 (3.4)28.2 (3.1)4.2 (1.9)1.1 (0.4)
Table 5. C, N, δ13C, and C/N ratios in leaves and fine roots. Data shown are mean values ± S.D.s of four replicates for well-watered saplings and five replicates for drought-stressed saplings. p = results of one-way ANOVAs for the well-watered and drought treatments for the different ecotypes. Different minor letters represent statistically significant differences between ecotypes at p < 0.01. Beech ecotypes according to decreasing total Pi.
Leaves
SiteC (mg g−1 dw)δ13C (‰)N (mg g−1 dw)C/N
WateredpDrypWateredpDrypWateredpDrypWateredpDryp
Ča47.4 (0.4)ns44.7 (0.3)ab−30.5 (0.9)b−29.3 (0.2)b1.1 (0.3)ns1.3 (0.3)ns44.8 (12.4)ns36.1 (8.5)ns
Vg48.4 (3.1)48.6 (2.4)a−29.5 (0.4)b−29.3 (0.6)ab1.1 (0.3)1.0 (0.2)44.9 (8.9)50.3 (7.8)
DL51.6 (5.9)42.2 (1.3)b−29.7 (0.9)b−30.0 (0.7)b0.9 (0.1)1.1 (0.2)58.9 (15.0)40.7 (7.1)
Sk46.4 (0.8)44.9 (1.5)ab−30.3 (0.3)b−29.1 (0.9)ab1.2 (0.3)1.2 (0.3)41.9 (9.7)37.6 (7.7)
Za51.0 (4.0)46.1 (2.1)ab−29.9 (0.3)b−29.6 (0.3)b1.0 (0.2)1.4 (0.5)49.7 (4.2)36.9 (13.3)
Ve47.6 (1.6)45.8 (2.3)ab−30.7 (0.8)b−28.6 (0.7)b1.1 (0.2)1.3 (0.2)43.9 (8.6)35.1 (6.3)
Vd50.3 (0.6)47.3 (2.7)ab−29.1 (0.7)b−28.4 (0.6)ab1.1 (0.2)1.0 (0.1)45.1 (7.5)48.2 (9.2)
Ot47.2 (0.6)45.7 (2.2)ab−30.2 (0.6)b−29.3 (1.3)b1.2 (0.2)1.2 (0.3)40.9 (7.2)39.1 (9.9)
Se49.0 (1.7)49.6 (1.6)a−26.8 (0.7)a−27.4 (0.8)a1.1 (0.1)1.2 (0.2)43.6 (2.8)43.1 (8.3)
To49.5 (1.9)48.7 (3.1)a−28.7 (1.3)ab−28.6 (0.6)ab1.1 (0.1)1.1 (0.1)45.3 (4.0)46.6 (5.3)
Fine Roots
SiteC (mg g−1 dw)δ13C (‰)N (mg g−1 dw)C/N
WateredpDrypWateredpDrypWateredpDrypWateredpDryp
Ča44.7 (3.7)ns51.4 (1.2)ns−26.7 (0.7)ns−27.5 (0.4)be0.6 (0.1)ns0.6 (0.1)ns84.1 (20.7)ns86.7 (7.4)ns
Vg49.0 (2.3)52.1 (1.6)−26.8 (0.1)−27.7 (0.2)b0.7 (0.1)0.6 (0.0)69.8 (4.1)87.6 (6.7)
DL47.7 (1.5)49.4 (2.9)−25.1 (0.5)−25.8 (0.6)ad0.5 (0.1)0.5 (0.0)102.6 (17.7)93.0 (11.5)
Sk48.4 (1.2)48.3 (0.9)−26.1 (0.8)−26.0 (0.8)ae0.5 (0.1)0.7 (0.1)92.9 (11.9)75.0 (11.8)
Za46.5 (1.8)48.8 (3.2)−25.8 (0.4)−26.2 (0.4)bcde0.5 (0.1)0.7 (0.1)94.7 (11.8)76.1 (14.7)
Ve47.9 (3.5)49.5 (1.1)−26.5 (1.4)−26.9 (0.4)bde0.5 (0.1)0.6 (0.0)89.5 (9.7)77.4 (4.2)
Vd52.5 (5.0)50.7 (2.3)−26.2 (0.1)−26.9 (0.8)bcde0.6 (0.1)0.5 (0.1)88.6 (12.9)110.0 (15.8)
Ot46.6 (1.2)49.3 (0.8)−25.8 (1.3)−25.2 (0.8)ac0.6 (0.0)0.5 (0.1)80.2 (6.0)103.6 (16.3)
Se47.1 (1.0)49.8 (1.0)−24.5 (1.3)−25.0 (0.6)a0.7 (0.2)0.5 (0.1)71.8 (19.5)95.5 (12.1)
To47.5 (4.2)49.1 (0.2)−25.6 (0.8)−25.6 (0.6)ad0.7 (0.1)0.6 (0.0)72.3 (2.2)85.0 (5.1)
Table 6. The physiological response of Croatian beech saplings to drought increases with increasing soil-Pi availability. Fold changes of physiological parameters under drought vs. well-watered controls were calculated. In the case of a decrease under drought, the reciprocal values ((control vs. stress treatment) * (−1)) were calculated. Red backgrounds represent increases in response to drought vs. the control, whereas blue backgrounds represent decreases. Asterisks represent statistically significant differences between well-watered and drought-treated saplings (* p < 0.05, results of Mann–Whitney tests). Ecotypes are sorted by decreasing total Pi in the soil in the habitat of origin.
SiteLeaves
Total AscRed AscDHARedoxPiNCC/Nδ13C
Ča1.63 (0.36)2.29 (1.11)0.71 (1.49)−0.97 (1.52)0.18 (1.85)1.15 (0.15)−1.06 (0.01) *−1.22 (0.16)1.04 (0.02)
Vg1.60 (0.47) *3.24 (1.45) *−1.84 (0.86) *−2.85 (1.34) *−1.51 (0.55)−0.63 (1.45)0.50 (1.06)0.64 (1.42)1.01 (0.01)
Sk0.82 (1.87)2.39 (1.23)−0.46 (2.95)−2.65 (1.84) *−2.79 (2.03)0.11 (1.36)−0.53 (1.04)−0.64 (1.14)1.06 (0.02) *
DL−0.07 (1.52)2.73 (1.59) *−3.61 (1.56) *−3.30 (1.00) *1.17 (1.58)0.72 (1.28)−1.23 (0.14) *−1.51 (0.38) *−0.01 (1.18)
Ve0.01 (2.06)1.90 (2.64)−3.55 (3.76)−2.64 (1.02) *1.08 (2.27)1.15 (0.12)−0.54 (1.03)−1.20 (0.14)1.08 (0.01) *
Za0.23 (1.97)2.17 (2.36)−4.60 (4.24)−3.28 (0.68) *1.15 (2.81)0.91 (1.63)−1.13 (0.12)−1.10 (1.58)0.51 (1.01)
Vd−0.12 (1.68)0.18 (1.87)−1.55 (0.36)−1.42 (0.30) *0.07 (3.14)−0.70 (1.34)−1.08 (0.05) *0.11 (1.53)1.03 (0.01)
Ot−0.14 (3.24)1.00 (3.63)−11.54 (44.59)1.26 (17.60)1.02 (1.70)−0.04 (1.31)−0.03 (1.21)0.01 (1.25)0.53 (1.04)
Se−0.19 (1.76)0.60 (1.86)−1.04 (1.80)−0.36 (1.70)−0.64 (3.35)0.61 (1.10)0.02 (1.21)−0.59 (1.11)−0.52 (1.04)
To0.69 (1.17)1.47 (1.93)−0.91 (1.93)−1.26 (2.35)0.24 (1.63)−0.57 (1.06)−0.53 (1.05)0.04 (1.28)0.00 (1.18)
SiteFine Roots
Total AscRed AscDHARedoxPiNCC/Nδ13C
Ča−1.62 (1.73)−0.34 (0.66)−6.77 (4.50) *−4.85 (3.70) *0.79 (3.03)0.69 (1.15)1.15 (0.09) *−0.03 (1.41)−0.48 (0.99)
Vg0.38 (2.03)0.63 (1.78)−1.27 (2.16)−1.70 (2.10)−2.24 (0.76)−1.18 (0.07) *0.57 (1.07)1.25 (0.03) *−0.96 (0.01) *
Sk1.16 (2.29)1.45 (2.32)−0.39 (2.54)−1.74 (0.43)−1.98 (3.40)1.32 (0.20)0.00 (1.16)−1.33 (0.20)0.51 (1.00)
DL0.67 (1.80)0.77 (1.74)1.23 (4.69)0.57 (4.43)1.55 (0.96)0.84 (1.34)0.54 (1.03)−0.79 (1.41)−0.47 (0.99)
Ve1.52 (2.20)1.63 (1.99)−1.37 (5.64)−3.82 (6.09)−1.71 (4.64)0.65 (1.15)0.54 (1.05)−0.60 (1.13)−0.46 (1.00)
Za−0.05 (2.08)0.86 (2.43)−3.93 (2.41)−3.85 (1.36)−3.43 (1.99)1.39 (0.26) *0.55 (1.07)−1.34 (0.29)−0.49 (0.99)
Vd−1.09 (1.71)−0.26 (1.52)−8.14 (4.57) *−6.59 (5.56) *−1.37 (1.69)−1.23 (0.12)−0.06 (1.27)1.17 (0.10)0.03 (1.13)
Ot0.98 (1.75)1.29 (1.78)−4.28 (4.23)−5.05 (3.61) *−2.55 (2.54)−0.12 (1.47)0.55 (1.04)0.68 (1.35)0.06 (1.18)
Se1.48 (2.55)2.06 (2.50)−10.44 (13.22)−10.11 (7.96)6.91 (7.89) *−0.69 (1.47)1.09 (0.05) *0.82 (1.45)0.05 (1.14)
To0.70 (1.57)1.06 (1.50)−5.18 (4.26)−5.65 (3.66) *7.25 (7.58)−0.59 (1.19)0.06 (1.25)1.14 (0.07) *0.02 (1.15)
c > 44 > c > 33 > c > 22 > c > 11 > c >00 > c > −1−1 > c > −2−2 > c > −3−3 > c > −4c > −4
Publisher’s Note: MDPI stays neutral with regard to jurisdictional claims in published maps and institutional affiliations.

