Article

Effects of Trunk Distance and Rainfall on Throughfall and Associated Chemical Alterations within a Subtropical Deciduous Forest

1
Key Laboratory of Watershed Geographic Sciences, Nanjing Institute of Geography and Limnology, Chinese Academy of Sciences, Nanjing 210008, China
2
Chuzhou Scientific Hydrology Laboratory, Nanjing Hydraulic Research Institute, Chuzhou 239080, China
3
Institute of Eco-Environmental and Soil Sciences, Guangdong Academy of Sciences, Guangzhou 510650, China
4
Collaborative Innovation Center on Forecast and Evaluation of Meteorological Disasters (CIC-FEMD), Nanjing University of Information Science & Technology, Nanjing 210044, China
*
Author to whom correspondence should be addressed.
Forests 2022, 13(10), 1707; https://doi.org/10.3390/f13101707
Submission received: 16 September 2022 / Revised: 29 September 2022 / Accepted: 12 October 2022 / Published: 17 October 2022
(This article belongs to the Section Forest Hydrology)

Abstract

:
Throughfall makes up the major portion of understory rainfall, and thereby plays a vital role in regulating the hydrological and biogeochemical processes in forest ecosystems. The aim of this study was to explore the alterations in throughfall and the associated chemical composition (Ca2+, Na2+, K+, Mg2+, H+, SO42−, NO3, Cl, and F) under Quercus acutissima Carruth. and Broussonetia papyrifera (L.) L’Her. ex Vent. trees, in relation to trunk distance and rainfall characteristics. Event-based measurements were carried out from April to December 2018 in a subtropical forest of eastern China. The throughfall amount (TF) and throughfall ratio (TF%) of Q. acutissima (35.7 mm, 83.0%) were higher than those of B. papyrifera (32.1 mm, 74.7%). Although no significant species differences in the ion concentrations of throughfall were detected, almost all ions (Ca2+, Na2+, K+, Mg2+, H+, SO42−, NO3, and Cl) were enriched after passing through the canopies of the two tree species. TF and TF% increased with increasing distance from the trunk, while the concentrations of most ions in throughfall increased, since the trunk was approximated. Regression analysis and redundancy analysis revealed that rainfall amount, duration and intensity exerted significant impacts on throughfall generation and ion concentrations, and the antecedent dry period had a notable influence only on ion concentrations. Our findings indicated that forest canopy and rainfall characteristics play an important role in the alterations in throughfall and the associated chemical compositions.

1. Introduction

As the major portion of gross precipitation input to forests, throughfall reaches the forest floor directly through canopy gaps or indirectly through canopy surface drips [1], usually accounting for more than 70% of the incident gross precipitation in a wide range of forest ecosystems [2,3]. Therefore, throughfall constitutes most of the water flux from the forest canopy to the ground and is an indispensable component of the water budget in forest ecosystems [2]. Throughfall can not only determine the spatial and temporal distribution of rainwater input to the soil surface [4], but also greatly impacts the concentration and spatial-temporal pattern of nutrients that reach the forest floor [5,6]. In addition, throughfall also has important impacts on preferential infiltration [7], surface runoff generation [8], plant root distribution [9], soil bacterial and fungal richness and soil respiration [10,11].
The volume of rain water that passes through the forest canopy is redistributed and its chemical elements are modified (enriched or depleted) because of (i) the interception by the forest canopy, (ii) wash-off of dry deposited gases and particles, and (iii) extensive ion exchange between rainwater and the forest canopy surfaces [12,13]. In order to quantify the water volume and chemical deposition input into forests, research on throughfall and its solution chemistry has been carried out in different forest types over the past several decades [12,14,15]. However, differences in canopy structure and leaf morphology between tree species have led to tremendous variation in throughfall and chemical deposition. For example, recent reviews about the global rainfall partitioning documented that the throughfall rate varied greatly from 39% to 98.1% among different forest types around the world [3,16], and a review about the effect of forest type on throughfall deposition suggested that coniferous forests had higher input deposition of N and S and higher seepage of NO3, SO42−, K+, Ca2+ and Mg2+ than deciduous forests, while deciduous forests had higher canopy exchange of K+, Ca2+ and Mg2+ [17]. For a given forest type or tree species, the volume and chemical deposition of throughfall also have been found to be highly variable for broad-leaved trees, e.g., [6,18], and coniferous trees, e.g., [18,19,20]. In addition, according to previous studies, throughfall chemistry may exhibit different spatiotemporal variability from throughfall volume [6,18]. Therefore, there is still a need to better understand the variability in throughfall amount and solute chemistry at the individual scale in more forest types to accurately evaluate the water and chemical input to forest soil and better understand the transmission mechanism of hydrological and biogeochemical cycles in forest ecosystems.
Throughfall water and associated solution chemistry are determined by the canopy structure and meteorological factors [2,21]. Generally, canopy structure factors (such as tree species, canopy cover, and distance from the tree trunk) affect throughfall in a regular and predictable manner [2]. Distance from the tree trunk is one of the most important canopy structure factors that influence throughfall variability [19,22]. Numerous studies have explored the relationship between throughfall amounts and distance from the tree trunk, e.g., [6,8,12,13,14,15,18,19,20,22,23,24,25,26,27,28,29,30,31,32,33,34,35,36,37,38]. As shown in Table S1, there are differences in this relationship among different forest types and tree species. In addition, to our knowledge, most of the information about the effect of trunk distance on the chemical composition of throughfall comes from studies in coniferous forests (Table S1), while research in broadleaved forests (e.g., [6,18]), especially in subtropical broadleaved forests, is particularly lacking. Throughfall volume has been shown to increase with increasing rainfall amounts, intensity, and duration [39,40]. Rainfall duration and intensity have also been observed to affect the spatial variability of throughfall (expressed in terms of the coefficient of variation, CV) over time and space in diverse forest ecosystems [41], but there is no consensus on whether increasing rainfall intensity will increase or decrease the spatial variability of throughfall during a given rainfall event [2,22,35]. The length of the antecedent dry period between rain events and rainfall/throughfall amounts are the two most reported factors that determine the ion concentration of throughfall [2]. However, other than the extensive characterization of throughfall solute inputs as a function of weeks, e.g., [6,18] and months, e.g., [14,19] (Table S1), only a few studies have attempted to examine the effect of rainfall conditions on the routing of throughfall solutes to the forest floor at the event scale [2], which limits our understanding of the spatiality of throughfall solute inputs.
Subtropical forests are highly weathered, with low base cation soils and poor buffering action against acid deposition [42]. Over the past century, China’s forests have exhibited relatively high levels of bulk deposition of base cations, particularly in southeastern regions, which will increase further over the coming decades in association with continued economic development [43]. Subtropical broadleaved forests, in which Quercus acutissima or Broussonetia papyrifera is the dominant species, are widely distributed throughout South and East China and elsewhere [44]. Nevertheless, for such subtropical broadleaved forests, there is an important knowledge gap on the effects of trunk distance and rainfall on throughfall chemical alterations at the event scale. Within this context, the study aimed to (1) characterize and quantify the water and chemical ions of rainfall and throughfall under two tree species in a subtropical forest, (2) explore the spatial characteristics of water and chemical ions of throughfall along a trunk distance gradient under two tree species, and (3) examine the effect of rainfall characteristics on throughfall and chemical ion deposition at the event scale. Our results should provide a reference for forest water and acid deposition management in subtropical regions.

2. Materials and Methods

2.1. Site Description

Field measurements were carried out at the Nandadish forest experimental catchment of the Chuzhou Scientific Hydrology Laboratory Base, Nanjing Hydraulic Research Institute (32°17′ N, 118°12′ E), which is located by the Yangtze River Delta. The study site has a humid subtropical climate, characterized by hot humid summers and mild dry winters. According to meteorological data from the China Meteorological Administration, the average annual precipitation depth over the last 70 years is approximately 1008 mm, with 711 mm (70.5% of annual precipitation) falling during the wet season (May to October) [44]. The coldest and warmest months are January and July, with average monthly temperatures of 3.7 °C and 28.1 °C, respectively. Loams and clay loams with maximum depths of 0.5–7 m are distributed in different locations of the study site [45]. The study site is a subtropical broadleaved forest and has an area of 7897 m2. According to an investigation in 2017, the study forest has a density of trees of 1128 trees ha−1, a mean (± SD) tree height of 19.5 (±2.8) m, and a total basal area of 17.7 m2 ha−1. The coverage of the study site is dominated by Quercus acutissima Carruth. and Broussonetia papyrifera (L.) L’Her. ex Vent., with a mix of Celtis sinensis Pers., Melia azedarach L., Populus spp., and Sophora japonica Linn. Quercus acutissima Carruth. and B. papyrifera account for 67.4% and 21.5% of the total basal area in the study forest stand, respectively. The mean diameters at breast height (DBH) of Q. acutissima and B. papyrifera were 14.3 (±4.7) cm and 12.7 (±4.9) cm, respectively.

2.2. Rainfall and Throughfall Field Measurements and Sampling

Gross precipitation (Gp) and throughfall were measured and sampled from April to December 2018. The rainfall amount was measured by tipping-bucket rain gauges (Nanjing Automation Institute of Water Conservancy and Hydrology, Nanjing, China) and was recorded every 5 min with a CR3000-NB datalogger (Campbell Scientific, Inc., Logan, UT, USA) at an open field automatic meteorological station, approximately 300 m away from the study forest. Each tipping-bucket rain gauge had a diameter of 20 cm and a resolution of 0.1 mm per tip. A period of 10 h of no rain was used to divide two consecutive rainfall events to ensure that the tree canopy was dry. Once individual rainfall events were identified, other rainfall characteristic variables, such as the event duration (DE, h), mean rainfall intensity (Imean, mm h−1), maximum 30-min rainfall intensity (Imax30, mm h−1), and antecedent dry periods (ADP, h), were calculated according to the data measured by the tipping-bucket rain gauges. Imax30 was calculated with floating 30-min windows. The sum of Gp, and the calculated values of DE, Imean, Imax30, and ADP in each rainfall event were selected for the analysis of the influence of rainfall factors on throughfall and associated chemical alterations. Rainfall water was collected into a 5-L container through a funnel, with a sharp-edged vertical rim (20 cm in diameter) and a plastic hose. This rainfall water collector was installed within the open field automatic meteorological station and placed horizontally approximately 70 cm above the ground to avoid splashing when entering the funnel openings. Samples from the rainfall collector were collected with 250 mL polyethylene bottles at the event scale. After each sampling event, the rainfall collector was thoroughly rinsed with distilled water.
Throughfall was measured and collected using the same collection device as that used for rainwater (Figure 1). Our study mainly focuses on the spatial distribution of throughfall within the trunk distance gradient, rather than the phenomenon of stemflow. Therefore, stemflow was not analyzed in this study. Throughfall collectors were installed beneath five Q. acutissima and three B. papyrifera canopies. The morphological characteristics of these eight trees are shown in Table 1 and Figure S1. To measure the horizontal distribution of throughfall, three throughfall collectors were installed in one radial direction beneath each tree canopy; one was placed at a position 0.2 m away from the tree trunk (center), another was placed at a position under the middle of the tree canopy (middle), and the other was placed at a position under the edge of the tree canopy (edge) (Figure 1). The throughfall volume in each collector was measured using a graduated cylinder after each rainfall event. Throughfall water was sampled in the same way as rainwater and was collected at the event scale. After sampling, throughfall samples from all collectors located under the center of the tree canopy of the same species were mixed into one sample, throughfall samples from all collectors located under the middle of the tree canopy of the same species were mixed into one sample, and throughfall samples from all collectors located under the edge of the tree canopy of the same species were mixed into one sample. That is, six mixed samples (three for Q. acutissima and three for B. papyrifera) were obtained for each rainfall event. The throughfall amount (mm) of each collector was calculated using the following equation:
T F = 1 n i = 1 n R V , i S i × 10
where TF is the mean throughfall amount (mm) for each rainfall event, R V , i is the volume (ml) of each collector, S i is the collecting area (cm2) of each collector, and n is the number of collectors.
The throughfall ratio (TF%) was obtained by dividing TF by Gp.

2.3. Chemical Analysis and Calculation

After sampling, the pH and electrical conductivity (EC) were measured immediately with a portable multiple HQ series parameter meter (HACH, HQ2200, Loveland, CO, USA). H+ concentration was derived from pH values. The subsamples of rainwater and throughfall for ion testing were filtered through a 0.45 μm polypropylene membrane, and the subsamples for cation testing were acidified with nitric acid (200:1 v/v). All samples were stored in a refrigerator below 4 °C, until required for chemical analysis. The chemical compositions of rainfall and throughfall were determined in the State Key Laboratory of Lake Science and Environment, Nanjing Institute of Geography and Limnology, Chinese Academy of Sciences. The base cations (Ca2+, K+, Na+, and Mg2+) were measured by inductively coupled plasma optical mass spectrometry using an ICPMS 7700× (Agilent Technologies, Inc., Palo Alto, USA); the base anions (Cl, F, NO3, and SO42−) were determined by ion chromatography (ICS-2100; Dionex Corporation, Sunnyvale, USA); and the NO3 concentration was analyzed by a continuous-flow analyzer (Skalar, SAN++).
Following the methods of Jiang et al., (2021) [5], the volume-weighted mean (VWM) was used to express the mean ion concentration in rainfall and throughfall of individual events using the following equation:
V W M = n = 1 i C i , E × V i , E n = 1 i V i , E
where VWM is the mean ion concentration (mg L−1), C i , E is the concentration at collector i for event E (mg L−1), and V i , E is the rainfall and throughfall at collector i for event E (mm).
The enrichment ratio of ions is estimated by dividing the ion concentration in throughfall by the ion concentration in rainfall. The enrichment ratio can reflect the extent of change in the ion concentrations from rainwater collected in an open space to rainwater collected beneath a forest canopy.
The deposition (kg ha−1) of a given ion for rainfall and throughfall after each individual rainfall event was calculated by multiplying the ion concentration (mg L−1) with the collected water depth (mm) and then dividing it by 100. Net throughfall fluxes (NTF) were calculated as the difference between throughfall and rainfall deposition, which resulted from dry deposition (DD) and canopy exchange (CE) processes. The canopy budget model can distinguish the importance between DD and CE [18]. In this model, dry deposition flux is usually estimated based on the assumption that some tracer ions are not affected by canopy leaching. Na+, SO42−, and Cl have been regarded as tracer ions used to estimate dry deposition of other solutes on the assumption that tracer ions in throughfall remain in equilibrium during the canopy exchange processes [5]. Because of the assumed negligible canopy exchange, the DD of Na+, SO42−, and Cl is equal to their NTF. In the present study, the dry deposition of Ca2+, K+, and Mg2+ was calculated based on the dry deposition of Na+ as a tracer and the dry deposition of F and NO3 was calculated based on the dry deposition of SO42− as a tracer, multiplying it by individual ions in the rainfall.
D D i = D D F t r a c e r × G p i
D D F t r a c e r = T f t r a c e r G p t r a c e r G p t r a c e r
where D D F t r a c e r is the dry deposition factor for tracer ion (Na+ or SO42−), and i is (Ca2+, K+, and Mg2+) or (F and NO3).
Canopy exchange for these ions can be then calculated by subtracting DD from NTF. A positive value means that canopy leaching of ions contributes to throughfall flux, whereas a negative value means canopy uptake of the ion.

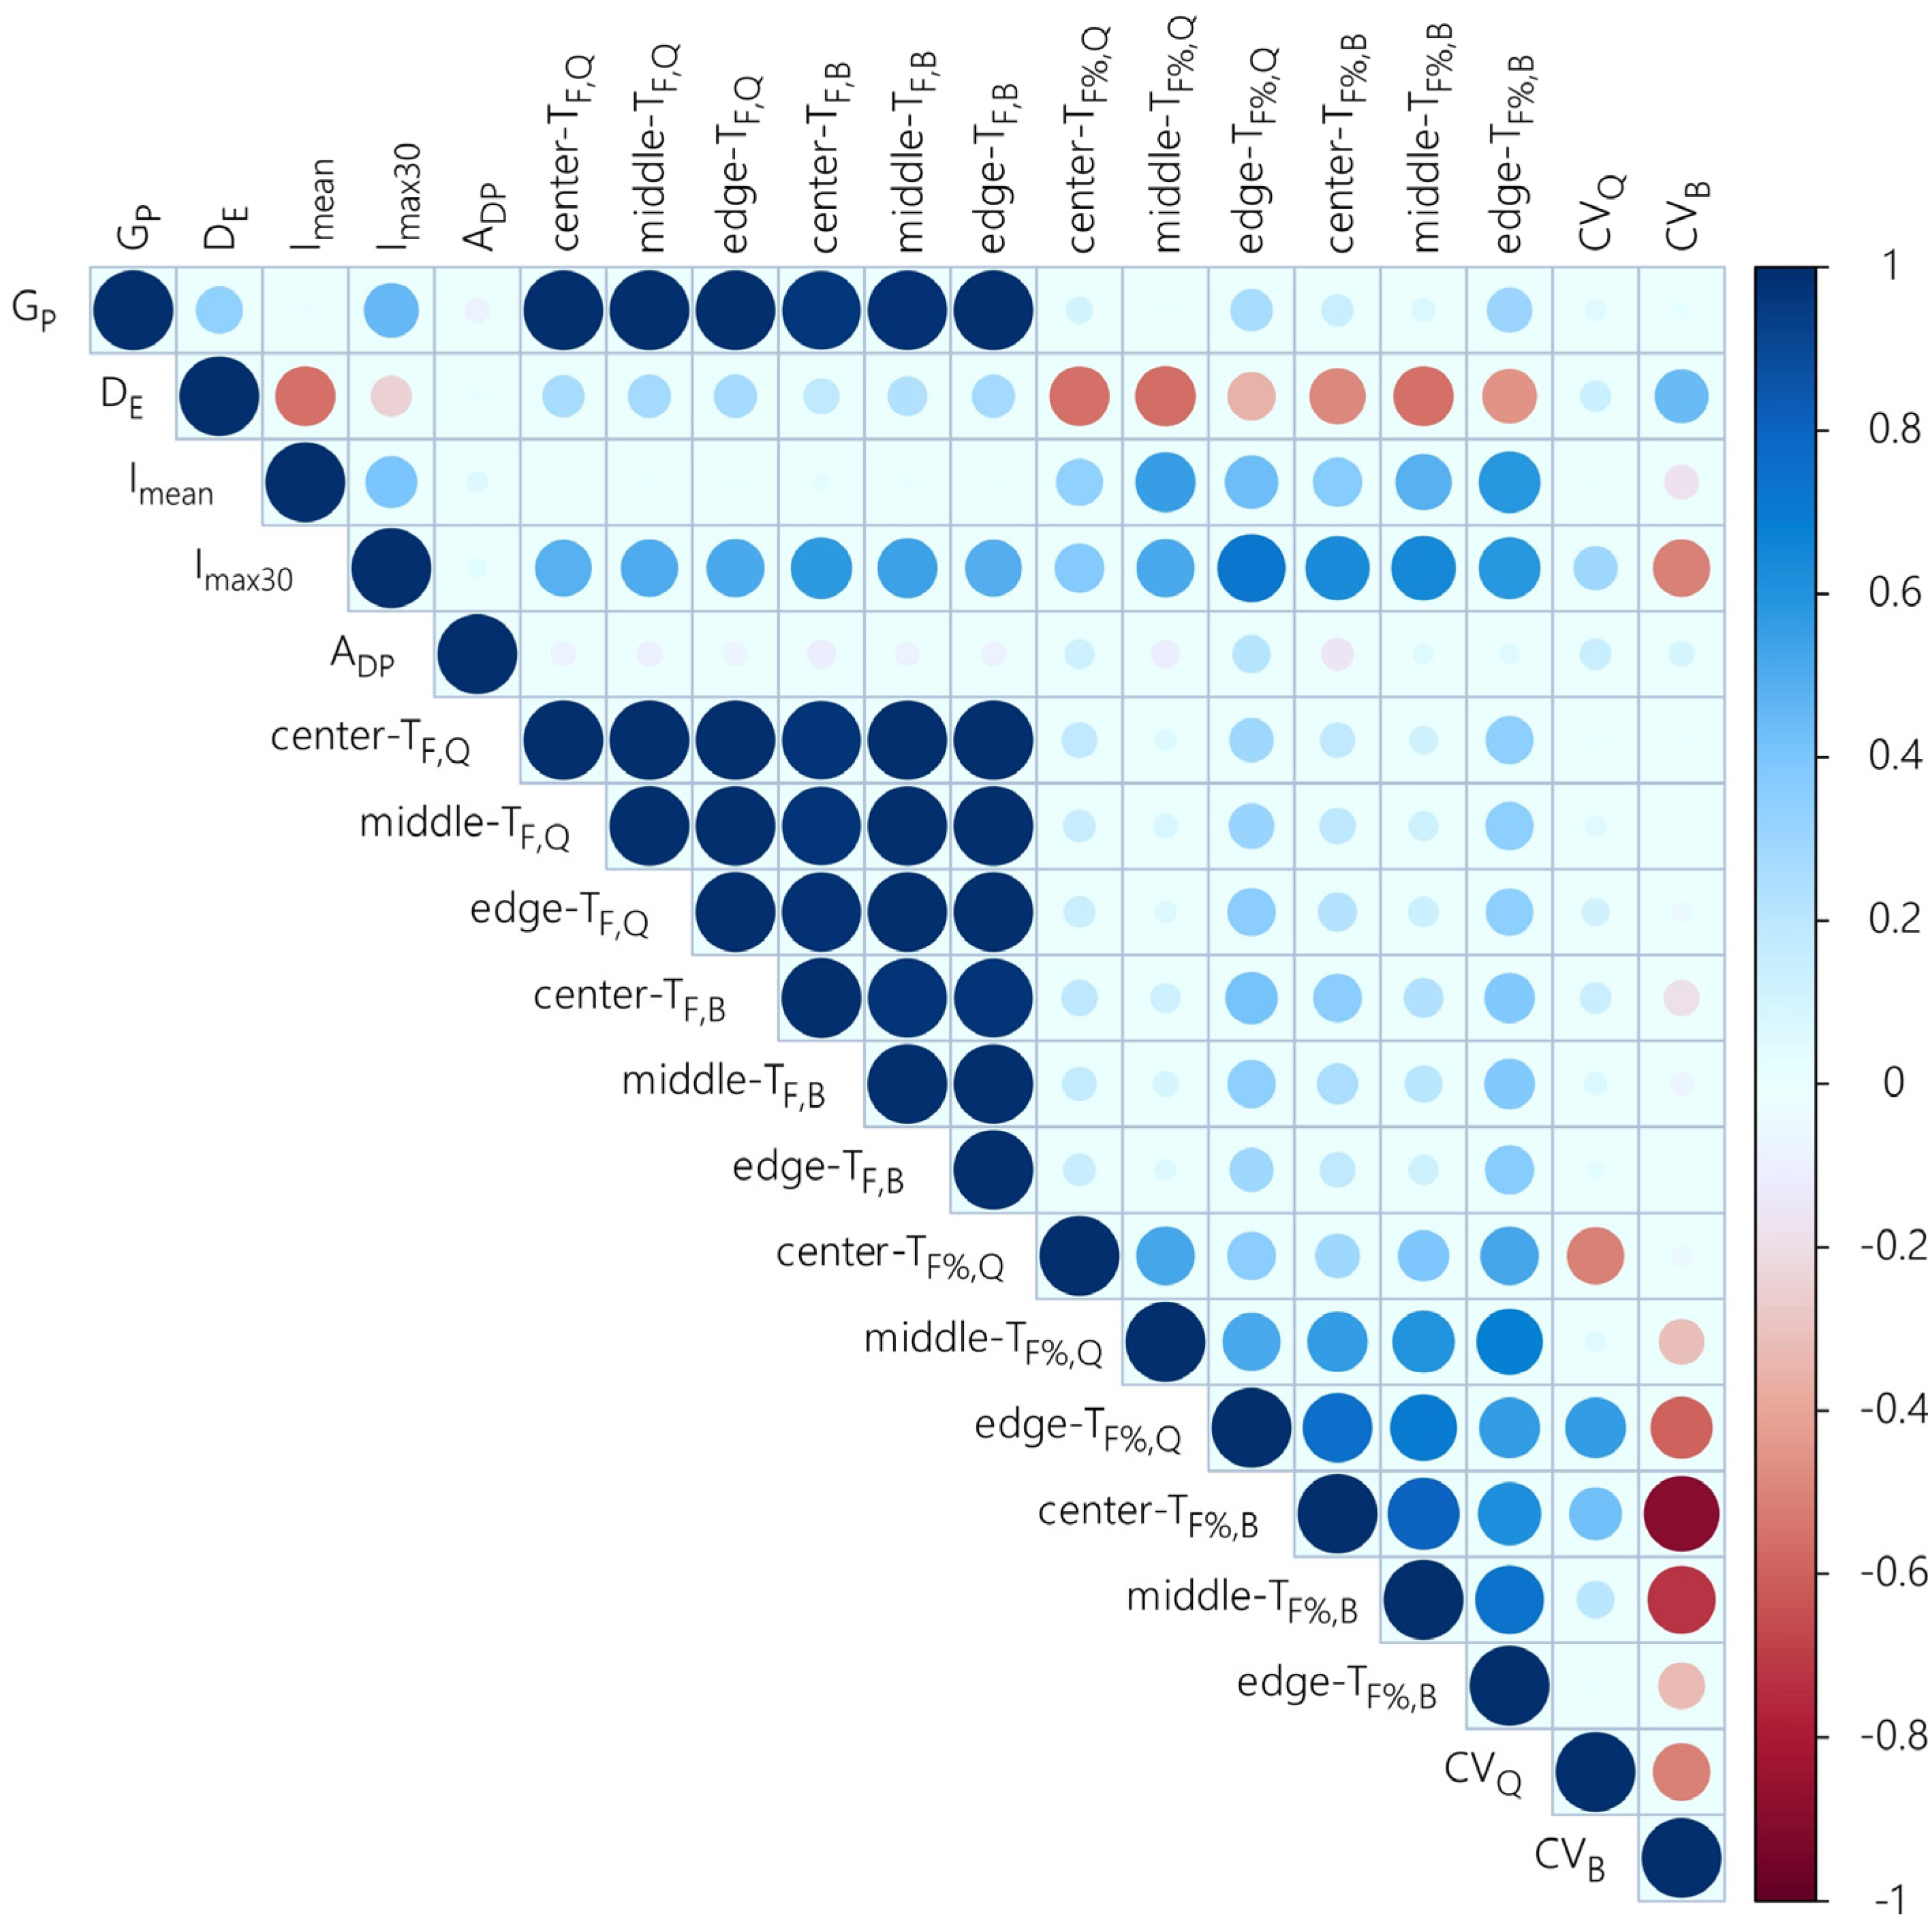
2.4. Statistical Analyses

To test the difference in throughfall parameters between tree species, between individual trees of the same species, and between different collectors under each tree, the nonparametric Kruskal–Wallis test was used. The spatial variability in throughfall was identified by the coefficient of variation (CV %). The CV was calculated for the data from 24 throughfall collectors for each individual rainfall event. The correlation matrix based on Pearson’s correlation was applied to estimate the relationships between throughfall parameters and rainfall factors, and then linear or nonlinear regressions were constructed between throughfall parameters and rainfall factors, whose correlation passed a significance test. The level of significance was set as the 95% confidence interval (p = 0.05). Redundancy analysis (RDA) was employed to explore the relationships between throughfall chemical concentrations and rainfall characteristic variables. A total of five rainfall characteristic variables (GP, DE, Imean, Imax30, and ADP) served as predictors. Nine ion concentrations (Ca2+, Na2+, K+, Mg2+, H+, SO42−, NO3, Cl, and F) for each tree species at the event scale were selected as the response variables. All predictors and response variables were log-transformed to guarantee comparability between the different dimensional data. All statistical analyses were performed using R software (R Development Core Team, 2017), IBM SPSS Statistics 22.0 (SPSS Inc., Chicago, IL, USA), and CANOCO 5.0 (Microcomputer Power Wageningen University & Research, Ithaca, NY, USA).

3. Results

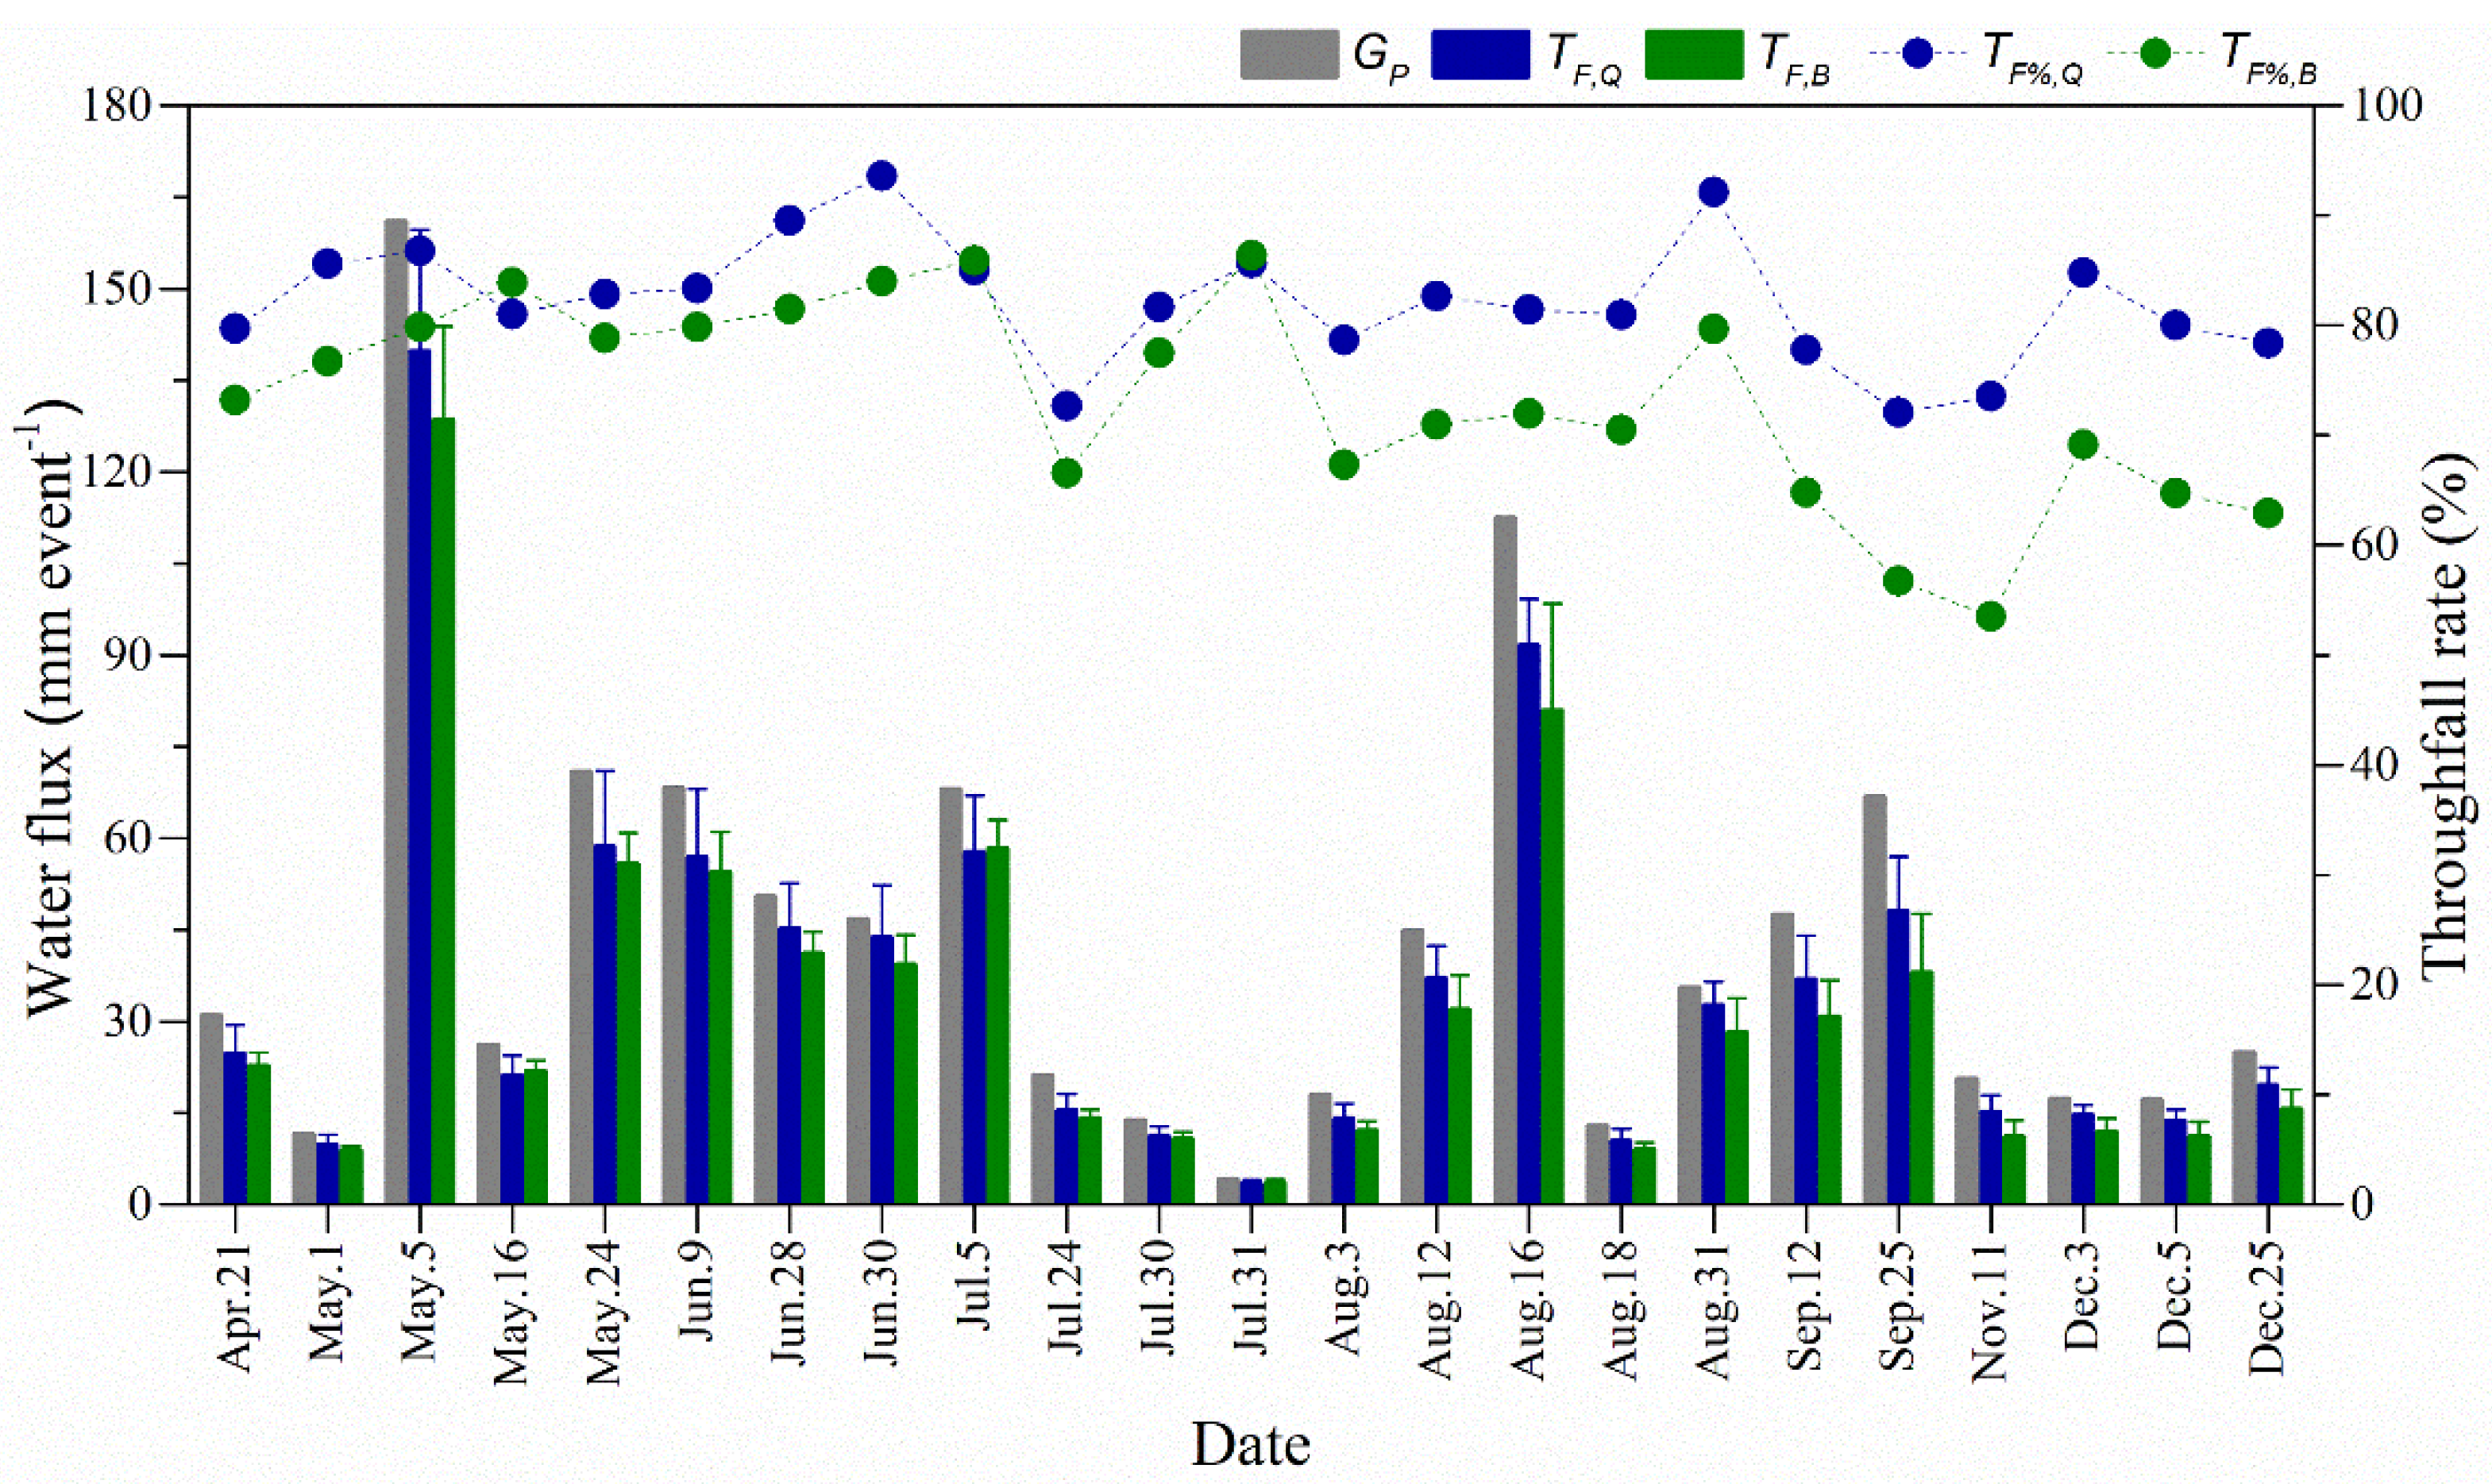
3.1. Characteristics of Rainfall and Throughfall during the Experimental Period

During the experimental period, rainfall and throughfall were measured after 23 individual rainfall events. The rainfall amount for the 23 events yielded a total of 989.2 mm and ranged from 4.0 to 161.0 mm (mean 43.0 mm; Figure 2). Imean was 3.6 mm h−1 and ranged from 0.4 to 15.6 mm h−1, Imax30 was 22.5 mm h−1 and varied from 0.8 to 64.6 mm h−1, DE ranged from 0.4 to 102.7 h, and ADP ranged from 18.6–346.9 h. According to the Kruskal–Wallis test, there was no significant difference in TF between individual trees for Q. acutissima (p = 0.911, H = 0.10) and B. papyrifera (p = 0.997, H = 0.01). The mean TF for all the collectors under the Q. acutissima canopies for each rainfall event ranged from 3.4 to 139.7 mm with a mean of 35.7 mm, and the corresponding TF under the B. papyrifera canopies ranged from 3.5 to 128.5 mm with a mean of 32.1 mm. According to the data of the 23 rainfall events and mean TF for all the collectors of each tree species, the TF% under the Q. acutissima canopies and the B. papyrifera canopies was 72.1–93.6% and 53.5–86.4%, respectively. The mean event TF% under the Q. acutissima canopies and B. papyrifera canopies was 83.0% and 74.7%, respectively. These results suggested that throughfall represents a major proportion of gross incident precipitation for both tree species and that the TF% under the Q. acutissima canopies was significantly higher than that under the B. papyrifera canopies (p = 0.001, H = 11.08).

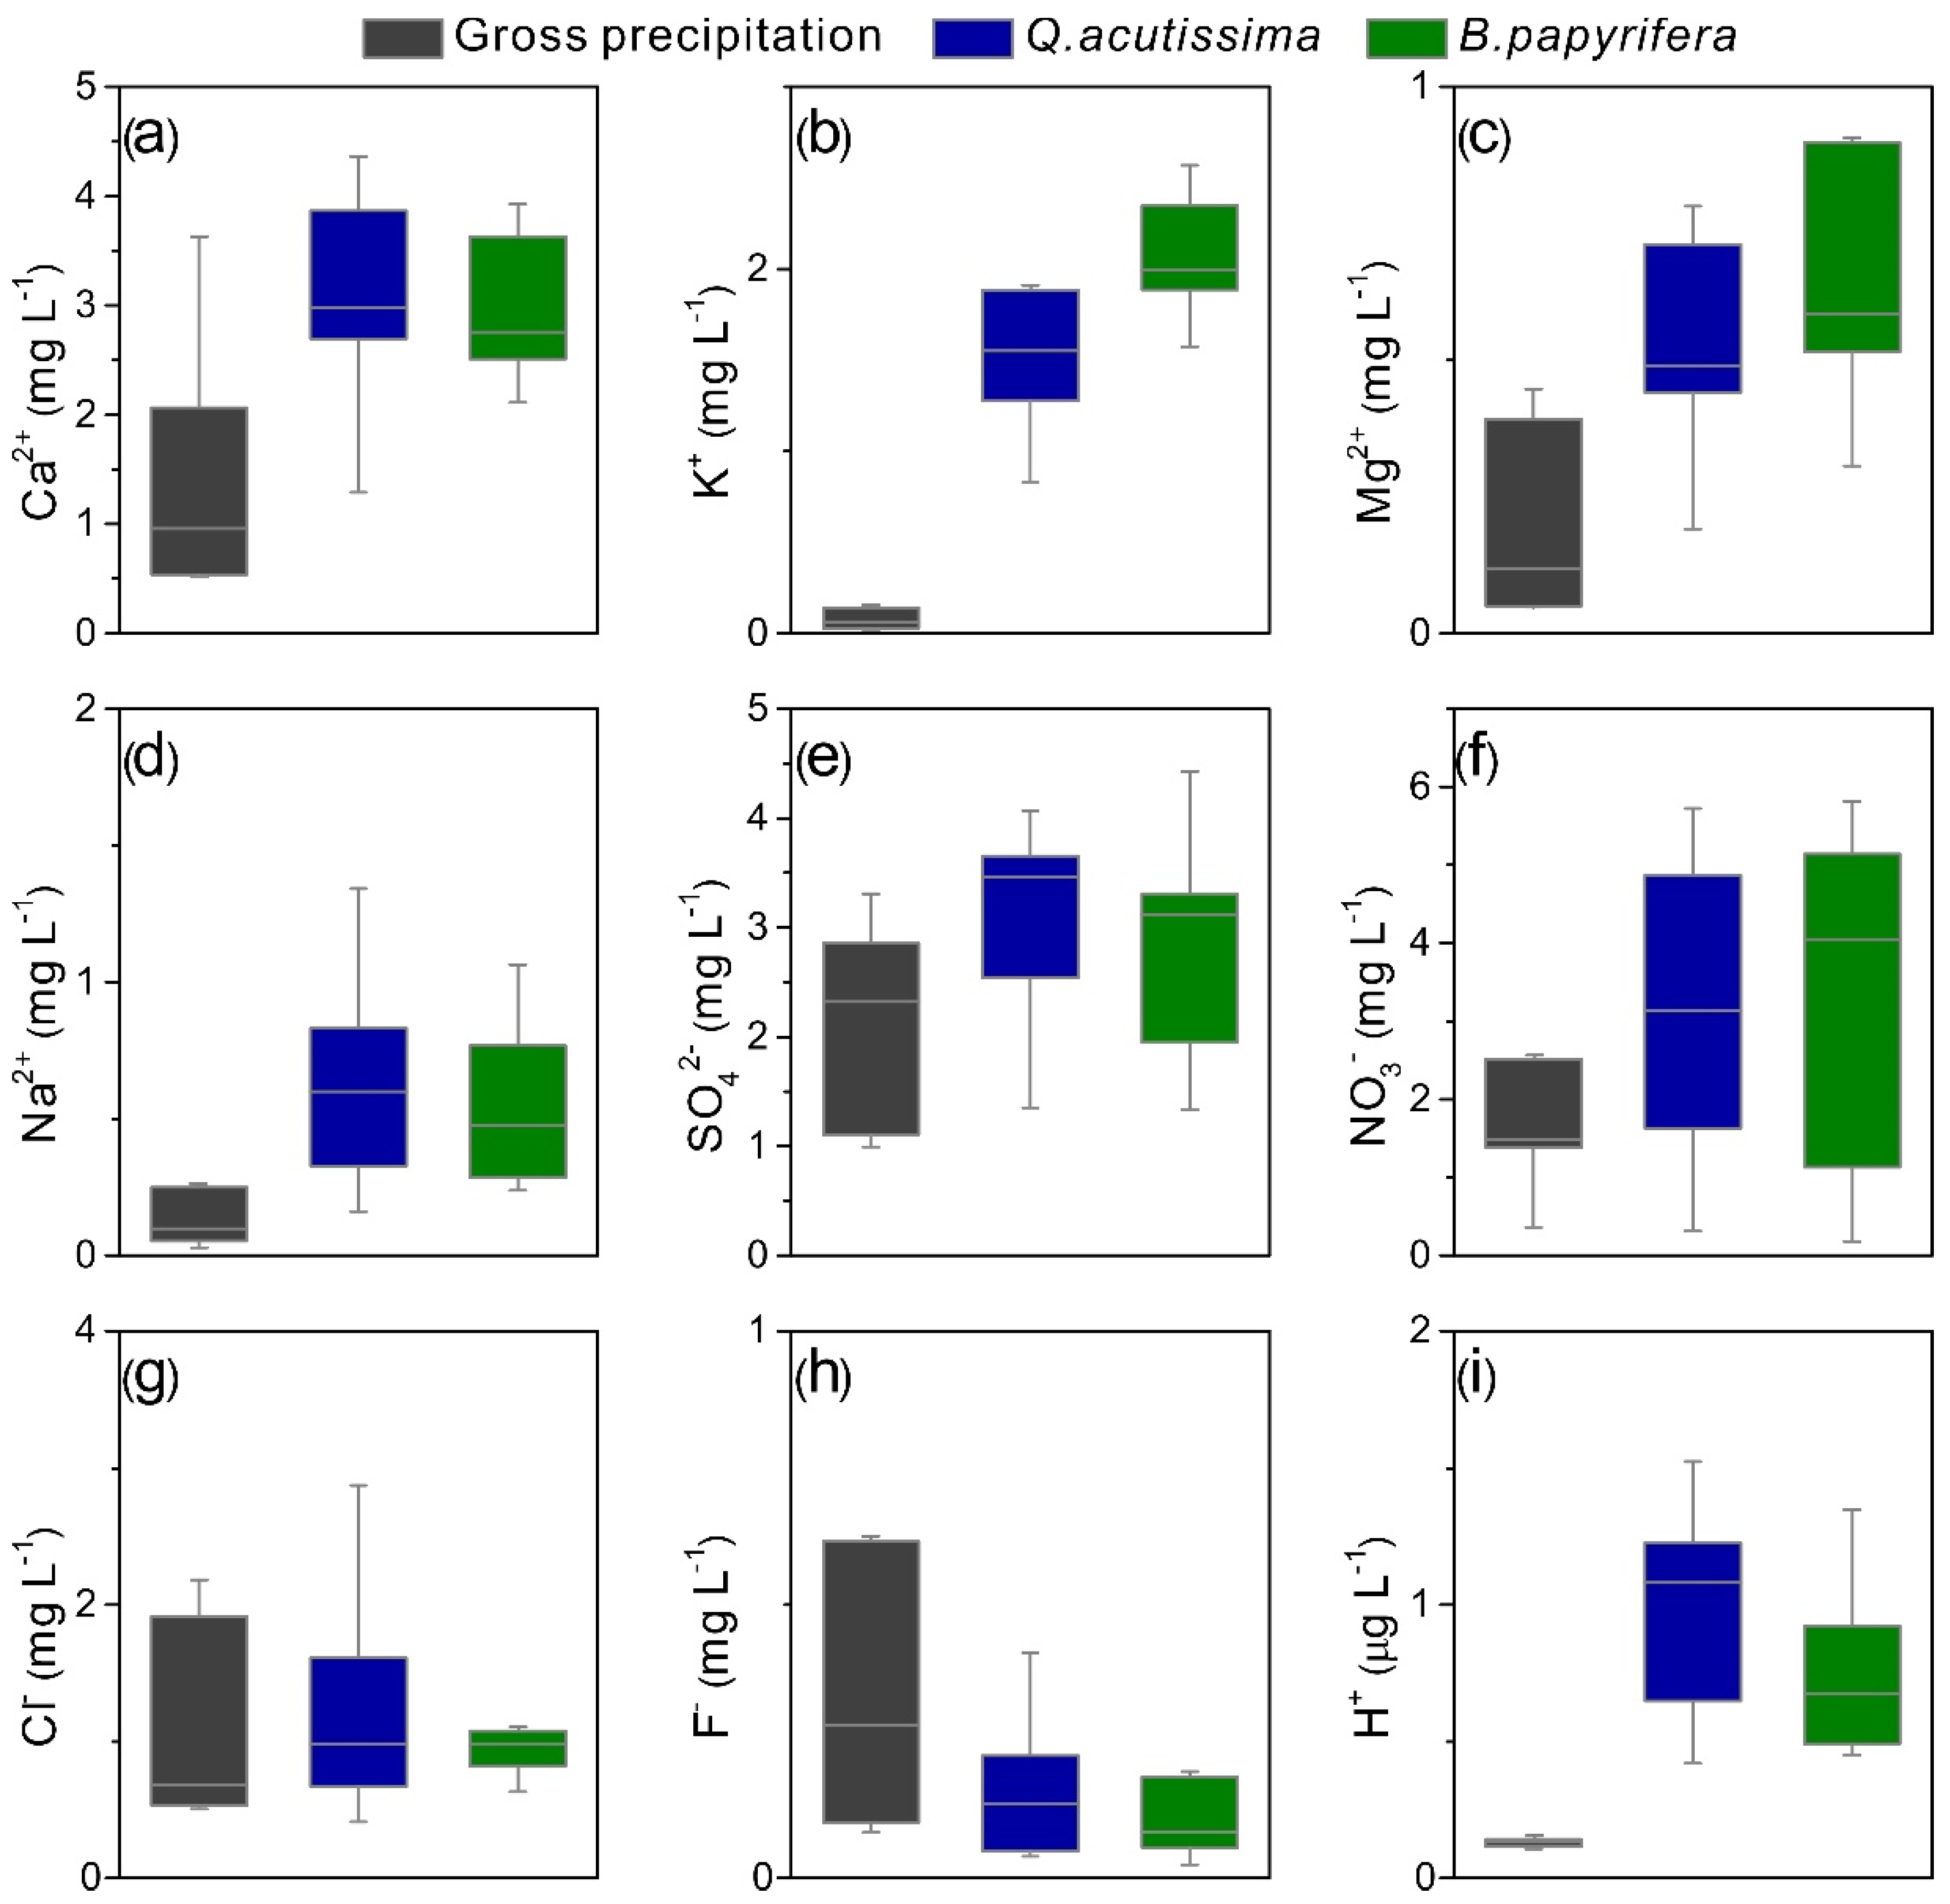
3.2. Element Concentrations of Rainfall and Throughfall

Considerable variations in the ion concentrations between rainfall and throughfall were found. As shown in Figure 3, SO42 was the ion with the highest concentration for Gp, followed by NO3, Ca2+, Cl, F, Mg2+, Na2+, K+, and H+ in descending order. However, the K+ concentration in throughfall rose to the fourth place under the Q. acutissima and B. papyrifera canopies, following SO42−, NO3, and Ca2+. According to the enrichment ratio, the concentrations of base cations after canopy passage were significantly enriched in throughfall, compared with those in Gp (Figure 3a–d,i, Table 2). The K+ concentration was altered the most, with mean enrichment ratios of 29.3 and 43.6 for Q. acutissima and B. papyrifera, respectively, followed by Na2+ (12.5 and 8.8), H+ (11.7 and 9.2), Mg2+ (5.4 and 7.0), and Ca2+ (3.5 and 3.8). The enrichment degrees of base anions were lower than those of base cations, and the enrichment ratios of NO3, SO42−, Cl and F were 2.0 and 2.8, 1.5 and 1.5, 1.6 and 1.6, and 0.6 and 0.4 for Q. acutissima and B. papyrifera, respectively (Figure 3e–h, Table 2). The weighted pH of Gp varied from 5.9 to 7.9 with a mean value of 7.1, and the weighted EC of Gp ranged from 5.9 to 41.5 μS cm−1 with a mean value of 17.4 μS cm−1. After passing the canopy, the pH of throughfall for both tree species decreased, while the EC increased (Table 2). However, there was no significant difference in the concentrations of base ions between the two tree species (p ≥ 0.07, H < 3.28).

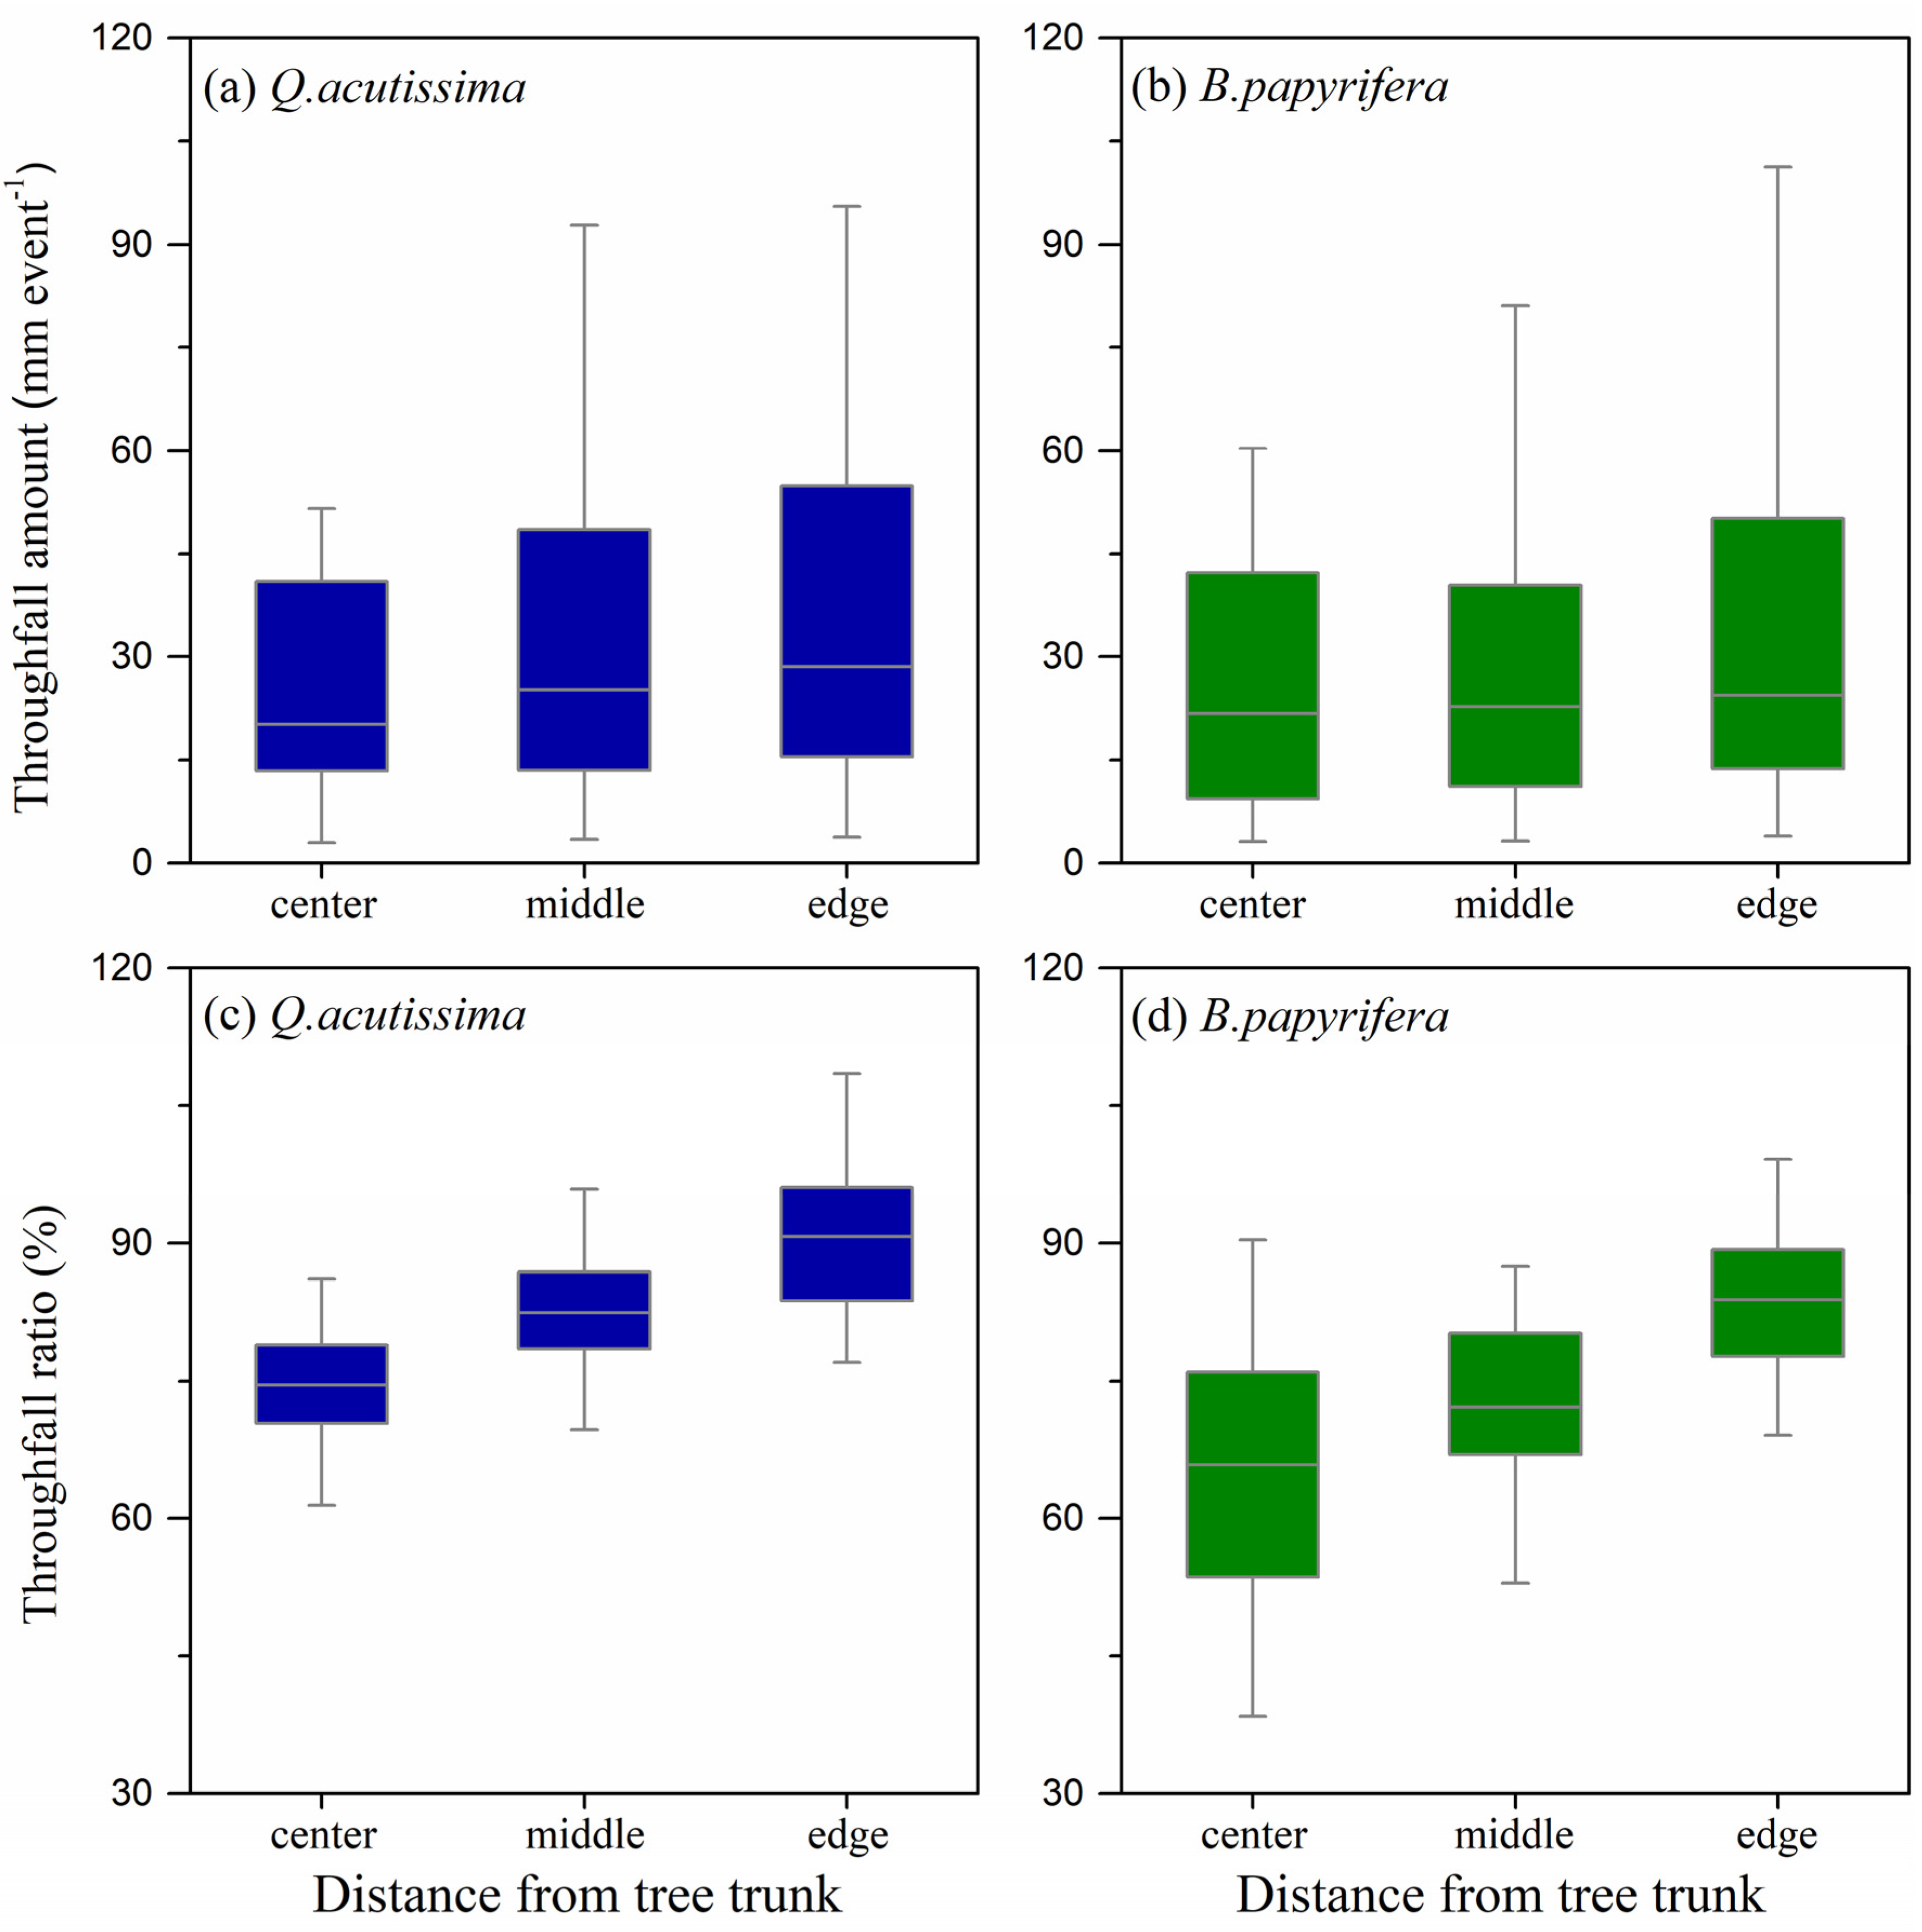
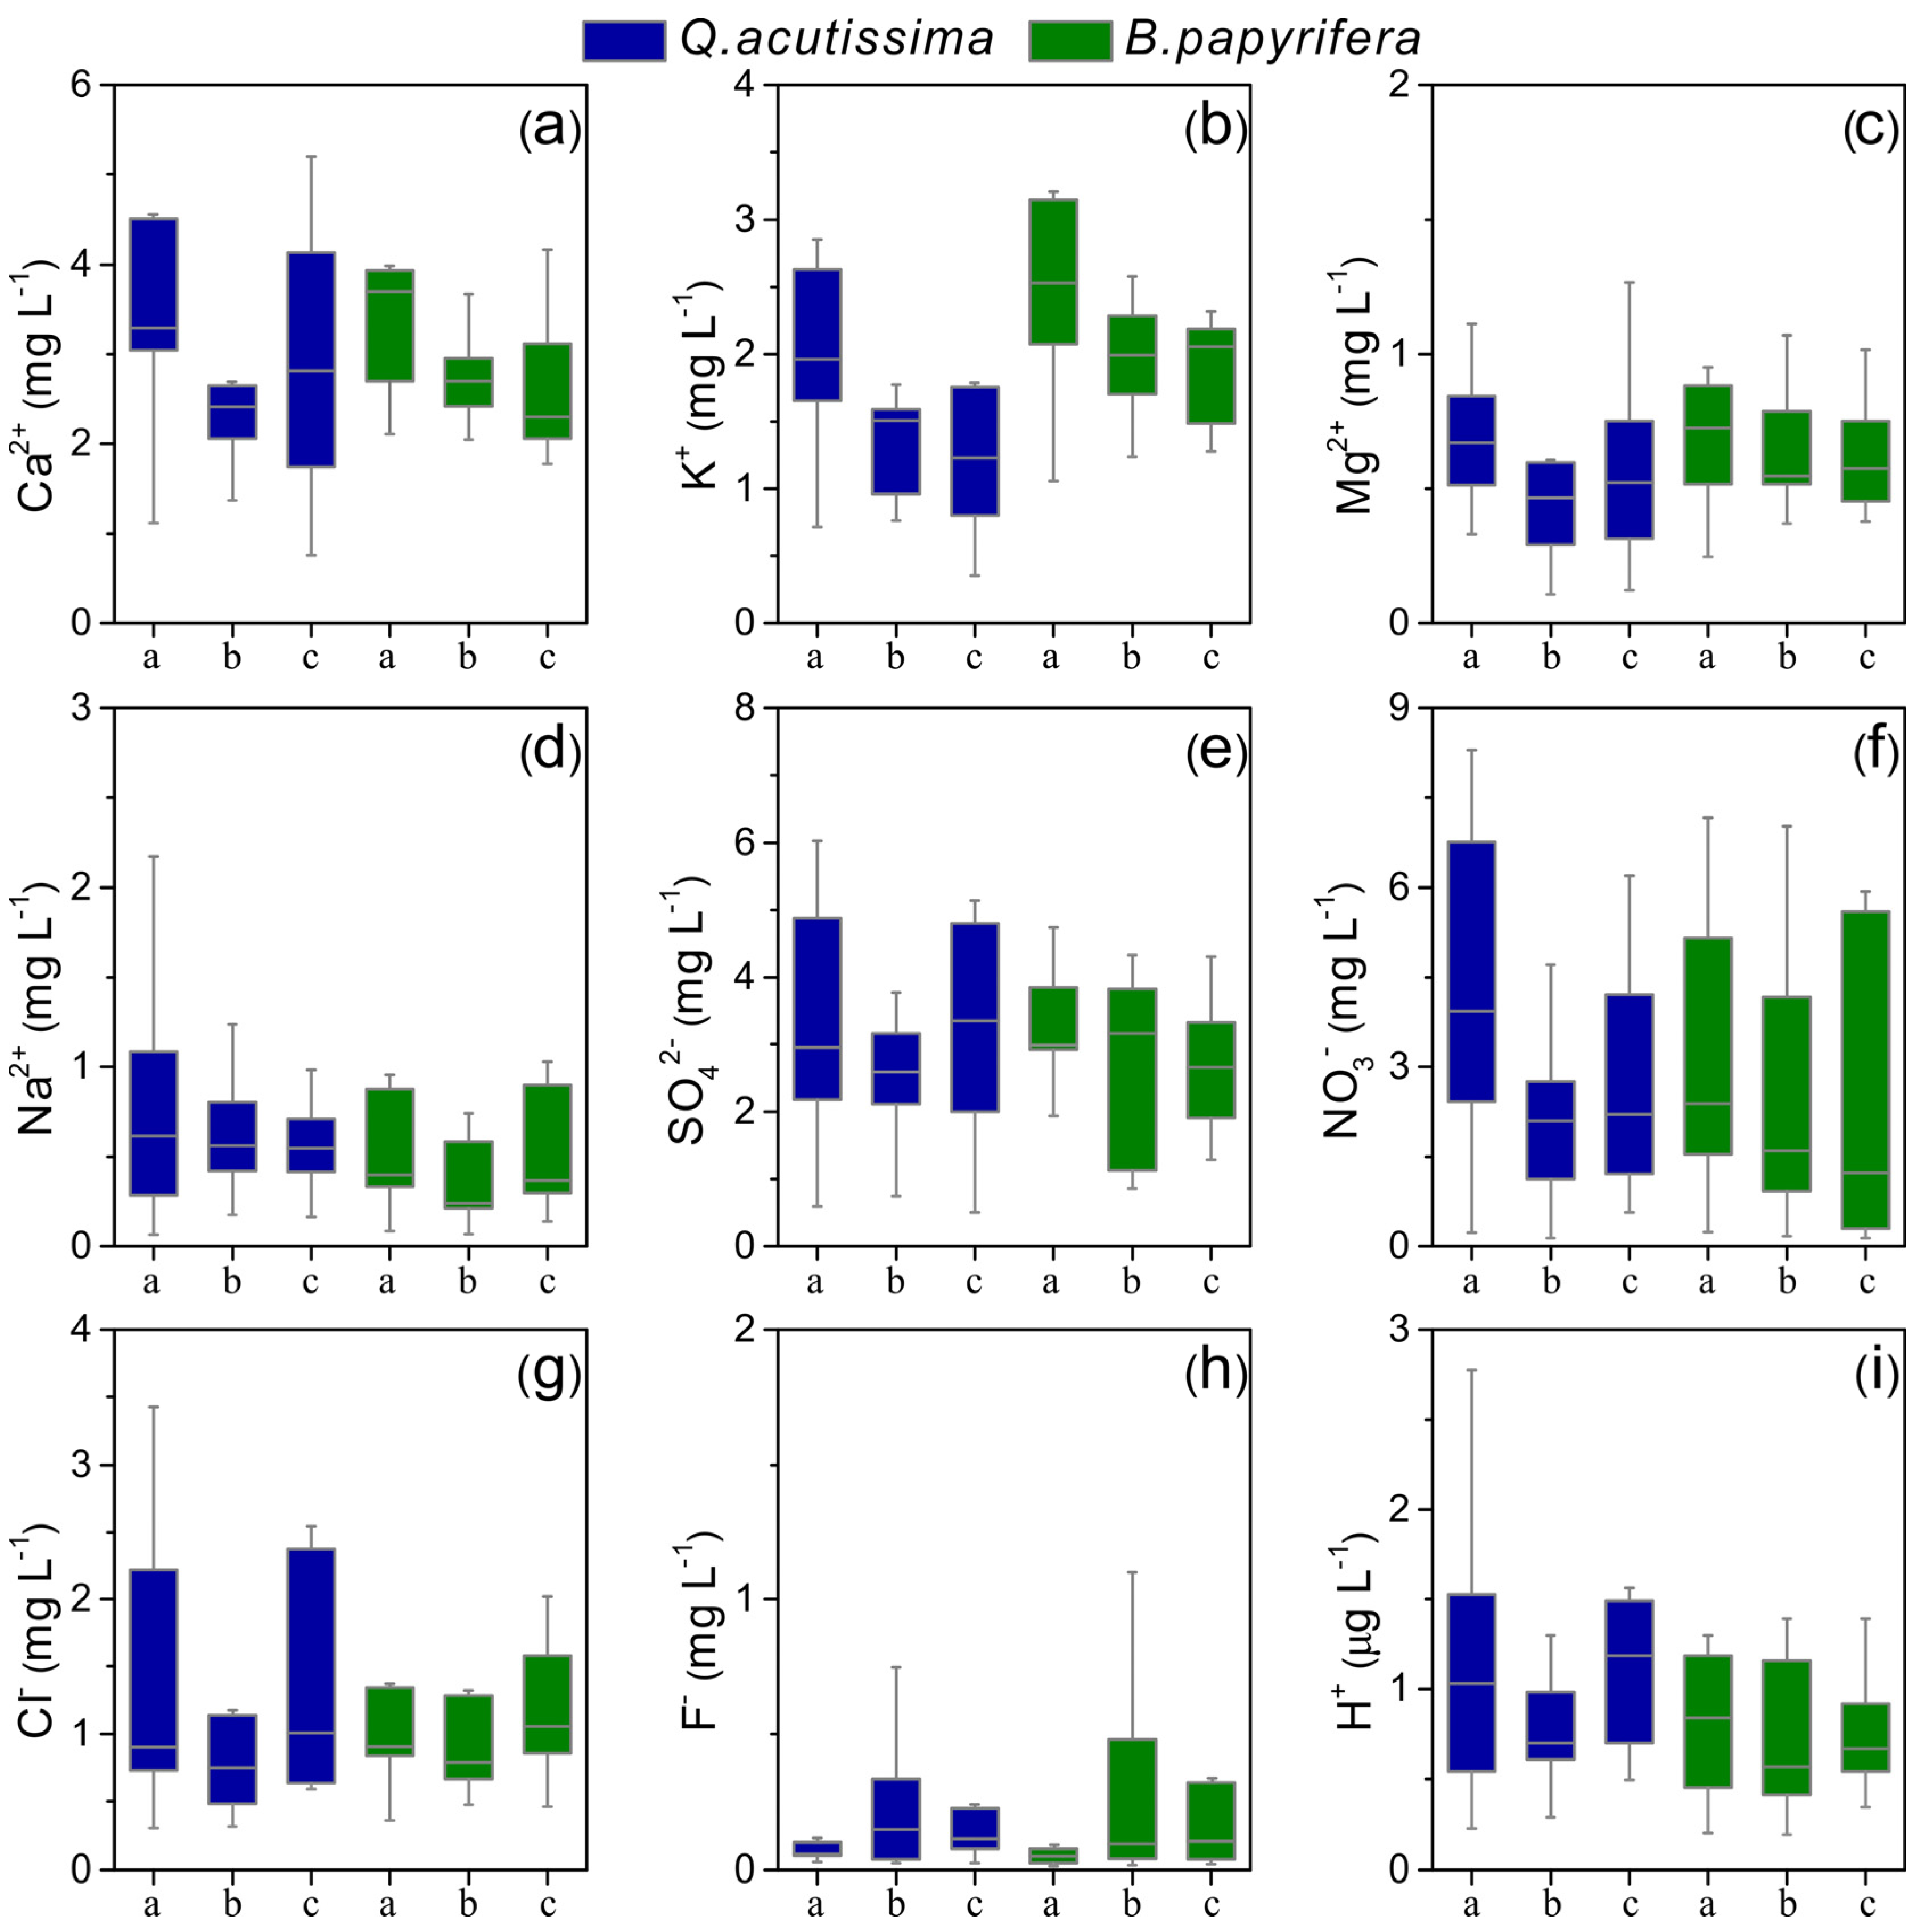
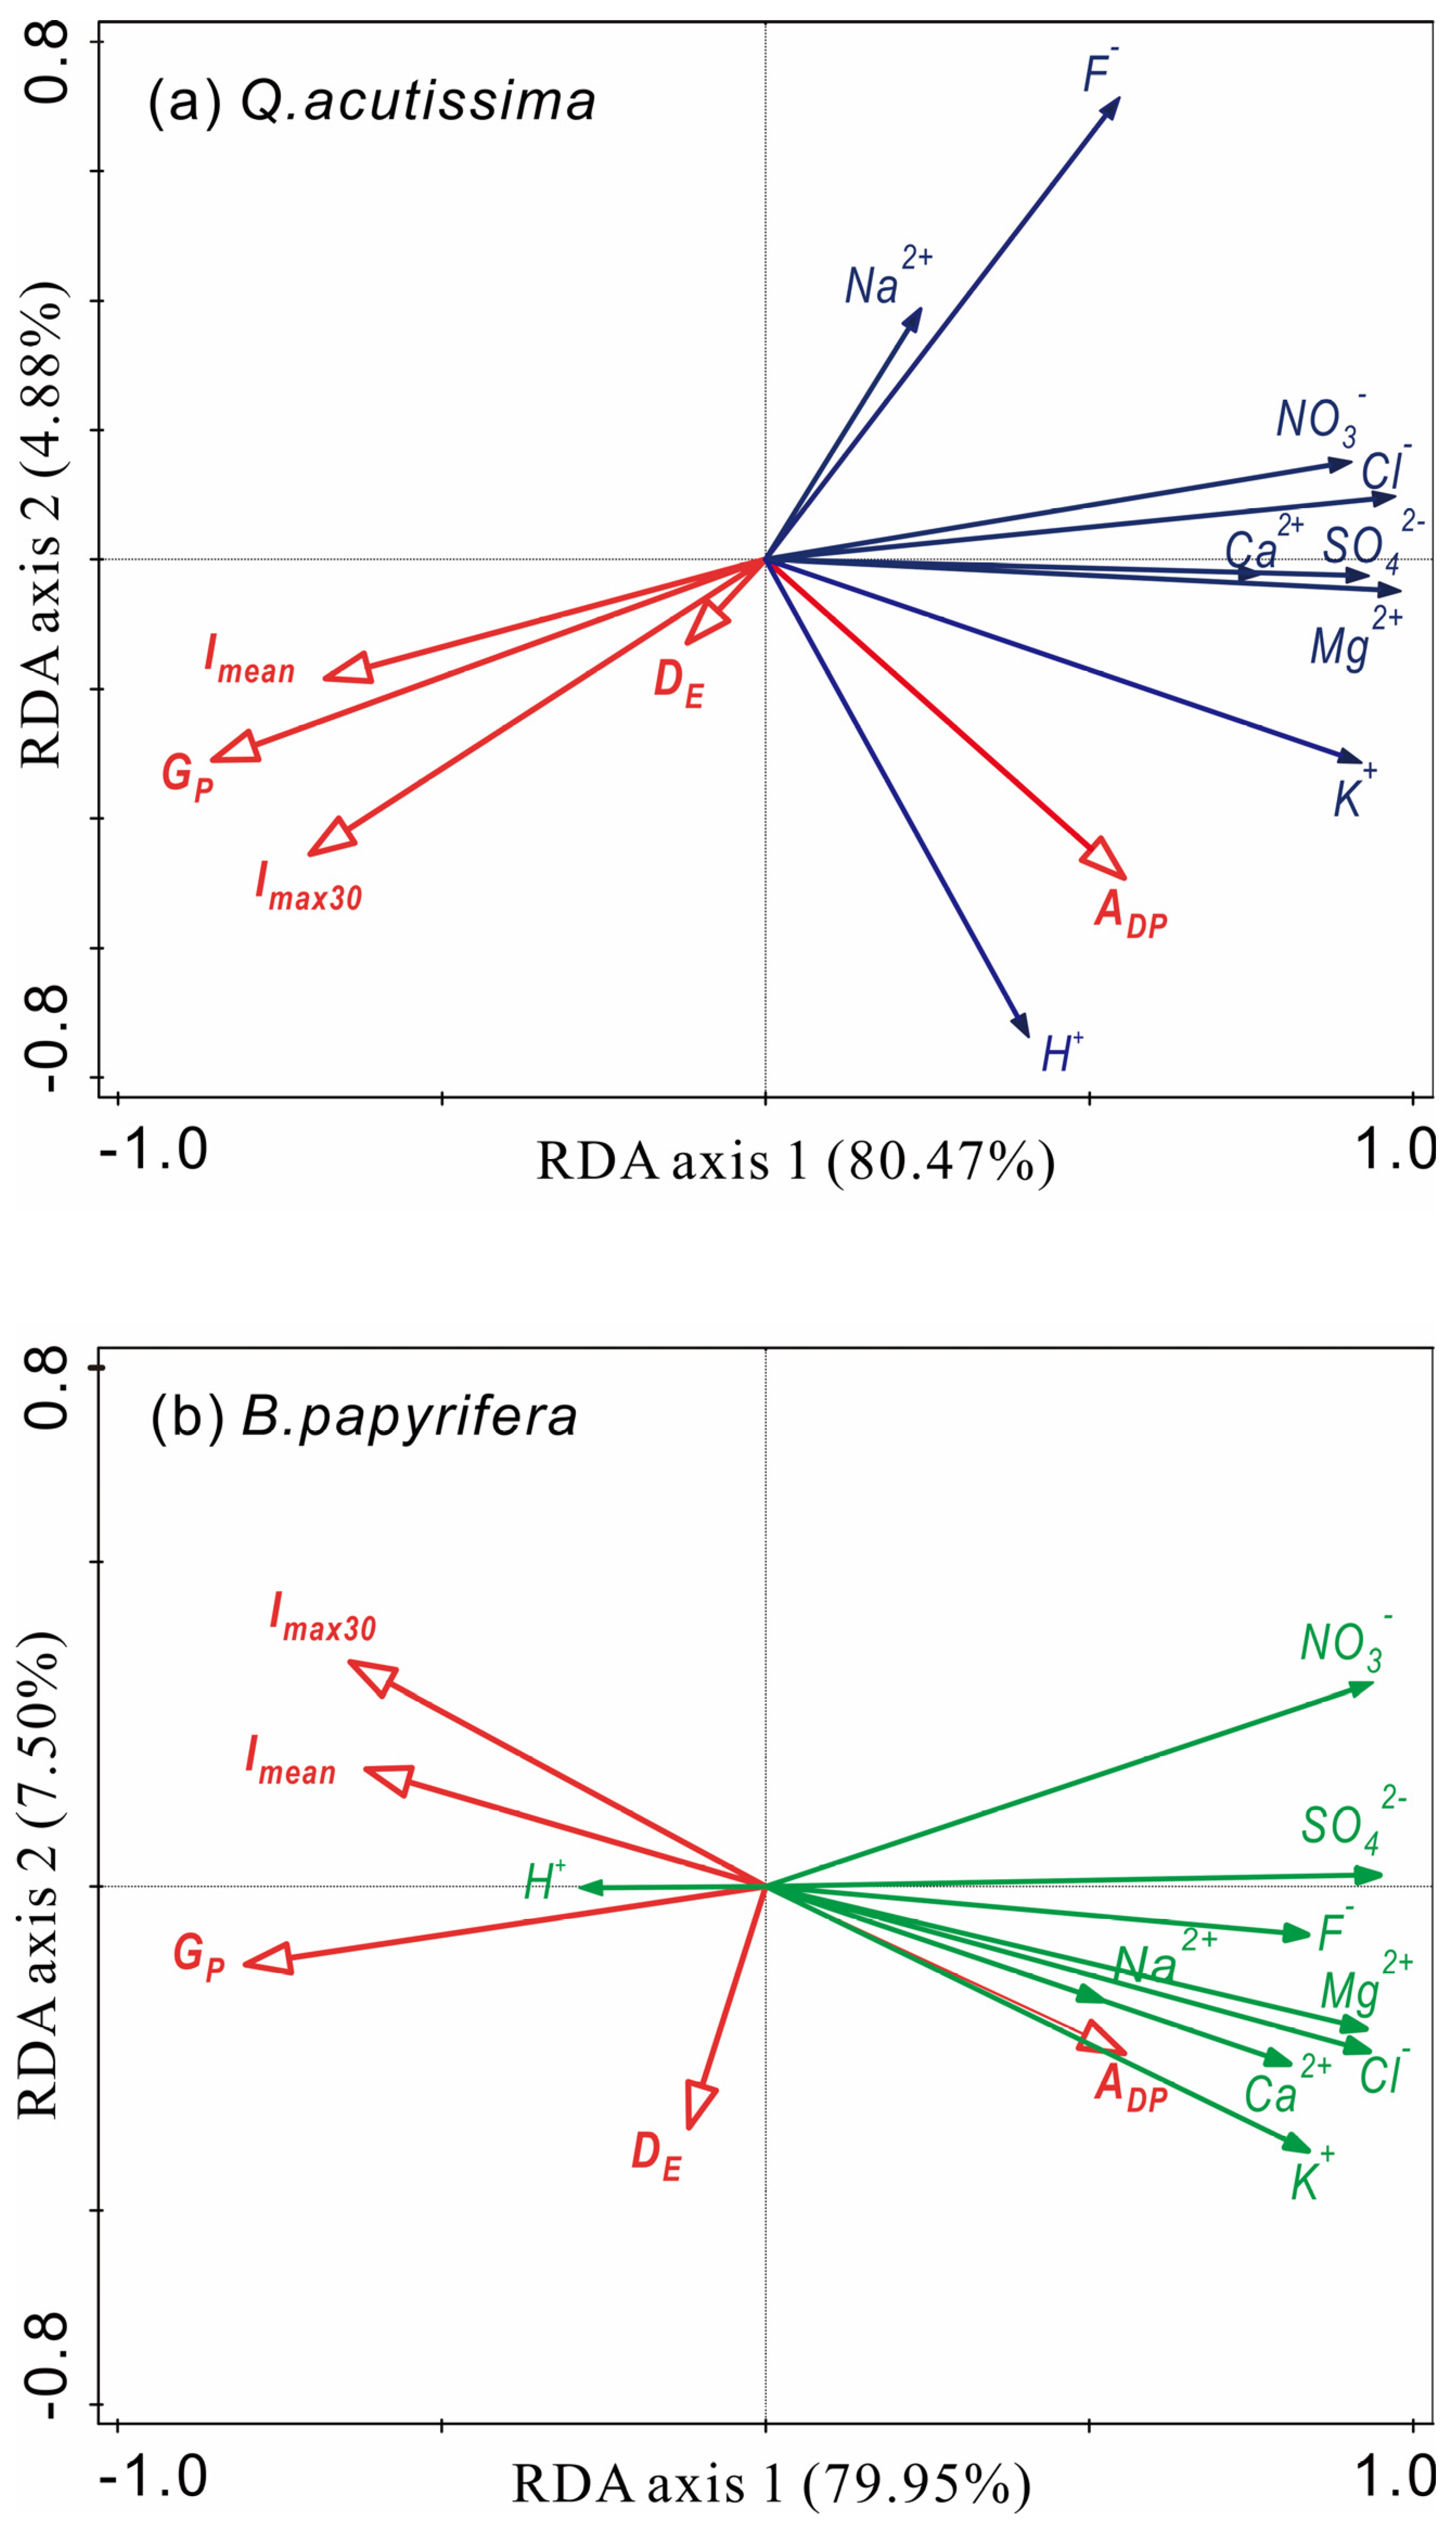
3.3. Throughfall and Associated Chemical Alterations in Relation to Trunk Distance

TF and TF% increased with increasing distance from the trunk for both tree species (Figure 4). TF was not significant different between different distances from the trunk for Q. acutissima (p = 0.61, H = 1.0) and B. papyrifera (p = 0.41, H = 1.77), while TF% was significantly different between different distances from the trunk for Q. acutissima (p = 0.0, H = 36.02) and B. papyrifera (p = 0.0, H = 26.16). The mean TF at the center, middle and edge for Q. acutissima was 32.0 (±27.9) mm, 35.3 (±29.8) mm, and 39.8 (±34.2) mm, respectively, and the corresponding values for B. papyrifera were 28.3 (±26.4) mm, 31.4 (±26.4) mm and 36.7 (±32.7) mm, respectively. The mean TF% at the center, middle and edge for Q. acutissima was 73.8 (±5.8)%, 81.9 (±6.4)% and 90.4 (±8.0)%, respectively, and the corresponding values for B. papyrifera were 64.1 (±13.5)%, 72.5 (±8.8)% and 83.4 (±7.3)%, respectively. Although the interaction between ions and distance from the trunk was not significant for Q. acutissima (p > 0.23, 0.07 < H < 2.95) and B. papyrifera (p > 0.16, 0.13 < H < 3.69), the concentrations and enrichment ratios of most ions (except for F) in throughfall increased since the trunk was approximated, especially for Ca2+, K+, Mg2+ and NO3 (Table 2; Figure 5). The concentrations and enrichment ratios of H+ in throughfall showed no gradient pattern along trunk distance, and the concentrations and enrichment ratios of F in throughfall close to the tree trunk were the lowest among different positions for the two species. The mean event dry deposition and canopy exchange of throughfall are present in Table 3. For the two tree species, the net throughfall fluxes of K+ and F were mainly determined by canopy exchange processes, while for other ions, dry deposition was found to be more important. Element fluxes is the result of multiplying a given ion concentration by the water depth. As a result, the fluxes, dry deposition, and canopy exchange of most ions showed a weaker gradient along the trunk distance compared to the concentration of these ions (Table 2; Figure 5; Table 3). Although the fluxes, dry deposition and canopy exchange of these ions were not significantly different between different distances from the tree trunk for Q. acutissima (p > 0.09, 0.38 < H < 4.91) and B. papyrifera (p > 0.11, 0.13 < H < 4.3), fluxes and dry deposition of Ca2+, Na2+, and Mg2+ were higher at the center than at other positions for the two species. The canopy exchange fluxes of K+ in throughfall was higher at the center than at other positions for Q. acutissima, but not for B. papyrifera (Table 3).

3.4. Throughfall and Associated Chemical Alterations in Relation to Rainfall Factors

According to the absolute value of the correlation coefficient (Abscc) of the correlation matrix analysis, the rainfall amount had a strong effect (Abscc > 0.7) on TF, while DE, Imean, and Imax30 had moderate (0.5 < Abscc < 0.7) or weak (0.3 < Abscc < 0.5) effects on TF%, and Imax30 had a moderate effect on CV for B. papyrifera, but had no effect on CV for Q. acutissima (Abscc < 0.3) (Figure 6; Table 4). As shown in Table 4, the regression equations between throughfall parameters and these rainfall factors all passed the 95% significance test level. Based on the significant positive linear equations between Gp and TF, the threshold Gp for generating throughfall at the center, middle and edge for Q. acutissima was 1.8 mm, 0.5 mm, and 1.1 mm, respectively, and the corresponding values for B. papyrifera were 3.2 mm, 0.1 mm, and 2.7 mm, respectively. In addition, the slope of these straight lines and curves between the rainfall factors (Gp, DE, Imean, and Imax30) and throughfall parameters (TF and TF%) increased with increasing distance from the trunk for both tree species (Table 4), indicating that throughfall at the canopy edge was more obviously affected by the rainfall conditions. The RDA results showed that Gp, ADP, Imean, and Imax30 were the variable combinations that significantly explained the throughfall ion concentrations, with 80.5% and 80.0% of the information explained for Q. acutissima and B. papyrifera, respectively (Figure 7). In addition, the concentrations of most ions (except H+ of B. papyrifera) in throughfall decreased with increasing Gp, Imean, and Imax30, and increased with increasing ADP. The concentration of H+ under the B. papyrifera canopies showed very weak positive correlations with Gp, Imean, and Imax30 (Figure 7).

4. Discussion

4.1. Throughfall and Chemical Alterations in Different Studies

Extensive studies have been carried out on throughfall for different plant types in different regions of the world, and differences in vegetation type and macroclimate lead to wide variations in throughfall. Yue et al. (2021) synthesized 2430 observational data from 236 independent published studies on rainfall partitioning by trees and shrubs and found that the TF% of global biological communities variated greatly from 7.8% to 98.1%, with a median value of 73% [16]. This review also showed that the mean and median TF% of broadleaf species (75.7% and 77.4%) were both higher than those of needleleaf plants (67.7% and 70.6%), indicating that forest types and tree species play an important role in the variation in throughfall. In this subtropical forest, the mean TF% was 83.0% and 74.7% for Q. acutissima and B. papyrifera, respectively, falling within the above range, which shows that our experimental results are reliable and comparable. For example, these results reflect those of Han (2014), who found that the TF% was 82.1% in a Quercus acutissima forest in subtropical China [46]; Jiang et al., (2021) who also found that the annual TF% was 68.0% in a Ficus microcarpa stand in subtropical China [5], and Cao et al., (2008) who found that the annual TF% was 75.6% in an Vernicia fordii plantation in subtropical China [31]. In the present experiment, the mean TF% under the Q. acutissima (83.0%) canopies was higher than that (74.7%) under the B. papyrifera canopies (Figure 2), which may be closely related to the variation in leaf morphology. The leaves of Q. acutissima (narrow elliptic, approximately 12.3 × 5.1 cm) are relatively smaller than those of B. papyrifera (broad ovate, approximately 12.3 × 7.7 cm) (Figure S1); thus, the smaller leaves of Q. acutissima were less effective in intercepting rainfall and allowed more of it to pass through [5]. In addition, the leaf surface of Q. acutissima was smoother than that of B. papyrifera (rough and hairy). Therefore, the leaves of Q. acutissima promote the formation of throughfall raindrops due to the high surface tension and hydrophobicity [47]. As other studies have concluded, our results also confirmed the important influence of leaf morphology (e.g., leaf area, size and surface) on throughfall generation.
The concentrations of almost all ions (except F) in throughfall of the two tree species were higher than those in Gp, which is consistent with previous observations [5,6,42]. This result indicated that the enrichment behavior of ions by the tree canopy was higher than the absorption behavior [17,42]. Among these ions, K+ had the highest enrichment ratio for Q. acutissima (29.3) and B. papyrifera (43.6) (Table 2). Similar results have also been reported from various regions [5,6,18]. For example, among the base ions, K+ concentration was altered the most with an enrichment ratio of 3.3–7.3 under Fagus sylvatica L. trees in northeastern Germany [6], an enrichment ratio of 2.4–2.7 in a subtropical broadleaved forest in southeastern China [42], and an enrichment ratio of 11.0–37.7 under Fagus sylvatica L. trees stand in Northern Belgium [18]. A reasonable explanation is that K+ is highly mobile due to the high concentration gradient between leaf xylem tissues, so it can easily flow out of leaf tissues during rainfall [15,18]. By comparison, the enrichment ratio of Ca2+ was the lowest among cations because Ca2+ is tightly bound to cell walls and chloroplasts (Table 2) [42]. The enrichment ratios of NO3 were 2.0 and 2.8 for Q. acutissima and B. papyrifera, respectively, and the corresponding values of SO42− were 1.5 for the two tree species (Table 2). Similarly, Kumar Gautam et al. (2017) reported that the enrichment ratios of NO3 (approximately 3.0) and SO42− (approximately 2.5) were lower than those of cations (e.g., K+, Mg2+, and Ca2+) under Robinia pseudoacacia trees in South Korea [48]. However, NO3 and SO42− in throughfall were enriched the most under eight Cerrado species in Brazil, with enrichment ratios as high as 21.7 and 33.4, respectively [49]. The main reasons for these differences in ion enrichment ratios (e.g., K+, NO3 and SO42−) among different study regions were likely related to canopy structure, leaf morphology, atmospheric pollution levels, distance from industrial areas or oceans, and rainfall conditions [49]. In addition, the pH of throughfall was slightly lower than that of rainfall (Table 2), suggesting that the rainwater had been rendered slightly acidic due to the enrichment of anions, such as NO3, SO42−, and Cl. Therefore, considerable differences in ionic chemistry between throughfall and rainwater suggest the role of the canopy in modifying and regulating internal nutrient cycling in forest ecosystems.

4.2. Effect of Trunk Distance on Throughfall and Associated Chemical Alterations

The relationships between the spatial variability in throughfall and trunk distance have been widely reported under different forest canopies [6,19], but there are significant differences among different forest systems. For example, there was a positive relationship between throughfall amount and distance from the trunk in a Larix gmelinii forest in northeastern China [23], while there was a negative relationship in a Pinus massoniana plantation in the subtropical area of southern China [31], and no significant correlation in a Pinus sylvestris L. stand with an admixture of Quercus petraea, Betula pendula Roth, and Sorbus aucuparia L. in central Poland [19]. Moreover, throughfall volume increased with distance from the trunk during summer, but decreased during winter in a mature Fagus sylvatica L. forest stand in northeastern Germany [6], which could be attributed to leaved or leafless periods. To examine throughfall spatial variation, TF was measured in different horizontal locations (center, middle and edge) under each tree canopy in this study (Figure 1). TF and TF% of the two tree species increased with increasing distance from the tree trunk (Figure 4), which confirms the results obtained in the same forest stand from October 2016 to December 2017 using a randomized sampling design [44]. The result of this study for tree trunk distance as a determining variable for throughfall volume corresponds with those of other investigations [12,15,18,20], which analyzed throughfall at different distances from the tree trunk and observed that the highest throughfall amounts were at positions under the center of the tree crown. One possible explanation is that the canopy near the tree trunk usually has a higher canopy thickness and leaf area index (LAI) than the crown edge, resulting in higher canopy interception loss and lower throughfall [6]. Collectors located at the canopy edge collected significantly more TF than the mean (Figure 4). This could be explained by the fact that the height of the canopy edge was usually the lowest of the whole crown, and the branches were mostly downfacing, which promotes the lateral flow of rainwater from the canopy center to the edge; consequently, throughfall was concentrated at the canopy edge [6,24]. Therefore, on the individual tree scale, the canopy seems to act as a natural “umbrella” [44], because it has an inherent inclined crown structure that can lead to the inhomogeneous distribution of rainwater in space.
The relationship between throughfall volume and trunk distance has been widely studied, but few studies have explored the chemical components in throughfall in relation to trunk distance within forests [6]. Unlike the spatial pattern of TF, the concentrations of most base ions near the trunk were higher than those at other areas of the canopy (Figure 5). The results are consistent with the findings on varying nutrient fluxes along the stem distance gradient in a Fagus sylvatica L. stand in northeastern Germany [6], a European Fagus sylvatica L. and Picea abies (L.) Karst. stand in northern Belgium [18], and a Picea abies (L.) Karst. plantation in southwest UK [36]. Explanations of this phenomenon may be related to the canopy shape that affects throughfall generation and its residence time on the canopy surface [2]. As discussed above, the canopy close to the tree trunk has the highest thickness and LAI, so it can protrude into the air mass, thus intercepting more gases and particles than the farther areas [36]. Evidently, the canopy close to the tree trunk has more deposition and canopy leaching processes during rainfall [6,18]. For the same reason, the opposite spatial gradient of element F in throughfall may be related to the stronger absorption capacity of the central canopy than the farther areas (Table 3). Another possibility is that the increased TF at the canopy edge diluted the concentrations of ions in throughfall (Figure 4 and Figure 5). An inverse relationship between the spatial pattern of throughfall chemical concentration and throughfall magnitude was also found beneath a Picea abies (L.) Karst. forest in Denmark [12] and in a mature Picea abies (L.) Karst. stand in Germany [13]. Compared with ion concentration, net throughfall fluxes (including dry deposition and canopy exchange) is the result of multiplying the concentration by water magnitude, and these present a weaker gradient along trunk distance (Table 3). The net throughfall fluxes of Na2+, SO42−, and Cl are assumed to originate almost entirely from particulate dry deposition [5], and the dry deposition of Ca2+, Mg2+, and NO3 were found to be more important than canopy leaching, as indicated by the results of the canopy budget model (Table 3). In addition, as shown in Table 3, the dry deposition of Ca2+, Na2+, and Mg2+ was higher at the center than at other positions, which confirmed that dry deposition is highest at the center of the canopy [15]. The net throughfall flux of K+ in throughfall mainly originated from canopy leaching (Table 3). As K+ in throughfall exhibited a gradient pattern that was similar to other ions, the canopy exchange processes may also lead to a higher solute flux near the tree trunk for Q. acutissima, in an identical way to the process of dry deposition, which may be attributed to a higher canopy thickness and LAI near the trunk, as previously described. Compared with Q. acutissima, the fluxes of NO3 and K+ of B. papyrifera showed weaker gradient patterns along trunk distance, which may be due to the higher exchange fluxes (canopy uptake for NO3 and canopy leaching for K+) at the middle and edge of the canopy than at the center of the canopy (Table 3). In this study, H+ showed a weak stem distance gradient, which supports similar finding in a Picea sitchensi site [14], in contrast to the studies by Beier et al. (1993) [12] and Seiler et al., (1995) [13], which found that H+ had a steeper stem gradient than other ions. One possible explanation is that the different uptake rates of H+ by foliage of trees with different physiological structures and nutrient statuses may interfere with dry deposition and canopy leaching, so H+ showed different gradient patterns among different tree species. The results above indicated that the interspecific differences in throughfall solute concentrations should be considered.

4.3. Rainfall Factors That Influence Throughfall and Associated Chemical Alterations

Rainfall factors are also very important in the spatial patterns of throughfall beneath the forest canopy [2,39,40]. In this study, significant linear/nonlinear relationships between throughfall parameters and some of the rainfall factors were detected (Figure 6, Table 4). For example, TF had highly significant positive relationships with Gp and Imax30 (Table 4). This indicated that a greater Gp and higher Imax30 will produce more TF, which is consistent with previous research results from other forest ecosystems [2,41]. TF% exponentially decreased with the decrease in DE. One possible explanation may be that events with long DE were usually accompanied by low rainfall intensity during the experimental period. For example, the rainfall event that began on September 25 delivered 66.7 mm of precipitation within 102.7 h, with Imean and Imax30 being only 0.65 mm h−1 and 0.8 mm h−1, respectively. The negative relationship between DE and TF% may presumably be due to the increased possibility of canopy interception loss and rainwater conversion to stemflow under lower rainfall intensity [40]. Conversely, a higher rainfall intensity could cause a strong instantaneous intense rain pulse, which might reduce the stemflow volume by increasing the probability of water dripping from the tree trunks and architecture [44], which was confirmed by the positive relationships between Imean/Imax30 and TF% (Table 4). Interestingly, the influence of rainfall factors on TF and TF% becomes more obvious with the increase in the distance from the trunk, which can be indicated by the slopes of the regression equations between the throughfall parameters and rainfall factors, which increased with the increase in distance from the trunk (Table 4). The possible explanation is that the interference of rainfall factors (e.g., rainfall amount and intensity) on the canopy accelerated the lateral translocation of rainwater from the central canopy to the periphery of the canopy. There were interspecific differences in the influence of rainfall factors on throughfall variability. For example, Imax30 exerted a significant negative impact on the CV of throughfall under B. papyrifera, while it had little influence on the CV of throughfall under Q. acutissima. Some previous studies suggested that the connectivity of rainwater flow paths in the forest canopy will be cut off under instantaneous high rainfall intensity (e.g., Imax30), which may release throughfall from the canopy, thereby reducing CV [22,41]. However, it is also observed that the increase in rainfall intensity increases the spatial variability in throughfall in a tropical forest [35]. Therefore, the spatial variability in throughfall is a consequence of rainfall interacting with the canopy [41].
Significantly fewer studies have examined the alterations in throughfall chemical components in relation to rainfall conditions at the event scale [2]. The findings from this study indicated that the variation in the concentration of ions under the forest canopy was attributed to several rainfall factors (Figure 7). As noted in previous studies [2], ADP is an important factor that determines throughfall chemistry, and it exerted a marked positive influence on the concentration and enrichment of most ions (except H+ for B. papyrifera) in throughfall in this study (Figure 7). An explanation for this phenomenon may be that the longer ADP makes the forest canopy intercept and retain more solute deposition, resulting in an increase in dry deposition wash-off flux during rainfall [50]. The chemical concentration and enrichment of most ions (except H+ for two species) in throughfall were inversely related to Gp (Figure 7), which coincides with the finding in a temperate deciduous forest in northeastern USA [50] and a Fagus sylvatica forest in southeastern England [51]. This may be because leaching and dry deposition washing are the most significant in the initial stage of a storm [2,51]. The enhancement of rainfall intensity (e.g., Imean and Imax30) may lead to the reduction in leaching fluxes, which may be because the residence time of throughfall on canopy surfaces is shortened under higher rainfall intensity, thus reducing the ion exchange between rainwater and canopy surfaces (e.g., leaf twigs and bark) [50]. Therefore, a higher rainfall intensity generally resulted in lower chemical concentrations and enrichment (Figure 7). However, unlike other ions, the concentration of H+ in throughfall for Q. acutissima was only affected by ADP, and the concentration of H+ in throughfall for B. papyrifera seemed to not be affected by any rainfall factors. Therefore, it is still difficult to generate a general impact pattern of rainfall characteristics for all ions. These findings indicated that the influence of rainfall factors on chemical concentrations is mainly achieved by regulating water behavior, dry deposition, and canopy exchange processes.

4.4. Limitations of the Study

This is the first study that presents estimations of the effect of trunk distance and rainfall on throughfall chemical components under two tree species in a subtropical forest at the event scale. As one of the most important canopy structure factors that affect throughfall variability, distance from the tree trunk was used to express canopy structure at the individual tree scale for Q. acutissima and B. papyrifera. Although we have detected the effect of distance from the tree trunk on throughfall water and chemical components, other canopy structure factors, such as canopy cover and leaf area index over each throughfall collector, were not considered in this study. Some previous studies have shown that canopy cover or leaf area index have an impact on the spatial variations in throughfall and chemical deposition on a small spatial scale [23,24], while some other studies found that the leaf area index had no impact on the spatial distribution of throughfall amount, but had a great effect on throughfall deposition [19]. These results suggest that the complex canopy structures and largely different nutrient statuses among different tree species led to these opposite relationships. For this reason, we only used distance from the tree trunk to explore the effect of canopy structure on throughfall, which may limit our deeper understanding of the regulation and redistribution of water and solute deposition by the forest canopy. In addition, previous studies have observed the seasonal pattern of the stem distance gradient of the throughfall water and chemical elements, which could be attributed to leaved or leafless periods. For example, Hansen (1996) found that the ratio between the throughfall deposition close to the trunk (0.3 m) and away from the trunk (1.6 m) was the largest during the dormant season for all measured substances, except NO3 and H+ in a Picea abies (L.) Karst. forest [15]. Jochheim et al. (2022) also found that throughfall volume increased with distance to stem during summer, but decreased during winter under Fagus sylvatica L. trees [6]. We did not observe this, mainly because the study period in our study was less than one year (9 months), preventing the analysis of seasonal or annual patterns.

5. Conclusions and Further Research Directions

This study explored the throughfall and associated chemical alterations between two tree species in a subtropical forest in eastern China, as well as the effects of canopy structure (expressed as the distance from the trunk) and rainfall factors at the event scale. The TF and TF% values of Q. acutissima were higher than those of B. papyrifera, due to the differences in leaf morphology. There was no significant species difference in the ion concentration of throughfall, but almost all ions (especially K+) were enriched after passing through the canopy of the two tree species. The canopy structure affects the spatial distribution of throughfall and associated ions, resulting in obvious trunk distance gradients of throughfall generation and ion concentrations. Due to the different water behavior, dry deposition and canopy leaching processes among different canopy horizontal locations (center, middle and edge), TF and TF% increased with increasing distance from the trunk, while throughfall ion concentrations increased, since the trunk was approximated. In addition, the rainfall amount, duration, and intensity had significant impacts not only on throughfall generation, but also on the ion concentrations in throughfall. The degree of this impact increased with increasing trunk distance. The antecedent dry period had a notable influence only on the ion concentration. Our results underline the need to consider the effects of tree species, canopy structure and rainfall factors on throughfall and associated chemical alterations. In the future, research is needed to explore whether the trunk gradient pattern of throughfall amount and nutrients will affect the spatial pattern of soil water, nutrients and even respiration. As shown in previous studies, besides throughfall, stemflow is another very important component of the water budget, which has an important impact on a series of hydrological and biochemical processes, so it is very necessary to consider both throughfall and stemflow to explore the hydrologic and nutrient budgets of trees. In addition, the applied method of interevent sampling of the throughfall solution severely limits the information value regarding its temporal variation and a higher sampling resolution (i.e., intra-event scale) would be helpful for understanding the dynamic transport of water and nutrients within forest ecosystems.

Supplementary Materials

The following supporting information can be downloaded at: https://www.mdpi.com/article/10.3390/f13101707/s1, Table S1: Summary of relevant studies on the relation between the spatial distribution of the water and chemical components of throughfall and distance to tree trunks. In the ‘Collector arrangement’ column, three components of the studies are identified by the code as follows: 1 throughfall collectors are arranged at different trunk distances under tree canopy, 2 throughfall collectors are arranged randomly, 3 throughfall collectors are arranged in lattice pattern, and 4 other arrangement patterns. In the ‘Key results’ column, the following two components of the studies are identified by the code: (a) the water and (b) chemical components of throughfall. Not all papers assessed all two components and these are denoted by N/A, representing ‘not applicable’; Figure S1: Leaf shape and area of Quercus acutissima and Broussonetia papyrifera. Q represents the leaf of Quercus acutissima and B represents the leaf of Broussonetia papyrifera, respectively. The distance between the two black vertical lines in the lower left corner of each picture is 1 cm. Refs. [6,8,12,13,14,15,18,19,20,22,23,24,25,26,27,28,29,30,31,32,33,34,35,36,37,38] have been cited in the supplementary materials.

Author Contributions

H.Z.: Conceptualization, Formal analysis, Investigation, Methodology, Writing—original draft; Writing—review and editing. H.W.: Conceptualization, Methodology; Review and editing. A.L.: Resources, Data curation; Funding acquisition. B.H.: Supervision; Funding acquisition. J.L.: Resources. N.W.: Investigation. Y.X.: Validation. Y.C.: Investigation. Z.Z.: Software. C.F.: Review and editing; Funding acquisition. All authors have read and agreed to the published version of the manuscript.

Funding

This study was funded by the National Key R&D Program of China, grant number (2019YFA0607100), Natural Science Foundation of Jiangsu Province, China (BK20220018), the National Natural Science Foundation of China, grant number (42101118, 41971044, 91847301, 92047203), Pioneer Hundred Talent Program, Chinese Academy of Sciences, grant number (Y7BR021001), NIGLAS startup project for introducing talents, grant number (Y7SL041001), the Science Foundation of Nanjing Hydraulic Research Institute (Y522017), the Strategic Priority Research Program of Chinese Academy of Sciences (#XDB40000000), and Jiangsu Innovative and Enterpreneurial Talent Programme (JSSCBS20211398).

Data Availability Statement

The data presented in this study are available upon request from the first author.

Acknowledgments

We would like to thank Chaoyu Zheng, Tongping Liu, Xiaohu Zhou, and Xuegang Li at the Chuzhou Scientific Hydrology Laboratory for their contributions to the collection of the field dataset.

Conflicts of Interest

The authors declare no conflict of interest.

References

  1. Hamilton, E.L.; Rowe, P.B. Rainfall Interception by Chaparral in California; State of California, Department of Natural Resources, Division of Forestry: Sacramento, CA, USA, 1949.
  2. Levia, D.F.; Frost, E.E. Variability of throughfall volume and solute inputs in wooded ecosystems. Prog. Phys. Geogr. Earth Environ. 2006, 30, 605–632. [Google Scholar] [CrossRef]
  3. Sadeghi, S.M.; Gordon, D.A.; Van Stan, J.T., II. A global synthesis of throughfall and stemflow hydrometeorology. In Precipitation Partitioning Byvegetation: A Global Synthesis; Van Stan, J.T., Gutmann, E.D., Friesen, J., Eds.; Springer: Cham, Switzerland, 2020; pp. 49–70. [Google Scholar]
  4. Molina, A.J.; Llorens, P.; Garcia-Estringana, P.; de Las Heras, M.M.; Cayuela, C.; Gallart, F.; Latron, J. Contributions of throughfall, forest and soil characteristics to near-surface soil water-content variability at the plot scale in a mountainous Mediterranean area. Sci. Total Environ. 2019, 647, 1421–1432. [Google Scholar] [CrossRef]
  5. Jiang, Z.Y.; Zhi, Q.Y.; Van Stan, J.T.; Zhang, S.Y.; Xiao, Y.H.; Chen, X.Y.; Yang, X.; Zhou, H.Y.; Hu, Z.M.; Wu, H.W. Rainfall partitioning and associated chemical alteration in three subtropical urban tree species. J. Hydrol. 2021, 603, 127109. [Google Scholar] [CrossRef]
  6. Jochheim, H.; Lüttschwager, D.; Riek, W. Stem distance as an explanatory variable for the spatial distribution and chemical conditions of stand precipitation and soil solution under beech (Fagus sylvatica L.) trees. J. Hydrol. 2022, 608, 127629. [Google Scholar] [CrossRef]
  7. Guswa, A.J.; Spence, C.M. Effect of throughfall variability on recharge: Application to hemlock and deciduous forests in western Massachusetts. Ecohydrology 2012, 5, 563–574. [Google Scholar] [CrossRef]
  8. Nanko, K.; Onda, Y.; Ito, A.; Moriwaki, H. Spatial variability of throughfall under a single tree: Experimental study of rainfall amount, raindrops, and kinetic energy. Agric. For. Meteorol. 2011, 151, 1173–1182. [Google Scholar] [CrossRef]
  9. Liu, Y.; Liu, S.; Wan, S.; Wang, J.; Wang, H.; Liu, K. Effects of experimental throughfall reduction and soil warming on fine root biomass and its decomposition in a warm temperate oak forest. Sci. Total Environ. 2017, 574, 1448–1455. [Google Scholar] [CrossRef] [Green Version]
  10. Lin, Y.; Kong, J.; Yang, L.; He, Q.; Su, Y.; Li, J.; Wang, G.; Qiu, Q. Soil Bacterial and Fungal Community Responses to Throughfall Reduction in a Eucalyptus Plantation in Southern China. Forests 2021, 13, 37. [Google Scholar] [CrossRef]
  11. Wang, Y.; Liu, S.; Luan, J.; Chen, C.; Cai, C.; Zhou, F.; Di, Y.; Gao, X. Nitrogen Addition Exacerbates the Negative Effect of Throughfall Reduction on Soil Respiration in a Bamboo Forest. Forests 2021, 12, 724. [Google Scholar] [CrossRef]
  12. Beier, C.; Hansen, K.; Gundersen, P. Spatial variability of throughfall fluxes in a spruce forest. Environ. Pollut. 1993, 81, 257–267. [Google Scholar] [CrossRef]
  13. Seiler, J.; Matzner, E. Spatial variability of throughfall chemistry and selected soil properties as influenced by stem distance in a mature Norway spruce (Picea abies, Karst.) stand. Plant Soil 1995, 176, 139–147. [Google Scholar] [CrossRef]
  14. Pedersen, L.B. Throughfall chemistry of Sitka spruce stands as influenced by tree spacing. Scand. J. For. Res. 1992, 7, 433–444. [Google Scholar] [CrossRef]
  15. Hansen, K. In-canopy throughfall measurements of ion fluxes in Norway spruce. Atmos. Environ. 1996, 30, 4065–4076. [Google Scholar] [CrossRef]
  16. Yue, K.; De Frenne, P.; Fornara, D.A.; Van Meerbeek, K.; Li, W.; Peng, X.; Ni, X.; Peng, Y.; Wu, F.; Yang, Y.; et al. Global patterns and drivers of rainfall partitioning by trees and shrubs. Glob. Chang. Biol. 2021, 27, 3350–3357. [Google Scholar] [CrossRef]
  17. De Schrijver, A.; Geudens, G.; Augusto, L.; Staelens, J.; Mertens, J.; Wuyts, K.; Gielis, L.; Verheyen, K. The effect of forest type on throughfall deposition and seepage flux: A review. Oecologia 2007, 153, 663–674. [Google Scholar] [CrossRef] [PubMed]
  18. Adriaenssens, S.; Hansen, K.; Staelens, J.; Wuyts, K.; De Schrijver, A.; Baeten, L.; Boeckx, P.; Samson, R.; Verheyen, K. Throughfall deposition and canopy exchange processes along a vertical gradient within the canopy of beech (Fagus sylvatica L.) and Norway spruce (Picea abies (L.) Karst). Sci. Total Environ. 2012, 420, 168–182. [Google Scholar] [CrossRef]
  19. Kowalska, A.; Boczoń, A.; Hildebrand, R.; Polkowska, Ż. Spatial variability of throughfall in a stand of Scots pine (Pinus sylvestris L.) with deciduous admixture as influenced by canopy cover and stem distance. J. Hydrol. 2016, 538, 231–242. [Google Scholar] [CrossRef]
  20. Hansen, K. In-canopy throughfall measurements in Norway spruce: Water flow and consequences for ion fluxes. Water Air Soil Pollut. 1995, 85, 2259–2264. [Google Scholar] [CrossRef]
  21. Sun, X.; Onda, Y.; Kato, H.; Gomi, T.; Liu, X. Estimation of throughfall with changing stand structures for Japanese cypress and cedar plantations. For. Ecol. Manag. 2017, 402, 145–156. [Google Scholar] [CrossRef]
  22. Zhang, H.X.; Wu, H.W.; Li, J.; He, B.; Liu, J.F.; Wang, N.; Duan, W.L.; Liao, A.M. Spatial-temporal variability of throughfall in a subtropical deciduous forest from the hilly regions of eastern China. J. Mt. Sci. 2019, 16, 1788–1801. [Google Scholar] [CrossRef]
  23. Sheng, H.; Cai, T. Spatial Variability of Throughfall in a Larch (Larix gmelinii) Forest in Great Kingan Mountain, Northeastern China. Forests 2021, 12, 393. [Google Scholar] [CrossRef]
  24. Ding, W.; Wang, F.; Han, J.; Ge, W.; Cong, C.; Deng, L. Throughfall and its spatial heterogeneity in a black locust (Robinia pseudoacacia) plantation in the semi-arid loess region, China. J. Hydrol. 2021, 602, 126751. [Google Scholar] [CrossRef]
  25. Magliano, P.N.; Whitworth-Hulse, J.I.; Florio, E.L.; Aguirre, E.C.; Blanco, L.J. Interception loss, throughfall and stemflow by Larrea divaricata: The role of rainfall characteristics and plant morphological attributes. Ecol. Res. 2019, 34, 753–764. [Google Scholar] [CrossRef]
  26. Hsueh, Y.; Allen, S.T.; Keim, R.F. Fine-scale spatial variability of throughfall amount and isotopic composition under a hardwood forest canopy. Hydrol. Processes 2016, 30, 1796–1803. [Google Scholar] [CrossRef]
  27. Bialkowski, R.; Buttle, J.M. Stemflow and throughfall contributions to soil water recharge under trees with differing branch architectures. Hydrol. Processes 2015, 29, 4068–4082. [Google Scholar] [CrossRef]
  28. Sun, X.; Onda, Y.; Chiara, S.; Kato, H.; Gomi, T. The effect of strip thinning on spatial and temporal variability of throughfall in a Japanese cypress plantation. Hydrol. Processes 2015, 29, 5058–5070. [Google Scholar] [CrossRef]
  29. Kato, H.; Onda, Y.; Nanko, K.; Gomi, T.; Yamanaka, T.; Kawaguchi, S. Effect of canopy interception on spatial variability and isotopic composition of throughfall in Japanese cypress plantations. J. Hydrol. 2013, 504, 1–11. [Google Scholar] [CrossRef]
  30. Mululo Sato, A.; de Souza Avelar, A.; Coelho Netto, A.L. Spatial variability and temporal stability of throughfall in a eucalyptus plantation in the hilly lowlands of southeastern Brazil. Hydrol. Processes 2011, 25, 1910–1923. [Google Scholar] [CrossRef]
  31. Cao, Y.; Ouyang, Z.Y.; Zheng, H.; Huang, Z.G.; Wang, X.K.; Miao, H. Effects of forest plantations on rainfall redistribution and erosion in the red soil region of Southern China. Land Degrad. Dev. 2008, 19, 321–330. [Google Scholar] [CrossRef]
  32. Shachnovich, Y.; Berliner, P.R.; Bar, P. Rainfall interception and spatial distribution of throughfall in a pine forest planted in an arid zone. J. Hydrol. 2008, 349, 168–177. [Google Scholar] [CrossRef]
  33. Keim, R.F.; Skaugset, A.E.; Weiler, M. Temporal persistence of spatial patterns in throughfall. J. Hydrol. 2005, 314, 263–274. [Google Scholar] [CrossRef]
  34. Carlyle-Moses, D.E.; Laureano, J.S.F.; Price, A.G. Throughfall and throughfall spatial variability in Madrean oak forest communities of northeastern Mexico. J. Hydrol. 2004, 297, 124–135. [Google Scholar] [CrossRef]
  35. Loescher, H.W.; Powers, J.S.; Oberbauer, S.F. Spatial variation of throughfall volume in an old-growth tropical wet forest, Costa Rica. J. Trop. Ecol. 2002, 18, 949. [Google Scholar] [CrossRef]
  36. Whelan, M.J.; Sanger, L.J.; Baker, M.; Anderson, J.M. Spatial patterns of throughfall and mineral ion deposition in a lowland Norway spruce (Picea abies) plantation at the plot scale. Atmos. Environ. 1998, 32, 3493–3501. [Google Scholar] [CrossRef]
  37. Loustau, D.; Berbigier, P.; Granier, A.; Moussa, F.E. Interception loss, throughfall and stemflow in a maritime pine stand. I. Variability of throughfall and stemflow beneath the pine canopy. J. Hydrol. 1992, 138, 449–467. [Google Scholar] [CrossRef]
  38. Stout, B.B.; McMahon, R.J. Throughfall variation under tree crowns. J. Geophys. Res. 1961, 66, 1839–1843. [Google Scholar] [CrossRef]
  39. Tanaka, N.; Levia, D.; Igarashi, Y.; Nanko, K.; Yoshifuji, N.; Tanaka, K.; Tantasirin, C.; Suzuki, M.; Kumagai, T.O. Throughfall under a teak plantation in Thailand: A multifactorial analysis on the effects of canopy phenology and meteorological conditions. Int. J. Biometeorol. 2015, 59, 1145–1156. [Google Scholar] [CrossRef]
  40. Zabret, K.; Rakovec, J.; Šraj, M. Influence of meteorological variables on rainfall partitioning for deciduous and coniferous tree species in urban area. J. Hydrol. 2018, 558, 29–41. [Google Scholar] [CrossRef]
  41. Carlyle-Moses, D.E.; Lishman, C.E. Temporal persistence of throughfall heterogeneity below and between the canopies of juvenile lodgepole pine (Pinus contorta). Hydrol. Processes 2015, 29, 4051–4067. [Google Scholar] [CrossRef]
  42. Sun, X.; Zhang, Z.; Cao, Y.; Liu, L.; Hu, F.; Lu, X. Canopy modification of base cations deposition in a subtropical broadleaved forest: Spatial characteristics, canopy budgets and acid neutralizing capacity. For. Ecol. Manag. 2021, 482, 118863. [Google Scholar] [CrossRef]
  43. Yu, H.; He, N.; Wang, Q.; Zhu, J.; Xu, L.; Zhu, Z.; Yu, G. Wet acid deposition in Chinese natural and agricultural ecosystems: Evidence from national-scale monitoring. J. Geophys. Res. Atmos. 2016, 121, 10995–11005. [Google Scholar] [CrossRef]
  44. Zhang, H.; Levia, D.F.; He, B.; Wu, H.; Liao, A.; Carlyle-Moses, D.E.; Liu, J.; Wang, N.; Li, J.; Fu, C. Interspecific variation in tree- and stand-scale stemflow funneling ratios in a subtropical deciduous forest in eastern China. J. Hydrol. 2020, 590, 125455. [Google Scholar] [CrossRef]
  45. Gu, W.Z.; Liu, J.F.; Lu, J.J.; Frentress, J. Current Challenges in Experimental Watershed Hydrology. In Current Perspectives in Contaminant Hydrology and Water Resources Sustainability; Bradley, P.M., Ed.; InTech: Rijeka, Croatia, 2013. [Google Scholar]
  46. Han, C. Study on Rainfall Redistribution in Typical Forest Stands of Nanjing Suburbs. Master’s Thesis, Nanjing Forestry University, Nanjing China, 2014. (In Chinese). [Google Scholar]
  47. Lenz, A.K.; Bauer, U.; Ruxton, G.D. An ecological perspective on water shedding from leaves. J. Exp. Bot. 2022, 73, 1176–1189. [Google Scholar] [CrossRef] [PubMed]
  48. Kumar Gautam, M.; Lee, K.; Song, B.Y. Deposition pattern and throughfall fluxes in secondary cool temperate forest, South Korea. Atmos. Environ. 2017, 161, 71–81. [Google Scholar] [CrossRef]
  49. Tonello, K.C.; Rosa, A.G.; Pereira, L.C.; Matus, G.N.; Guandique, M.E.G.; Navarrete, A.A. Rainfall partitioning in the Cerrado and its influence on net rainfall nutrient fluxes. Agric. For. Meteorol. 2021, 303, 108372. [Google Scholar] [CrossRef]
  50. Van Stan, J.T., II; Levia, D.F., Jr.; Inamdar, S.P.; Lepori-Bui, M.; Mitchell, M.J. The effects of phenoseason and storm characteristics on throughfall solute washoff and leaching dynamics from a temperate deciduous forest canopy. Sci. Total Environ. 2012, 430, 48–58. [Google Scholar] [CrossRef] [PubMed]
  51. Robson, A.J.; Neal, C.; Ryland, G.P.; Harrow, M. Spatial variations in throughfall chemistry at the small plot scale. J. Hydrol. 1994, 158, 107–122. [Google Scholar] [CrossRef]
Figure 1. Diagrams of the setup of throughfall collectors and photos of the throughfall collector and study site. Center, middle and edge represent the throughfall collectors placed at a position 0.2 m away from the tree trunk, at a position under the middle of the tree canopy, and at a position under the edge of the tree canopy, respectively. Note that this is only a schematic diagram and does not represent the scale of the real object.
Forests 13 01707 g001
Figure 2. Dynamics of event rainfall and throughfall from April to December 2018. GP: gross precipitation; TF,Q: throughfall amount under Quercus acutissima canopy; TF,B: throughfall amount under Broussonetia papyrifera canopy; TF%,Q: throughfall ratio under Quercus acutissima canopy; TF%,B: throughfall ratio under Broussonetia papyrifera canopy.
Forests 13 01707 g002
Figure 3. Ion concentrations in gross precipitation and throughfall under the Quercus acutissima canopy and Broussonetia papyrifera canopy. The gray boxes show the 25th percentiles (Q1) and 75th percentiles (Q3), respectively. The gray lines in the gray boxes are the median values. The upper whiskers (gray horizontal lines outside the boxes) and the lower whiskers represent Q3 + 1.5 × interquartile range (IQR) and Q1 − 1.5 × IQR, respectively. (a), (b), (c), (d), (e), (f), (g), (h), and (i) represents Ca2+, K+, Mg2+, Na2+, SO42−, NO3, Cl, F, and H+, respectively.
Forests 13 01707 g003
Figure 4. Throughfall amount and throughfall ratio along a trunk distance gradient under the Quercus acutissima canopy and Broussonetia papyrifera canopy. Center, middle and edge represent the throughfall collectors placed at a position 0.2 m away from the tree trunk, at a position under the middle of the tree canopy, and at a position under the edge of the tree canopy, respectively. The gray boxes show the 25th percentiles (Q1) and 75th percentiles (Q3), respectively. The gray lines in the gray boxes are the median values. The upper whiskers (gray horizontal lines outside the boxes) and the lower whiskers represent Q3 + 1.5 × interquartile range (IQR) and Q1 − 1.5 × IQR, respectively. (a) and (b) represents throughfall amount, (c) and (d) represents throughfall ratio, respectively.
Forests 13 01707 g004
Figure 5. Ion concentrations in throughfall along a trunk distance gradient under the Quercus acutissima canopy and Broussonetia papyrifera canopy. The labels on the horizontal coordinate axis, namely a, b, and c, respectively, represent the throughfall collectors placed at a position 0.2 m away from the tree trunk, at a position under the middle of the tree canopy, and at a position under the edge of the tree canopy. The gray boxes show the 25th percentiles (Q1) and 75th percentiles (Q3), respectively. The gray lines in the gray boxes are the median values. The upper whiskers (gray horizontal lines outside the boxes) and the lower whiskers represent Q3 + 1.5 × interquartile range (IQR) and Q1 − 1.5 × IQR, respectively. (a), (b), (c), (d), (e), (f), (g), (h), and (i) represents Ca2+, K+, Mg2+, Na2+, SO42−, NO3, Cl, F, and H+, respectively.
Forests 13 01707 g005
Figure 6. Correlation matrix between rainfall factors and throughfall parameters. GP: gross precipitation; DE: event duration; Imean: mean rainfall intensity; Imax30: maximum 30-min rainfall intensity; ADP: antecedent dry periods; TF,Q: throughfall amount under Quercus acutissima canopy; TF,B: throughfall amount under Broussonetia papyrifera canopy; TF%,Q: throughfall ratio under Quercus acutissima canopy; TF%,B: throughfall ratio under Broussonetia papyrifera canopy; CVQ and CVB represent the coefficient of variation of throughfall under Quercus acutissima canopy and Broussonetia papyrifera canopy, respectively. Center, middle and edge represent the throughfall collectors placed at a position 0.2 m away from the tree trunk, at a position under the middle of the tree canopy and at a position under the edge of the tree canopy, respectively.
Forests 13 01707 g006
Figure 7. Redundancy analysis (RDA) between rainfall factors and ion concentrations in throughfall under Quercus acutissima canopy and Broussonetia papyrifera canopy. GP: gross precipitation; DE: event duration; Imean: mean rainfall intensity; Imax30: maximum 30-min rainfall intensity; ADP: antecedent dry periods.
Forests 13 01707 g007
Table 1. Morphological characteristics of the studied trees from Quercus acutissima and Broussonetia papyrifera.
SpeciesTree NO.Diameter at Breast Height (cm)Basal Area (cm2)Height (m)Canopy Thickness (m)Tree Lean (°)Crown Area (m2)Crown Length (m)Leaf Surface/Area
Q. acutissimaQ114.9174.4 22.114.419.88.42.72Smooth/
(12.3 ± 0.9) × (5.1 ± 0.6) cm
Q216201.1 19.511.92.46.42.35
Q319.1286.6 20.115.42.523.63.29
Q420.4326.9 23.417.418.82.98
Q522.8408.3 22.415.47.932.64.43
B. papyriferaB113.1134.8 17.21016.39.73.59Rough/
(12.3 ± 1.2) × (7.7 ± 1.1) cm
B219.2289.6 19.616.816.516.54.91
B324.6475.4 21.315.811.139.15.58
Table 2. Mean event enrichment ratio of ion concentration, pH and electrical conductivity (EC) in throughfall at different distances from the tree trunk for Quercus acutissima and Broussonetia papyrifera.
SpeciesIonEnrichment Ratio of Throughfall
MeanCenterMiddleEdge
Q. acutissimaCa2+3.49 ± 2.054.63 ± 4.273.02 ± 2.053.04 ± 2.08
K+29.31 ± 18.5841.34 ± 35.3226.80 ± 16.6121.96 ± 13.30
Mg2+5.43 ± 4.007.73 ± 5.744.48 ± 3.844.36 ± 3.19
Na2+12.54 ± 18.4515.50 ± 29.3712.13 ± 16.9010.55 ± 12.85
SO42−1.54 ± 0.781.87 ± 1.581.34 ± 0.561.43 ± 0.54
NO31.96 ± 1.312.77 ± 2.121.44 ± 1.121.78 ± 1.01
Cl1.59 ± 1.001.85 ± 1.441.46 ± 1.311.49 ± 0.60
F0.56 ± 0.450.40 ± 0.320.67 ± 0.690.59 ± 0.51
H+11.71 ± 10.1612.46 ± 11.9710.20 ± 10.1113.04 ± 10.25
pH0.88 ± 0.100.89 ± 0.100.89 ± 0.110.87 ± 0.10
EC2.11 ± 0.662.81 ± 0.911.94 ± 0.711.59 ± 0.48
B. papyriferaCa2+3.81 ± 2.195.58 ± 5.013.14 ± 2.113.07 ± 2.11
K+43.55 ± 34.6649.31 ± 40.0443.31 ± 37.6939.42 ± 30.09
Mg2+7.01 ± 5.097.69 ± 5.426.23 ± 4.957.24 ± 5.97
Na2+8.82 ± 10.8315.61 ± 26.556.92 ± 9.225.39 ± 3.55
SO42−1.53 ± 0.701.68 ± 0.611.44 ± 0.851.49 ± 0.72
NO32.77 ± 3.763.94 ± 5.162.20 ± 3.432.30 ± 3.74
Cl1.64 ± 1.091.74 ± 1.311.53 ± 1.141.67 ± 1.08
F0.42 ± 0.220.29 ± 0.200.45 ± 0.250.48 ± 0.38
H+9.17 ± 8.088.97 ± 8.148.03 ± 7.2510.40 ± 10.53
pH0.87 ± 0.090.88 ± 0.080.87 ± 0.110.83 ± 0.11
EC2.93 ± 1.842.97 ± 1.293.12 ± 2.493.47 ± 2.91
Table 3. Mean event nutrient fluxes (kg ha−1 event−1) of rainfall, throughfall, dry deposition (DD), and canopy exchange (CE) at different trunk distances under Quercus acutissima and Broussonetia papyrifera. The nutrient fluxes unit of Ca2+, K+, Mg2+, Na2+, SO42−, NO3, Cl, and F is kg ha−1 event−1 and g ha−1 event−1 for H+.
SpeciesIonRainfallThroughfall
CenterMiddleEdge
FluxesDDCEFluxesDDCEFluxesDDCE
Q. acutissimaCa2+0.652.163.96−2.451.453.27−2.471.593.34−2.40
K+0.061.200.210.930.900.160.681.00.180.76
Mg2+0.080.340.40−0.140.200.33−0.210.240.34−0.18
Na2+0.090.440.3500.350.2600.320.230
SO421.231.520.2901.250.0201.510.280
NO31.111.910.750.050.990.28−0.401.440.38−0.05
Cl0.520.620.1000.570.0500.630.110
F0.270.040.18−0.410.100.09−0.260.080.07−0.26
H+0.110.40--0.44--0.75--
B. papyriferaCa2+0.652.433.53−1.751.261.54−0.931.561.97−1.05
K+0.061.190.170.961.140.071.011.270.161.05
Mg2+0.080.310.35−0.120.270.140.050.380.250.05
Na2+0.090.370.2800.170.0800.220.130
SO421.231.330.1001.240.0101.480.250
NO31.111.490.320.060.940.27−0.441.190.41−0.33
Cl0.520.570.0500.550.0300.670.150
F0.270.040.07-0.300.070.03−0.230.080.09−0.28
H+0.110.43--0.39--0.40--
Table 4. Regression equations between throughfall parameters and rainfall factors along a trunk distance gradient under Quercus acutissima canopy and Broussonetia papyrifera canopy.
Throughfall ParametersRainfall FactorsQ. acutissimaB. papyrifera
EquationR2EquationR2
TFGPTF1 = 0.77GP−1.360.99 ***TF1 = 0.71GP−2.290.93 ***
TF2 = 0.83GP−0.390.99 ***TF2 = 0.73GP−0.070.98 ***
TF3 = 0.95GP−1.030.99 ***TF3 = 0.91GP−2.490.99 ***
Imax30TF1 = 12.83e0.03Imax300.30 **TF1 = 9.43e0.03Imax300.43 ***
TF2 = 14.04e0.03Imax300.32 **TF2 = 11.74e0.03Imax300.36 **
TF3 = 15.09e0.03Imax300.32 **TF 3 = 14.05e0.03Imax300.32 **
TF%DETF%1 = 77.54e−0.002DE0.33 **TF%1 = 71.50e−0.005DE0.28 **
TF%2 = 85.94e−0.002DE0.32 **TF% 2 = 78.37e−0.003DE0.34 **
TF% 3 = 93.60e−0.001DE0.12TF% 3 = 87.02e−0.002DE0.21 *
ImeanTF%1 = 71.97Imean0.030.21 *TF%1 = 57.85Imean0.120.33 **
TF%2 = 79.28Imean0.040.38 **TF%2 = 68.55Imean0.070.38 **
TF%3 = 87.55Imean0.050.34 **TF%3 = 79.75Imean0.060.54 ***
Imax30TF%1 = 66.84Imax300.040.23 *TF%1 = 41.07Imax300.160.56 ***
TF%2 = 73.12Imax300.040.31 **TF%2 = 56.06Imax300.090.60 ***
TF%3 = 77.20Imax300.060.50 ***TF%3 = 71.83Imax300.050.41 ***
CVImax30CV = 0.01ln(Imax30)+0.080.04CV = −0.04ln(Imax30) + 0.220.41 ***
Notes: TF: throughfall amount; TF%: throughfall ratio; CV: coefficient of variation of throughfall; GP: gross precipitation; DE: event duration; Imean: mean rainfall intensity; Imax30: maximum 30-min rainfall intensity. The superscript numbers in TF and TF% refer to the positions along a trunk distance gradient. 1, 2 and 3 represent the throughfall collectors placed at a position 0.2 m away from the tree trunk, at a position under the middle of the tree canopy and at a position under the edge of the tree canopy, respectively. *** represents p < 0.001; ** represents p < 0.01; * represents p < 0.05.
Publisher’s Note: MDPI stays neutral with regard to jurisdictional claims in published maps and institutional affiliations.

