Article

Net Carbon Balance between Priming and Replenishment of Soil Organic Carbon with Biochar Addition Regulated by N Addition Differing in Contrasting Forest Ecosystems

1
School of Forestry & Landscape Architecture, Anhui Agricultural University, Hefei 230036, China
2
Huitong Experimental Station of Forest Ecology, CAS Key Laboratory of Forest Ecology and Management, Institute of Applied Ecology, Shenyang 110016, China
*
Author to whom correspondence should be addressed.
Forests 2022, 13(10), 1710; https://doi.org/10.3390/f13101710
Submission received: 5 September 2022 / Revised: 3 October 2022 / Accepted: 14 October 2022 / Published: 17 October 2022
(This article belongs to the Special Issue Biochar—What Still Needs to Be Done?)

Abstract

:
The replenishment and priming effect (PE) are two decisive processes that determine the carbon (C) sequestration potential of biochar. However, how increased nitrogen (N) availability affect these two processes and the consequent net C balance remains poorly understood. By collecting soils from three forest ecosystems (deciduous broad-leaf forest (DBF), evergreen coniferous forest (ECF), and evergreen broad-leaf forest (EBF)), we conducted a 365-day incubation experiment by adding 13C-labelled biochar plus five rates of inorganic N (0 to 15% N of soil total N). The -results showed that N addition significantly stimulated the early period (0–48 days) but did not affect the late period (49–365 days) of biochar decomposition. The effect of N addition on PE varied largely with the forest type and decomposition period; N addition significantly enhanced the negative PE -in both periods in DBF and at the late period in EBF, whereas it stimulated positive PE in the early period in EBF and ECF. At the end of incubation, the addition of biochar caused net C accumulation across all treatments due to the huge proportion of biochar (98.1%–98.9% of added biochar) retained in soils and the negative or neutral cumulative PE (−11.25–0.35 g C kg−1 SOC), and the magnitude of net C balance increased linearly with the N addition rate in DBF and EBF. Collectively, the results of this study indicate that biochar input can contribute to soil C sequestration and that N addition can enhance the C sequestration potential of biochar.

1. Introduction

Biochar is generally regarded as biologically recalcitrant due to its high resistance to microbial degradation [1,2] and, consequently, can persist in soils for hundreds or even thousands of years [3,4]. Therefore, incorporating biochar into soils has been proposed as a useful method to sequester carbon and mitigate global warming [5,6,7]. However, biochar application in soil may also alter the decomposition of native soil organic C (SOC) via the priming effect (PE), which regulates the feedback between soil C dynamics and climate change [8,9]. In general, a positive PE can accelerate the decomposition of native SOC, leading to positive feedback on climate change, while a negative PE can suppress it and mitigate climate change. Given the expected increases in fire frequency and intensity likely to occur with future climate change [10], the quantity of biochar will also increase in forest ecosystems. Thus, a better understanding of soil C dynamics following biochar input is critical to predicting future changes in soil C cycling and its feedback on global climate change.
In the last two decades, the biochar-inducted PE on native SOC decomposition has received increasing attention in the context of global environmental change [2,11,12]. However, the direction of PE reported in different experiments are inconsistent, showing a positive effect [13,14], negative effect [15,16] or no effect [17,18]. It has been reported that both the direction and magnitude of biochar priming can be influenced by a wide range of soil and biochar characteristics [2,19], among which soil nutrient (particularly nitrogen) availability has long been regarded as a fundamental factor [20,21]. Over the past few decades, atmospheric N deposition due to anthropogenic activities has continuously increased in large parts of the world [22,23]. This may greatly increase soil N availability and consequently influence the biochar-induced PE. To date, however, only one study has investigated the influence of N addition on biochar priming in a forest ecosystem [24]. Therefore, more experiments are urgently needed to improve our understanding of the relationship between N availability and the biochar-induced PE in forest ecosystems.
Besides PE, replenishment is another important process influencing the direction and magnitude of SOC dynamics following exogenous organic C inputs [25,26] and, can potentially increase SOC accumulation by compensating for the primed SOC loss. Therefore, even if positive PE occurs, a decrease in SOC storage is not necessarily inevitable. Despite the widespread acceptance of the importance of replenishment, most priming studies have only emphasized soil C loss through priming, resulting in considerable uncertainty about the net effect of biochar input on soil C dynamics [14,27,28]. Furthermore, the enhanced soil N availability due to increasing input of atmospheric N deposition may also affect the magnitude of replenishment following biochar addition [15,24]. However, no studies have been conducted to simultaneously investigate the effect of N addition on the two processes (i.e., priming and replenishment) and the consequent net C balance.
In this study, we conducted a 365-day laboratory incubation experiment by adding 13C labeled biochar with or without inorganic N into three forest soils with contrasting properties. The 13C isotopic differences between native SOC and biochar allowed us to quantify the CO2-C sources from the decomposition of native SOC and the added biochar. The objectives of this study were to investigate the responses of replenishment, priming, and their net change to N addition. We hypothesized that: (1) biochar addition would promote SOC decomposition (i.e., positive PE); (2) N addition would reduce the intensity of PE according to the microbial N mining theory; (3) SOC content would increase due to the greater magnitude of replenishment compared to priming, and such an increase should depend on the added N rate and forest type.

2. Materials and Methods

2.1. Soil Sampling and 13C-Labelled Biochar Production

Soils used in this experiment were collected from three forest ecosystems, including a deciduous broad-leaf forest (DBF) in the Nanwan Forest reserve (32°06′ N, 114°01′ E), an evergreen coniferous forest (ECF) at the Huitong National Research Station of Forest Ecosystem (26°50′ N, 109°45′ E), and an evergreen broad-leaf forest (EBF) in the Yingzuijie National Nature Reserve (26°46′ N, 109°49′ E). Basic information on the three forests is given in Table 1.
The mineral soil (0–10 cm) was collected from the three forests in June 2017. In each forest, four plots (15 m × 15 m) were selected, and ten soil cores with an inner-diameter of 5 cm were randomly collected in each plot after the removal of surface plant litter. Soil cores from the same forest were combined and thoroughly mixed as a composite sample. Plant roots, stones, and impurities were removed by passing soil through a 2 mm sieve in the laboratory. Soils from the three forests had different physicochemical properties (Table 1).
Chinese fir is a major timber species that has been extensively planted in provinces of southern China [29]. In plantation management, managers usually use slash burning to deal with the cutting residues, thus producing a large amount of biochar in soils [30]. Therefore, in this experiment, we used 13C-labeled seedling stems of Chinese fir as the parent material of biochar. Uniformly 13C-labeled seedling stems were obtained using 13CO2 gas (99.9% abundance) in a growth chamber for 3 months. Biochar was produced by a slow-pyrolysis process under a “no-oxygen” condition. Before pyrolysis, tree stems were dried at 100 °C for 12 h, and then transferred into the biochar reactor. The initial temperature was set at 150 °C and gradually (10 °C min−1) elevated to 380 °C, equivalent to the temperature of forest surface fires, which account for approximately 94% of forest fires [31]. The pyrolysis process was maintained at 380 °C for 90 min. To create a no-oxygen condition, N2 was introduced into the biochar reactor during the entire pyrolysis process. The resulting biochar was then crushed with a mortar and sieved to 0.5 mm. The C and N contents of the biochar were 648.2 g kg−1 and 14.1 g kg-1, the pH was 9.04, and the δ13C value was 602.5‰.

2.2. Experiment Design and Soil Incubation

In this experiment, six treatments with four replicates were set up for each forest soil: BN0, BN1, BN2, BN3, and BN4 (adding biochar plus 0%, 2.5%, 5.0%, 10.0% and 15.0% N of soil total N, respectively), and a control (without the addition of biochar and N). The amount of biochar C was added as 5% of the SOC concentration. Thus, a total of 72 sample incubations (3 forests × 6 treatments × 4 replicates) were included in this experiment.
For incubation, 150 g of soil (dry weight) for each sample incubation was weighed in a 1 L Mason jar and then pre-incubated in the dark at 25 °C for 24 h. After pre-incubation, biochar and water solutions of NH4NO3, according to experimental design, were added to the soils and thoroughly mixed. Finally, deionized water was used to adjust the soil moisture to a 60% water-holding capacity. All jars were incubated in the dark at 25 °C for 365 days.
To measure the CO2 efflux rate and its δ13C, gas samples were sampled from jars on days 1, 2, 4, 7, 10, 15, 20, 27, 34, 41, 48, 55, 65, 76, 92, 113, 143, 173,217, 264, 313, and 365 after the start of incubation. Before each gas sampling, CO2-free air was used to flush the jar headspace for 2 min to ensure that there was no CO2 in the jar. Thereafter, jars were immediately sealed by closing the manual valve. According to the CO2 release from the soil, gas was collected 12–36 h after sealing using a 200 mL syringe and then transferred into a gas bag. The concentration and δ13C value of sampled CO2 were analyzed by a stable isotope-ratio mass spectrometer (Picarro G2131-i Analyzer; Picarro, Inc., Santa Clara, CA, USA).

2.3. Calculation of CO2 and Priming Effect

The amount of CO2-C derived from biochar and SOC decomposition was calculated as follows [9]:
C B = C T × δ T δ S / δ B δ S
C S = C T × δ B δ T / δ B δ S
where CT (CT = CB + CS) is the total amount of CO2-C during the considered time interval, CB is the amount of CO2-C derived from biochar, CS is the amount of CO2-C derived from native SOC, δT is the δ13C value of CT, δB is the initial δ13C value of biochar and δS is the initial δ13C value of native SOC.
The soil’s cumulative emission of CO2 (T, mg C kg−1 SOC) at the early and late periods of decomposition was calculated as follows [32]:
T = i = 1 n E i + E i + 1 / 2 × t i + 1 t i
where Ei and Ei+1 are the soil CO2 efflux rate (mg C kg−1 SOC day−1) at ith and (i+1)th incubation time, respectively, ti+1ti is the interval between the ith and (i+1)th incubation time (day), and n is the number of incubation times. Therefore, the average soil CO2 emission (mg C kg−1 SOC day−1) at early and late decomposition periods was calculated by dividing T by the number of days in each period.
Here, the early period of biochar decomposition was defined as the stage presenting a rapid decrease in the CO2 efflux rate with time (approximately the first 48 days), while the stage in the following 317 days (49–365 days) that presents a relatively stable and lower CO2 efflux rates was defined as the later period. This distinction was highly consistent across all 3 forest soils (Figure S1).
The PE induced by biochar addition with or without N was calculated as the difference between the CO2–C derived from native SOC in the presence of biochar treatment (CO2-Cbiochar) and the corresponding control (CO2-Ccontrol) as follows (Wang et al., 2014):
P E = C O 2 - C b i o c h a r C O 2 - C c o n t r o l

2.4. Measurement of Soil Properties

Total C and N in soils were measured by a CN elemental analyzer (Elementar Vario, Hanau, Germany). Total P, available phosphorus (P) and mineral N (NH4+ and NO3−) in soils were analyzed by a continuous flow analyzer (AA3, Seal Analytical, Norderstedt, Germany). Dissolved organic C (DOC) in soils was determined using a TOC analyzer (Vario TOC cube; Elementar, Hanau, Germany). Soil texture and microbial biomass C and N were analyzed using the hydrometer method and chloroform fumigation-extraction method, respectively [33,34]. Soil pH was determined by a pH meter. In addition, the ratio of resource C:N (DOC to mineral N) to microbial biomass C:N was used to reflect the C:N imbalance between resources and microorganism [35,36]. A lower C:N imbalance implies higher N availability relative to C availability and could thereafter be used as an agent of microbial N limitation [36,37]; that is, the higher the C:N imbalance, the more severe the microbial N limitation.

2.5. Statistical Analysis

SPSS 21.0 software was used to perform all statistical analyses. The effects of forest type, N addition, decomposition period, and their possible interactions on the rates of biochar decomposition and PE were analyzed by three-way ANOVAs. The effects of forest type, N addition, as well as their interactions on the cumulative biochar decomposition, cumulative PE, and net C balance were assessed by two-way ANOVAs. The significant differences in the biochar decomposition rate and PE within N treatments for each forest type at each sampling time were analyzed by one-way ANOVA. Post Hoc Tests of multiple comparisons were assessed by the least significant difference test (LSD) for all data. A linear regression model was employed to explore the relationships of net C balance with N addition rates. Significant differences for all statistical tests were based on p < 0.05.

3. Results

3.1. Biochar Decomposition

During the 365 days of incubation, two distinct biochar decomposition stages were observed for all biochar treatments, namely, the early period (approximately 0–48 days), which displayed a high but quickly decreasing decomposition rate, and then switched to a slow and stable stage in the later period (49–365 days; Figure S1). N addition significantly stimulated the biochar decomposition rate within the first 10 days in DBF, while this stimulating effect lasted until 41 days in EBF and ECF. Results of three-way ANOVA indicated a significant interactive effect of N addition and the decomposition period on the biochar decomposition rate (Table S1); N addition significantly elevated the biochar decomposition rate in the early period, but did not influence it in the late period (Figure 1a).
At the end of incubation, about 1.09% to 1.92% of added biochar was decomposed across all treatments (Figure 1b). The cumulative decomposition of biochar was significantly influenced by forest type and N addition (Table S2). Regardless of N addition, the average cumulative decomposition of biochar in ECF (1.23% added) was significantly lower than that in DBF (1.26% added) and EBF (1.31% added) (Figure 1b). Furthermore, the cumulative decomposition of biochar was significantly elevated by BN4 treatment in DBF and BN3 and BN4 treatments in EBF and ECF. No interactive effect between forest type and N addition on cumulative biochar decomposition was observed (Table S2).

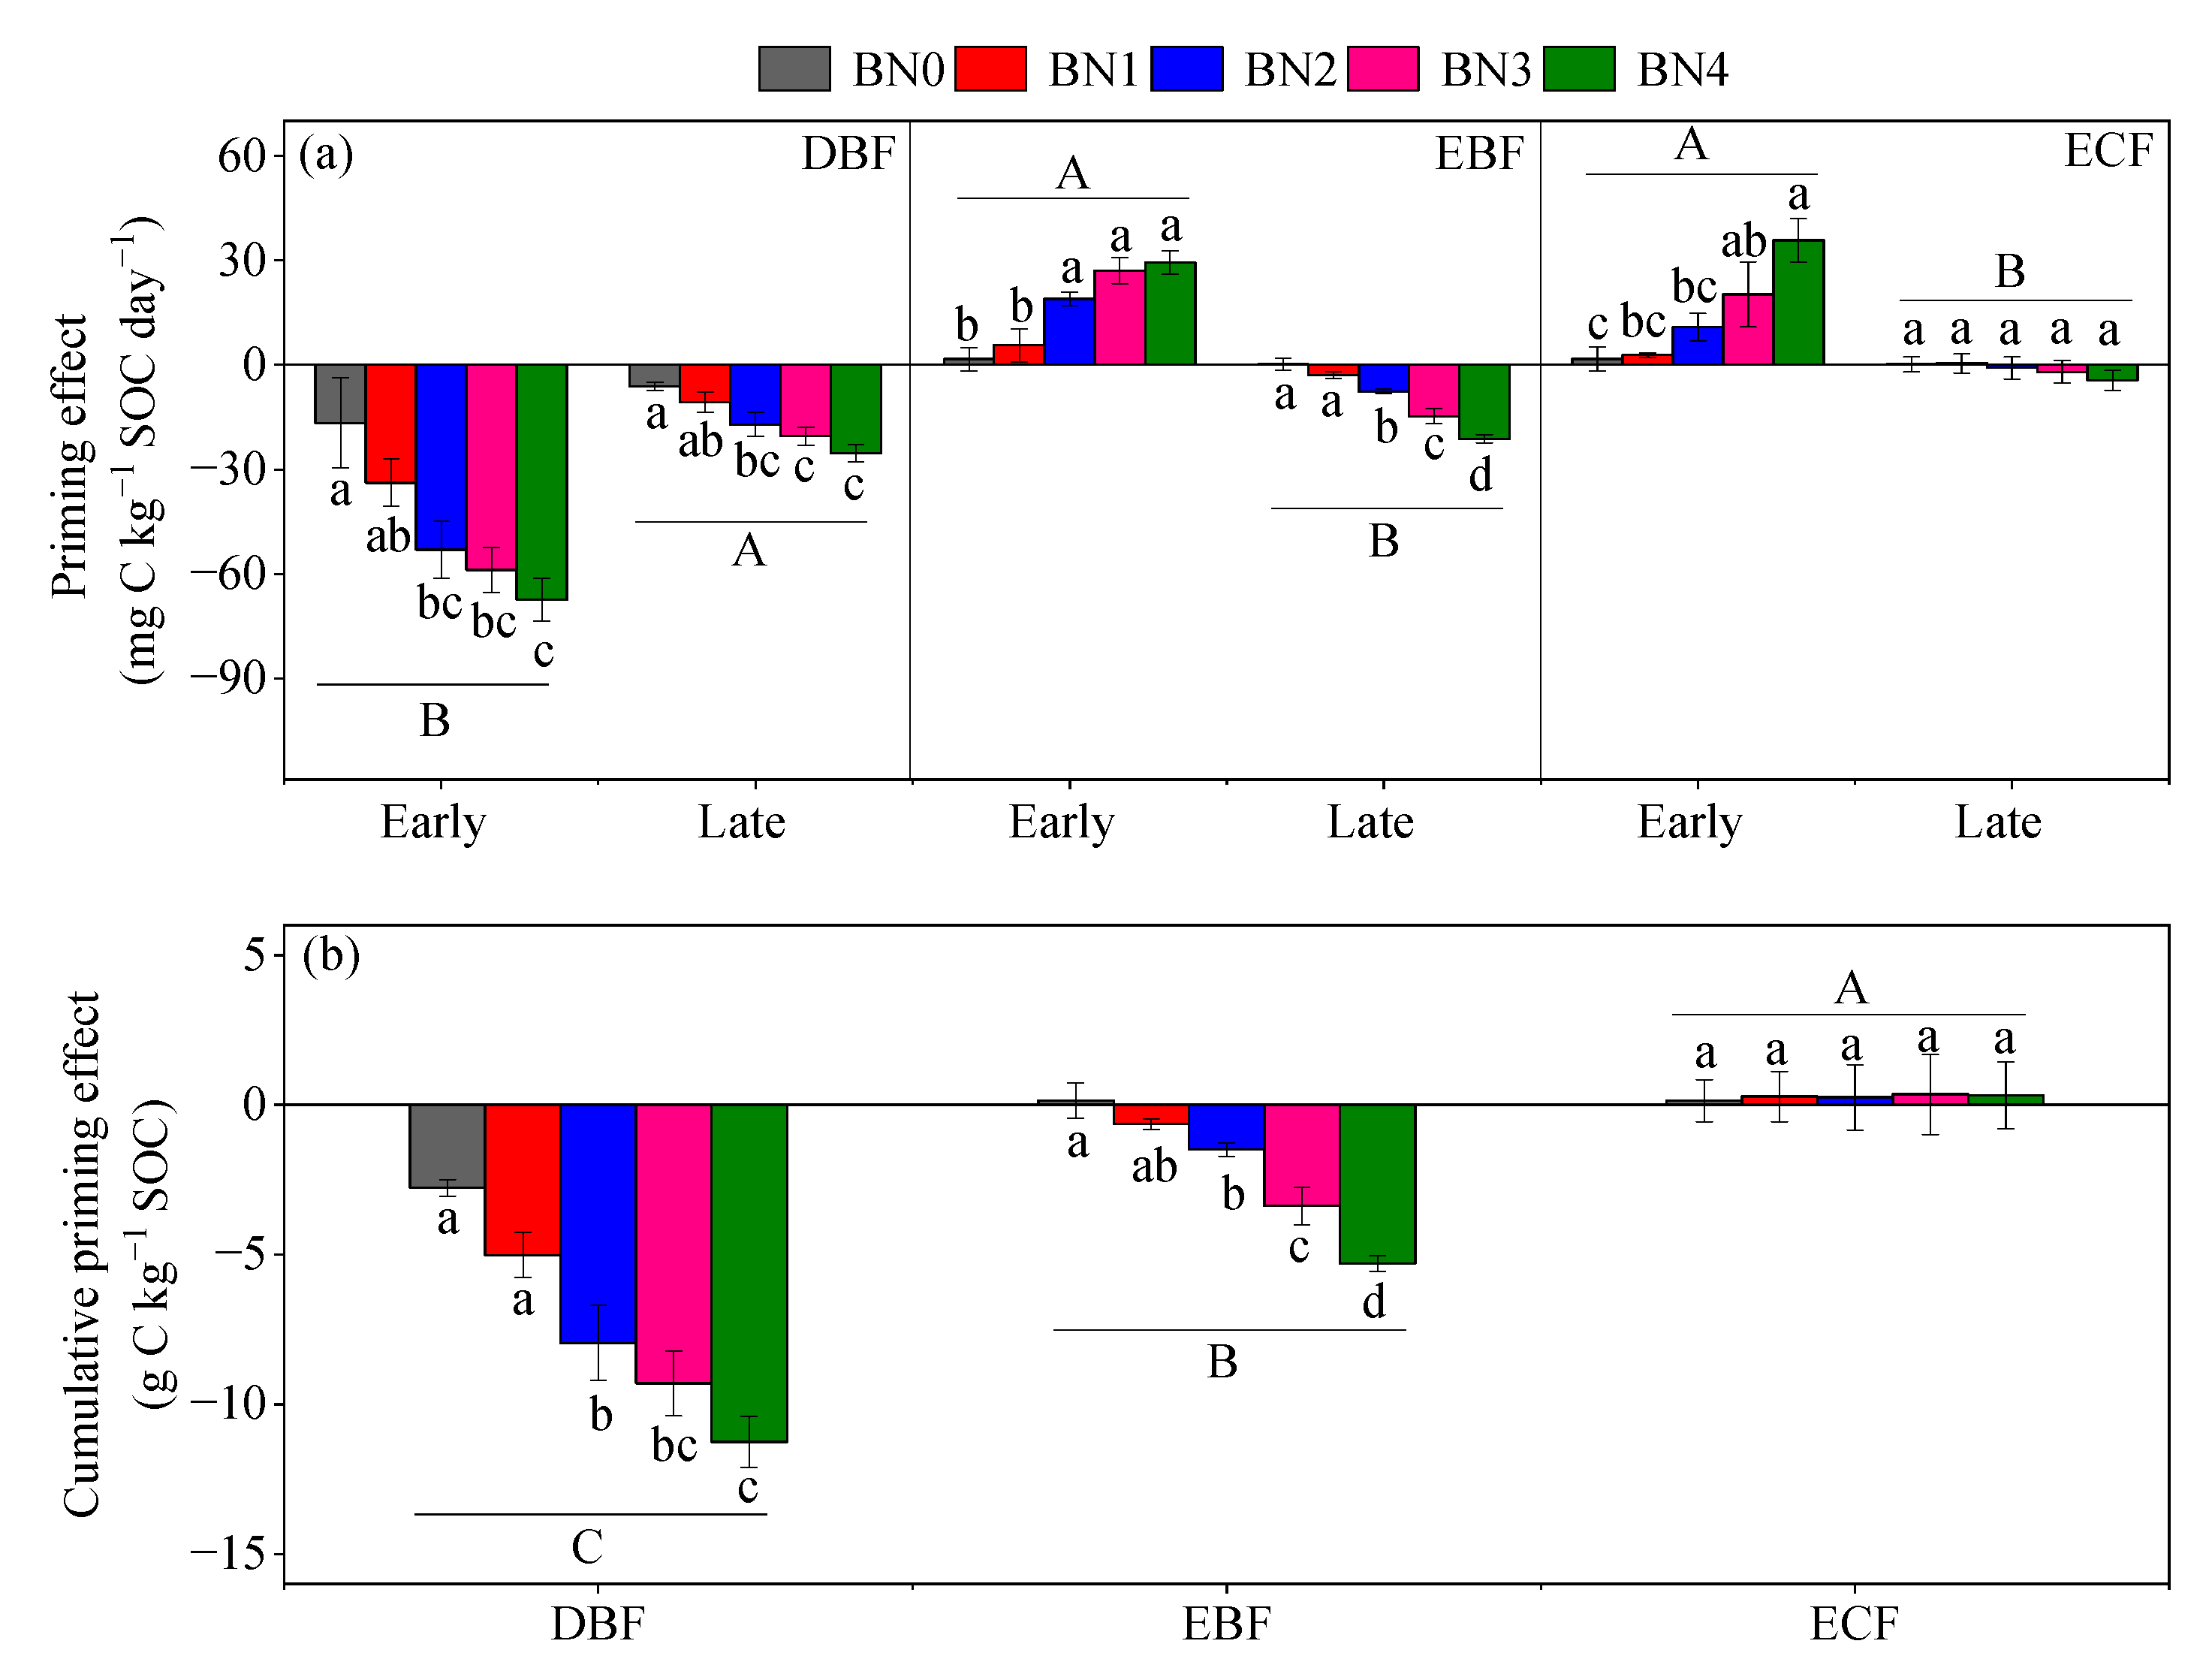
3.2. Priming of Native SOC Decomposition
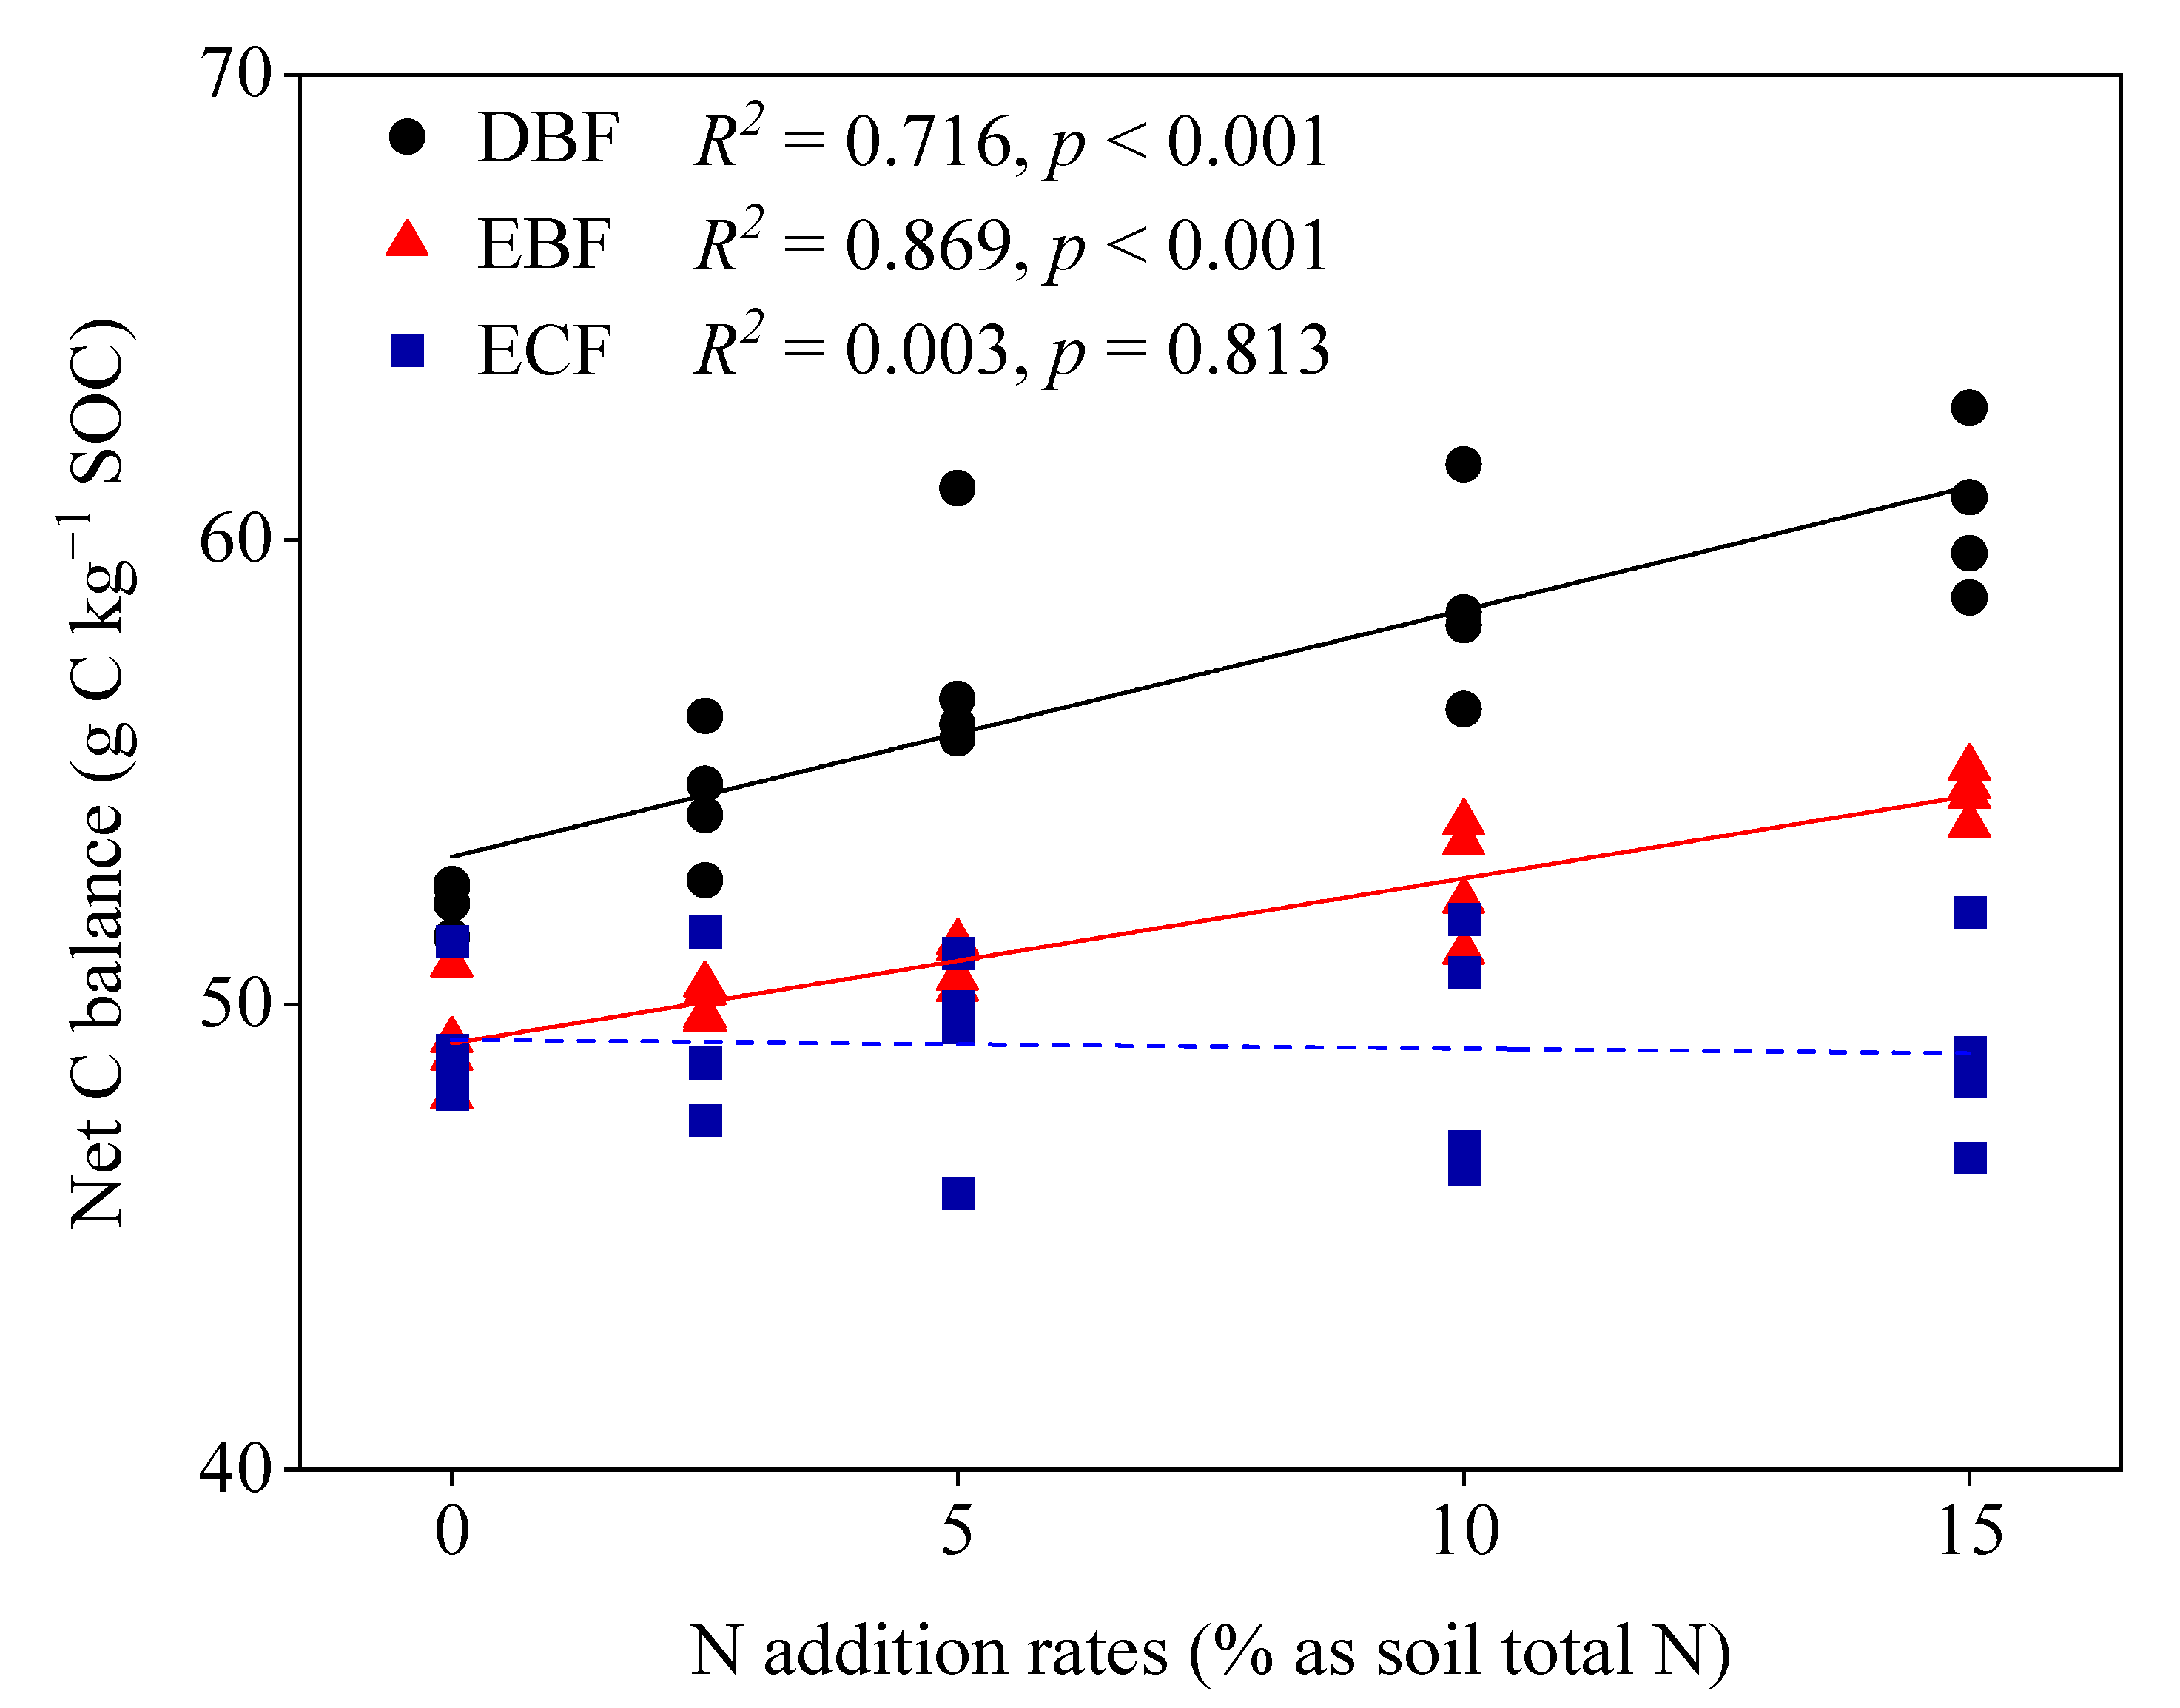
Biochar addition, with or without N addition, caused various PEs on native SOC decomposition during the 365 days of incubation (Figure S2). In all forests, single biochar addition treatment (BN0) did not induce a significant PE at any sampling time. However, the direction and extension of PE were significantly altered by N addition, although this alteration varied among forests (Figure S2). More specifically, in DBF, N addition increased the magnitude of PE in a negative direction, but only to a significant level in the first 76 days and at day 313. In EBF, N addition significantly enhanced the magnitude of PE in a positive direction at the beginning of incubation (0–20 days), then changed to a negative direction from 48 to 264 days, and eventually changed to neutral towards the end of incubation. In ECF, N addition significantly increased the magnitude of PE in a positive direction before 37 days but showed no effect thereafter.
When the whole incubation was divided into early and late periods based on the dynamics of biochar decomposition, BN0 treatment caused a significant negative PE at both periods in DBF (Figure 2a). We found a significant interactive effect of forest type, N addition, and decomposition period on the PE (Table 1). N addition (BN2, BN3, and BN4) significantly enhanced the magnitude of PE in the negative direction at both periods in DEF (Figure 2a). In EBF, N addition (BN2, BN3, and BN4) significantly increased the magnitude of PE in a positive direction in the early period and in a negative direction in the later period (Figure 2a). In ECF, only BN3 and BN4 treatments in the early period had a significant effect on the PE (i.e., increased the magnitude of PE in a positive direction) (Figure 2a).
At the end of incubation, the cumulative PE ranged from −11.25 to 0.35 g C kg−1 SOC across all treatments and differed significantly among forests (Figure 2b). A significant interaction was found between forest type and N addition that affected the cumulative PE (Table S2). In detail, N addition significantly affected the cumulative PE in a negative direction in DBF and EBF, and the magnitude increased with N addition rates (Figure 2b). However, no significant effect of N addition on the cumulative PE in ECF was found.

3.3. Carbon Balance

As shown in Table 2, biochar addition with or without N addition retained a large amount of biochar-C in soils at the end of incubation, leading to a net SOC accumulation of 48.99 to 60.55 g C kg−1 SOC. However, the soil C balance was significantly influenced by the main and interactive effects of forest type and N addition (Table S2). More specifically, the net C balance, on average, was lower in ECF (49.12 g C kg−1 SOC) compared to EBF (51.48 g C kg−1 SOC) and DBF (56.63 g C kg−1 SOC). N additions significantly increased the net C balance in DBF and EBF, but did not affect it in ECF. Further linear regression analysis showed that the net C balance increased positively with N addition rates in DBF and EBF (Figure 3).

4. Discussion

4.1. Soil Priming Effect following Biochar and N Addition

In this study, the direction of PE caused by sole biochar addition (BN0) was different for the three forest soils, with a significant negative PE in DBF and no PE in EBF and ECF at both the early and late periods (Figure 2a), thus opposing our first hypothesis. This result indicates that the effect of biochar input on native SOC decomposition varies depending on forest type, and one possible reason could be their difference in soil C availability (i.e., DOC content) [28,38]. This opinion was supported by a meta-analysis study by Maestrini et al. [39], who found that the magnitude of the negative PE was higher when the soil had a higher C availability. The inhibitory effect of biochar on native SOC decomposition has been attributed to the sorption of soil-derived DOC to the outer surface of biochar particles or the physical encapsulation of soil-derived DOC into biochar pores [2,40,41], which may limit the accessibility of SOC to microorganisms and their enzymes and thus reduce the decomposition of native SOC [38,42]. In the case of the three forest soils that we investigated, DOC content in DBF was about 2–3 times higher than that of the other two forests (Table 1), so the added biochar might thus adsorb and/or encapsulate more of this labile C, leading to a stronger negative PE. In an incubation study, Lu et al. [15] also found that the observed negative PE in their experiment was mainly ascribed to the sorption of soil-derived DOC by biochar. Alternatively, the lack of PE in EBF and ECF might be attributed to their low content of DOC that was hardly adsorbed by biochar and thereby w insufficient to induce a negative PE [28,43]. Additionally, some studies have suggested that the divergent interactions between biochar particles and the compositions (e.g., soil organic matter and clay minerals) of different soils may also result in different PE responses [44,45]. In the present study, given the substantial differences in soil properties (e.g., clay and nutrients contents) and soil microbes (e.g., microbial biomass N) between the three studied soils, it is reasonable to speculate that this mechanism may also act on our results. However, in this study, we did not measure the relevant indicators, and thus this speculation needs further verification.
We further observed that the intensity of biochar priming was increased by N addition, albeit such increases varied with the forest type, incubation period and N addition rate (Figure 2a). This finding was inconsistent with our second hypothesis that N addition would reduce the intensity of PE. Due to the very limited number of studies investigating the response of biochar priming to N addition, it is difficult to compare our results to those in other forest ecosystems. An existing study on temperate forest soil found that the PE induced by ryegrass-derived biochar was not affected by N addition (0.9% N of the soil’s total N) [24], which was partly consistent with our result, as we also detected a neutral effect of BN1 (2.5% N of the soil’s total N) treatment on the PE at any period. However, in this study, we found a significant effect of N addition on the PE when the addition rate was higher than 2.5% N of the soil total N, and the magnitude increased with N addition rates. This finding signifies that given that the atmospheric N deposition is forecast to increase continuously in the future [22,23], it might thus exert a stronger influence on the biochar-induced PE. However, it must be pointed out that this work was only completed based on a single type of biochar and a small range of forest ecosystems; further work is required to verify the general applicability of our result.
The three forest soils differed in the response of the biochar priming to N addition (Figure 2a). We observed an enhanced negative PE in response to N addition at both periods in DBF, whereas an increased positive PE at the early period in EBF and ECF, and an increased negative PE at the later period in EBF were observed. This disparity might be related to the differences in microbial C and N limitations among forests [36,46]. For the three forest soils we studied, the microbial C:N imbalance in DBF was about 2–4 times higher than in EBF and ECF (Table 1), indicating a greater microbial N limitation in DBF than in EBF and ECF (i.e., microorganisms in EBF and ECF suffer more severe C limitation). Therefore, in DBF, according to the N mining theory, N addition would relieve the microorganisms from N limitation and reduce the mining of N from native SOC [47,48], thereby enhancing the negative PE. On the contrary, in EBF and ECF, where microbial growth was limited by C availability, N addition may ulteriorly aggravate microbial C limitation. This may compel microorganisms to decompose more native SOC to obtain energy and consequently lead to an increased positive PE in the early period [20,36]. However, as incubation proceeds, microbial C limitation may be relieved with the depletion of added N, and meanwhile, the increased proportion of recalcitrant C in soils may slow the decomposition rate of native SOC [49], resulting in an enhanced negative or neutral PE in EBF and ECF at the late period.
Nevertheless, the above discussion was mainly focused on the impacts of soil properties, while the microbial mechanisms of the PE response to biochar and N additions have not yet been addressed. Zheng et al. [16] recently showed that the adding biochar could modulate the soil bacterial community towards low C turnover bacteria taxa, thereby suppressing native SOC decomposition (i.e., negative PE). Therefore, to advance our understanding of the priming processes, the responses of the soil microbial community to biochar and N additions should be the focus of future studies.

4.2. Carbon Balance between Primed C Loss and Replenishment of Biochar

As our third hypothesis, biochar addition considerably increased soil carbon stock after one year of incubation due to the large amount of retained biochar in combination with the negative or neutral cumulative PE. This result is largely consistent with numerous previous studies showing net SOC accumulation following biochar addition [50,51,52]. Therefore, combined with the results of other studies, our finding supports the great potential of biochar in improving soil C sequestration.
Despite the positive net C balance across all biochar treatments, its magnitude varied largely with forest type and N addition. The average magnitude of net C balance was in the order of DBF > EBF > ECF, and increased linearly with the N addition rate in DBF and EBF (Table 2; Figure 3). This finding partly supports our third hypothesis. In general, the net C balance is jointly determined by the processes of replenishment and priming [26,53]. However, our results showed that changes in net C balance caused by forest type and N addition were mainly driven by the process of priming because the variation in replenishment between different treatments was negligible in comparison to that of priming. For instance, the maximum difference of replenishment among different forests was only 0.04 g C kg−1 SOC, but the maximum difference of priming among different forests reached 7.53 g C kg−1 SOC. Similarly, N addition only reduced the retained biochar by an average of 0.06 g C kg−1 SOC but decreased the primed SOC loss by an average of 2.76 g C kg−1 SOC. Overall, this finding suggests that the priming response to environmental changes seems to be the key determinant for the C sequestration potential of biochar.
Finally, it is notable that the constant temperature and soil moisture used in our experiment differed from those periodically fluctuating under field conditions [54]. As some studies discussed [19,44,55], PE may be strongly affected by experimental conditions. Therefore, using a constant incubation temperature and moisture may bias the estimation of the decomposition of biochar and its priming effect on native SOC mineralization in field conditions. Additionally, the use of ground biochar and sieved soils was not entirely representative of the effect of biochar input on soil C dynamics compared to the intact biochar and soils under field conditions [56]. Therefore, the results in this experiment should be applied with caution to field conditions.

5. Conclusions

Our results provide empirical evidence that biochar input can largely promote soil C accumulation due to its extremely low decomposition rate in soils and its negative or neutral PE on native SOC decomposition. Moreover, we found that the promotive role of biochar on soil C accumulation varied among forest types and depended on N addition rates, likely a result of the priming response. Overall, these results suggest that priming and replenishment, the two opposite processes in determining SOC dynamics, should be simultaneously considered when assessing the effect of biochar input on soil C stock under global environmental change.

Supplementary Materials

The following supporting information can be downloaded at: https://www.mdpi.com/article/10.3390/f13101710/s1, Table S1: Results of three-way ANOVA showing the effects of forest type (FT), N addition (N), decomposition period (DP) and their interactions on biochar decomposition rate and PE rate. Table S2: Results of two-way ANOVA showing the effects of forest type (FT), N addition (N) and their interactions on cumulative biochar decomposition, cumulative PE and net C balance. Figure S1: Effect of N addition on the decomposition rate of biochar in three forests. Bars represent standard errors of the mean (n = 4). significant effects of N addition are denoted by asterisks (p < 0.05). Figure S2: Effect of N addition on the priming effect rate in three forests. Bars represent standard errors of the mean (n = 4). significant effects of N addition are denoted by asterisks (p < 0.05).

Author Contributions

Q.W. conceived and designed this experiment; Z.S. and Y.Z. performed the experiment and analyzed the data; Z.S. and Q.W. wrote the paper; All authors have read and agreed to the published version of the manuscript.

Funding

This research was funded by the National Natural Science Foundation of China, grant number 31830015, 32171752 and 32101491.

Institutional Review Board Statement

Not applicable.

Informed Consent Statement

Not applicable.

Data Availability Statement

The data that support the findings of this study are available from the corresponding author on request.

Conflicts of Interest

The authors declare that they have no competing financial interest or personal relationships that are relevant to the content of this article.

References

  1. Zimmerman, A. Abiotic and microbial oxidation of laboratory-produced black carbon (biochar). Environ. Sci. Technol. 2010, 44, 1295–1301. [Google Scholar] [CrossRef] [PubMed]
  2. Yang, Y.; Sun, K.; Han, L.F.; Chen, Y.L.; Liu, J.; Xing, B.S. Biochar stability and impact on soil organic carbon mineralization depend on biochar processing, aging and soil clay content. Soil Biol. Biochem. 2022, 169, 108657. [Google Scholar] [CrossRef]
  3. Kuzyakov, Y.; Bogomolova, I.; Glaser, B. Biochar stability in soil: Decomposition during eight years and transformation as assessed by compound-specific 14C analysis. Soil Biol. Biochem. 2014, 70, 229–236. [Google Scholar] [CrossRef]
  4. Singh, B.P.; Cowie, A.L.; Smernik, R.J. Biochar carbon stability in a clayey soil as a function of feedstock and pyrolysis temperature. Environ. Sci. Technol. 2012, 46, 11770–11778. [Google Scholar] [CrossRef]
  5. Lehmann, J. A handful of carbon. Nature 2007, 447, 143–144. [Google Scholar] [CrossRef] [PubMed]
  6. Sohi, S.P. Carbon storage with benefits. Science 2012, 338, 1034–1035. [Google Scholar] [CrossRef]
  7. Yang, Q.; Zhou, H.W.; Bartocci, P.; Fantozzi, F.; Masek, O.; Agblevor, F.A.; Wei, Z.Y.; Yang, H.P.; Chen, H.P.; Lu, X.; et al. Prospective contributions of biomass pyrolysis to China’s 2050 carbon reduction and renewable energy goals. Nat. Commun. 2021, 12, 1698. [Google Scholar] [CrossRef]
  8. Kuzyakov, Y.; Friedel, J.K.; Stahr, K. Review of mechanisms and quantification of priming effects. Soil Biol. Biochem. 2000, 32, 1485–1498. [Google Scholar] [CrossRef]
  9. Wang, Q.K.; Wang, S.L.; He, T.X.; Liu, L.; Wu, J.B. Response of organic carbon mineralization and microbial community to leaf litter and nutrient additions in subtropical forest soils. Soil Biol. Biochem. 2014, 71, 13–20. [Google Scholar] [CrossRef]
  10. IPCC. 2021: Summary for Policymakers. In Climate Change 2021: The Physical Science Basis; Contribution of Working Group I to the Sixth Assessment Report of the Intergovernmental Panel on Climate Change; Masson-Delmotte, V., Zhai, P., Pirani, A., Connors, S.L., Péan, C., Berger, S., Caud, N., Chen, Y., Goldfarb, L., Gomis, M.I., et al., Eds.; Cambridge University Press: Cambridge, UK; New York, NY, USA, 2021; pp. 3–32. [Google Scholar]
  11. Liu, Y.X.; Chen, Y.; Wang, Y.Y.; Lu, H.H.; He, L.L.; Yang, S.M. Negative priming effect of three kinds of biochar on the mineralization of native soil organic carbon. Land Degrad. Dev. 2018, 29, 3985–3994. [Google Scholar] [CrossRef]
  12. Whitman, T.; Enders, A.; Lehmann, J. Pyrogenic carbon additions to soil counteract positive priming of soil carbon mineralization by plants. Soil Biol. Biochem. 2014, 73, 33–41. [Google Scholar] [CrossRef]
  13. Bammingera, C.; Marschnera, B.; Juschke, E. An incubation study on the stability and biological effects of pyrogenic and hydrothermal biochar in two soils. Eur. J. Soil Sci. 2014, 65, 72–82. [Google Scholar] [CrossRef]
  14. Luo, Y.; Durenkamp, M.; De Nobili, M.; Lin, Q.; Brookes, P.C. Short term soil priming effects and the mineralisation of biochar following its incorporation to soils of different pH. Soil Biol. Biochem. 2011, 43, 2304–2314. [Google Scholar] [CrossRef]
  15. Lu, W.W.; Ding, W.X.; Zhang, J.H.; Li, Y.; Luo, J.F.; Bolan, N.; Xie, Z.B. Biochar suppressed the decomposition of organic carbon in a cultivated sandy loam soil: A negative priming effect. Soil Biol. Biochem. 2014, 76, 12–21. [Google Scholar] [CrossRef]
  16. Zheng, H.; Wang, X.; Luo, X.X.; Wang, Z.Y.; Xing, B.S. Biochar-induced negative carbon mineralization priming effects in a coastal wetland soil: Roles of soil aggregation and microbial modulation. Sci. Total Environ. 2018, 610–611, 951–960. [Google Scholar] [CrossRef]
  17. Cross, A.; Sohi, S.P. The priming potential of biochar products in relation to labile carbon contents and soil organic matter status. Soil Biol. Biochem. 2011, 43, 2127–2134. [Google Scholar] [CrossRef]
  18. Nguyen, B.T.; Koide, R.T.; Dell, C.; Drohan, P.; Skinner, H.; Adler, P.R.; Nord, A. Turnover of soil carbon following addition of switchgrass-derived biochar to four soils. Soil Sci. Soc. Am. J. 2014, 78, 531–537. [Google Scholar] [CrossRef]
  19. Ding, F.; Zwieten, L.V.; Zhang, W.D.; Weng, Z.; Shi, S.W.; Wang, J.K.; Meng, J. A meta-analysis and critical evaluation of influencing factors on soil carbon priming following biochar amendment. J. Soil Sediment. 2018, 18, 1507–1517. [Google Scholar] [CrossRef]
  20. Sun, Z.L.; Liu, S.E.; Zhang, T.A.; Zhao, X.C.; Chen, S.; Wang, Q.K. Priming of soil organic carbon decomposition induced by exogenous organic carbon input: A meta-analysis. Plant Soil 2019, 443, 463–471. [Google Scholar] [CrossRef]
  21. Chen, R.R.; Senbayram, M.; Blagodatsky, S.; Myachina, O.; Dittert, K.; Lin, X.G.; Blagodatskaya, E.; Kuzyakov, Y. Soil C and N availability determine the priming effect: Microbial N mining and stoichiometric decomposition theories. Glob. Chang. Biol. 2014, 20, 2356–2367. [Google Scholar] [CrossRef]
  22. Ackerman, D.; Millet, D.B.; Chen, X. Global estimates of inorganic nitrogen deposition across four decades. Glob. Biogeochem. Cycles 2019, 33, 100–107. [Google Scholar] [CrossRef] [Green Version]
  23. Yu, G.R.; Jia, Y.L.; He, N.P.; Zhu, J.X.; Chen, Z.; Wang, Q.F.; Piao, S.L.; Liu, X.J.; He, H.L.; Guo, X.B.; et al. Stabilization of atmospheric nitrogen deposition in China over the past decade. Nat. Geosci. 2019, 12, 424–429. [Google Scholar] [CrossRef]
  24. Maestrini, B.; Herrmann, A.M.; Nannipieri, P.; Schmidt, M.W.I.; Abiven, S. Ryegrass-derived pyrogenic organic matter changes organic carbon and nitrogen mineralization in a temperate forest soil. Soil Biol. Biochem. 2014, 69, 291–301. [Google Scholar] [CrossRef]
  25. Qiao, N.; Schaefer, D.; Blagodatskaya, E.; Zou, X.M.; Xu, X.L.; Kuzyakov, Y. Labile carbon retention compensates for CO2 released by priming in forest soils. Glob. Chang. Biol. 2014, 20, 1943–1954. [Google Scholar] [CrossRef]
  26. Liang, J.Y.; Zhou, Z.H.; Huo, C.F.; Shi, Z.; Cole, J.R.; Huang, L.; Konstantinidis, K.T.; Li, X.M.; Liu, B.; Luo, Z.K.; et al. More replenishment than priming loss of soil organic carbon with additional carbon input. Nat. Commun. 2018, 9, 3175. [Google Scholar] [CrossRef] [Green Version]
  27. Chen, X.; Lin, J.J.; Wang, P.; Zhang, S.; Liu, D.; Zhu, B. Resistant soil carbon is more vulnerable to priming effect than active soil carbon. Soil Biol. Biochem. 2022, 168, 108619. [Google Scholar] [CrossRef]
  28. Zheng, T.H.; Zhang, J.; Tang, C.J.; Liao, K.T.; Guo, L.P. Positive and negative priming effects in an Ultisol in relation to aggregate size class and biochar level. Soil Till. Res. 2021, 208, 104874. [Google Scholar] [CrossRef]
  29. Chen, C.; Wang, S. Ecology of Mixed Plantation Forest; Science Press: Beijing, China, 2004; p. 3. [Google Scholar]
  30. Wang, Y.Z.; Xu, Z.H.; Zhou, Q.X. Impact of fire on soil gross nitrogen transformations in forest ecosystems. J. Soil. Sediment. 2014, 14, 1030–1040. [Google Scholar] [CrossRef]
  31. Borwn, A.A.; Davis, K.P. Forest Fire Control and Use, 2nd ed.; McGraw-Hill Book Company: New York, NY, USA, 1973. [Google Scholar]
  32. Chao, L.; Liu, Y.Y.; Freschet, G.T.; Zhang, W.D.; Yu, X.; Zheng, W.H.; Guan, X.; Yang, Q.P.; Chen, L.C.; Dijkstra, F.A.; et al. Litter carbon and nutrient chemistry control the magnitude of soil priming effect. Funct. Ecol. 2019, 33, 876–888. [Google Scholar] [CrossRef]
  33. Vance, E.D.; Brookes, P.C.; Jenkinson, D.S. An extraction method for measuring soil microbial biomass C. Soil Biol. Biochem. 1987, 19, 703–707. [Google Scholar] [CrossRef]
  34. Gee, G.W.; Bauder, J.W. Particle size analysis. In Methods of Soil Analysis. Part 1; Klute, A., Ed.; American Society of Agronomy: Madison, WI, USA, 1986; pp. 383–441. [Google Scholar]
  35. Mooshammer, M.; Wanek, W.; Haemmerle, I.; Fuchslueger, L.; Hofhansl, F.; Knoltsch, A.; Schnecker, J.; Takriti, M.; Watzka, M.; Wild, B.; et al. Adjustment of microbial nitrogen use efficiency to carbon:nitrogen imbalances regulates soil nitrogen cycling. Nat. Commun. 2014, 5, 3694. [Google Scholar] [CrossRef] [PubMed] [Green Version]
  36. Chen, L.Y.; Liu, L.; Mao, C.; Qin, S.Q.; Wang, J.; Liu, F.T.; Blagodatsky, S.; Yang, G.B.; Zhang, Q.W.; Zhang, D.Y.; et al. Nitrogen availability regulates topsoil carbon dynamics after permafrost thaw by altering microbial metabolic efficiency. Nat. Commun. 2018, 9, 3951. [Google Scholar] [CrossRef] [PubMed] [Green Version]
  37. Wild, B.; Schnecker, J.; Knoltsch, A.; Takriti, M.; Mooshammer, M.; Gentsch, N.; Mikutta, R.; Alves, R.J.E.; Gittel, A.; Lashchinskiy, N.; et al. Microbial nitrogen dynamics in organic and mineral soil horizons along a latitudinal transect in western Siberia. Glob. Biogeochem. Cycles 2015, 29, 567–582. [Google Scholar] [CrossRef] [PubMed] [Green Version]
  38. Kasozi, G.N.; Zimmerman, A.R.; Nkedi-Kizza, P.; Gao, B. Catechol and humic acid sorption onto a range of laboratory-produced black carbons (biochars). Environ. Sci. Technol. 2010, 44, 6189–6195. [Google Scholar] [CrossRef] [PubMed]
  39. Maestrini, B.; Nannipieri, P.; Abiven, S. A meta-analysis on pyrogenic organic matter induced priming effect. GCB Bioenergy 2014, 7, 577–590. [Google Scholar] [CrossRef]
  40. DeCiucies, S.; Whitman, T.; Woolf, D.; Enders, A.; Lehmann, J. Priming mechanisms with additions of pyrogenic organic matter to soil. Geochim. Cosmochim. Acta 2018, 238, 329–342. [Google Scholar] [CrossRef]
  41. Zimmerman, A.R.; Gao, B.; Ahn, M.Y. Positive and negative carbon mineralization priming effects among a variety of biochar-amended soils. Soil Biol. Biochem. 2011, 43, 1169–1179. [Google Scholar] [CrossRef]
  42. Yang, Y.; Hunter, W.; Tao, S.; Crowley, D.; Gan, J. Effect of activated carbon on microbial bioavailability of phenanthrene in soils. Environ. Toxicol. Chem. 2009, 28, 2283–2288. [Google Scholar] [CrossRef]
  43. Lu, W.W.; Zhang, Y.R.; Yao, Y.X.; Wu, Y.Y.; Chen, H.Y.H.; Zhang, H.L.; Yu, J.; Shen, C.Q.; Liu, Q.; Ruan, H.H. Biochar-induced priming effects in young and old poplar plantation soils. Phyton—Int. J. Exp. Bot. 2020, 89, 13–26. [Google Scholar] [CrossRef]
  44. Fang, Y.Y.; Singh, B.; Singh, B.P. Effect of temperature on biochar priming effects and its stability in soils. Soil Biol. Biochem. 2015, 80, 136–145. [Google Scholar] [CrossRef]
  45. Murray, J.; Keith, A.; Singh, B. The stability of low- and high-ash biochars in acidic soils of contrasting mineralogy. Soil Biol. Biochem. 2015, 89, 217–225. [Google Scholar] [CrossRef]
  46. Feng, J.G.; Zhu, B. Global patterns and associated drivers of priming effect in response to nutrient addition. Soil Biol. Biochem. 2021, 153, 108118. [Google Scholar] [CrossRef]
  47. Blagodatskaya, E.V.; Blagodatsky, S.A.; Anderson, T.H.; Kuzyakov, Y. Priming effects in Chernozem induced by glucose and N in relation to microbial growth strategies. Appl. Soil Ecol. 2007, 37, 95–105. [Google Scholar] [CrossRef]
  48. Fang, Y.Y.; Nazaries, L.; Singh, B.K.; Singh, B.P. Microbial mechanisms of carbon priming effects revealed during the interaction of crop residue and nutrient inputs in contrasting soils. Glob. Chang. Biol. 2018, 24, 2775–2790. [Google Scholar] [CrossRef] [PubMed]
  49. Zhang, W.D.; Wang, S.L. Effects of NH4+ and NO3- on litter and soil organic carbon decomposition in a Chinese fir plantation forest in South China. Soil Biol. Biochem. 2012, 47, 116–122. [Google Scholar] [CrossRef]
  50. Criscuoli, I.; Ventura, M.; Wiedner, K.; Glaser, B.; Panzacchi, P.; Ceccon, C.; Loesch, M.; Raifer, B.; Tonon, G. Stability of woodchips biochar and impact on soil carbon stocks: Results from a two-year field experiment. Forests 2021, 12, 1350. [Google Scholar] [CrossRef]
  51. Rittl, T.F.; Novotny, E.H.; Balieiro, F.C.; Hoffland, E.; Alves, B.J.R.; Kuyper, T.W. Negative priming of native soil organic carbon mineralization by oilseed biochars of contrasting quality. Eur. J. Soil Sci. 2015, 66, 714–721. [Google Scholar] [CrossRef]
  52. Wang, J.; Xiong, Z.; Kuzyakov, Y. Biochar stability in soil: Meta-analysis of decomposition and priming effects. GCB Bioenergy 2015, 8, 512–523. [Google Scholar] [CrossRef] [Green Version]
  53. Rasul, M.; Cho, J.; Shin, H.S.; Hur, J. Biochar-induced priming effects in soil via modifying the status of soil organic matter and microflora: A review. Sci. Total Environ. 2022, 805, 150304. [Google Scholar] [CrossRef]
  54. Ventura, M.; Alberti, G.; Panzacchi, P.; Vedove, G.D.; Miglietta, F.; Tonon, G. Biochar mineralization and priming effect in a poplar short rotation coppice from a 3-year field experiment. Biol. Fertil. Soils 2018, 55, 67–78. [Google Scholar] [CrossRef]
  55. Yu, L.Q.; Tang, J.; Zhang, R.D.; Wu, Q.H.; Gong, M.M. Effects of biochar application on soil methane emission at different soil moisture levels. Biol. Fertil. Soils 2013, 49, 119–128. [Google Scholar] [CrossRef]
  56. Zheng, S.J.; Zhao, X.C.; Sun, Z.L.; Li, J.; Jing, Y.L.; Wang, Q.K. Carbon addition modified the response of heterotrophic respiration to soil sieving in ectomycorrhizal-dominated forests. Forests 2022, 13, 1263. [Google Scholar] [CrossRef]
Figure 1. Effects of N addition on biochar decomposition rate during the early and late periods (a) and the cumulative decomposition of biochar after a 365-day incubation (b) in three forests. Bars represent standard errors of the mean (n = 4). Different capital letters in figure (a) represent significant differences between periods. Different capital letters in figure (b) indicate significant differences between forests. Different lowercase letters above bars represent significant differences among treatments within periods. Significance levels are set at p < 0.05.
Forests 13 01710 g001
Figure 2. Effects of N addition on priming effect rate during the early and late periods (a) and the cumulative priming effect after a 365-day incubation (b) in three forests. Bars represent standard errors of the mean (n = 4). Different capital letters in figure (a) represent significant differences between periods. Different capital letters in figure (b) indicate significant differences between forests. Different lowercase letters above bars represent significant differences among treatments within periods. Significance levels are set at p < 0.05.
Forests 13 01710 g002
Figure 3. Relationships between net C balance and N addition rates in three forests.
Forests 13 01710 g003
Table 1. Information of the three forests for soil sample collections.
VariablesDBFEBFECF
Dominant tree speciesCastanopsis Fargesii Franch.,
Machilus pauhoi Kanehira
Quercus acutissima Carruth., Pinus massoniana Lamb.Cunninghamia lanceolata (Lamb.) Hook.
MAT (°C)15.216.516.5
Soil typeHaplic CalcisolsAlumic AcrisolAlumic Acrisol
Soil textureSilt clay loamClay loamClay loam
MAP (mm)106312001200
Sand (%)29.5 a14.7 b11.1 c
Silt (%)37.1 b40.5 a37.7 b
Clay (%)33.4 c44.8 b51.2 a
Soil pH4.45 a3.73 c4.22 b
SOC (g kg−1)26.84 b39.53 a21.80 c
Total N (g kg−1)1.97 b3.45 a1.91 b
C/N ratio13.6 a11.5 b11.4 b
Total P (g kg−1)0.27 b0.65 a0.21 c
Mineral N (mg kg−1)7.17 c13.37 b14.93 a
Available P (mg kg−1)4.04 a1.89 b0.84 c
DOC (mg kg−1)188.2 a97.6 b61.4 c
MBC (mg kg−1)331.7 a358.6 a334.8 a
MBN (mg kg−1)48.62 b81.64 a80.20 a
C:N imbalance3.91 a1.78 b1.00 c
Note: DBF, EBF and ECF denote deciduous broad-leaf forest, evergreen broad-leaf forest and evergreen coniferous forest, respectively. MAT, MAP, SOC, DOC, MBC and MBN represent mean annual temperature, mean annual precipitation, soil organic carbon, dissolved organic carbon, microbial biomass carbon and microbial biomass nitrogen, respectively. Different lowercase letters in the same row indicate significant differences among forests at p < 0.05.
Table 2. Effects of N addition on replenishment (g C kg−1 SOC), cumulative PE (g C kg−1 SOC) and net C balance (g C kg−1 SOC) after a 365-day incubation. Values are means and standard errors (n = 4). Significant differences between the mean values of the treatments in each row are indicated by different lowercase letters (p < 0.05).
TreatmentsBN0BN1BN2BN3BN4
DBF
Replenishment49.42 (0.03) a49.41 (0.03) a49.40 (0.03) ab49.34 (0.03) ab49.30 (0.03) b
Cumulative PE−2.77 (0.27) a−5.02 (0.75) a−7.96 (1.25) b−9.30 (1.09) bc−11.25 (0.85) c
Net C balance52.19 (0.26) c54.42 (0.73) c57.35 (1.26) b58.64 (1.10) ab60.55 (0.88) a
EBF
Replenishment49.38 (0.02) ab49.40 (0.03) a49.38 (0.02) ab49.33 (0.02) b49.24 (0.03) c
Cumulative PE0.14 (0.59) a−0.64 (0.18) ab−1.49 (0.23) b−3.37 (0.62) c−5.30 (0.26) d
Net C balance49.25 (0.59) d50.04 (0.18) cd50.87 (0.24) c52.70 (0.63) b54.54 (0.26) a
ECF
Replenishment49.45 (0.02) a49.43 (0.02) a49.40 (0.03) ab49.34 (0.02) b49.33 (0.01) b
Cumulative PE0.14 (0.70) a0.28 (0.84) a0.25 (1.09) a0.35 (1.33) a0.32 (1.11) a
Net C balance49.31 (0.71) a49.15 (0.86) a49.14 (1.11) a48.99 (1.34) a49.01 (1.11) a
Publisher’s Note: MDPI stays neutral with regard to jurisdictional claims in published maps and institutional affiliations.

