Article

Variation Pattern and Genome-Wide Association Study of Leaf Phenotypic Traits among Ancient Ginkgo biloba L. Populations

Zhejiang Academy of Forestry, 399 Liuhe Road, Hangzhou 310023, China
*
Author to whom correspondence should be addressed.
Forests 2022, 13(11), 1764; https://doi.org/10.3390/f13111764
Submission received: 22 September 2022 / Revised: 21 October 2022 / Accepted: 24 October 2022 / Published: 26 October 2022
(This article belongs to the Special Issue Population Genetic and Morphological Diversity of Woody Plants)

Abstract

:
Ginkgo biloba L., as one of the oldest tree species, is a very important medicinal plant due to the metabolites in its leaves. To explore the variations and genetic regulation of leaf phenotypic traits, 321 samples from 12 ancient populations in the major distribution areas in China were collected for the leaf morphometric analysis, and 126 samples from 9 ancient populations were used for the genome-wide association study (GWAS) of leaf traits. The results showed that the leaf weight (fresh weight and dry weight) and size (areas) varied greatly, while the length:width ratio (LWR) was stable. There were significant differences in leaf traits among different ancient populations (p < 0.01), and population ZJ from eastern China—with a greater leaf weight and size—was ideal for leaf production. Leaf thickness (LT) showed correlations with altitude, longitude and frost-free period, while LWR had a correlation with altitude (p < 0.05). However, the correlations between environmental factors and leaf traits were weak, which may be related to the origin of populations and human activities. A GWAS revealed that 29 single nucleotide polymorphism (SNP) loci and 112 candidate genes related to leaf traits, and Gb_04106, which is related to auxin, may be involved in the genetic regulation of LT. It is speculated that environmental factors may induce leaf morphology of G. biloba by affecting the accumulation of secondary metabolites. The results of this study may provide a theoretical basis for studying the variation pattern and genetic regulation of leaf phenotypes.

1. Introduction

Ginkgo biloba L., as a “living fossil”, is one of the oldest tree species in the world. The origin of this species can be traced back to the early Permian period, and G. biloba trees spread almost all over the world [1]. Due to climatic change during the Quaternary glaciation period, only G. biloba survived, becoming a native tree in China. Therefore, China owns most of the worldwide G. biloba resources, including widely distributed ancient populations. Investigations of the habitats within the distribution area of ancient populations have shown that the mountainous areas in southwestern China and Mt. Tianmu in eastern China may be two refuges of G. biloba, and the ancient populations in these areas may be natural populations that developed from the refuge populations [2,3]. The populations in central China may originate from the expansion of the refuge populations [3]. The ancient populations have been affected by both environmental and human activities throughout the past centuries, and there were also variations among them in genetics and secondary metabolite contents of leaves [4,5,6]. Leaves are the main organs of plant photosynthesis, and leaf morphology has strong environmental plasticity and sensitivity [7,8]. Under the influence of the environment and humans, some heritable variations of leaf traits may be retained [9]. However, previous studies on ancient populations mainly focused on ecology, molecular biology and metabolomics [2,3,4,5,6]. The leaf morphological variations were only studied among cultivars and excellent individuals, while those among the ancient populations were still unclear [10,11]. Evaluating the effects of environmental and human activities on the ancient populations is important for understanding their adaptability, which can help us protect them effectively. Furthermore, Gingko is an important medical plant around the world, and the flavonoids and lactones in its leaves are beneficial to the health of humans [12,13]. Hence, the breeding of leaf used cultivars is an important activity, the success of which depends on abundant germplasm resources. In general, individuals with large leaf area and weight will be of great concern in the breeding of cultivars for leaf uses. The ancient populations have abundant genetic information, including some unique alleles, and studies on the variation in leaf traits can provide guidance for the selection of breeding materials based on leaf features.
Genome-wide association studies (GWASs) based on populations to explore the relationships between traits and genetic variations have been applied to tree species [14,15,16,17]. The ccoaomt-1 gene involved in lignification [14] and the α-tubulin gene involved in the formation of cortical microtubules [15] have been identified in Pinus taeda L. Depending on the extent of linkage disequilibrium, it is possible to identify alleles within candidate genes associated with traits. Using single-marker and haplotype analyses in 290 trees from a Eucalyptus robusta L. natural population, two haplotypes significantly associated with the microfibril angle have been found [16]. Moreover, two nonsynonymous single nucleotide polymorphisms (SNPs) have been identified in the phytochrome B2 gene that were independently associated with variation in the timing of bud set in Populus tremula L. [17]. Generally, association studies rely on the accumulation of variations in natural populations across generations. The ancient G. biloba populations in China have abundant genetic variations [18] and are efficient materials for GWASs. However, a large number of SNP loci are needed for GWASs, and resequencing has limited uses due to the high cost. With the development of sequencing techniques, reduced-representation genome sequencing (RRGS) was created, and this sequencing tool that uses the restriction enzyme digestion of target genomes to reduce their complexity was valuable for genome-wide genetic marker development and genotyping [19,20,21]. Genotyping by sequencing (GBS), as one of the RRGS methods, has been applied in the genetic analysis of plants [22,23,24].
In this study, we analyzed the leaf phenotypes and conducted a GWAS for leaf traits across the widely distributed ancient populations of G. biloba. The objectives of this study are to: (1) reveal the phenotypic variations among ancient populations, (2) select the excellent germplasm resources for leaf production, and (3) explore the regulation of leaf traits. We believe that understanding the phenotypic variations and genetic regulation of G. biloba leaves will contribute to the conservation and utilization of the ancient populations.

2. Materials and Methods

2.1. Sample Information

A total of 397 ancient trees from 12 ancient populations were collected in the main distribution areas of G. biloba, covering 4 provinces, namely, Guizhou, Guangxi, Hubei and Zhejiang. In order to reduce the probability of sampling trees that were closely related, the distance between sampled trees was more than 50 m (except in small populations). Current-growth branches of ancient trees were collected and the information for each population was recorded, including longitude, latitude, altitude, etc. The annual rainfall, annual relative humidity, annual temperature, frost-free period and light days were downloaded from the China Meteorological Administration website (http://www.cma.gov.cn/, accessed on 22 December 2016). The samples were preserved by grafting in the germplasm resource nursery of Nanjing Forestry University (32.1 N, 119.0 E). In the morphometric analysis, leaves of each clone should be sampled from at least three ramet to decrease sampling error, and the clones with less than three ramet should be excluded. Finally, 321 three-year-old clones of ancient trees from 12 populations were used for the morphometric analysis. In July, fifteen fresh leaves per clone (5 leaves per ramet) with normal growth were sampled from the middle of long shoots randomly and immediately taken back to the laboratory. Most of the genetic information of population MC, AL and CX may originate from the southwestern and eastern populations (PX, WC, TM, etc.) based on the previous studies [2,3,4,5] and may be redundant in the genetic study. Hence, the three populations were not used for the genetic study. The number of ancient trees from population DY and FG was small, and they were all selected for the genetic study. To decrease the cost and keep the sample number similar, fourteen to fifteen samples per population were selected randomly from population PX, WC, LC, JS, SZ, TM and ZJ. Finally, 126 ancient trees from 9 populations were used for the genetic study. Young leaves were collected and desiccated by silica gel for later use. Information on the populations is provided in Table 1 and Figure 1.

2.2. Measurement of Leaf Traits

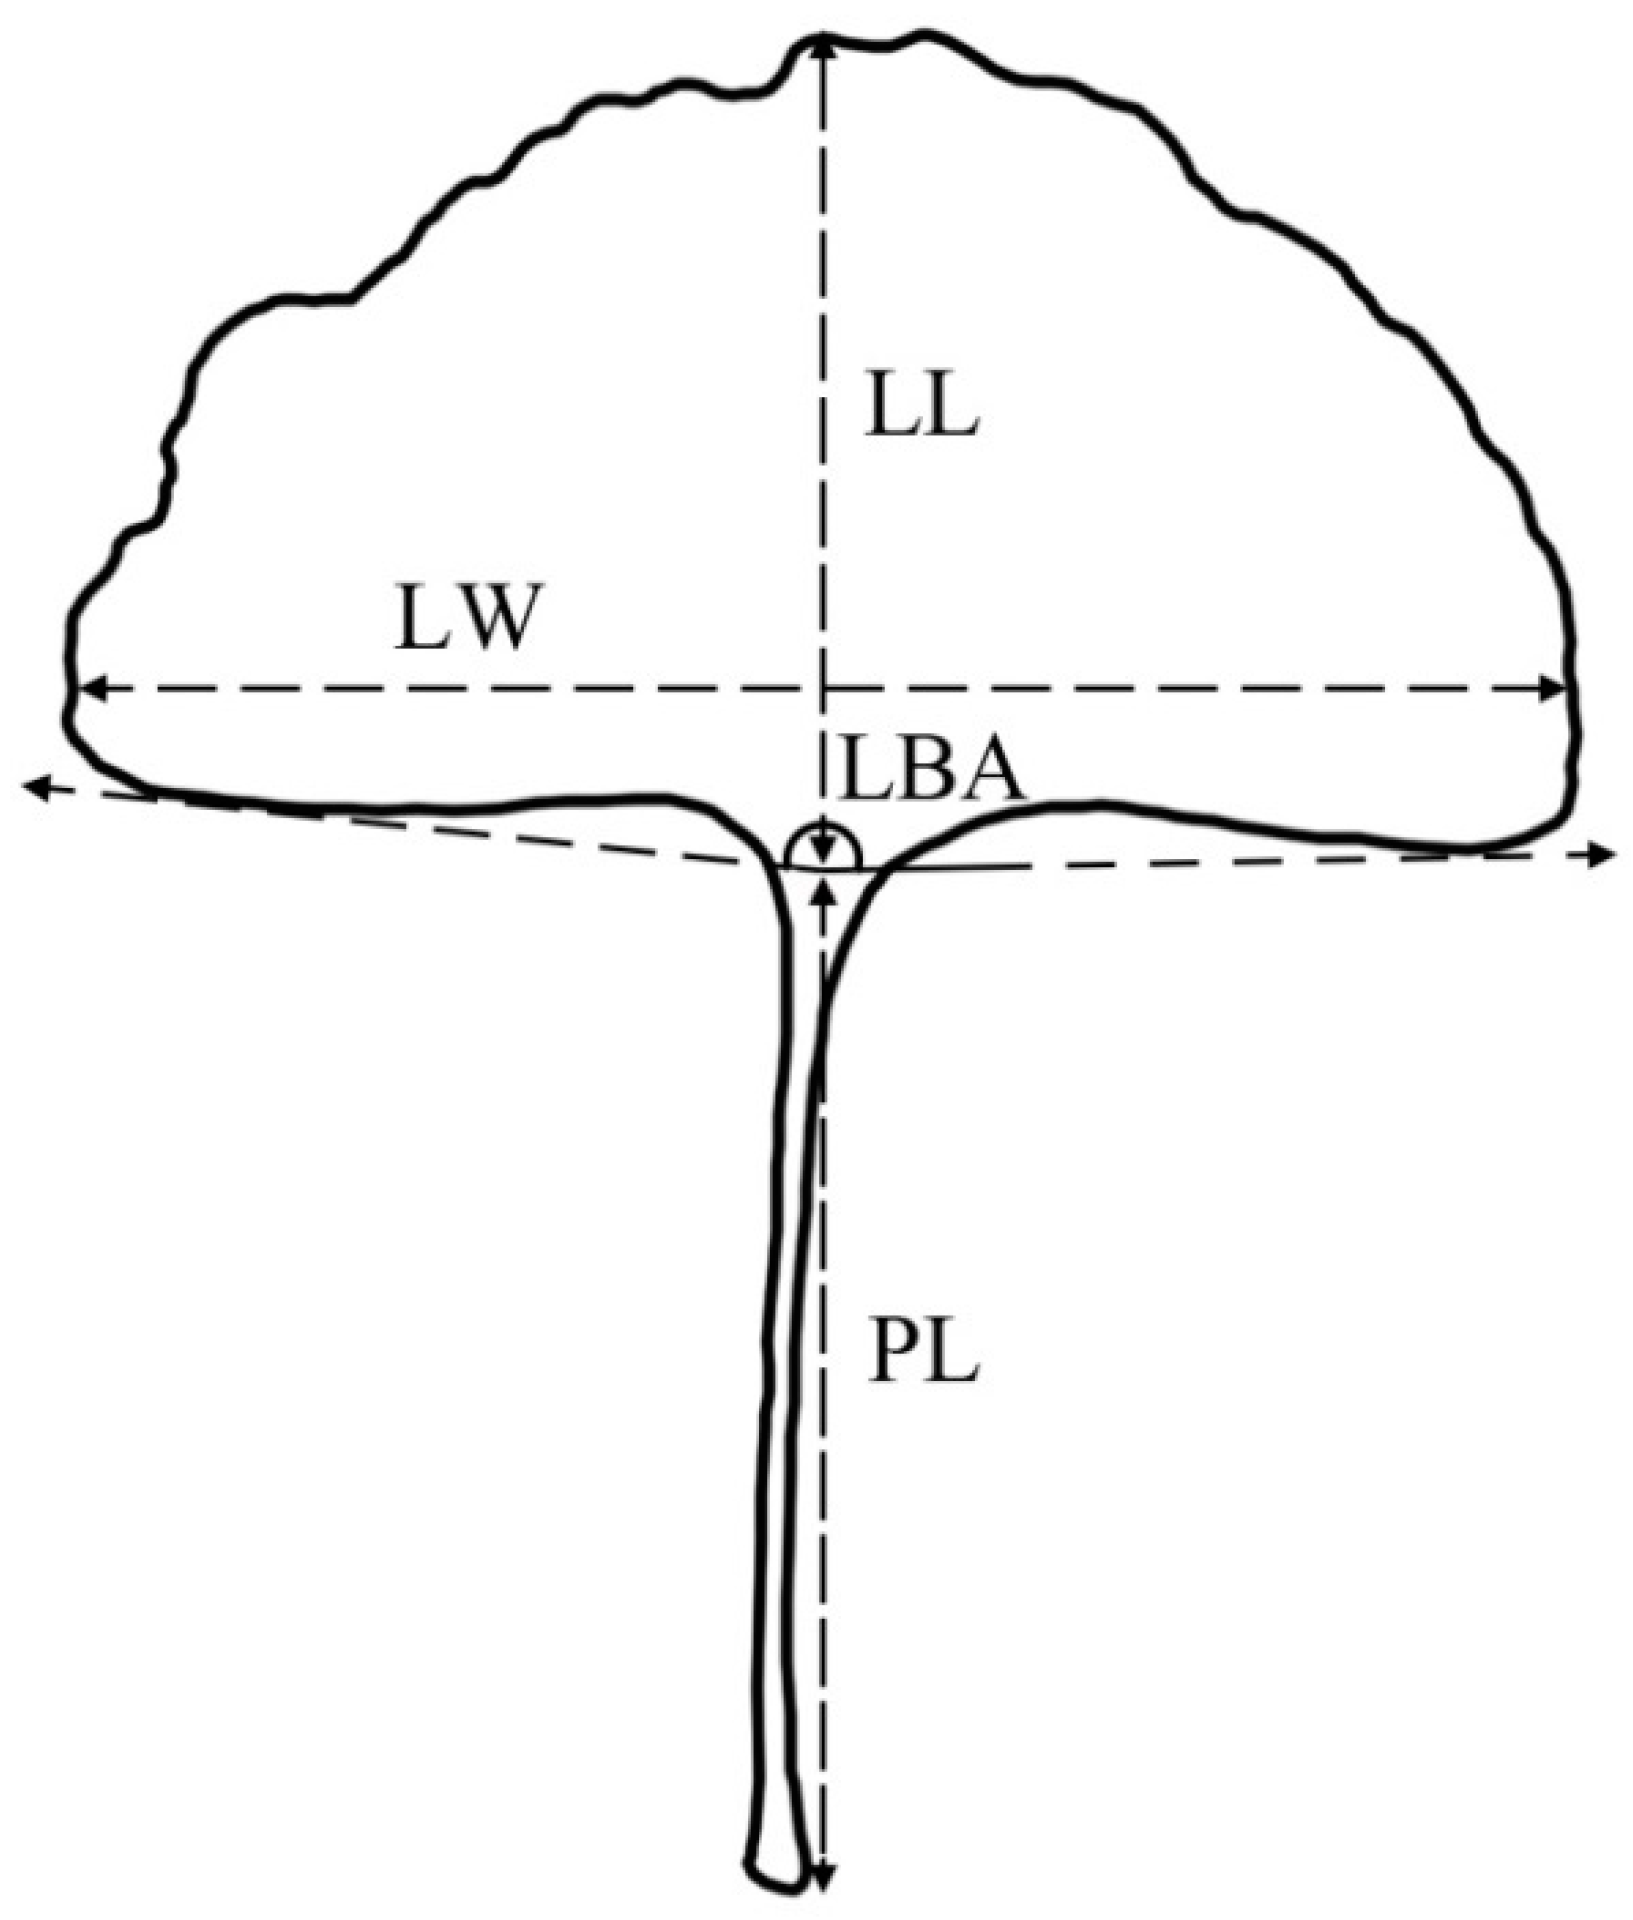
Before the measurement of leaf traits, all the leaves of the samples were rinsed with water and placed in the shade to dry slightly for 1 h in order to remove dust from the surface of the leaves. First, leaf length (LL), leaf width (LW), petiole length (PL) and leaf thickness (LT) were measured on fresh materials by vernier calipers, and the length:width ratio (LWR) was calculated. The total thickness of fifteen leaves for each clone was measured after overlapping, and the average thickness was taken as the measure of leaf thickness. Second, the leaves of each clone were scanned, and the leaf base angle (LBA) and leaf area (LA) were measured using Photoshop CS6 (Adobe Systems Incorporated, San Jose, CA, USA; Figure 2). Third, the total fresh weight of the leaves for each sample was weighed, and the average weight was taken as the measure of fresh weight (FW). Finally, the leaves were oven-dried at 65 °C to a constant weight for 6 h. The total dry weight of the leaves for each sample was determined, and the average weight was taken as the measure of dry weight (DW).

2.3. Library Construction and Sequencing

Whole-genome DNA was obtained using a DNeasy Plant Mini Kit (Qiagen, Hilden, NRW, Germany). Before the library construction, the concentrations of DNA were measured by a Thermo Scientific NanoDrop 2000C and an Invitrogen Qubit 4 Fluorometer (Thermo Fisher Scientific, Waltham, MA, USA), while the qualities of DNA were determined by 1% agarose gel electrophoresis. The qualified DNA of 126 samples was digested by the restriction enzymes Mseal and NlaIII at 37 °C for 2.5 h, and the libraries were ligated to modified Illumina P1 adapters containing the unique barcodes. After Illumina P2 adaptor ligation, each library was amplified using 20 PCR cycles. After running on a 2% agarose gel, fragments of 420 to 450 bp were excised and purified using a gel extraction kit (Qiagen, Hilden, NRW, Germany). The concentrations of libraries were measured by an Invitrogen Qubit 4 Fluorometer and diluted to 1 ng/μL. The libraries were paired-end sequenced (150 bp) using an Illumina HiSeq 2000 instrument (Illumina Inc., San Diego, CA, USA). The raw reads with more than 10% unknown bases were excluded. The filtered high-quality sequences were mapped onto the reference genome of G. biloba [25].

2.4. SNP Calling and Filtering

SNP detection was achieved using SAMtools version 1.16.1 software and BCFtools version 1.16 software (Wellcome Trust Sanger Institute, Cambridge, UK) [26,27]. To ensure the accuracy of the analysis, the SNPs were filtered as follows: (Ⅰ) InDels were rejected; (Ⅱ) SNPs with Phred-scaled genotyping quality (GQ) and mapping quality (MQ) less than 100 and 40, respectively, were rejected; (Ⅲ) SNPs with a depth of coverage (DP) less than 5 or greater than 500 in any sample were rejected; (Ⅳ) only SNPs found in at least 98% of the individuals were selected; (Ⅴ) SNPs with a minimum allele frequency (MAF) smaller than 0.05 were excluded; and (Ⅵ) SNPs that deviated from Hardy–Weinberg equilibrium (HWE; p < 0.01) in any population under study were excluded.

2.5. GWASs and Associated Gene Detection

The GWAS was performed using genome-wide efficient mixed-model analysis (GEMMA) [28], and mixed linear models (MLMs) were selected. The candidate genes on each side of the SNP loci related to the leaf traits were detected [25,29] and annotated based on the NCBI nonredundant protein sequence (Nr), protein family (PFAM), Swiss-Port, Gene Ontology (GO) and Kyoto Encyclopedia of Genes and Genomes (KEGG) databases.

2.6. Statistical Analysis

The mean, standard deviation and coefficient of variation for each leaf trait were calculated by SPSS 22.0 (IBM Inc., Chicago, IL, USA). The statistical analyses, including one-way analysis of variance (ANOVA), Duncan’s multiple range test and Person’s correlation analysis, were also performed using SPSS 22.0. Before ANOVA and Pearson’s correlation analysis, the residuals of the data for each leaf trait were tested for normality with the Shapiro–Wilk W test and for homogeneity of variances with Levene’s test. The nonnormally distributed data were logarithmic transformed.

3. Results

3.1. Variations in Leaf Traits among Populations

The nine leaf traits of the 321 samples from 12 ancient populations were analyzed, and abundant variations among the populations were detected (Table 2). In general, the variations in leaf weight (CV = 18.60%~24.84%) and area (CV = 15.71%) were greater than those in the other leaf traits (4.27%~10.90%). Of the leaf traits, DW had the greatest variation (24.84%), ranging from 0.16 g to 0.39 g, with an average of 0.29 g. The LWR was stable among the populations and ranged from 0.58 to 0.68, with an average of 0.63.
ANOVA of the populations was performed, and there were significant differences in the nine leaf traits (p < 0.01; Table 2). The populations from the southwestern region (PX, DY, FG and WC) showed smaller values for most leaf traits than those from the eastern region. Among the 12 populations, population ZJ from eastern China showed significantly larger LL (5.37 cm), LW (8.66 cm) and LT (0.40 mm) values than the other populations from southwestern China (3.90 cm~4.70 cm; 6.70 cm~7.86 cm; 0.29 mm~0.35 mm) (p < 0.01), while the LA of population ZJ (31.03 cm2) was significantly larger than those of the other 11 populations (17.42 cm2~26.69 cm2; p < 0.01). The FW and DW of the eastern population ZJ and central population MC were significantly larger than those of most other populations (p < 0.05). Moreover, the FW, DW, LL, LW and LA of the southwestern population DY were smaller than those of the other populations, and the FW, DW and LL of population DY were significantly smaller than those of the other populations except for population WC (p < 0.05).

3.2. Variations in Leaf Traits within Populations

To explore the phenotypic variations within the populations, the CVs were analyzed (Table 3). Of the leaf traits, FW (22.96%) and DW (24.43%) had more variation within populations than the other traits (7.20%~19.49%). LWR and LT showed the lowest variation within populations, with CVs less than 10%. Among the twelve populations, the populations from central China (16.05%) showed greater average CVs than those from southwestern (14.80%) and eastern (14.08%) China. Population WC from southwestern China (19.61%) had the greatest CVs for leaf traits on average, while population ZJ from eastern China had the lowest CVs (11.87%).

3.3. Correlations between Leaf Traits and Climatic Factors

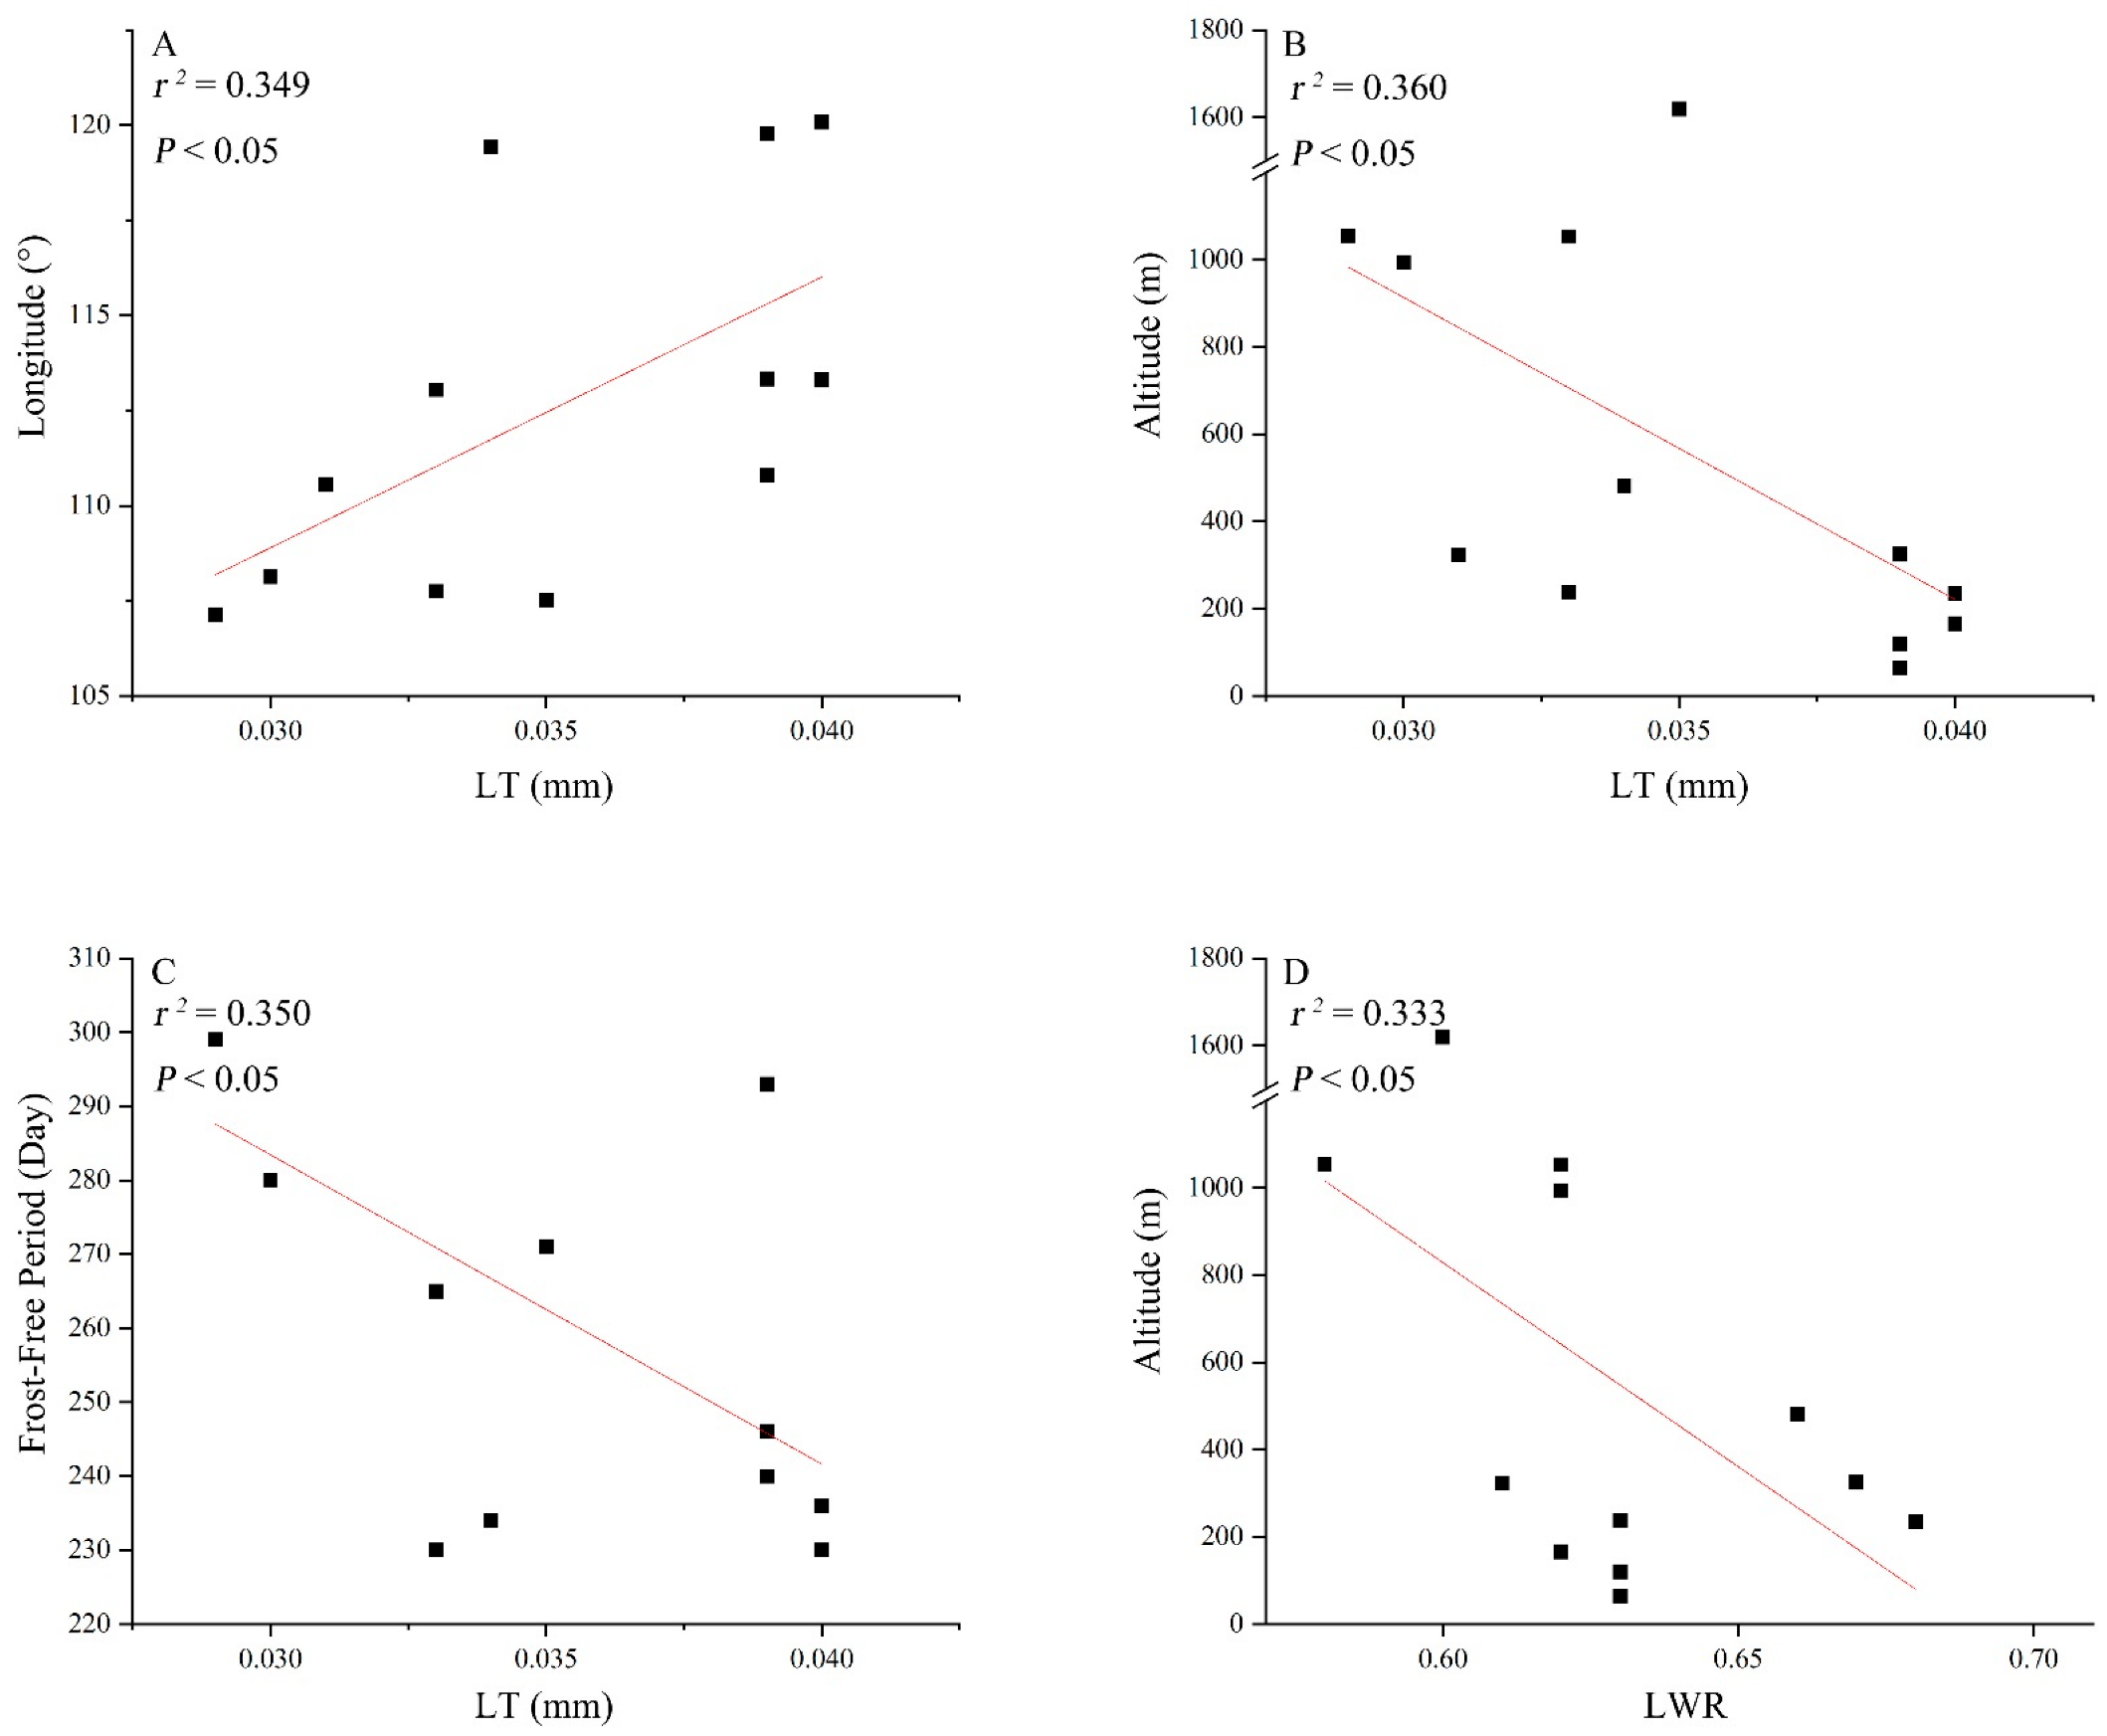
The values of correlation coefficients were below 0.7 and −0.7 (Table S1), indicating the weak correlations, and statistically significant correlations are shown in Figure 3 (p < 0.05). There was a significant positive correlation between longitude and LT (p < 0.05; Figure 3A), and LT showed an increasing trend with increasing longitude. LT and LWR showed a significant negative correlation with altitude (p < 0.05) and showed a decreasing trend with increasing altitude (Figure 3B,D). In addition, a significant negative correlation was detected between the frost-free period and LT (p < 0.05), where LT showed a decreasing trend with an increasingly long frost-free period (Figure 3C).

3.4. Genotyping by Sequencing

One hundred and twenty-six ancient individuals from nine populations were genotyped by sequencing, and 329.99 Gb of raw data was obtained. After filtering, a total of 329.97 Gb of clean data was retained, ranging from 1.76 Gb to 4.82 Gb, with an average of 2.62 Gb per sample. The Q20 (Q30) of the data ranged from 93.79% (85.10%) to 96.48% (91.19%), with an average of 95.51% (88.92%), suggesting that the quality of the sequencing data was acceptable. The clean reads were mapped onto the reference genome, and the mapping rate ranged from 99.17% to 99.81%, with an average of 99.70% (Table 4).

3.5. SNP Calling

The SNP loci were detected based on the clean data of 126 samples. A total of 12,873,063 SNP loci were obtained. To ensure the accuracy of the subsequent GWAS, the original SNP loci were filtered, and those with low quality (GQ < 100; MQ < 400), a high missing rate (>2%) or significant deviation from HWE (p < 0.05) in any population were removed. Finally, a total of 158,743 high-quality SNP loci were retained, and the call rate of 126 samples ranged from 99.23% to 99.38%, with an average of 99.31% (Table 4).

3.6. Genome-Wide Association Study

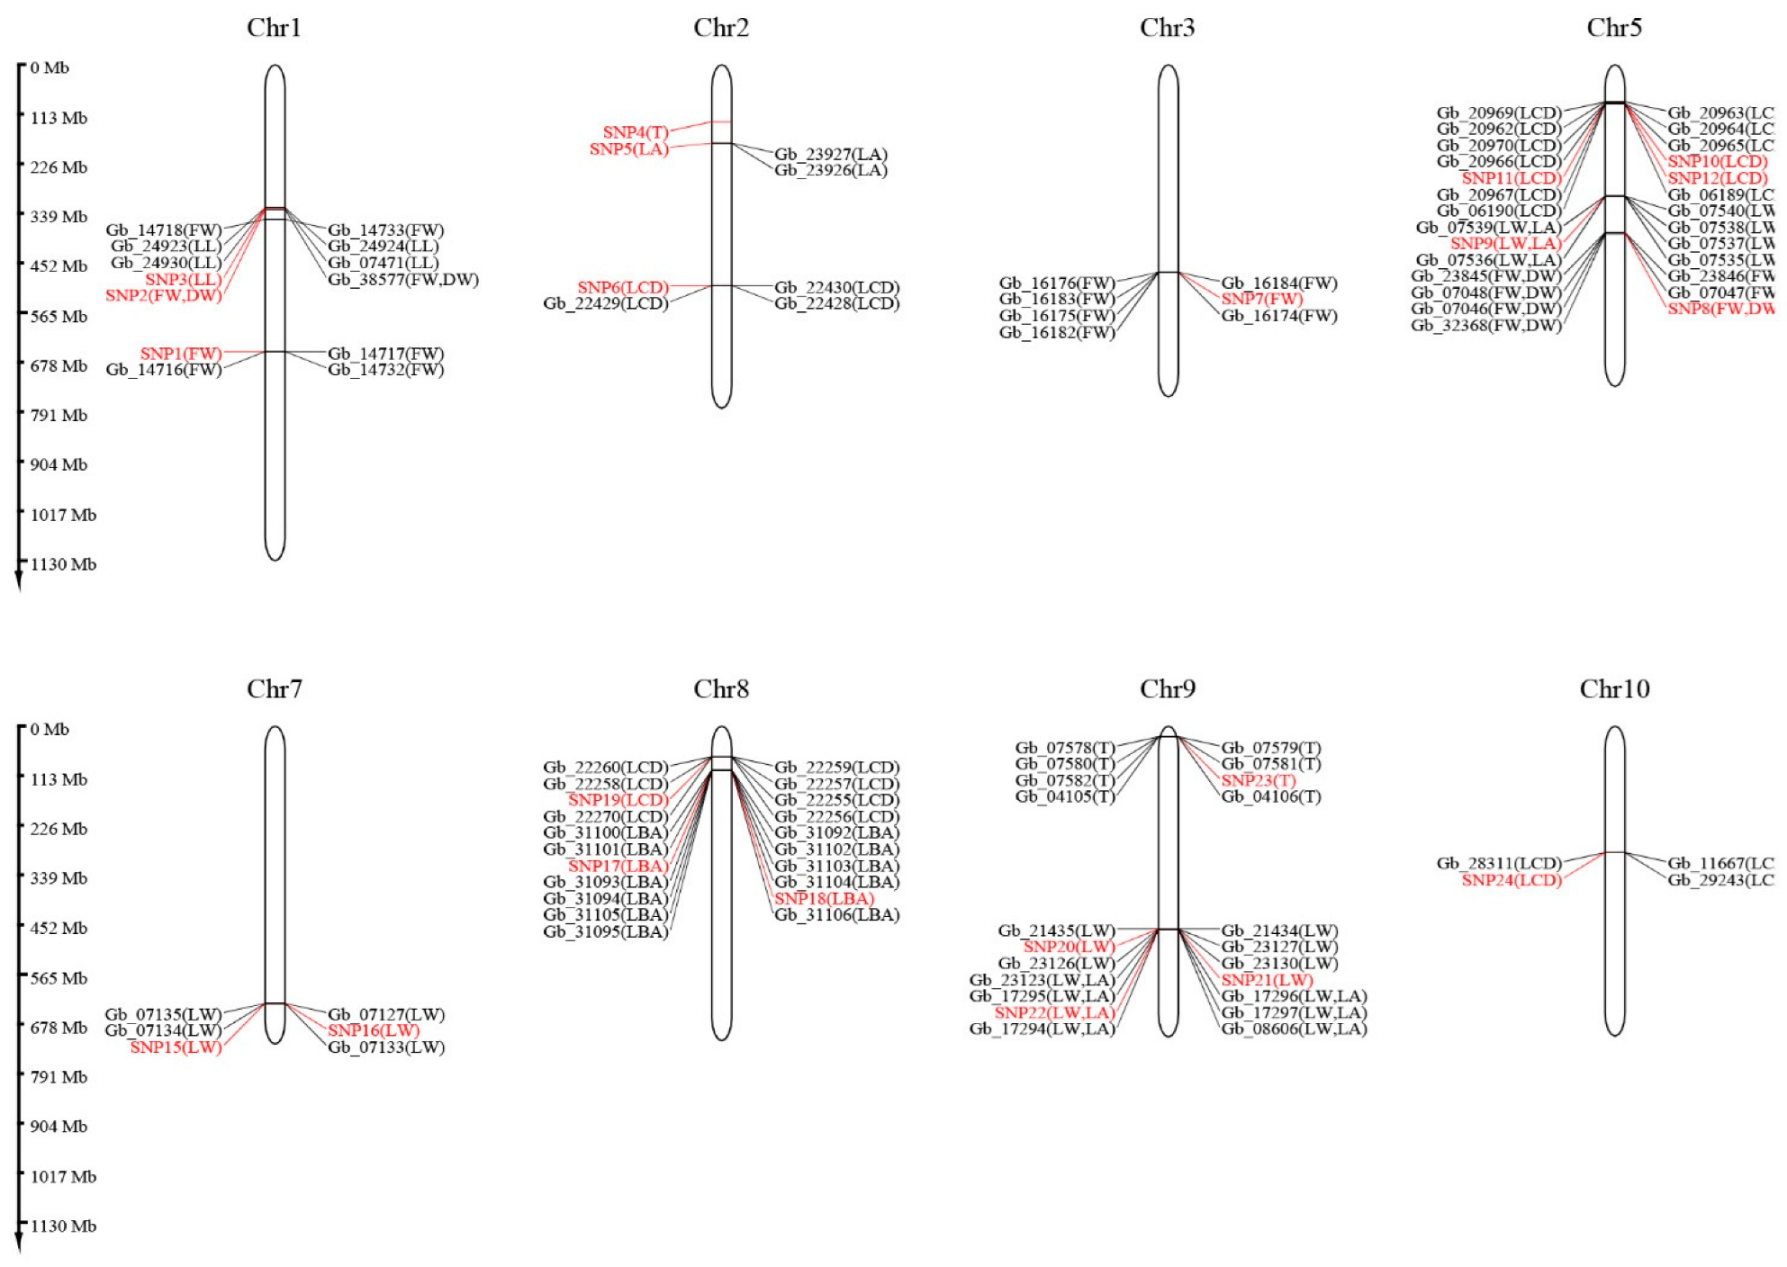
The GWASs of leaf traits were performed based on the MLM. No SNP loci were detected for PL, and a total of 29 SNP loci related to the other 8 leaf traits were obtained (Figure 4; Table S2). The 29 SNP loci were located on 10 chromosomes, and the number of SNP loci on each chromosome ranged from 1 to 5. The LWR (10) related to leaf shape had more associated SNP loci than the other leaf traits, and the LBA (2) had the fewest associated SNP loci. Four SNP loci were associated with FW and DW related to leaf weight, and SNP 2 and SNP 8 were associated with both leaf traits. LL, LW and LA related to leaf size had 13 associated SNP loci, and SNP 9 and SNP 22 were associated with both LW and LA. Moreover, three SNP loci associated with LT were obtained.

3.7. Genes Related to Leaf Traits

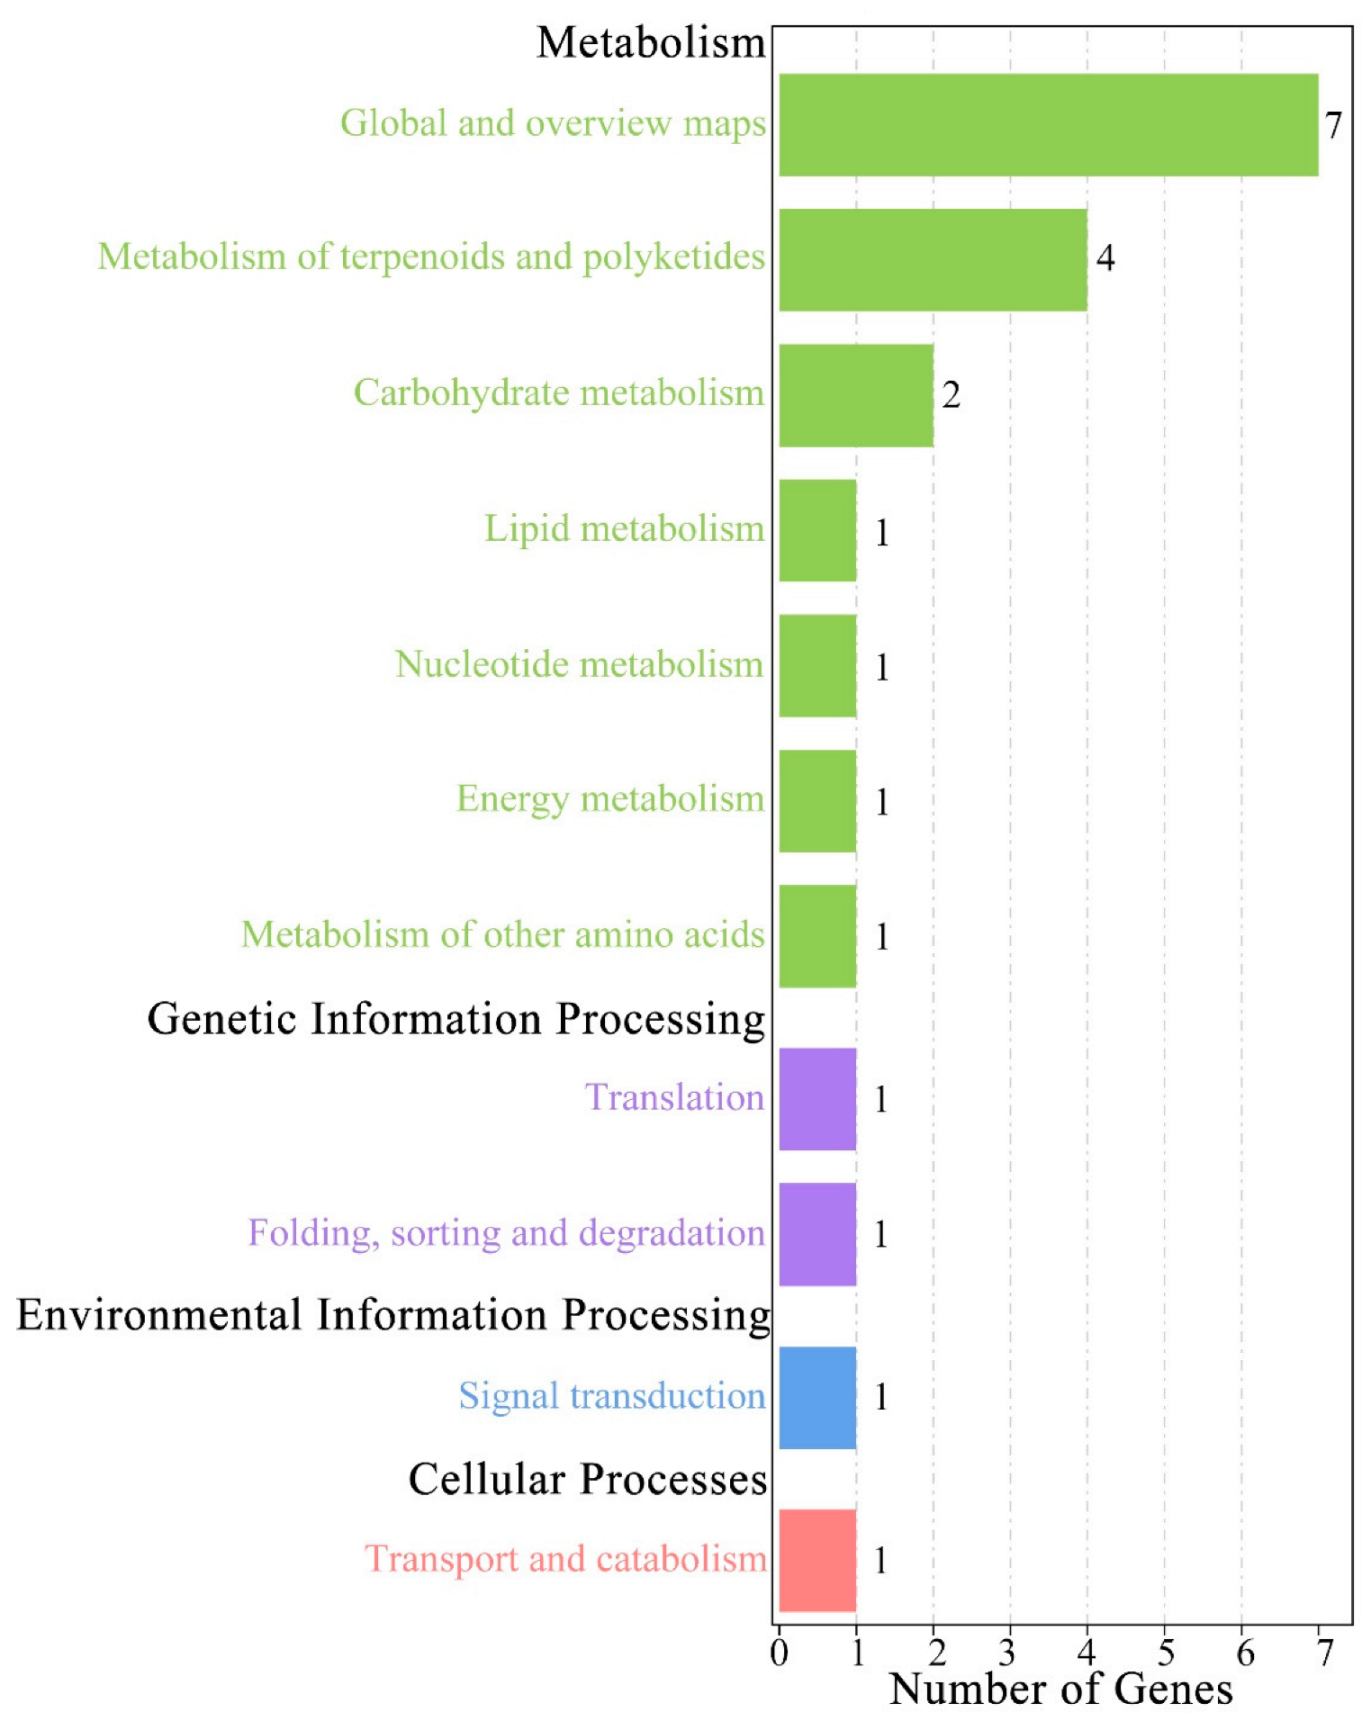
To identify the genes related to leaf traits, genes within 500 kb on each side of the 29 associated SNP loci were detected. As a result, 112 genes were found to be related to leaf traits (Figure 4; Table S3). The number of genes associated with leaf shape (LWR; 42) was the greatest. A total of 18 genes related to leaf weight (DW and FW) were obtained, and seven of them were related to both FW and DW. Leaf size traits (LL, LW and LA) had 33 associated genes, while the numbers of genes related to LT and LBA were 14 and 11, respectively. GO analysis showed that many genes were enriched in metabolic processes (Figure 5). Further KEGG analysis also showed that 6 genes were enriched in the biosynthesis of secondary metabolites (ko01110; Figure 6), which were related to leaf weight (FW and DW) and leaf shape (LBA and LWR). Gb_04106 associated with LT was enriched in plant hormone signal transduction (ko04075) and was related to auxin based on the PFAM database.

4. Discussion

Phenotypic plasticity is a proposed mechanism by which plant species may persist when faced with rapid environmental changes [30], and the growth and habitat of G. biloba may be influenced by climate change [31]. Phenotypic plasticity can play a role both in the short-term response of plant populations to global changes, as well as in their long-term fate through the maintenance of genetic variation. In order to explore heritable variation of leaf traits, samples in this study were grafted in the same place, and the rootstock, environment and management measures were kept consistent to limit the impact of environmental heterogeneity. DW and LA had the most abundant variation among the different populations, which was consistent with the results of previous studies [32]. LWR was a stable trait and had the lowest variation. Previous studies on Malus pumila Mill. and Citrullus lanatus (Thunb.) Matsum. and Nakai populations showed that the variations in LWR were lower than those in the other leaf traits [33,34]. Among the populations, population ZJ from eastern China showed significantly greater values for the leaf traits than most other populations, while population DY from southwestern China had lower leaf trait values than the others (p < 0.05), suggesting obvious variations between the eastern and western populations. Leaf trait variations were also detected among different populations of Liriodendron chinense (Hemsl.) Sarg., with the leaves from the east being larger than those from the west [35]. Moreover, the contents of secondary metabolites in leaves from ancient G. biloba populations showed geographical correlations and were affected by environmental factors [6]. In a study on leaf variations in response to climate changes in seven representative dicotyledons (Acer davidii Franch., Litsea cubeba (Lour.) Pers., Myrsine semiserrata Wall., Stachyurus chinensis Franch., Symplocos paniculata (Thunb.) Miq., Achyranthes bidentata Blume and Gonostegia hirta (Bl.) Miq.), the LWR of leaves in cold and dry environments was smaller than that in warm environments [36], which may be due to the changes in plants in response to differences in heat and water [37]. In addition, the LT also changed in response to the climate (longitude, altitude and frost-free period; p < 0.05), which may be related to increased environmental adaptability [38]. The LT of Populus euphratica Oliv. increases in order to increase photosynthetic area and water loss resistance to meet the demand for nutrients and water [39]. However, the leaf traits (LT and LWR) only showed significantly related to part of environmental factors (longitude, altitude and frost-free period), and the correlations were weak in this study. The leaf morphology of G. biloba populations was influenced not only by environmental factors but also by the origin of populations and human activities. On the one hand, the populations from central China may originate from those from southwestern and eastern China [40], and the leaf morphologic variations among populations from different regions may show weak geographical correlations. On the other hand, many ancient trees were destroyed, and the ratios of males to females were close to 1:1 only in populations FG and TM. Human activities limited the expression of phenotypic plasticity and hence its possibility of being a target of natural selection [41], which weakened the influence of environmental factors. Additionally, population ZJ from eastern China had larger leaf weight (FW and DW) and size (LA, LL and LW) than the other populations, which was of great significance to increase leaf yield. The leaves from population ZJ were enriching in beneficial secondary metabolites (flavonoid and lactone) [6], which indicated that this population was ideal for leaf production.
In general, leaf morphology is influenced by both genetic and environmental factors, and the variations among and within populations in this study were mainly influenced by genetics, which lays a foundation for GWASs of leaf traits. In this study, many genes related to leaf traits were enriched in biosynthesis of secondary metabolites. Flavonoids, the vast class of secondary metabolites encompassing more than 10,000 structures, could negatively regulate polar auxin transport in vivo, so as to act as endogenous auxin transport inhibitors [42]. The variations of leaf traits in G. biloba among different sites were likely affected by the accumulation of metabolites with important biological functions in leaves [43]. Therefore, the leaf morphology of G. biloba may be related to the regulation of secondary metabolites [44]. Moreover, secondary metabolites are not essential for the survival of the plant, but they play an important role in sex determination [45] and adaptability to the environment [46]. The accumulation of secondary metabolites in leaves is influenced by environmental factors [47]. The content of flavonols in the Ginkgo leaves changed in response to ultraviolet radiation [43,48]. Previous studies showed that the content of secondary metabolites in leaves from ancient G. biloba populations were significantly influenced by altitude [6]. Hence, environmental factors may induce leaf morphology of G. biloba by affecting the accumulation of secondary metabolites. As the basic structural and functional units of plants, leaves are the main sites of photosynthesis, transpiration and respiration. Leaf thickness is an important factor of leaf morphology and can affect photosynthesis and yield of leaves [49,50]. Gb_04106 associated with leaf thickness was related to auxin, which could influence the growth and development of plants [51,52].

5. Conclusions

The leaf morphology of G. biloba showed significant variations among ancient populations and varied greatly between southwestern and eastern populations. Population ZJ—with greater leaf weight and size, from eastern China—was ideal for leaf production. However, correlations between leaf morphology and environmental factors were weak, which may be related to the origin of ancient populations and human impacts. Moreover, environmental factors may induce the leaf morphologic variations by affecting the accumulation of metabolites. Gb_04106, which is related to auxin, may be involved in the regulation of leaf thickness.

Supplementary Materials

The following supporting information can be downloaded at: https://www.mdpi.com/article/10.3390/f13111764/s1, Table S1: Correlation analysis between leaf traits and climatic factors; Table S2: Information on SNP loci associated with the leaf traits; Table S3: Information on the genes related to leaf traits.

Author Contributions

Conceptualization, Y.L. and Q.Z.; methodology, Q.Z.; software, Q.Z. and X.S.; validation, Q.Z., X.S. and Y.L.; investigation, Q.Z.; data curation, X.S.; writing—original draft preparation, Q.Z.; writing—review and editing, Q.Z.; supervision, Y.L.; project administration, Q.Z. and Y.L.; funding acquisition, Q.Z. and Y.L. All authors have read and agreed to the published version of the manuscript.

Funding

This research was funded by the National Natural Science Foundation of China (31902064) and Special Project for Research Institute of Zhejiang Province (2021F1065-1).

Institutional Review Board Statement

Not applicable.

Informed Consent Statement

Not applicable.

Data Availability Statement

Not applicable.

Acknowledgments

We are grateful to Li-an Xu, Kemin Mu and Ming Qi for their help with sampling in the field and laboratory work.

Conflicts of Interest

The authors declare no conflict of interest.

References

  1. Zhou, Z.Y.; Zheng, S.L. Palaeobiology: The missing link in Ginkgo evolution. Nature 2003, 423, 821–822. [Google Scholar] [CrossRef]
  2. Xiang, Y.H.; Xiang, B.X.; Zhao, M.S.; Wang, Z.L. A report on the natural forest with Ginkgo population in west Tianmu moutains, Zhejiang province. Guizhou Sci. 2000, 18, 77–92. [Google Scholar]
  3. Fan, X.X.; Shen, L.; Zhang, X.; Chen, X.Y.; Fu, C.X. Assessing genetic diversity of Ginkgo biloba L. (Ginkgoaceae) populations from China by RAPD markers. Biochem. Genet. 2004, 42, 269–278. [Google Scholar] [CrossRef] [PubMed]
  4. Gong, W.; Zeng, Z.; Chen, Y.Y.; Chen, C.; Qiu, Y.X.; Fu, C.X. Glacial refugia of Ginkgo biloba and human impact on its genetic diversity: Evidence from chloroplast DNA. J. Integr. Plant Biol. 2008, 50, 368–374. [Google Scholar] [CrossRef] [PubMed]
  5. Tang, C.Q.; Yang, Y.C.; Ohsawa, M.; Yi, S.R.; Momohar, A.; Su, W.H.; Wang, H.C.; Zhang, Z.Y.; Peng, M.C.; Wu, Z.L. Evidence for the persistence of wild Ginkgo biloba (Ginkgoaceae) populations in the Dalou Mountains, southwestern China. Am. J. Bot. 2012, 99, 1408–1414. [Google Scholar] [CrossRef] [Green Version]
  6. Zhou, Q.; Mu, K.M.; Xu, M.; Ma, X.Y.; Ni, Z.X.; Wang, J.W.; Xu, L.A. Variation in the concentrations of major secondary metabolites in Ginkgo leaves from different geographical populations. Forests 2017, 8, 266. [Google Scholar] [CrossRef] [Green Version]
  7. Gattmann, M.; McAdam, S.A.M.; Birami, B.; Link, R.; Nadal-Sala, D.; Schuldt, B.; Yakir, D.; Ruehr, N.K. Anatomical adjustments of the tree hydraulic pathway decrease canopy conductance under long-term elevated CO2. Plant Physiol. 2022, kiac482, 1–20. [Google Scholar] [CrossRef]
  8. Buraczyk, W.; Tulik, M.; Konecka, A.; Szeligowski, H.; Czacharowski, M.; Bedkwski, M. Does leaf mass per area (LMA) discriminate natural pine populations of different origins? Eur. J. For. Res. 2022, 141, 1177–1187. [Google Scholar] [CrossRef]
  9. Nicotra, A.B.; Atkin, O.K.; Bonser, S.P.; Davidson, A.M.; Finnegan, E.J.; Mathesius, U.; Poot, P.; Purugganan, M.D.; Richards, C.L.; Valladares, F.; et al. Plant phenotypic plasticity in a changing climate. Trends Plant Sci. 2010, 15, 684–692. [Google Scholar] [CrossRef]
  10. Sheng, B.L.; Zhao, H.L.; Ma, L.B.; Lin, J.; Liu, C.Y.; Chen, X.G. Leaf characteristics of Ginkgo biloba L. J. Plant Genet. Resour. 2004, 1, 65–68. [Google Scholar] [CrossRef]
  11. Hu, P.T.; Yan, X.C.; Luo, J.X.; Liu, F.R.; Du, Y.P. Phenotypic variation of Ginkgo leaves in Sichuan native land. J. Sichuan For. Sci. Technol. 2020, 41, 64–70. [Google Scholar]
  12. Kondratskaya, E.L.; Krishtal, O.A. Effects of Ginkgo biloba extract constituents on glycine-activated strychnine-sensitive receptors in hippocampal pyramidal neurons of the rat. Neurophysiology 2002, 2, 155–157. [Google Scholar] [CrossRef]
  13. Wang, Y.; Liu, Y.; Wu, Q.; Yao, X.; Cheng, Z.Q. Rapid and sensitive determination of major active ingredients and toxic components in Ginkgo biloba leaves extract (EGb 761) by a validated UPLC–MS-MS Method. J. Chromatogr. Sci. 2017, 4, 459–464. [Google Scholar] [CrossRef] [Green Version]
  14. González-Martínez, S.C.; Ersoz, E.; Brown, G.R.; Wheeler, N.C.; Neale, D.B. DNA sequence variation and selection of tag single-nucleotide polymorphisms at candidate genes for drought-stress response in Pinus taeda L. Genetics 2006, 172, 1915–1926. [Google Scholar] [CrossRef] [Green Version]
  15. González-Martínez, S.C.; Wheeler, N.C.; Ersoz, E.; Nelson, C.D.; Neale, D.B. Association genetics in Pinus taeda L. I. Wood property traits. Genetics 2007, 175, 399–409. [Google Scholar] [CrossRef] [Green Version]
  16. Thumma, B.R.; Nolan, M.F.; Evans, R.; Moran, G.F. Polymorphisms in Cinnamoyl CoA Reductase (CCR) are associated with variation in microfibril angle in Eucalyptus spp. Genetics 2005, 171, 1257–1265. [Google Scholar] [CrossRef] [Green Version]
  17. Ingvarsson, P.K.; Garcia, M.V.; Luquez, V.; Hall, D.; Jansson, S. Nucleotide polymorphism and phenotypic associations within and around the phytochrome B2 locus in European aspen (Populus tremula, Salicaceae). Genetics 2008, 178, 2217–2226. [Google Scholar] [CrossRef] [Green Version]
  18. Zhou, Q.; Mu, K.; Ni, Z.; Liu, X.; Li, Y.; Xu, L.A. Analysis of genetic diversity of ancient Ginkgo populations using SSR markers. Ind. Crops Prod. 2020, 145, 111942. [Google Scholar] [CrossRef]
  19. Wang, Z.; Gerstein, M.; Snyder, M. RNA-Seq: A revolutionary tool for transcriptomics. Nat. Rev. Genet. 2009, 10, 57–63. [Google Scholar] [CrossRef]
  20. Burbano, H.A.; Hodges, E.; Green, R.E.; Briggs, A.W.; Krause, J.; Meyer, M.; Good, J.M.; Maricic, T.M.; Johnson, P.L.F.; Xuan, Z.Y.; et al. Targeted investigation of the Neandertal genome by array-based sequence capture. Science 2010, 328, 723–725. [Google Scholar] [CrossRef] [Green Version]
  21. Davey, J.W.; Hohenlohe, P.A.; Etter, P.D.; Boone, J.Q.; Catchen, J.M.; Blaxter, M.L. Genome-wide genetic marker discovery and genotyping using next-generation sequencing. Nat. Rev. Genet. 2011, 12, 499–510. [Google Scholar] [CrossRef] [PubMed]
  22. Ward, J.A.; Bhangoo, J.; Fernández-Fernández, F.; Moore, P.; Swanson, J.D.; Viola, R.; Velasco, R.; Bassil, N.; Weber, C.A.; Sargent, D.J. Saturated linkage map construction in Rubus idaeus using genotyping by sequencing and genome-independent imputation. BMC Genom. 2013, 14, 2. [Google Scholar] [CrossRef]
  23. Huang, Y.F.; Poland, J.A.; Wight, C.P.; Jackson, E.W.; Tinker, N.A. Using genotyping-by-sequencing (GBS) for genomic discovery in cultivated oat. PLoS ONE 2014, 9, e102448. [Google Scholar] [CrossRef] [PubMed] [Green Version]
  24. Soto, J.C.; Ortiz, J.F.; Perlaza-Jiménez, L.; Vásquez, A.X.; Augusto, L.; Lopez-Lavalle, B.; Mathew, B.; Léon, J.; Bernal, A.J.; Ballvora, A.; et al. A genetic map of cassava (Manihot esculenta Crantz) with integrated physical mapping of immunity-related genes. BMC Genom. 2015, 16, 190. [Google Scholar] [CrossRef] [Green Version]
  25. Guan, R.; Zhao, Y.P.; Zhang, H.; Fan, G.Y.; Liu, X.; Zhou, W.B.; Shi, C.C.; Wang, J.H.; Liu, W.Q.; Liang, X.M.; et al. Draft genome of the living fossil Ginkgo biloba. Gigascience 2016, 5, 49. [Google Scholar] [CrossRef] [Green Version]
  26. Li, H.; Handsaker, B.; Wysoker, A.; Fennell, T.; Ruan, J.; Homer, N.; Marth, G.; Abecasis, G.; Durbin, R. The sequence alignment/map format and SAMtools. Bioinformatics 2009, 25, 2078–2079. [Google Scholar] [CrossRef] [Green Version]
  27. Narasimhan, V.; Danecek, P.; Scally, A.; Xue, Y.L.; Tyler-Smith, C.; Durbin, R. BCFtools/RoH: A hidden Markov model approach for detecting autozygosity from next-generation sequencing data. Bioinformatics 2016, 32, 1749–1751. [Google Scholar] [CrossRef] [PubMed] [Green Version]
  28. Zhou, X.; Stephens, M. Genome-wide efficient mixed-model analysis for association studies. Nat. Genet. 2012, 44, 821–824. [Google Scholar] [CrossRef] [Green Version]
  29. Liu, H.; Wang, X.; Wang, G.; Cui, P.; Wu, S.G.; Ai, C.; Hu, N.; Li, A.L.; He, B.; Shao, X.J.; et al. The nearly complete genome of Ginkgo biloba illuminates gymnosperm evolution. Nat. Plants 2021, 7, 748–756. [Google Scholar] [CrossRef]
  30. Lee, U.; Mortola, E.; Kim, E.; Long, M. Evolution and maintenance of phenotypic plasticity. Biosystems 2022, 222, 104791. [Google Scholar] [CrossRef]
  31. Guo, Y.; Lu, Y.; El-Kassaby, Y.A.; Feng, L.; Wang, G.B.; Wang, T.L. Predicting growth and habitat responses of Ginkgo biloba L. to climate change. Ann. For. Sci. 2019, 76, 1–9. [Google Scholar] [CrossRef] [Green Version]
  32. Lin, Y.; Li, X.F.; Chen, X.L. Analysis on phenotypic characters and diversity of Ginkgo biloba leaves in Zhejiang Province. Zhejiang J. Tradit. Chin. Med. 2017, 52, 538–539. [Google Scholar]
  33. Zuo, L.H.; Zhang, J.; Dong, Y.; Wang, J.M.; Ren, T.C. Genetic diversity of Malus sieversu natural population from Xinjiang analyzed by leaf traits. Nor. Horticult. 2015, 39, 1–7. [Google Scholar]
  34. Li, M.W.; Zhu, Z.H.; Wang, A.D.; Yao, X.F.; Yang, Z.S.; Cheng, D.S.; Yin, S.X. Leaf shape variation and Hybrid purity identification of several watermelon populations. J. Anhui Agr. Sci. 2001, 2, 213–216. [Google Scholar]
  35. Hui, L.X. Genetic Diversity and Phytogeography of Liriodendron Chinese. Ph.D. Thesis, Nanjing Forestry University, Nanjing, China, 2010. [Google Scholar]
  36. Li, Y.Q.; Zou, D.T.; Shrestha, N.; Xu, X.T.; Wang, Q.G.; Jia, W.; Wang, Z.H. Spatiotemporal variation in leaf size and shape in response to climate. J. Plant Ecol. 2020, 13, 87–96. [Google Scholar] [CrossRef]
  37. Nicotra, A.B.; Leigh, A.; Boyce, C.K.; Jones, C.S.; Niklas, K.J.; Royer, D.L.; Tsukaya, H. The evolution and functional significance of leaf shape in the angiosperms. Funct. Plant Biol. 2011, 38, 535–552. [Google Scholar] [CrossRef] [Green Version]
  38. Royer, D.L.; McElwain, J.C.; Adams, J.M.; Wilf, P. Sensitivity of leaf size and shape to climate within Acer rubrum and Quercus kelloggii. New Phytol. 2008, 179, 808–817. [Google Scholar] [CrossRef]
  39. Huang, W.J.; Li, Z.J.; Yang, Z.P.; Bai, G.Z. The structural traits of Populus euphratica heteromorphic leaves and their correlations. Acta Ecol. Sin. 2010, 30, 4636–4642. [Google Scholar]
  40. Zhao, Y.P.; Fan, G.Y.; Yin, P.P.; Sun, S.; Li, N.; Hong, X.N.; Hu, G.; Zhang, H.; Zhang, F.M.; Han, J.D.; et al. Resequencing 545 ginkgo genomes across the world reveals the evolutionary history of the living fossil. Nat. Commun. 2019, 10, 1–10. [Google Scholar] [CrossRef] [Green Version]
  41. Matesanz, S.; Gianoli, E.; Valladares, F. Global change and the evolution of phenotypic plasticity in plants. Ann. N. Y. Acad. Sci. 2010, 1206, 35–55. [Google Scholar] [CrossRef]
  42. Kuhn, B.M.; Geisler, M.; Bigler, L.; Ringli, C. Flavonols accumulate asymmetrically and affect auxin transport in Arabidopsis. Plant Physiol. 2011, 156, 585–595. [Google Scholar] [CrossRef] [Green Version]
  43. Guo, Y.; Gao, C.Y.; Wang, M.K.; Fu, F.F.; EI-Kassaby, Y.A.; Wang, T.L.; Wang, G.B. Metabolome and transcriptome analyses reveal flavonoids biosynthesis differences in Ginkgo biloba associated with environmental conditions. Ind. Crops Prod. 2020, 158, 112963. [Google Scholar] [CrossRef]
  44. Brunetti, C.; Di Ferdinando, M.; Fini, A.; Pollastri, S.; Tattini, M. Flavonoids as antioxidants and developmental regulators: Relative significance in plants and humans. Int. J. Mol. Sci. 2013, 14, 3540–3555. [Google Scholar] [CrossRef] [PubMed] [Green Version]
  45. Liao, Q.G.; Du, R.; Gou, J.B.; Guo, L.J.; Shen, H.; Liu, H.L.; Nguyen, J.K.; Ming, R.; Yin, T.M.; Huang, S.W. The genomic architecture of the sex-determining region and sex-related metabolic variation in Ginkgo biloba. Plant J. 2020, 104, 1399–1409. [Google Scholar] [CrossRef]
  46. Shelton, A.L. Variable chemical defences in plants and their effects on herbivore behaviour. Evol. Ecol. Res. 2000, 2, 231–249. [Google Scholar]
  47. Yang, L.; Wen, K.S.; Ruan, X.; Zhao, Y.X.; Wei, F.; Wang, Q. Response of plant secondary metabolites to environmental factors. Molecules 2018, 23, 762. [Google Scholar] [CrossRef] [PubMed] [Green Version]
  48. Zhao, B.B.; Wang, L.; Pang, S.Y.; Jia, Z.C.; Wang, L.; Li, W.X.; Jin, B. UV-B promotes flavonoid synthesis in Ginkgo biloba leaves. Ind. Crops Prod. 2020, 151, 112483. [Google Scholar] [CrossRef]
  49. Liu, C.G.; Zhou, X.Q.; Chen, D.G.; Li, L.J.; Li, J.C.; Chen, T.D. Natural variation of leaf thickness and its association to yield traits in indica rice. J. Integr. Agr. 2014, 13, 316–325. [Google Scholar] [CrossRef] [Green Version]
  50. Hu, D.; He, S.; Sun, G.; Jia, Y.; Sun, Y.; Ma, W.; Dev, W.; Nazir, M.F.; Geng, X.; Wang, L.; et al. Integrating Genome-wide association and whole transcriptome analysis to reveal genetic control of leaf traits in Gossypium arboreum L. Genomics 2022, 114, 110331. [Google Scholar] [CrossRef] [PubMed]
  51. Wisniewska, J.; Xu, J.; Seifertová, D.; Brewer, P.B.; Ruzicka, K.; Blilou, I.; Rouquie, D.; Benkova, E.; Scheres, B.; Friml, J. Polar PIN localization directs auxin flow in plants. Science 2006, 312, 883. [Google Scholar] [CrossRef] [Green Version]
  52. Drost, D.R.; Puranik, S.; Novaes, E.; Novaes, C.R.D.B.; Dervinis, C.; Gailing, O.; Kirst, M. Genetical genomics of Populus leaf shape variation. BMC Plant Biol. 2015, 15, 166. [Google Scholar] [CrossRef] [PubMed]
Figure 1. The distribution of Ginkgo biloba populations.
Forests 13 01764 g001
Figure 2. A schematic diagram of the leaf length (LL), leaf width (LW), petiole length (PL) and leaf base angle (LBA).
Forests 13 01764 g002
Figure 3. Significant correlations between LT and longitude (A), LT and altitude (B), LT and frost-free period (C) and LWR and altitude (D) p < 0.05).
Forests 13 01764 g003
Figure 4. A physical map of SNPs (red) and genes (black) related to leaf traits.
Forests 13 01764 g004
Figure 5. A GO analysis of the 112 genes.
Forests 13 01764 g005
Figure 6. Results of a KEGG analysis of the associated genes.
Forests 13 01764 g006
Table 1. Information on the ancient populations in this study.
Population CodeLocationLongitude (° E)Latitude (° N)Altitude (m)Frost-Free Period (Day)Annual Rainfall (mm)N1N2
PXPanxian, Guizhou104.525.5161927113903215
DYDuyun, Guizhou107.426.4105429914311010
FGFenggang, Guizhou107.827.8105326512001414
WCWuchuan, Guizhou108.128.699428012722314
LCLingchuan, Guangxi110.625.332331819262814
MCMochuan, Guangxi110.825.53252931842290
JSJingshan, Hubei113.131.323823010853115
SZSuizhou, Hubei113.331.42352309683015
ALAnlu, Hubei113.331.41202461100330
TMMt. Tianmu, Zhejiang119.430.34812349563414
CXChangxing, Zhejiang119.831.0′642401309310
ZJZhuji, Zhejiang120.128.816623613742615
Total 321126
Population codes were based on the abbreviations of their locations, N1: number of ancient trees for the morphometric analysis, N2: number of ancient trees for the genetic study.
Table 2. The differences in leaf traits among the 12 ancient populations. The leaf traits in this study include fresh weight (FW), dry weight (DW), leaf length (LL), leaf width (LW), leaf thickness (LT), leaf area (LA), petiole length (PL), leaf base angle (LBA) and length:width ratio (LWR).
FW **/gDW **/gLL **/cmLW **/cmLT **/mmLA **/cm2PL **/cmLBA **/°LWR **
PX0.87 ± 0.18 cb/BA0.34 ± 0.09 b/A4.70 ± 0.52 cb/CB7.86 ± 0.81 dcb/CB0.35 ± 0.00 b/B23.68 ± 4.76 c/CB3.82 ± 0.64 dc/DCB162.92 ± 18.50 ba/CBA0.60 ± 0.03 ed/ED
DY0.47 ± 0.14 g/E0.16 ± 0.05 e/D3.90 ± 0.38 e/D6.70 ± 0.59 g/F0.29 ± 0.00 e/E17.42 ± 3.70 e/E3.99 ± 0.55 bc/BC148.74 ± 11.10 bc/BCD0.58 ± 0.03 e/E
FG0.67 ± 0.09 ef/CD0.21 ± 0.03 d/CD4.38 ± 0.38 cd/BC7.10 ± 0.37 efg/DEF0.33 ± 0.00 bcd/BCDE22.38 ± 1.92 cd/CD4.35 ± 0.80 ab/AB149.23 ± 15.50 bc/BCD0.62 ± 0.06 cd/CDE
WC0.57 ± 0.17 fg/DE0.20 ± 0.06 de/CD4.23 ± 0.66 de/CD6.85 ± 1.05 g/EF0.30 ± 0.00 cde/CDE18.53 ± 5.73 e/EF3.39 ± 0.70 de/D160.73 ± 19.08 ab/ABCD0.62 ± 0.03 cd/CDE
LC0.76 ± 0.21 cde/BC0.28 ± 0.08 c/B4.68 ± 0.64 bc/BC7.65 ± 1.02 cd/BCD0.31 ± 0.00 de/DE23.37 ± 5.76 cB/CD4.04 ± 0.58 bc/ABC166.11 ± 23.40 a/AB0.61 ± 0.03 cde/DE
MC0.99 ± 0.21 a/A0.37 ± 0.07 ab/A5.40 ± 0.75 a/A8.14 ± 0.67 bc/AB0.39 ± 0.00 a/A26.69 ± 4.49 b/B3.62 ± 0.74 cde/CD149.91 ± 28.63 bc/BCD0.67 ± 0.08 a/AB
JS0.76 ± 0.21 cde/BC0.27 ± 0.07 c/B4.69 ± 0.53 bc/BC7.43 ± 0.86 def/CDE0.33 ± 0.00 bc/BCD22.20 ± 4.94 cd/CDE3.84 ± 0.72 c/BCD161.12 ± 29.12 ab/ABCD0.63 ± 0.06 bc/BCD
SZ0.88 ± 0.21 bc/AB0.36 ± 0.08 ab/A5.58 ± 0.86 a/A8.21 ± 0.98 ab/AB0.40 ± 0.01 a/A26.59 ± 5.46 b/B3.38 ± 0.90 e/D143.04 ± 21.78 c/D0.68 ± 0.08 a/A
AL0.76 ± 0.15 cde/BC0.26 ± 0.05 c/BC4.78 ± 0.44 b/B7.58 ± 0.7 de/BCD0.39 ± 0.00 a/A23.06 ± 3.59 c/BCD3.69 ± 0.46 cde/CD162.24 ± 17.09 ab/ABC0.63 ± 0.05 bc/BCD
TM0.86 ± 0.19 bcd/AB0.34 ± 0.11 b/A4.62 ± 0.48 bc/BC7.00 ± 0.50 fg/DEF0.34 ± 0.00 b/BC19.50 ± 2.99 de/DEF3.97 ± 0.61 bc/BC145.82 ± 22.05 c/CD0.66 ± 0.04 ab/ABC
CX0.75 ± 0.20 de/BC0.25 ± 0.07 c/BC4.73 ± 0.61 bc/BC7.57 ± 0.96 de/BCD0.39 ± 0.00 a/A21.97 ± 4.52 cd/CDE3.82 ± 0.64 cd/BCD150.57 ± 17.5 bc/BCD0.63 ± 0.04 cd/BCD
ZJ0.93 ± 0.13 ab/A0.39 ± 0.07 a/A5.37 ± 0.54 a/A8.66 ± 0.87 a/A0.40 ± 0.00 a/A31.03 ± 5.36 a/A4.56 ± 0.66 a/A172.93 ± 17.86 a/A0.62 ± 0.03 cd/CDE
Mean0.770.294.767.560.3523.033.87156.110.63
CV%18.6024.849.887.4810.9015.718.565.734.27
CV: Coefficient of variation, **: Extremely significant (p < 0.01), Populations containing any of same lowercase/uppercase letters within the same column represent no significant differences between them at p < 0.05/0.01, Leaf traits are shown as mean ± standard deviation.
Table 3. The coefficients of variation (CV) within the G. biloba populations. The leaf traits in this study include fresh weight (FW), dry weight (DW), leaf length (LL), leaf width (LW), leaf thickness (LT), leaf area (LA), petiole length (PL), leaf base angle (LBA) and length:width ratio (LWR).
FWDWLLLWLTLAPLLBALWRMean
PX20.1527.3911.1510.365.8320.1016.6511.354.4514.16
DY29.5430.889.768.7611.5821.2513.897.475.5915.41
FG13.0812.908.625.267.758.5718.4010.399.9110.54
WC30.3929.7415.6815.3012.1630.9420.7011.874.8519.07
LC27.0128.7913.6513.379.0624.6514.3414.094.5616.61
MC21.3518.8113.968.269.0016.8320.4319.1012.2315.55
JS27.6126.5811.2411.579.1822.2418.8418.079.1717.17
SZ24.4922.2115.3511.9313.4020.5526.6715.2311.1317.88
AL19.5820.309.169.2412.3215.5612.4810.537.9913.02
TM21.7130.5910.427.186.3815.3415.4415.126.7014.32
CX27.1527.0312.8512.659.9220.5816.8711.625.8016.05
ZJ13.4917.899.999.999.3017.2714.5110.334.0711.87
Mean22.9624.4311.8210.329.6619.4917.4312.937.20
Table 4. The clean data, mapping rate, and Q20, Q30 and SNP calling rates of the nine populations.
Clean DataMapping Rate%Q20Q30SNP Calling Rate%
PX2.68 ± 0.5899.78 ± 0.0195.49 ± 0.5288.88 ± 1.1599.37 ± 0.01
DY2.58 ± 0.4899.67 ± 0.1395.23 ± 0.7388.27 ± 1.6499.36 ± 0.01
FG2.49 ± 0.5199.62 ± 0.0694.97 ± 0.4387.87 ± 0.9299.28 ± 0.01
WC2.81 ± 0.4899.71 ± 0.0595.51 ± 0.6588.89 ± 1.4599.26 ± 0.01
LC2.73 ± 0.7699.63 ± 0.1695.73 ± 0.4289.39 ± 199.23 ± 0.01
JS2.42 ± 0.4199.67 ± 0.0795.75 ± 0.3589.39 ± 0.8299.28 ± 0.01
SZ2.79 ± 0.4799.74 ± 0.0496.02 ± 0.2590 ± 0.6599.33 ± 0.01
TM2.8 ± 0.3899.73 ± 0.0795.67 ± 0.5689.19 ± 1.2899.26 ± 0.01
ZJ2.28 ± 0.3199.73 ± 0.0795.13 ± 0.5488.14 ± 1.1799.38 ± 0.00
Mean2.6299.7095.5188.9299.31
Publisher’s Note: MDPI stays neutral with regard to jurisdictional claims in published maps and institutional affiliations.