Article

Changes in Chemical Properties and Fungal Communities of Mineral Soil after Clear-Cutting and Reforestation of Scots Pine (Pinus sylvestris L.) Sites

by
Aistė Povilaitienė
1,
Artūras Gedminas
1,
Iveta Varnagirytė-Kabašinskienė
1,*,
Diana Marčiulynienė
1,
Adas Marčiulynas
1,
Jūratė Lynikienė
1,
Valeriia Mishcherikova
1 and
Audrius Menkis
2
1
Lithuanian Research Centre for Agriculture and Forestry, Institute of Forestry, Liepų Str. 1, Girionys, LT-53101 Kaunas District, Lithuania
2
Uppsala BioCenter, Department of Forest Mycology and Plant Pathology, Swedish University of Agricultural Sciences, P.O. Box 7026, SE-75007 Uppsala, Sweden
*
Author to whom correspondence should be addressed.
Forests 2022, 13(11), 1780; https://doi.org/10.3390/f13111780
Submission received: 9 September 2022 / Revised: 20 October 2022 / Accepted: 26 October 2022 / Published: 27 October 2022
(This article belongs to the Section Forest Ecology and Management)

Abstract

:
This study aimed to assess the changes in chemical properties and fungal communities in the upper mineral soil layer in managed Scots pine (Pinus sylvestris L.) ecosystems. Study sites were located in the three largest P. sylvestris massifs in Lithuania, and six sampling sites, representing different development stages of the P. sylvestris forest ecosystem, were selected in each of them: mature P. sylvestris forest stands; clear-cuts of former P. sylvestris mature stand; and the P. sylvestris plantations aging from the 1st to 4th year. High-throughput sequencing was performed to evaluate the soil fungus community at clear-cuts, early-stage reforested sites, and mature forests in Lithuania. This study has shown that, among other chemical soil parameters, the mean concentrations of mineral nitrogen (N), total phosphorus (P), and P2O5 were slightly higher in the clear-cut sites, and significantly higher in the 1st year plantations compared to the mature forests. The quality filtering after PacBio sequencing showed the presence of 60,898 high-quality fungal sequences, and 1143 fungal operational taxonomic units (OTUs). The most abundant fungal OTU in our study was Archaeorhizomyces sp. 5425_1. In total, 70 mycorrhizal fungal OTUs were found in the soil samples at the studied sites. The most abundant ectomycorrhizal fungus identified was Amanita fulva (Schaeff.) Fr. The highest amount of ectomycorrhizal fungal OTUs was found in the clear-cut sites and in the mature forests. The concentrations of mineral N and P2O5 in the upper mineral soil layer did not significantly affect fungal OTUs diversity. Conversely, a relatively strong correlation was obtained between the number of mycorrhizal fungal OTUs and the concentrations of total N and soil organic carbon (SOC), as well as between the numbers of saprotrophic fungal OTUs and the concentration of magnesium ions (Mg2+).

1. Introduction

Major parts of the world’s forests are managed to achieve different goals, combining the controversial challenges of producing higher amounts of timber and simultaneously conserving biodiversity [1]. Intensive forest management often leads to drastic changes in forest ecosystems such as loss of habitats and biodiversity [2,3,4,5]. Temperate and boreal forests are increasingly affected by anthropogenic disturbances when forest biomass is harvested at various intensities. Clear-cutting is a common forest management practice to achieve maximum efficient harvesting, but it results in severe abiotic and biotic changes in the ecosystem during the reforestation stages [6,7]. Reforestation of clear-cut sites with suitable tree species is a priority for sustainable forest management, but it is also essential to maintain the stability of other live components of ecosystems during forest harvesting and reforestation stages. The forest ecosystem components, related by common habitats, and trophic, symbiotic, and mutualistic relationships, are important for the maintenance of sustainable forest ecosystems [8,9,10,11].
Intensive harvesting of forest biomass promotes changes in chemical properties of forest soil and soil mycobiota, including mycorrhizal fungi, which are important for seedling growth [12,13,14,15,16]. The removal of forest biomass reduces the soil organic matter and carbon stocks. Relatively high removals of forest biomass could lead to nutrient loss, which could potentially affect soil biodiversity and reduce site productivity in the long term. Soil organic matter, providing nutrients for soil biota and plants, maintains the ability to retain soil water and air, and, therefore, it is one of the essential conditions for tree growth [17].
Mycorrhizal fungi are obligate symbionts with forest tree species, where they scavenge soil nutrients and water from the soil in exchange for photosynthate from the tree [18]. Without their fungal symbionts, the trees cannot acquire enough nutrients, and fungi have insufficient energy to carry out their life cycle without the trees. Intensive forest harvesting alters the changes in ECM fungal communities by changing the age structure and species composition of the forest trees and other plants serving as hosts.
In recent decades, numerous studies on the abundance and diversity of soil fungi and their interrelationship with plants have been conducted [19,20,21,22]. Forest soil properties, vegetation and tree species, cover, human activities, and forest management regimes affect all fungal communities. All ecophysiological groups of soil fungi, saprotrophs, symbionts, and pathogens are involved in decomposition and mineralization processes [23,24]. Ectomycorrhizal (ECM) fungi are particularly sensitive to forest harvesting [25,26] because they depend on the carbon released from tree hosts [27,28]. Intensive forest management, shortly disturbing the balance of the ecosystem, affects both the abundance and species composition of mycorrhizal fungi. Therefore, the observed changes in the structure and species composition of the mycorrhizal community may be one of the indicators caused by the impact of clear-cutting on the forest ecosystem [29].
In Lithuania, the composition of fungal communities in forest soil and the impact of forest management regimes, including clear-cutting, on soil mycobiota have not been studied extensively. Among other stands, Pinus sylvestris L. stands are economically valuable and cover 34.5% of the total forest area in Lithuania [30]. Due to its widespread distribution globally and regionally, P. sylvestris is considered a suitable species for reforestation and afforestation in the European region [31].
Recently, the differences in soil fungal communities in managed and unmanaged forests have been studied in other countries, such as Germany [32,33,34] and France [35]. In Poland, the comparative studies were mainly conducted on the abundance and diversity of soil mycobiota in the forest after the applications of different harvesting of woody debris and pre-planting soil preparations [36,37]. The influence of different forest litter types on tree growth and ectomycorrhizal formation of P. sylvestris seedlings were reported in Lithuania [38,39].
The aim of this study was to evaluate the changes of chemical properties and fungal communities in the upper mineral soil layer in the managed Scots pine (Pinus sylvestris L.) ecosystems, including mature forest stands, clear-cuts, and 1st, 2nd, 3rd, and 4th-year plantations. We hypothesized that changes in forest soil chemical parameters could have an impact on soil fungal communities obtained in different study sites.
This study was performed in a frame of the Lithuanian National Program (2020–2022), which was initiated based on intense debates among citizens and governmental and non-governmental organizations opposing forest management activities that may have a negative impact on biodiversity. Annually, an average of 11,968 ha of the State P. sylvestris forests in Lithuania are affected by forest management activities, including clear-cutting and other final felling for timber production.
Molecular methods based on PCR and ribosomal DNA sequencing have been successfully used to identify fungi at different taxonomic levels in different environmental samples and helped to elucidate the ecological conditions affecting the structure and diversity of fungal communities [31,40,41,42,43,44]. To assess fungal communities in forest soil we used one of the molecular methods—high-throughput sequencing (HTS). In our study, PCR products were sequenced using a PacBio RSII platform and one SMRT cell at a SciLifeLab facility in Uppsala, Sweden. This third-generation high-throughput sequencing PacBio platform produces long reads averaging 20–25 kilobases (up to 100 kilobases). The DNA template is circularized via hairpin adaptors and recorded multiple times to offer read qualities comparable to that of traditional Sanger sequencing. The new Sequel instrument generates ~400,000 reads per SMRT cell (3.2 million reads per run), which is much fewer reads than produced by Illumina platforms, but it produces high-quality sequences of amplicons or DNA fragments of ~3 kilobases in length. This makes the platform ideal for sequencing short-to-medium length amplicons such as the full ITS region and perhaps its flanking conserved genes for precise phylogenetic placement [45]. This technology provides powerful tools to explore fungal diversity and enable identification of complex fungal communities and individual community components even at low abundances.

2. Materials and Methods

2.1. Study Sites

Study sites were in 3 different regions of Lithuania, representing the nearby locations of Alytus, Labanoras, and Varėna (Figure 1). At each location, the study sites were selected based on the forest inventory data from the Lithuanian State Forest Cadastre database. For the evaluation of the dynamic changes of chemical soil properties and fungal communities after the clear-cuttings, the study sites were selected at each region in six sampling sites representing different stages of the P. sylvestris forest ecosystem: (1) mature P. sylvestris forest stands; (2) clear-cuts of P. sylvestris (felled in 2019); (3) 1st year P. sylvestris plantations (planted in 2018); (4) 2nd year P. sylvestris plantations (planted in 2017); (5) 3rd year P. sylvestris plantations (planted in 2016); and (6) 4th year P. sylvestris plantations (planted in 2015). In total, 18 sampling sites were selected in May 2020 (Table 1). The study sites were selected in the clear-cuts and P. sylvestris plantations of different ages established after final clear-cutting of mature forest (130 years old; average tree height was 26.6–31.5 m; average tree diameter at breast height (DBH) was 37 cm). All sampling sites were described as the sites with comparable soil and climatic conditions. During the sampling period in May–September 2020, the mean air temperature was 15.8 °C, and the mean precipitation was 64 mm (data obtained from the Lithuanian Hydrometeorological Service).
For the selection of three study sites, the following criteria were used: the pure P. sylvestris stands growing on typical forest site type prior to clear-cutting, and the adjacent sites, reforested by P. sylvestris, representing the annual ecosystem stages; comparable forest soil and forest vegetation type [46]. All selected study sites were characterized by the Pinetum vacciniosa and P. vaccinio-myrtilliosa forest type; the oligotrophic mineral soil of a normal moisture regime (Nbl) [47]; and nutrient-poor sandy Arenosols with a light soil texture [48]. The mean tree diameter and mean height were available for mature forest sites (Table 1). The species composition of ground vegetation was similar in all studied sites with the dominant herbs and dwarf shrubs such as Vaccinium myrtillus L. and Vaccinium vitis-idaea L. and dominant mosses such as Hylocium splendens (Hedw.) Schimp., Pleurozium schreberi (Brid.) Mitt., and Ptilium crista-castrensis (Hedw.) De Not.

2.2. Soil Sampling and Chemical Analyses

The soil sampling was performed according to the ICP-Forests methodology [49]. For the determination of basic soil properties, soil was sampled from the upper (0–20 cm) mineral soil layer, composing three samples from five subsamples per each sampling site at each study region. Soil samples were taken at 1 m from tree stems or stumps, maintaining the same distance at all study sites. In total, 54 soil samples were taken in the field. In each sampling site, the points for soil sampling were allocated systematically in two diagonals. The soil samples were individually placed into the plastic bags, labelled, and transported to the laboratory. The following chemical parameters were analysed: pH was determined in a 0.01 M CaCl2 suspension (ISO 10390:2005), organic carbon (C) was determined using a dry combustion method with a total carbon analyzer Analytic Jena multi EA 4000 Germany (ISO 10694:1995) with a Heraeus apparatus (ISO 10694, dry combustion at 900 °C), and total nitrogen (N) analyzed using the Kjeldahl method (ISO 11261). In addition, mineral N was determined in 1 M KCl extraction by the spectrometric method (ISO 14256-2); mobile potassium (K2O) and phosphorus (P2O5) were determined using a solution of ammonium lactate by the Égnér-Riehm-Domingo (A-L) method. The laboratory analyses were provided by the Agrochemical Research Laboratory of the Lithuanian Research Centre for Agriculture and Forestry (LAMMC).

2.3. Fungal Sampling

The fungal core samples were sampled next to the soil samples as additional samples. The core samples were taken to represent each of the selected study sites, i.e., the clear-cut, the 1st–4th years plantation, and the mature forest with the corresponding age of the trees. The effects of clear-cutting on forest soil mycobiota (saprotrophic, mycorrhizal, pathogenic, and endophytic fungi) in P. sylvestris ecosystems were assessed. The soil sampling for fungal identification was conducted in May–September 2020 in all sampling sites (Table 1). Five sample plots were randomly selected in each sample site. For the assessment of forest soil mycobiota, soil samples were collected in four replicates at each sample plot, obtaining one composite sample per plot. For fungal identification, the soil (ca. 100 g) was sampled using a 2 cm diameter soil core from the 5–20 cm mineral soil layer. Between different samples, the soil core was thoroughly cleaned with ethanol. The soil samples were individually placed into the plastic bags, labelled, transported to the laboratory, and stored at −20 °C. In total, 90 soil samples were collected.

2.4. Fungal DNA Isolation, Amplification, and Sequencing

The standard CTAB (cetyltrimethylammonium bromide) method was used to isolate genomic DNA from living tissue [50]. Prior to the DNA isolation, each soil sample was freeze-dried at −60 °C for 48 h. After the freeze-drying, ca. 20–30 mg of soil was used for the DNA isolation from each sample using a NucleoSpin®Soil kit (Macherey-Nagel GmbH & Co., Duren, Germany), according to the manufacturer’s recommendations. Following the DNA isolation, the DNA concentration in the individual samples was determined using a NanoDrop™ One spectrophotometer (Thermo Scientific, Rodchester, NY, USA). The amplification of the internal transcribed spacer (ITS) rRNA region was achieved using a forward primer gITS7 (5′-GTGARTCATCGARTCTTTG-3′) [51] and a barcoded universal primer ITS4 (5′-TCCTCCGCTTATTGATATGC-3′) [52].
The polymerase chain reaction (PCR) was performed in 50 µL reactions and consisted of the following final concentrations: 1% DreamTaq Green Polymerase (5 μ/μL) (Thermo Scientific, Waltham, MA, USA); 11% 10X Buffer; 11% dNTPs (10 mM); 1% MgCl2 (25 mM); 2% of each primer (200 nM); 72% sterile milli-Q water.
The amplifications were performed using an Applied Biosystems 2720 thermal cycler (Applied Biosystems, Foster City, CA, USA). The PCR program started with an initial denaturation step at 95 °C for 2 min, followed by 35 cycles of 95 °C for 30 s, and annealing at 55 °C for 30 s and 72 °C for 1 min, followed by a final extension step at 72 °C for 7 min. The PCR products were assessed using gel electrophoresis on 1.5% agarose gels stained with GelRed (Biotium, Fremont, CA, USA).
The PCR products were purified using 3 M sodium acetate (pH 5.2) (Applichem GmbH, Darmstadt, Germany) and 96% ethanol mixture (1:25). After the quantification of all PCR products using a Qubit fluorometer 4.0 (Life Technologies, Stockholm, Sweden), they were pooled in an equimolar mix and sequenced using a PacBio RSII platform and one SMRT cell at a SciLifeLab facility in Uppsala, Sweden.

2.5. Bioinformatics

Identification of fungal species was performed by molecular method—high-throughput sequencing (HTS). The sequences were filtered and clustered using the Sequence Clustering and Analysis of Tagged Amplicons (SCATA) next-generation sequencing (NGS) pipeline, available at http://scata.mykopat.slu.se. The sequences were filtered for quality, removing short sequences (<20), primer dimers, and homopolymers, which were collapsed to three base pairs (bp) before clustering. The sequences were screened for primers and sample-identifying barcodes, and sequences that were missing a barcode or primer were removed. The sequences were clustered into different taxa by single linkage clustering, with a 2.0% maximum distance allowed for the sequences to enter the clusters. The fungal taxa were taxonomically classified using a Ribosomal Database Project (RDP) pipeline classifier (https://pyro.cme.msu.edu/index.jsp, accessed on 8 October 2022). Fungal taxa were identified using GenBank (NCBI) database and the BLASTn algorithm. The criteria used for taxonomic identification were sequence coverage > 80%; similarity to species level 98%–100%; and similarity to genus level 94%–97%. Sequences not matching these criteria were considered as unidentified and were given unique names. Representative sequences of the fungal non-singletons are available from GenBank under accession numbers ON962810–ON963944.

2.6. Statistical Analyses

The soil chemical parameters were analyzed for differences in concentrations between the study sites: mature forest stands, clear-cuts, and 1st–4th year P. sylvestris plantations. For the normality of the variables, the Shapiro–Wilk test was used, and the normality hypothesis was rejected with a 0.05 significance level. Therefore, the Kruskal–Wallis analysis of variance (ANOVA) test was used to ascertain the significant differences in variables between the sites.
For the identification of the diversity and composition of the fungal communities, the Shannon diversity (H) index was evaluated [53]. The assignment of ecological roles was based on FUNGuild [54]. The rarefaction analysis was performed using Analytical Rarefaction v.1.3, available at http://www.uga.edu/strata/software/index.html (accessed on 20 February 2022). Rarefaction curves showing the relationship between the cumulative number of fungal operational taxonomic units (OTUs) and the number of ITS rDNA sequences were obtained from soil samples in different study sites.
To calculate and draw a Venn diagram, we used an online program (http://bioinformatics.psb.ugent.be/webtools/Venn/ (accessed on 25 August 2022). The differences in the relative abundance of fungal OTUs between study sites were tested using the Kruskal–Wallis test. Comparison of fungal composition was calculated using the Bray–Curtis similarity coefficient, which was used in the analysis of similarity to determine whether the fungal communities differed between study sites. Nonmetric multidimensional scaling (NMDS) was used to provide a visual summary of the pattern Bray–Curtis values. Relationships between soil chemical parameters and fungal variables were examined using the Pearson correlation and canonical correspondence analysis (CCA). Statistical analyses were performed using the statistical software package XLSTAT (Addinsoft, N.Y., USA) and open access software R version 4.0.5 (R Core team, Austria (http://www.R-project.org/) (accessed on 10 June 2021).

3. Results

3.1. Chemical Properties of Mineral Topsoil

The mean pHCaCl2 value was slightly lower in the mineral 0–20 cm topsoil layer at the clear-cut sites than in the mature P. sylvestris forest stands (Figure 2A). Although no clear trend was identified in the reforested sites after clear cuttings of the mature forest stands, the highest mean pH value (pHCaCl2 4.4 ± 0.2) was obtained in the 3rd year plantations. No significant differences were obtained for the mean concentrations of SOC and total N (Figure 2B,C), as well as K, Ca, and Mg (Table 2) across all studied sites. A statistically significantly higher mean concentration of mineral N was found in the 1st year plantations (Figure 2D).
The highest electrical conductivity (EC) was found in the 1st year plantation, but in other studied sites, the EC varied within a relatively narrow range from 2.3 ± 0.1 mS m–1 to 3.6 ± 0.5 mS m–1 (Table 2). A higher concentration of total P was found in the 1st year plantation, but in the 2nd, 3rd, and 4th year plantations, the total P concentration did not differ from the P concentration in the mature forest. The concentration of P2O5 in the mineral 0–20 cm topsoil layer was 1.5 times higher in the clear-cut, and 2.1 times higher in 1st year plantations than in the mature forest stands.
The highest concentration of Ca2+ was found in the 3rd year plantation. However, there were no statistically significant differences in the concentrations of K2O and Mg2+ across all studied sites (Table 2). Overall, the soil nutrient concentrations in the 4th year P. sylvestris plantations were comparable with those obtained in the mature forest stands.

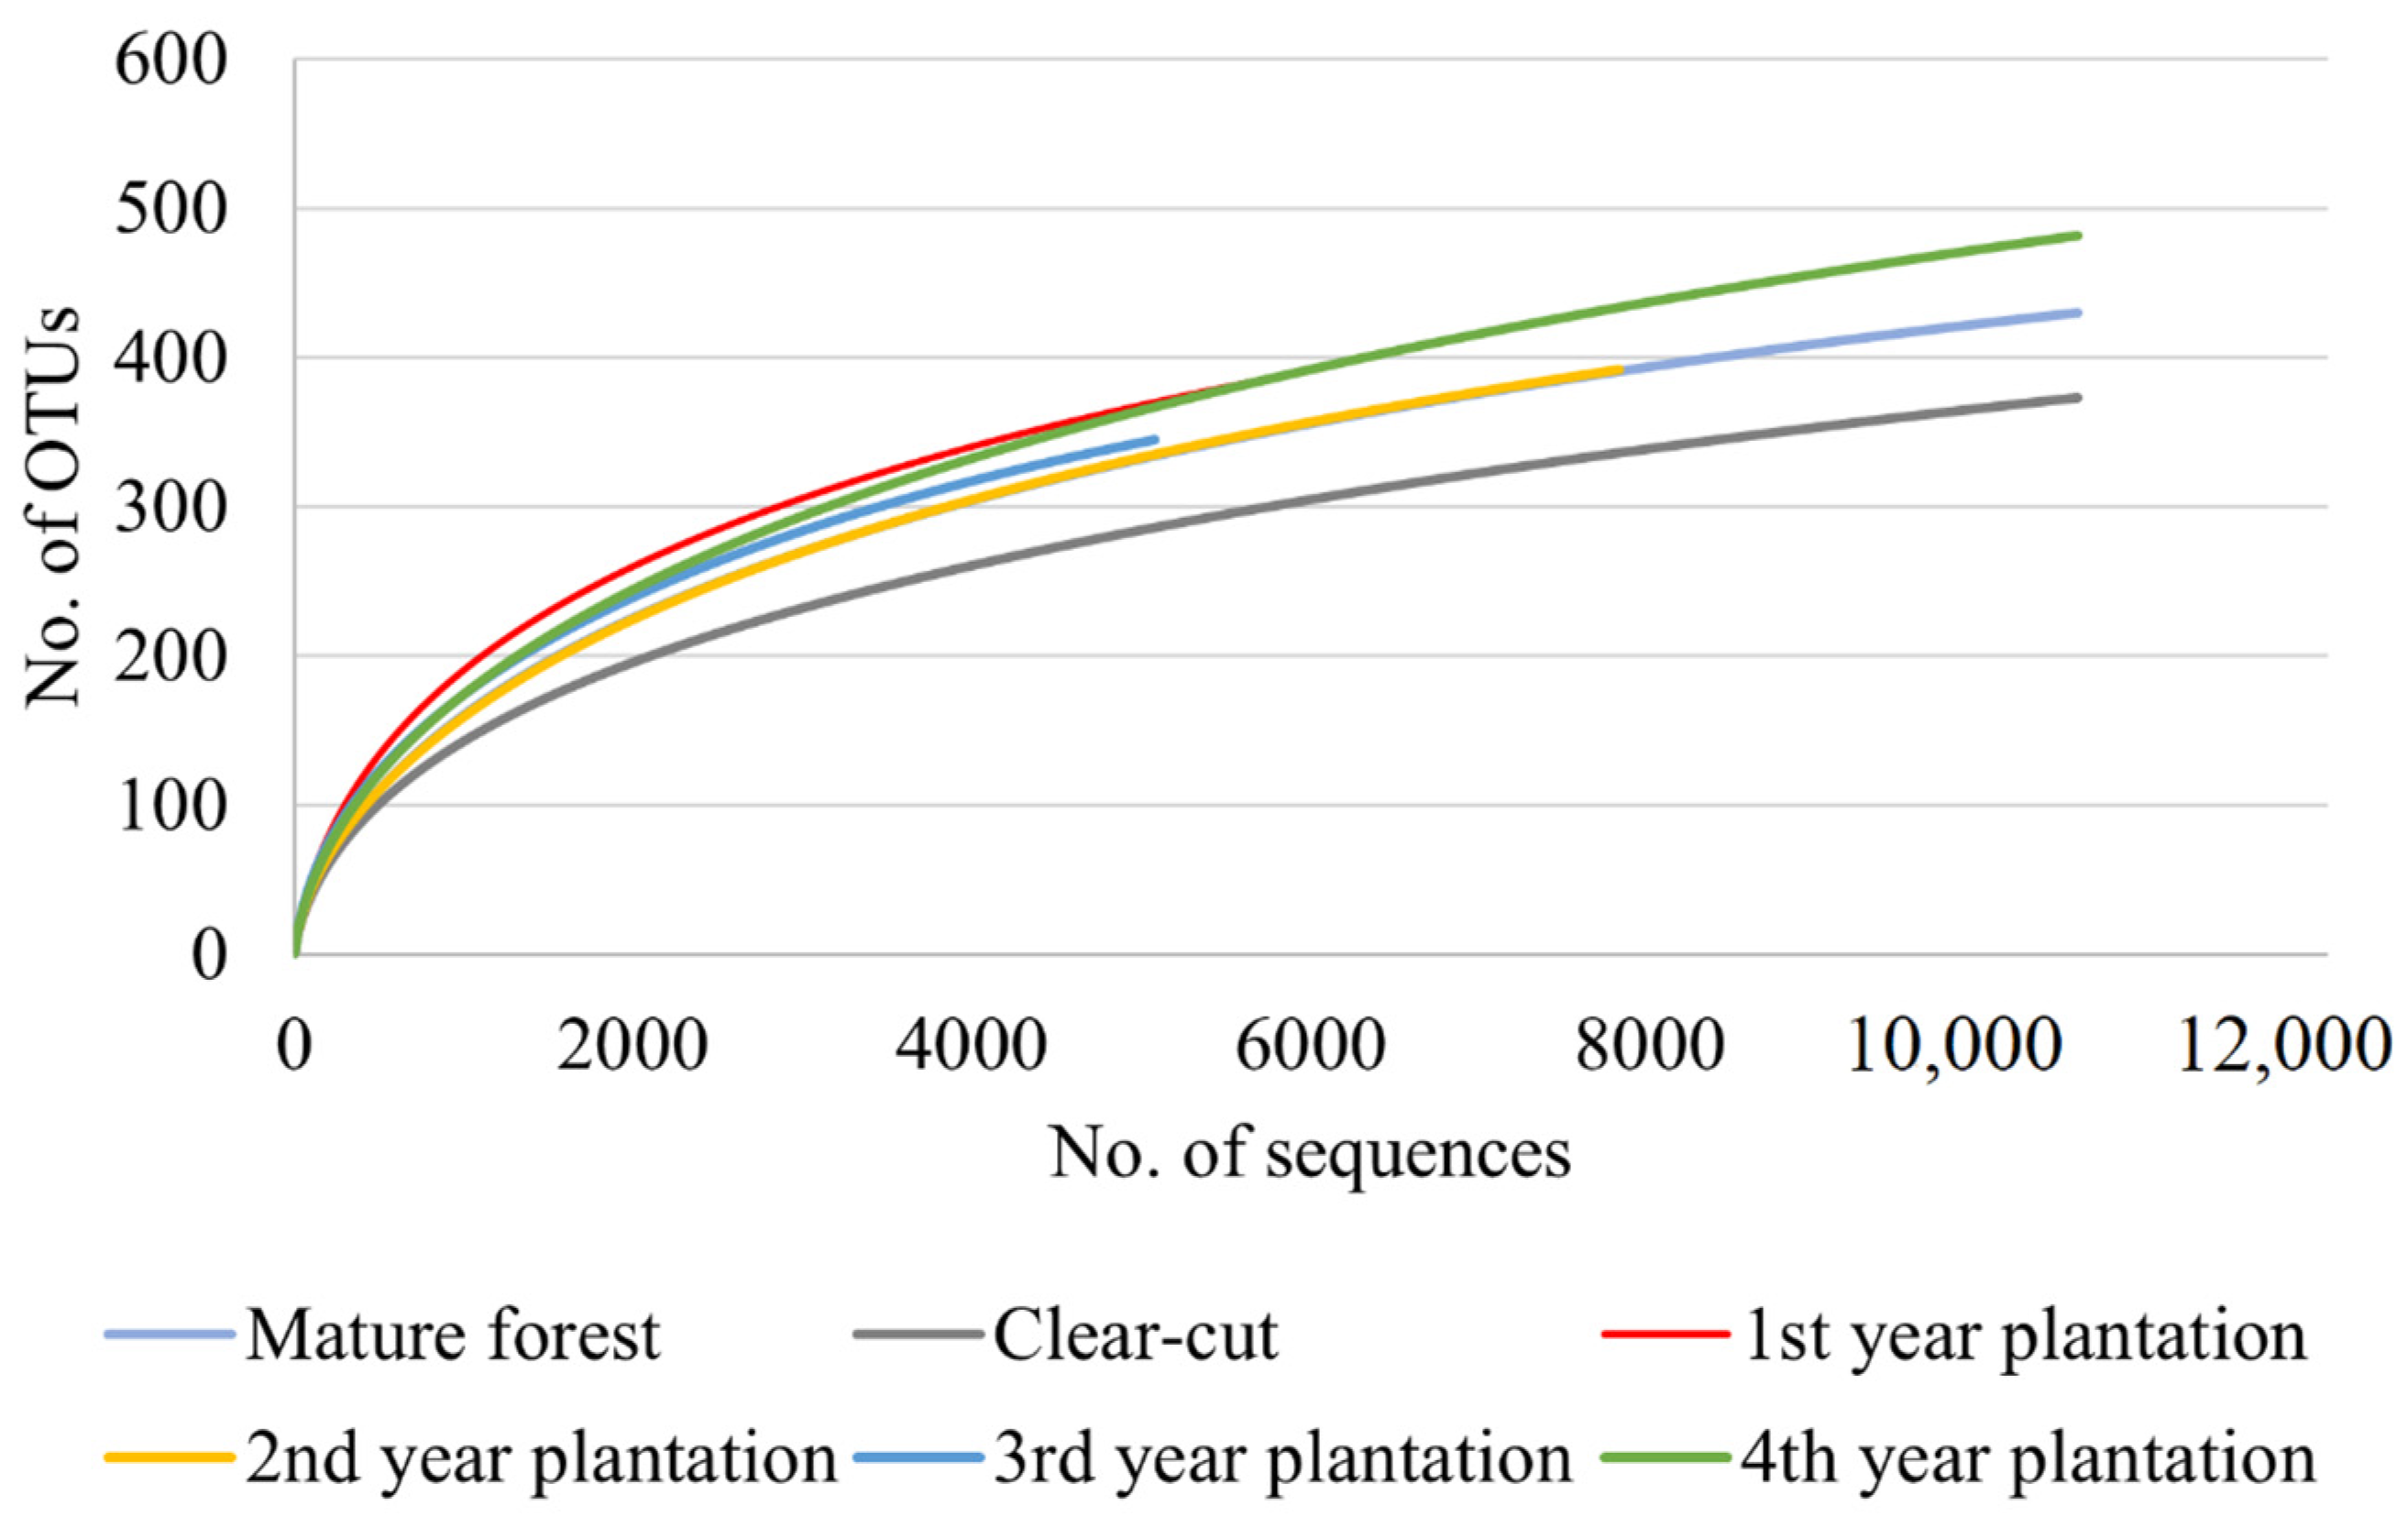
3.2. Fungal Community

The quality filtering after PacBio sequencing showed the presence of 60,898 high-quality fungal sequences representing 1143 fungal operational taxonomic units (OTUs) (Table 3 and Figure 3), and the non-fungal OTUs were excluded.
Among all the fungal OTUs, 352 OTUs (30.8%) were identified up to the species level, 161 OTUs (14.1%) up to the genus level, and 630 OTUs (55.1%) were identified only up to a higher taxonomic level. Of the 1143 fungal OTUs across all the soil samples, Ascomycota was the most dominant phylum, and accounted 26.4% of all the fungal OTUs, followed by Basidiomycota (23.3%), Mucoromycota (3.3%), Chytridiomycota (0.7%), and Zoopagomycota (0.1%).
The rarefaction analysis showed that the number of fungal OTUs did not reach species saturation (Figure 3), indicating that a potentially higher diversity of taxa could be detected by a deeper sequencing.
The non-metric multidimensional scaling shows that the fungal communities in the mature forest stands, clear-cuts, and the 1st–4th year P. sylvestris plantations did not differ significantly from each other (Figure 4).
The assignment of fungal ecological roles (trophic groups) is represented in Figure 5. The most common fungal OTUs in the soil samples were identified as of unknown ecological roles (59.8%–67.1%, representing all studied study sites), followed by saprotrophs (13.7%–19.8%), mycorrhizal fungi (2.6%–8.4%), pathogens (3.8%–7.4%), endophytes (3.0%–4.3%), and others (3.6%–5.2%).
Among all obtained fungal OTUs, 91 fungal OTUs (8.0%) were detected in all studied sites. The numbers of obtained unique and common fungal OTUs in between different sites are shown in the Venn diagrams (Figure 6 and Figure 7). The 161 common fungal OTUs were found in the mature forest stands, clear-cuts, and 4th year plantations. A similar number of unique fungal OTUs were found in the mature forest and in the clear-cut sites: 150 and 133 OTUs, respectively). In the 4th year plantations, the number of unique fungal OTUs increased significantly. The lowest number (45 OTUs) of shared fungal OTUs was found in the mature forest stands and the clear-cuts. A similar number of shared OTUs were found in the mature forest stands and the 4th year plantations, and in the clear-cuts and the 4th year plantations (74 and 76 OTUs, respectively) (Figure 6).
Among all fungal OTUs found in P. sylvestris plantations, 100 OTUs were exclusively found in the 1st year plantations, 120 OTUs in the 2nd year plantations, 77 OTUs in the 3rd year plantations, and 217 OTUs in the 4th year plantations. The highest number of OTUs was common for the 2nd year and the 4th year plantations. The lowest number of shared fungal OTUs was between the 2nd and 3rd year plantations, i.e., 17 OTUs. In total, 118 fungal OTUs were shared between all plantations (Figure 7).
The 30 most common fungal OTUs, representing 62.03% of all high-quality fungal sequences in the soil sampled from the different study sites, are given in Table 4.
The most abundant fungi in the studied sites were Archaeorhizomyces sp. 5425_1 (11.5% of all high-quality sequences), Helotiaceae sp. 5425_2 (6.8%), Unidentified sp. 5425_18 (5.2%), Oidiodendron chlamydosporicum Morrall (4.9%), Penicillium camemberti Thom (3.7%), and Cladosporium sp. 5425_16 (2.8%) (Table 4). Among the obtained most common fungal OTUs, five species represented ectomycorrhizal (ECM) fungi, which included Amanita fulva (Schaeff.) Fr. (2.1% of all high-quality sequences), Piloderma sphaerosporum (Peck) Julich (1.9%), Thelephora terrestris Ehrh. (1.5%), Russula decolorans Fr. (1.1%), Russula vinosa Lindblad (1.0%), and only one OTU represented the plant pathogen Collophora sp. 5425_14 (1.0%). The dominant endophytes in the studied fungal community were Mortierella sp. 5425_53 and Mortierella macrocystis W.Gams.
The non-metric multidimensional scaling of the mycorrhizal fungal communities showed a partial separation of the samples obtained from the different sites. The mycorrhizal fungal communities did not differ significantly among the mature forest stands and the 4th year plantations (p > 0.05). A fungal community between 1st year plantations and the clear-cut site differed significantly (p < 0.05) (Figure 8).
In total, 70 mycorrhizal fungal OTUs were found in the soil samples in the studied sites. The relative abundances of the thirty most common ectomycorrhizal (ECM) fungi are given in Table 5.
The most abundant ECM fungi were Amanita fulva (2.1% of all the high-quality sequences), Piloderma sphaerosporum (1.9%), Thelephora terrestris (1.5%), Russula decolorans (1.1%), Russula vinosa (1.0%), and Pseudotomentella sp. 5425_255 (0.6%) (Table 5).
Among all 70 mycorrhizal fungal OTUs, 9 OTUs were exclusively found in the soil of the mature forest stands, and 13 OTUs were found in the clear-cut sites. However, only three mycorrhizal fungal OTUs—Amanita fulva, Piloderma olivaceum (Parmasto) Hjortstam, and Elaphomyces granulatus Fr.—were identified as the common OTUs in the soil at the mature forest stands and the clear-cut sites. Among all mycorrhizal fungal OTUs, two OTUs were exclusively identified in the soil of the 1st and 3rd year plantations. No unique mycorrhizal fungal OTUs were identified in the 2nd year plantations. In total, 11 OTUs were exclusively found in the soil at the 4th year plantations. Across all 70 mycorrhizal fungal OTUs found in the soil, Basidiomycota was the most dominant phylum, accounting for 88.6%. The highest number of ectomycorrhizal fungal OTUs (30 OTUs) were found in the clear-cut sites, and 27 ECM fungal OTUs were found in the mature forest stands. The number of ECM fungal OTUs significantly decreased in 1st, 2nd, and 3rd year plantations (10, 7, and 8 OTUs, respectively), and their number significantly increased up to 24 OTUs in the 4th year P. sylvestris plantations.

3.3. Relations between Chemical Parameters and Fungal Community in the Mineral Topsoil

Relatively strong positive significant correlations were found between the number of mycorrhizal fungal OTUs and the concentrations of total N and SOC, as well as between the number of saprotrophic fungal OTUs and the Mg2+concentrations (Table 6).
The relations between the relative abundance of the 30 most common fungal OTUs and chemical soil parameters (pHCaCl2, SOC, total N, Mg2+, and Cl) in the study sites were evaluated using canonical correspondence analysis (CCA) (Figure 9). The relative abundance of fungi Archaeorhizomyces sp. 5425_1 and Malassezia sp. 5425_17 significantly correlated with the SOC concentration. Relative abundance of fungus Glonium pusillum H.Zoog correlated with the soil pH value. The relative abundance of fungi Penicillium camemberti, Helotiaceaea sp. 5425_2, and Mortierella sp. 5425_53 significantly correlated with the Mg2+ concentration (Figure 9).

4. Discussion

The current study showed significantly higher concentrations of mineral N, P2O5, and K2O in the mineral 0–20 cm soil layer of the 1st and 2nd year P. sylvestris plantations, established on clear-cut sites. The obtained values were from 7% for K2O, to 2.1 times higher than in the adjacent mature forest stands. In the period between 1 and 3 years after clear-cutting of mature pine forest, changes in mineral N concentrations have been observed in the previous studies [55,56,57]. Several studies have shown that nitrate leaching was observed to be particularly intense in the clear-cut sites, and higher concentrations of phosphates, potassium, and SOC were often obtained [56,58,59,60]. In the mineral soils of clear-cut sites, more intensive nitrification processes are recorded due to the changes in the site temperature and humidity, which causes the decomposition of the forest floor, the mineralization and decrease of organic matter content, as well changes in the mechanisms of plant competition for nutrients [57,61,62,63,64]. The abovementioned processes intensify the leaching of N compounds, especially nitrates, into the deeper soil layers. Therefore, a rapid increase in the concentrations of mineral N forms (NO3-N; NO2-N, and NH4-N) may impair the recovery and development of the ground vegetation [65]. However, the growth of young P. sylvestris at the early stages of stand development is unlikely to be significantly affected. However, other studies indicated the opposite results, showing that the concentrations of mobile P2O5 and K2O in the 0–10 cm layer of mineral soils of clear-cuts were lower than in the stand [65].
The SOC concentrations depend on the balance between carbon input with plant litter and carbon loss due to the mineralization of soil organic matter [66,67]. Due to the more intensive mineralization of soil organic matter, clear-cutting has been found to enhance SOC fluxes, including the leaching of total and labile SOC [68,69,70,71,72]. Although in the clear-cut sites more intensive mineralization and an increase in SOC in the upper mineral soil layer could be expected, the current study did not reveal such a trend.
One of the most important indicators is the C: N ratio, which directly determines the decomposition and transformation of soil organic matter [73]. This study analyzed the C: N ratio for determining soil quality and microbiological activity, but no clear differences were found between the C: N values in the mature forest, clear-cut, and reforested sites. As reported by Siebers et al. [74], more significant changes in the C: N ratios in the upper mineral soil layer after clear-cutting of the mature forest are often recorded after 24 months, indicating the relatively slow decomposition of forest litter and felling residues, followed by the gradual migration of elements into deeper soil layers.
Changes in chemical soil parameters certainly affect the diversity and abundance of soil mycobiota. The removal of the main source of plant biomass C and the concomitant physical and chemical changes in the soil leads to a change in the composition of fungal communities towards species that can more easily spread, establish, or survive under new conditions [25,29,75]. For example, ectomycorrhizal (ECM) fungi may induce N limitation of free-living microbial decomposers, and this competition between ECM fungi and free-living decomposers for N can slow soil C cycling and increase soil C storage [76,77].
In the current study, the higher concentrations of measured chemical soil parameters, such as mineral N, P2O5, and K2O in the upper mineral 0–20 cm soil layer in the plantations did not cause significant changes in fungal operational taxonomic units (OTUs) diversity. A relatively strong correlation was found between the number of mycorrhizal fungal OTUs and the concentrations of total N and SOC, as well as between the number of saprotrophic fungal OTUs and the Mg2+ concentrations. Some relations were evaluated between separate fungal OTUs and chemical soil parameters. The relative abundance of fungi Archaeorhizomyces sp. 5425_1 and Malassezia sp. 5425_17 significantly correlated with the SOC concentration. The relative abundance of fungus Glonium pusillum correlated with the soil pH value. The relative abundances of fungi Penicillium camemberti, Helotiaceaea sp. 5425_2, and Mortierella sp. 5425_53 significantly correlated with the Mg2+ concentration.
In the current study, a total of 1143 fungal OTUs were found. Although the number of species found is not small, the main dominant species are the same as in the studies conducted by other authors. The most abundant fungal OTU in our study was Archaeorhizomyces sp. 5425_1, which represented 11.5% of the total fungal OTUs. Archaeorhizomycetes, a widespread fungal class with a dominant presence in many soils, contain cryptic filamentous species forming plant–root associations whose role in terrestrial ecosystems remains unclear [78,79,80]. The second most abundant fungus Helotiaceae sp. 5425_18 represented 6.8% of the total fungal OTUs. The distribution of species of the Helotiaceae family is usually widespread, and therefore it is difficult to assign this fungal OTU species to any trophic group. Oidiodendron chlamydosporicum was also identified as one of the most common fungal OTU in our study. This fungal OTU was found in all study sites—the mature forest stands, clear-cuts, and 1st–4th year P. sylvestris plantations. In accordance with previous studies [81,82], the Oidiodendron sp. was more abundant in undisturbed soil.
In the current study, a similar number of unique fungal OTUs were detected in the mature forest stands and in the clear-cuts. This tendency was comparable for both analyses—soil fungal OTUs and mycorrhizal fungal OTUs. In the 1st–3rd year P. sylvestris plantations, the number of unique fungal OTUs decreased. In the 4th year plantations, the number of unique fungal OTUs significantly increased. Based on the results of our study, the number of fungal OTUs was able to recover four years after clear-cutting, but the composition of fungal communities remained different.
Mycorrhizal fungi are a very important component in assessing the reforestation process after clear-cutting [83,84,85,86,87,88]. Therefore, in our study, more attention was paid to mycorrhizal fungi and changes in relative abundance in different study sites. One of the functions of mycorrhizal fungi, especially in the early stages of forest ecosystem development, is protection against soil-borne pathogens and nematode infections in pine forests [89,90,91]. Furthermore, when colonized with mycorrhizal fungi, tree seedlings are known to tolerate different environmental stresses, such as drought or high temperatures, more efficiently [31,92,93,94,95]. In the temperate and boreal forests, most woody plant species are obligate partners with ectomycorrhizal fungi, which provide nutrients (for example, N) and water to host trees in exchange for photosynthetically fixed carbon (C) [75,88,90,96]. Among other forest tree species, P. sylvestris has been recognized as an obligate mycotroph, known as a host of 200–300 ectomycorrhizal fungal species [97,98,99,100,101]. In our study, a total of 70 mycorrhizal fungal OTUs were found in the soil sampled from the P. sylvestris study sites. The highest number of ECM fungal OTUs was found in the clear-cut sites, and the lowest number was found in the 2nd and 3rd year P. sylvestris plantations. The most abundant ECM fungi in our study were: Amanita fulva, Piloderma sphaerosporum, and Thelephora terrestris. Amanita fulva was found only in the mature forest stands and in the clear-cuts, while it was not detected in the 1st–4th year plantations. T. terrestris is considered a pioneer, multi-host mycobiont, common in nurseries, as well as young and old forests [82,102]. Among all ECM fungal OTUs, only three—Elaphomyces cf. muricatus Fr, Wilcoxina sp. 5425_54, and Elaphomyces granulatus—represented the phylum Ascomycota. According to other studies, Wilcoxina mikolae (Chin S. Yang & H.E. Wilcox) Chin S. Yang & Korf was the most abundant and most frequently occurring species in the forest nurseries and clear-cuts [31,103]. Wilcoxina species form ectendomycorrhiza and are the most common colonizers of young conifers.
According to previous studies, clear-cutting has negative short-term effects on ectomycorrhizal fungal biomass and diversity [25,104,105]. However, other findings indicated that clear-cutting has profound long-lasting effects on the abundance and composition of ectomycorrhizal fungal communities [25,103,106]. Clear-cutting may cause a complete disappearance of energy supply to mycorrhizal fungi, while thinning only reduces energy input [25,27]. However, mycorrhizal fungi may remain unchanged due to clear cuttings if the fungi are associated with the retained trees or with the tree roots, extending into the felled area from the forest edges [107,108,109]. According to the study by Sterkenburg [75], several ectomycorrhizal fungal species were still detected in the soil three years after clear cutting with no retained trees, although at very low abundance. This could be related to the high number of naturally grown P. sylvestris seedlings prior to the forest felling [75,110]. In contrast, in our study, there were no common ECM fungal species detected in the soil in the 1st–4th year plantations. Only one ECM fungus, Thelephora terestris, was found in all study sites, except for the 2nd year P. sylvestris plantations.
An important aspect of our study was that the evaluated effects reflected a period of four years after clear-cutting, and the obtained data were compared to those obtained in a mature P. sylvestris forest typical for the hemiboreal forest zone. This study contributes to existing knowledge on changes in soil chemistry and mycobiota during the early stages of forest regeneration, both nationally and regionally.

5. Conclusions

The study aim was to determine the fungal communities in relation to soil chemical parameters in the upper mineral soil layer of Scots pine (Pinus sylvestris L.) ecosystems, including mature forest stands, clear-cuts, and 1st, 2nd, 3rd, and 4th year plantations. A higher electrical conductivity (EC), higher concentrations of mineral nitrogen (N), total phosphorus (P), and P2O5 were obtained in the soil of the 1st year plantations than the mature forest. The highest soil pH values and Ca2+ concentrations were found in the 3rd year plantations. The soil chemical parameters obtained in the 4th year plantations were comparable with those obtained in the mature forest stands.
A total of 1143 fungal operational taxonomic units (OTUs) were identified in P. sylvestris forest soils. The most dominant phyla were Ascomycota, Basidiomycota, Mucoromycota, Chytridiomycota, and Zoopagomycota. The highest Shannon diversity index was obtained in the 1st and 3rd year plantations, while the lowest was found in the clear-cuts. The fungal communities identified in all studied sites of P. sylvestris plantations did not differ significantly. The number of common and unique fungal OTUs varied among the study sites, but a higher number of unique fungal OTUs was more typical for the 4th year plantations than other sites. The most abundant fungi were Archaeorhizomyces sp. 5425_1, Helotiaceae sp. 5425_2, Unidentified sp. 5425_18, and Oidiodendron chlamydosporicum. The most abundant ectomycorrhizal (ECM) fungal OTUs were found in the clear-cut and mature forest stand sites. The most abundant ECM fungi were Amanita fulva, Piloderma sphaerosporum, Thelephora terrestris, Russula decolorans, and Russula vinosa.
The soil of P. sylvestris sites was inhabited by different fungal communities during the first four years after clear-cutting. The assumption that changes in forest soil chemical parameters can affect soil fungal communities in different study sites was partially confirmed, although the identified changes in soil parameters did not reveal significant effects on fungal abundance and diversity in all cases.

Author Contributions

Conceptualization, A.P. and I.V.-K.; formal analysis, A.P., I.V.-K., D.M., A.M. and J.L.; investigation, A.P., A.G., D.M., A.M. (Adas Marčiulynas), J.L., V.M. and A.M. (Audrius Menkis); methodology, A.G., D.M. and A.M. (Audrius Menkis); project administration, A.G.; software, A.P. and V.M. (Adas Marčiulynas); supervision, A.G.; visualization, A.P. and A.G; writing—original draft, A.P. and I.V.-K.; writing—review and editing, A.G., D.M., A.M. (Adas Marčiulynas), J.L., V.M. and A.M. (Audrius Menkis). All authors have read and agreed to the published version of the manuscript.

Funding

This project has received funding from the Research Council of Lithuania (LMTLT), agreement No. S-SIT-20-2.

Data Availability Statement

The sequences analysed in this study are available in the GenBank Nucleotide database [http://www.ncbi.nlm.nih.gov] accessed on 20 July 2022.

Conflicts of Interest

The authors declare no conflict of interest.

References

  1. Gustafsson, L.; Baker, S.C.; Bauhus, J.; Beese, W.J.; Brodie, A.; Kouki, J.; Lindenmayer, D.B.; Lohmus, A.; Pastur, G.M.; Messier, C.; et al. Retention forestry to maintain multifunctional forests: A world perspective. Bioscience 2012, 62, 633–645. [Google Scholar] [CrossRef] [Green Version]
  2. Kuuluvainen, T. Disturbance dynamics in boreal forests: Defining the ecological basis of restoration and management of biodiversity. Silva Fenn. 2002, 36, 5–11. [Google Scholar] [CrossRef]
  3. Chazdon, R.L. Beyond deforestation: Restoring forests and ecosystem services on degraded lands. Science 2008, 320, 1458–1460. [Google Scholar] [CrossRef] [PubMed] [Green Version]
  4. Kuuluvainen, T. Forest Management and Biodiversity Conservation Based on Natural Ecosystem Dynamics in Northern Europe: The Complexity Challenge. Ambio 2009, 38, 309–315. [Google Scholar] [CrossRef] [PubMed]
  5. Bouget, C.; Nusillard, B.; Pineau, X.; Ricou, C. Effect of deadwood position on saproxylic beetles in temperate forests and conservation interest of oak snags. Insect Conserv. Divers. 2012, 5, 264–278. [Google Scholar] [CrossRef]
  6. Koivula, M.J. Useful model organisms, indicators, or both? Ground beetles (Coleoptera, Carabidae) reflecting environmental conditions. Zookeys 2011, 100, 287–317. [Google Scholar] [CrossRef] [Green Version]
  7. Sklodowski, J.J. Manual soil preparation and piles of branches can support ground beetles (Coleoptera, carabidae) better than four different mechanical soil treatments in a clear-cut area of a closed-canopy pine forest in northern Poland. Scand. J. For. Res. 2016, 32, 123–133. [Google Scholar] [CrossRef]
  8. Junninen, K.; Penttila, R.; Martikainen, P. Fallen retention aspen trees on clear-cuts can be important habitats for red-listed polypores: A case study in Finland. Biodivers. Conserv. 2007, 16, 475–490. [Google Scholar] [CrossRef]
  9. Paillet, Y.; Berges, L.; Hjalten, J.; Odor, P.; Avon, C.; Romermann, B.M.; Bijlsma, R.J.; De Bruyn, L.; Fuhr, M.; Grandin, U.; et al. Biodiversity Differences between Managed and Unmanaged Forests: Meta-Analysis of Species Richness in Europe. Conserv. Biol. 2009, 24, 101–112. [Google Scholar] [CrossRef] [PubMed]
  10. Chaudhary, A.; Burivalova, Z.; Koh, L.P.; Hellweg, S. Impact of Forest Management on Species Richness: Global Meta-Analysis and Economic Trade-Offs. Sci. Rep. 2016, 6, 23954. [Google Scholar] [CrossRef]
  11. Chandler, J.R.; Haeussler, S.; Hamilton, E.H.; Feller, M.; Bradfield, G.; Simard, S.W. Twenty years of ecosystem response after clearcutting and slashburning in conifer forests of central British Columbia, Canada. PLoS ONE 2017, 12, e0172667. [Google Scholar] [CrossRef] [PubMed] [Green Version]
  12. Smith, S.E.; Read, D.J. Mycorrhizal Symbiosis, 2nd ed.; Academic Press: London, UK, 1997; p. 605. [Google Scholar]
  13. Klaubauf, S.; Inselsbacher, E.; Zechmeister-Boltenstern, S.; Wanek, W.; Gottsberger, R.; Strauss, J.; Gorfer, M. Molecular diversity of fungal communities in agricultural soils from Lower Austria. Fungal Divers. 2010, 44, 65–75. [Google Scholar] [CrossRef] [PubMed] [Green Version]
  14. Menkis, A.; Uotila, A.; Arhipova, N.; Vasaitis, R. Effects of stump and slash removal on growth and mycorrhization of Picea abies seedlings outplanted on a forest clear-cut. Mycorrhiza 2010, 20, 505–509. [Google Scholar] [CrossRef] [PubMed]
  15. Thakur, M.P.; Geisen, S. Trophic Regulations of the Soil Microbiome. Trends Microbiol. 2019, 27, 771–780. [Google Scholar] [CrossRef] [PubMed]
  16. Behnke-Borowczyk, J.; Kowalkowski, W.; Kartawik, N.; Baranowska, M.; Barzdajn, W. Soil fungal communities in nurseries producing Abies alba. Balt. For. 2020, 26, 5–12. [Google Scholar] [CrossRef]
  17. Clarke, N.; Podenphant, L.K.; Kjonaas, O.J.; Barcena, T.G.; Vesterdal, L.; Stupak, I.; Finer, L.; Jacobson, S.; Armolaitis, K.; Lazdina, D.; et al. Effects of intensive biomass harvesting on forest soils in the Nordic countries and the UK: A meta-analysis. For. Ecol. Manag. 2021, 482, 118877. [Google Scholar] [CrossRef]
  18. Simard, S.W.; Austin, M.E. The Role of Mycorrhizas in Forest Soil Stability with Climate Change. In Climate Change and Variability; Simard, S.W., Austin, M.E., Eds.; IntechOpen: Rijeka, Croatia, 2010; Chapter 15; pp. 275–303. [Google Scholar]
  19. Kucerava, B.; Dobrovolny, L.; Remes, J. Responses of Abies alba seedlings to different site conditions in Picea abies plantations. Dendrobiology 2013, 69, 49–58. [Google Scholar] [CrossRef] [Green Version]
  20. Kobala, M.; Grčman, H.; Zupan, M.; Levanič, T.; Simončič, P.; Kadunc, A.; Hladnik, D. Influence of soil properties on silver fir (Abies alba Mill.) growth in the Dinaric Mountains. For. Ecol. Manag. 2015, 337, 77–87. [Google Scholar] [CrossRef] [Green Version]
  21. Kormanek, M.; Banach, J.; Lenczuk, D. Influence of soil compaction on the growth of silver fir (Abies alba Mill.) under a forest canopy. Ecol. Quest. 2015, 22, 47–54. [Google Scholar] [CrossRef] [Green Version]
  22. Delgado, E.F.; Valdez, A.T.; Covarrubias, S.A.; Tosi, S.; Nicola, L. Soil Fungal Diversity of the Aguarongo Andean Forest (Ecuador). Biology 2021, 10, 1289. [Google Scholar] [CrossRef] [PubMed]
  23. Cairney, J.W.G.; Meharg, A.A. Interactions between ectomycorrhizal fungi and soil saprotrophs: Implications for decomposition of organic matter in soils and degradation of organic pollutants in the rhizosphere. Can. J. Bot. 2002, 80, 803–809. [Google Scholar] [CrossRef]
  24. Hobbie, E.A.; Macko, S.A.; Shugart, H.H. Insights into nitrogen and carbon dynamics of ectomycorrhizal and saprotrophic fungi from isotopic evidence. Oecologia 1999, 118, 353–360. [Google Scholar] [CrossRef]
  25. Jones, M.D.; Durall, D.M.; Cairney, J.W.G. Ectomycorrhizal fungal communities in young forest stands regenerating after clearcut logging. N. Phytol. 2003, 157, 399–422. [Google Scholar] [CrossRef] [PubMed] [Green Version]
  26. Teste, F.P.; Karst, J.; Jones, M.D.; Simard, S.W.; Durall, D.M. Methods to control ectomycorrhizal colonization: Effectiveness of chemical and physical barriers. Mycorrhiza 2006, 17, 51–65. [Google Scholar] [CrossRef] [PubMed]
  27. Luoma, D.L.; Eberhart, J.L.; Molina, R.; Amaranthus, M.P. Response of ectomycorrhizal fungus sporocarp production to varying levels and patterns of green-tree retention. For. Ecol. Manag. 2004, 202, 337–354. [Google Scholar] [CrossRef]
  28. Nehls, U. Mastering ectomycorrhizal symbiosis: The impact of carbohydrates. J. Exp. Bot. 2008, 59, 1097–1108. [Google Scholar] [CrossRef] [PubMed]
  29. Byrd, K.B.; Parker, V.T.; Vogler, D.R.; Cullings, K.W. The influence of clear-cutting on ectomycorrhizal fungus diversity in a lodgepole pine (Pinus contorta) stand, Yellowstone National Park, Wyoming, and Gallatin National Forest, Montana. Can. J. Bot. 2000, 78, 149–156. [Google Scholar]
  30. Lithuanian State Forest Survey Service. In Lithuanian Statistical Yearbook of Forestry; Lithuanian State Forest Survey Service: Kaunas, Lithuania, 2020; p. 25.
  31. Rudawska, M.; Leski, T. Ectomycorrhizal Fungal Assemblages of Nursery-Grown Scots Pine are Influenced by Age of the Seedlings. Forests 2021, 12, 134. [Google Scholar] [CrossRef]
  32. Wubet, T.; Christ, S.; Schöning, I.; Boch, S.; Gawlich, M.; Schnabel, B.; Fischer, M.; Buscot, F. Differences in soil fungal communities between European Beech (Fagus sylvatica L.) dominated forests are related to soil and understory vegetation. PLoS ONE 2012, 7, e47500. [Google Scholar] [CrossRef]
  33. Yurkov, A.M.; Kemler, M.; Begerow, D. Assessment of yeast diversity in soils under different management regimes. Fungal Ecol. 2012, 5, 24–35. [Google Scholar] [CrossRef]
  34. Goldmann, K.; Schöning, I.; Buscot, F.; Wubet, T. Forest management type influences diversity and community composition of soil fungi across temperate forest ecosystems. Front. Microbiol. 2015, 6, 1–11. [Google Scholar] [CrossRef] [PubMed]
  35. Buee, M.; Reich, M.; Murat, C.; Morin, E.; Nilsson, R.H.; Uroz, S.; Martin, F. 454 Pyrosequencing analyses of forest soils reveal an unexpectedly high fungal diversity. New Phytol. 2009, 184, 449–456. [Google Scholar] [CrossRef] [PubMed]
  36. Kwasna, H.; Walkowiak, L.; Lakomy, P.; Behnke-Borowczyk, J.; Gornowicz, R.; Mikicinski, A.; Gałązka, S.; Szewczyk, W. Effect of silvicultural techniques on the diversity of microorganisms in forest soil and their participation in biological control of Armillaria and Heterobasidion. J. Plant Prot. Res. 2015, 55, 241–253. [Google Scholar] [CrossRef]
  37. Malecka, M.; Kwasna, H.; Szewczyk, W. Fungal communities in barren forest soil after amendment with different wood substrates and their possible effects on trees pathogens, insects and nematodes. J. Plant Prot. Res. 2015, 55, 301–311. [Google Scholar] [CrossRef]
  38. Aučina, A.; Rudawska, M.; Leski, T.; Skridaila, A.; Riepšas, E.; Iwanski, M. Growth and mycorrhizal community structure of Pinus sylvestris seedlings following the addition of forest litter. Appl. Environ. Microbiol. 2007, 73, 4867–4873. [Google Scholar] [CrossRef] [Green Version]
  39. Aučina, A.; Rudawska, M.; Leski, T.; Skridaila, A.; Pašakinskiene, I.; Riepšas, E. Forest litter as the mulch improving growth and ectomycorrhizal diversity of bare-root Scots pine (Pinus sylvestris) seedlings. Iforest 2015, 8, 394–400. Available online: http://www.sisef.it/iforest/contents/?id=ifor1083-008 (accessed on 25 August 2022).
  40. Horton, T.R.; Bruns, T.D. The molecular revolution in ectomycorrhizal ecology: Peeking into the black-box. Mol. Ecol. 2001, 10, 1855–1871. [Google Scholar] [CrossRef] [Green Version]
  41. Menkis, A.; Vasaitis, R. Fungi in roots of nursery grown Pinus sylvestris: Ectomycorrhizal colonisation, genetic diversity and spatial distribution. Microb. Ecol. 2011, 61, 52–63. [Google Scholar] [CrossRef]
  42. Banchi, E.; Ametrano, C.G.; Tordoni, E.; Stankovi, D.; Ongaro, S.; Tetiach, M.; Pallavicini, A.; Muggia, L.; Verardo, P.; Tassan, F.; et al. Environmental DNA assessment of airborne plant and fungal seasonal diversity. Sci. Total Environ. 2020, 738, 140249. [Google Scholar] [CrossRef]
  43. Marčiulynas, A.; Marčiulyniene, D.; Lynikiene, J.; Gedminas, A.; Vaičiukyne, M.; Menkis, A. Fungi and oomycetes in the irrigation water of forest nurseries. Forests 2020, 11, 459. [Google Scholar] [CrossRef] [Green Version]
  44. Marčiulyniene, D.; Marčiulynas, A.; Lynikiene, J.; Vaičiukyne, M.; Gedminas, A.; Menkis, A. DNA-Metabarcoding of Belowground Fungal Communities in Bare-Root Forest Nurseries: Focus on Different Tree Species. Microorganisms 2021, 9, 150. [Google Scholar] [CrossRef] [PubMed]
  45. Nilsson, R.H.; Anslan, S.; Bahram, M.; Wurzbacher, C.; Baldrian, P.; Tedersoo, L. Mycobiome diversity: High-throughput sequencing and identification of fungi. Nat. Rev. Microbiol. 2019, 17, 95–109. [Google Scholar] [CrossRef] [PubMed]
  46. Karazija, S. Lietuvos Miškų Tipai. (Forest tipes of Lithuania); Mokslas: Vilnius, Lithuania, 1988; p. 210. (In Lithuanian) [Google Scholar]
  47. Vaičys, M.; Karazija, S.; Kuliešis, A.; Rutkauskas, A. Miškų Augavietės (Forest Sites); Lutute: Kaunas, Lithuania, 2006; p. 95. (In Lithuanian) [Google Scholar]
  48. IUSS Working Group WRB. World Reference Base for Soil Resources 2014: International Soil Classification System for Naming Soils and Creating Legends for Soil Maps; World Soil Resources Reports No. 106; FAO: Rome, Italy, 2015; p. 192. [Google Scholar]
  49. Sampling and Analysis of Soil. 2010. Available online: https://www.icp-forests.org/pdf/manual/2010/Manual_2010_soil.pdf (accessed on 25 August 2022).
  50. Rosling, A.; Landeweert, R.; Lindah, B.D.; Larsson, K.H.; Kuyper, T.W.; Taylor, A.F.S.; Finlay, R.D. Vertical distribution of ectomycorrhizal fungal taxa in a podzol soil profile. New Phytol. 2003, 159, 775–783. [Google Scholar]
  51. Ihrmark, K.; Bodeker, I.T.M.; Cruz-Martinez, K.; Friberg, H.; Kubartova, A.; Schenck, J.; Strid, Y.; Stenlid, J.; Brandstrom-Durling, M.; Clemmensen, K.E.; et al. New primers to amplify the fungal ITS2 region-evaluation by 454-sequencing of artificial and natural communities. FEMS Microbiol. Ecol. 2012, 82, 666–677. [Google Scholar] [CrossRef] [PubMed]
  52. White, T.J.; Bruns, T.; Lee, S.; Taylor, J. Amplification and direct sequencing of fungal ribosomal RNA genes for phylogenetics. In PCR Protocols: A Guide to Methods and Applications; Innis, M.A., Gelfand, D.H., Sninsky, J.J., White, T.J., Eds.; Academic Press Inc.: San Diego, CA, USA, 1990; pp. 315–322. [Google Scholar]
  53. Magurran, A.E. Ecological Diversity and Its Measurement, 1st ed.; Princeton University Press: Princeton, NJ, USA, 1988; p. 192. [Google Scholar]
  54. Nguyen, D.; Boberg, J.; Ihrmark, K.; Stenstrom, E.; Stenlid, J. Do foliar fungal communities of Norway spruce shift along a tree species diversity gradient in mature European forests? Fungal Ecol. 2016, 23, 97–108. [Google Scholar] [CrossRef] [Green Version]
  55. Jussy, J.H.; Ranger, J.; Bienaimé, S.; Dambrine, E. Effects of a clear-cut on the in situ nitrogen mineralisation and the nitrogen cycle in a 67-year old Douglas-fir (Pseudotsuga menziesii (Mirb.) Franco) plantation. Ann. For. Sci. 2004, 61, 397–408. [Google Scholar] [CrossRef] [Green Version]
  56. Gundersen, P.; Schmidt, I.K.; Raulund-Rasmussen, K. Leaching of nitrate from temperate forests—Effects of air pollution and forest management. Environ. Rev. 2006, 14, 1–57. [Google Scholar] [CrossRef]
  57. Hedwall, P.O.; Grip, H.; Linder, S.; Lövdahl, L.; Nilsson, U.; Bergh, J. Effects of clear-cutting and slash removal on soil water chemistry and forest floor vegetation in a nutrient optimised Norway spruce stand. Silva Fenn. 2013, 47, 16. [Google Scholar] [CrossRef] [Green Version]
  58. Palviainen, M. Logging residues and ground vegetation in nutrient dynamics of a clear-cut boreal forest. Diss. For. 2005, 12, 1–38. [Google Scholar] [CrossRef] [Green Version]
  59. Wall, A. Effect of removal of logging residue on nutrient leaching and nutrient pools in the soil after clearcutting in a Norway spruce stand. For. Ecol. Manag. 2008, 256, 1372–1383. [Google Scholar] [CrossRef]
  60. Armolaitis, K.; Varnagirytė-Kabašinskienė, I.; Stupak, I.; Mikšys, V.; Kukkola, M.; Wójcik, J. Carbon and nutrients of Scots pine stands on sandy soils in Lithuania in relation to bioenergy sustainability. Biomass Bioenergy 2013, 54, 250–259. [Google Scholar] [CrossRef]
  61. Smolander, A.; Kitunen, V.; Mälkönen, E. Dissolved soil organic nitrogen and carbon in a Norway spruce stand and adjacent clear-cut. Biol. Fertil. Soils 2001, 33, 190–196. [Google Scholar] [CrossRef]
  62. Palviainen, M.; Finér, L.; Laurén, A.; Mattsson, T.; Högbom, L. A method to estimate the impact of clear-cutting on nutrient concentrations in boreal headwater streams. Ambio 2015, 44, 521–531. [Google Scholar] [CrossRef] [PubMed]
  63. Stuiver, B.; Wardle, D.; Gundale, M.; Nilsson, M. Seedling responses to changes in canopy and soil properties during stand development following clear-cutting. For. Ecol. Manag. 2016, 378, 31–43. [Google Scholar] [CrossRef]
  64. Rappe George, M.O.; Hansson, L.J.; Ring, E.; Jansson, P.E.; Gärdenäs, A.I. Nitrogen leaching following clear-cutting and soil scarification at a Scots pine site—A modelling study of a fertilization experiment. For. Ecol. Manag. 2017, 385, 281–294. [Google Scholar] [CrossRef]
  65. Česonienė, L.; Daubaras, R.; Tamutis, V.; Kaškonienė, V.; Kaškonas, P.; Stakėnas, V.; Zych, M. Effect of clear-cutting on the understory vegetation, soil and diversity of litter beetles in scots pine-dominated forest. J. Sustain. For. 2019, 38, 791–808. [Google Scholar] [CrossRef]
  66. Six, J.; Conant, R.T.; Paul, E.A. Stabilization mechanisms of soil organic matter: Implications for C—Saturation of soil. Plant Soil 2002, 241, 155–176. [Google Scholar] [CrossRef]
  67. Lal, R. Sequestering carbon in soils of agro-ecosystems. Food Policy 2011, 36, 33–39. [Google Scholar] [CrossRef]
  68. Qualls, R.G.; Haines, B.L.; Swank, W.T.; Tyler, S.W. Soluble organic and inorganic nutrient fluxes in clearcut and mature deciduous forests. Soil Sci. Soc. Am. J. 2000, 64, 1068–1077. [Google Scholar] [CrossRef] [Green Version]
  69. Piirainen, S.; Finer, L.; Mannerkoski, H.; Starr, M. Effects of forest clear-cutting on the carbon and nitrogen fluxes through podzolic soil horizons. Plant Soil 2002, 239, 301–311. [Google Scholar] [CrossRef]
  70. Schelker, J.; Eklöf, K.; Bishop, K.; Laudon, H. Effects of forestry operations on dissolved organic carbon concentrations and export in boreal first-order streams. J. Geophys. Res. 2012, 117, G01011. [Google Scholar] [CrossRef]
  71. Schelker, J.; Öhman, K.; Löfgren, S.; Laudon, H. Scaling of increased dissolved organic carbon inputs by forest clear-cutting—What arrives downstream? J. Hydrol. 2014, 508, 299–306. [Google Scholar] [CrossRef]
  72. Nieminen, M.; Sarkkola, S.; Laurén, A. Impacts of forest harvesting on nutrient, sediment and dissolved organic carbon exports from drained peatlands: A literature review, synthesis and suggestions for the future. For. Ecol. Manag. 2017, 392, 13–20. [Google Scholar] [CrossRef]
  73. Cools, N.; Vesterdal, L.; De Vos, B.; Vanguelova, E.; Hansen, K. Tree species is the major factor explaining C:N ratios in European forest soils. For. Ecol. Manag. 2014, 311, 3–16. [Google Scholar] [CrossRef]
  74. Siebers, N.; Kruse, J. Short-term impacts of forest clear-cut on soil structure and consequences for organic matter composition and nutrient speciation: A case study. PLoS ONE 2019, 14, e0220476. [Google Scholar] [CrossRef] [Green Version]
  75. Sterkenburg, E.; Clemmensen, K.E.; Lindahl, B.D.; Dahlberg, A. The significance of retention trees for survival of ectomycorrhizal fungi in clear−cut Scots pine forests. J. Appl. Ecol. 2019, 56, 1367–1378. [Google Scholar] [CrossRef]
  76. Orwin, K.H.; Kirschbaum, M.U.F.; St John, M.G.; Dickie, I.A. Organic nutrient uptake by mycorrhizal fungi enhances ecosystem carbon storage: A model-based assessment: Organic nutrient uptake enhances soil C. Ecol. Lett. 2011, 14, 493–502. [Google Scholar] [CrossRef]
  77. Averill, C.; Hawkes, C.V. Ectomycorrhizal fungi slow soil carbon cycling. Ecol. Lett. 2016, 19, 937–947. [Google Scholar] [CrossRef]
  78. Rosling, A.; Timling, I.; Taylor, D.L. Archaeorhizomycetes: Patterns of distribution and abundance in soil. In Genomics of Soil-and Plant-Associated Fungi; Horwitz, B.A., Mukherjee, P.K., Mukherjee, M., Kubicek, C.P., Eds.; Springer: Berlin/Heidelberg, Germany, 2013; Volume 3, pp. 333–349. [Google Scholar] [CrossRef] [Green Version]
  79. Menkis, A.; Urbina, H.; James, T.Y.; Rosling, A. Archaeorhizomyces borealis sp. nov. and a sequence-based classification of related soil fungal species. Fungal Biol. 2014, 118, 943–955. [Google Scholar] [CrossRef]
  80. Choma, M.; Bárta, J.; Šantrucková, H.; Urich, T. Low abundance of Archaeorhizomycetes among fungi in soil metatranscriptomes. Sci. Rep. 2016, 6, 38455. [Google Scholar] [CrossRef]
  81. Lee, E.H.; Eom, A.H. Ectomycorrhizal fungal communities of red pine (Pinus densiflora) seedlings in disturbed sites and undisturbed old forest sites. Mycobiology 2013, 41, 77–81. [Google Scholar] [CrossRef] [PubMed] [Green Version]
  82. Kwasna, H.; Behnke-Borowczyk, J.; Gornowicz, R.; Lakomy, P. Effects of preparation of clear-cut forest sites on the soil mycobiota with consequences for Scots pine growth and health. For. Path. 2019, 49, 1–12. [Google Scholar] [CrossRef]
  83. Gardes, M.; Bruns, T.D. Community structure of ectomycorrhizal fungi in a Pinus muricata forest: Above and below ground views. Can. J. Bot. 1996, 74, 1572–1583. [Google Scholar] [CrossRef]
  84. Dahlberg, A.; Jonsson, L.; Nylund, J.E. Species diversity and distribution of biomass above and below ground among ectomycorrhizal fungi in an old-growth Norway spruce forest in South Sweden. Can. J. Bot. 1997, 75, 1323–1335. [Google Scholar] [CrossRef]
  85. Teste, F.P.; Lieffers, V.J.; Strelkov, S.E. Ectomycorrhizal community responses to intensive forest management: Thinning alters impacts of fertilization. Plant Soil 2012, 360, 333–347. [Google Scholar] [CrossRef]
  86. Hartmann, M.; Howes, C.G.; VanInsberghe, D.; Yu, H.; Bachar, D.; Christen, R.; Nilsson, R.H.; Hallam, S.J.; Mohn, W.W. Significant and persistent impact of timber harvesting on soil microbial communities in Northern coniferous forests. ISME J. 2012, 6, 2199–2218. [Google Scholar] [CrossRef] [Green Version]
  87. Hawkins, B.J.; Jones, M.D.; Kranabetter, J.M. Ectomycorrhizae and tree seedling nitrogen nutrition in forest restoration. New For. 2015, 46, 747–771. [Google Scholar] [CrossRef]
  88. Policelli, N.; Horton, T.R.; Hudon, A.T.; Patterson, T.R.; Bhatnagar, J.M. Back to Roots: The Role of Ectomycorrhizal Fungi in Boreal and Temperate Forest Restoration. Front. For. Glob. Chang. 2020, 3, 97. [Google Scholar] [CrossRef]
  89. Futai, K.; Taniguchi, T.; Kataoka, R. Ectomycorrhizae and their importance in forest ecosystems. In Mycorrhizae: Sustainable Agriculture and Forestry; Siddiqui, Z., Akhtar, M.S., Futai, K., Eds.; Springer: Dordrecht, The Netherlands, 2008; pp. 241–285. [Google Scholar]
  90. Smith, S.; Read, D. Mycorrhizal Symbiosis, 3rd ed.; Academic Press: London, UK, 2008; p. 768. [Google Scholar]
  91. Karst, J.; Erbilgin, N.; Pec, G.J.; Cigan, P.W.; Najar, A.; Simard, S.W.; Cahill, J.F. Ectomycorrhizal fungi mediate indirect effects of a bark beetle outbreak on secondary chemistry and establishment of pine seedlings. N. Phytol. 2015, 208, 904–914. [Google Scholar] [CrossRef]
  92. Baath, E. Soil fungal biomass after clear-cutting of a pine forest in central Sweden. Soil Biol. Biochem. 1980, 12, 495–500. [Google Scholar] [CrossRef]
  93. Newman, S.E.; Davies, F.T.J. High root-zone temperatures mycorrhizal fungi water relations and root hydraulic conductivity of container-grown woody plants. J. Am. Soc. Hortic. Sci. 1988, 113, 138–146. [Google Scholar] [CrossRef]
  94. Boyle, C.D.; Hellenbrand, K.E. Assessment of the effect of mycorrhizal fungi on drought tolerance of conifer seedlings. Can. J. Bot. 1991, 69, 1764–1771. [Google Scholar] [CrossRef]
  95. Perry, D.A.; Amaranthus, M.P.; Borchers, J.G.; Borchers, S.L.; Brainerd, R.E. Bootstrapping in ecosystems. Bioscience 1989, 39, 230–237. [Google Scholar] [CrossRef]
  96. Lang, C.; Polle, A. Ectomycorrhizal fungal diversity, tree diversity and root nutrient relations in a mixed Central European forest. Tree Physiol. 2011, 31, 531–538. [Google Scholar] [CrossRef]
  97. Jonsson, L.; Dahlberg, A.; Nilsson, M.C.; Karen, O.; Zackrisson, O. Continuity of ectomycorrhizal fungi in self-regenerating boreal Pinus sylvestris forests studied by comparing mycobiont diversity on seedlings and mature trees. N. Phytol. 1999, 142, 151–162. [Google Scholar] [CrossRef]
  98. Dahlberg, A.; Schimmel, J.; Taylor, A.F.S.; Johannesson, H. Post-fire legacy of ectomycorrhizal fungal communities in the Swedish boreal forest in relation to fire severity and logging intensity. Biol. Conserv. 2001, 100, 151–161. [Google Scholar] [CrossRef]
  99. Urban, A.; Puschenreiter, M.; Strauss, J.; Gorfer, M. Diversity and structure of ectomycorrhizal and co-associated fungal communities in a serpentine soil. Mycorrhiza 2008, 18, 339–354. [Google Scholar] [CrossRef]
  100. Rudawska, M.; Wilgan, R.; Janowski, D.; Iwanski, M.; Leski, T. Shifts in taxonomical and functional structure of ectomycorrhizal fungal community of Scots pine (Pinus sylvestris L.) underpinned by partner tree ageing. Pedobiologia 2018, 71, 20–30. [Google Scholar] [CrossRef]
  101. Aučina, A.; Rudawska, M.; Wilgan, R.; Janowski, D.; Skridaila, A.; Dapkuniene, S.; Leski, T. Functional diversity of ectomycorrhizal fungal communities along a peatland–forest gradient. Pedobiologia 2019, 74, 15–23. [Google Scholar] [CrossRef]
  102. Colpaert, J.V. Thelephora. In Ectomycorrhizal Fungi. Key Genera in Profile; Cairney, J.W.G., Chambers, S.M., Eds.; Springer: Berlin/Heidelberg, Germany, 1999; pp. 245–325. [Google Scholar]
  103. Bzdyk, R.M.; Sikora, K.; Studnicki, M.; Aleksandrowicz-Trzcinska, M. Communities of Mycorrhizal Fungi among Seedlings of Scots Pine (Pinus sylvestris L.) Growing on a Clearcut in Microsites Generated by Different Site-Preparation Methods. Forests 2022, 13, 353. [Google Scholar] [CrossRef]
  104. Kropp, B.R.; Langlois, C.G. Ectomycorrhizae in reforestation. Can. J. For. Res. 1990, 20, 438–451. [Google Scholar] [CrossRef]
  105. Grebenc, T.; Christensen, M.; Vilhar, U.; Čater, M.; Martin, M.P.; Simončič, P.; Kraigher, H. Response of ectomycorrhizal community structure to gap opening in natural and managed temperate beech-dominated forests. Can. J. For. Res. 2009, 39, 1375–1386. [Google Scholar] [CrossRef]
  106. Varenius, K.; Karen, O.; Lindahl, B.; Dahlberg, A. Long-term effects of tree harvesting on ectomycorrhizal fungal communities in boreal Scots pine forests. For. Ecol. Manag. 2016, 380, 41–49. [Google Scholar] [CrossRef]
  107. Simard, S.W.; Durall, D.M. Mycorrhizal networks: A review of their extent, function, and importance. Can. J. Bot. 2004, 82, 1140–1165. [Google Scholar] [CrossRef]
  108. Douhan, G.W.; Vincenot, L.; Gryta, H.; Selosse, M.A. Population genetics of ectomycorrhizal fungi: From current knowledge to emerging directions. Fungal Biol. 2011, 115, 569–597. [Google Scholar] [CrossRef]
  109. Varenius, K.; Lindahl, B.D.; Dahlberg, A. Retention of seed trees fails to lifeboat ectomycorrhizal fungal diversity in harvested Scots pine forests. FEMS Microbiol. Ecol. 2017, 93, 1–11. [Google Scholar] [CrossRef]
  110. Teste, F.P.; Simard, S.W.; Durall, D.M. Role of mycorrhizal networks and tree proximity in ectomycorrhizal colonization of planted seedlings. Fungal Ecol. 2009, 2, 21–30. [Google Scholar] [CrossRef]
Figure 1. Location of the three study regions in Lithuania: Alytus (A, on the map), Labanoras (L), Varėna (V). In each region, the following sampling sites were included: (1) mature Pinus sylvestris L. forest stands; (2) clear-cuts of P. sylvestris (felled in 2019); (3) 1st year P. sylvestris plantations (planted in 2018); (4) 2nd year P. sylvestris plantations (planted in 2017); (5) 3rd year P. sylvestris plantations (planted in 2016); (6) 4th year P. sylvestris plantations (planted in 2015).
Forests 13 01780 g001
Figure 2. Mean pHCaCl2 (A), mean concentrations of soil organic carbon (SOC, g kg–1) (B), total nitrogen (Total N, g kg–1) (C), and mineral nitrogen (Min N, g kg–1) (D) in the 0–20 cm topsoil layer in the mature forest, clear-cut, and reforested 1st–4th year Pinus sylvestris L. plantations. The data from three study sites (A, L, and V) were combined. The values followed by the same letter indicate no significant difference between the sampling sites at p < 0.05.
Forests 13 01780 g002
Figure 3. Rarefaction curves showing the relationship between the cumulative number of fungal operational taxonomic units (OTUs) and the number of internal transcribed spacer (ITS) rRNA sequences from corresponding sampling sites; the data obtained in the three study sites (A, L, and V) were combined to give a generalized trend for the mature forest stands, clear-cuts, and reforested 1st–4th year Pinus sylvestris L. plantations.
Forests 13 01780 g003
Figure 4. Nonmetric multidimensional scaling (NMDS) ordination of the fungal communities in the study sites (Bray–Curtis index). Each point represents separate fungal OTUs. The data obtained in three study sites (A, L, and V) were combined to show the overall situation for the mature forest stands, clear-cuts, and reforested 1st–4th year Pinus sylvestris L. plantations.
Forests 13 01780 g004
Figure 5. Ecological roles of the fungal OTUs in the soil sampled from different study sites. The data for the mature forest stands, clear-cuts, and reforested 1st–4th year Pinus sylvestris L. plantations were combined correspondingly from three study sites (A, L, and V).
Forests 13 01780 g005
Figure 6. Venn diagram indicating the diversity of the fungal OTUs found in the mature forests, clear-cuts, and 4th year plantations, and the number of fungal OTUs shared across studied sites; the data obtained in three study sites (A, L, and V) were combined. Different colours represent different study sites: blue indicates mature forest stands, red—clear-cuts, and green—4th year plantations.
Forests 13 01780 g006
Figure 7. Venn diagram indicating the diversity of the fungal OTUs found in the 1st–4th year Pinus sylvestris L. plantations and the number of fungal OTUs shared across all plantations; the data obtained at three study sites (A, L, and V) were combined. Different colours represent different study sites: blue—1st year plantations, red—2nd year plantations, green—3rd year plantations, and orange—4th year plantations.
Forests 13 01780 g007
Figure 8. Nonmetric multidimensional scaling (NMDS) ordination of the mycorrhizal fungi abundance in study sites (Bray–Curtis index). Each point represents a separate mycorrhizal fungal OTU. The data obtained in three study sites (A, L, and V) were combined to show the overall situation for the mature forest stands, clear-cuts, and reforested 1st–4th year Pinus sylvestris L. plantations.
Forests 13 01780 g008
Figure 9. Canonical correspondence analysis (CCA) of the selected chemical variables (pHCaCl2, SOC, total N, Mg2+, and Cl) and the most common 30 fungal OTUs. Red numbers represent study sites: 1 is the mature forest stands; 2—clear-cuts; 3—the 1st year plantations; 4—the 2nd year plantations; 5—the 3rd year plantations; 6—the 4th year plantations. The first and second axes explain 32% and 30% of the variance. Abbreviations of fungal species are composed of the three-letter abbreviation of the species scientific name. If the fungal taxa were identified only to the genus level, abbreviations are composed of the three-letter abbreviation of the genus name and the last number of the identification code (full names of fungal out are given in Table 4).
Forests 13 01780 g009
Table 1. Characteristics of the sampling sites in the selected Pinus sylvestris L. stands according to the State Forest Cadastre (2021).
Region (Code)Sampling Site Code *Site
Description
Geographic CoordinatesForest
Vegetation Type **
Stand Age (years)Mean Tree DBH ***
(cm)
Mean Tree Height
(m)
Alytus (A)A1Mature forest54°31′29.4″ N, 24°0′52.9″ Evm9435.931.2
A2Clear-cut54°32′33.4″ N, 24°8′22.1″ Ev---
A31st year plantation54°34′13.3″ N, 23°57′59.2″ Evm3--
A42nd year plantation54°31′31.3″ N, 24°0′50.1″ Evm4--
A53rd year plantation54°31′26.1″ N, 23°56′2.6″ Evm5--
A64th year plantation54°30′39.2″ N, 23°58′25.0″ Evm6--
Varėna (V)V1Mature forest54°10′45.2″ N, 24°35′9.8″ Evm8528.124.4
V2Clear-cut54°8′32.9″ N, 24°34′36.1″ Ev---
V31st year plantation54°11′51.9″ N, 24°35′48.7″ Evm3--
V42nd year plantation54°9′18.4″ N, 24°31′48.3″ Evm4--
V53rd year plantation54°10′18.7″ N, 24°35′48.9″ Evm5--
V64th year plantation54°6′7.5″ N, 24°34′4.8″ Evm6--
Labanoras
(L)
L1Mature forest55°10′36.7″ N, 25°45′28.3″ Evm13236.131.1
L2Clear-cut55°9′10.8″ N, 25°47′42.8″ Ev---
L31st year plantation55°10′35.0″ N, 25°45′11.5″ Evm3--
L42nd year plantation55°8′35.9″ N, 25°48′37.0″ Evm4--
L53rd year plantation55°8′17.9″ N, 25°45′28.3″ Evm5--
L64th year plantation55°10′37.7″ N, 25°45′33.4″ Evm6--
* A1–A6: sampling sites in Alytus region; V1–V6: sampling sites in Varėna region; L1–L6: sampling sites in Labanoras region, also shown in Figure 1. ** v: vacciniosa, m: myrtilliosa; *** DBH: tree diameter at breast height (measured at 1.3 meters above the ground).
Table 2. Mean EC (mS m–1), mean concentrations of total phosphorus (P), potassium (K), calcium (Ca), magnesium (Mg), chlorides (Cl) (mg kg–1), and P2O5, K2O, Ca2+, and Mg2+ in the 0–20 cm topsoil layer in the mature forest, clear-cut, and reforested 1st–4th year Pinus sylvestris L. plantations. The data from three study sites (A, L, and V) were combined. The values followed by different letters a and b within each column indicate statistically significant differences between the sampling sites at p < 0.05.
Site DescriptionECTotal PTotal KTotal CaTotal Mg
(mS m–1)(mg kg–1)
Mature forest2.5 ± 0.1 ab195.6 ± 19.1 a146.3 ± 8.3 a186.7 ± 27.3 a242.4 ± 33.8 a
Clear-cut2.6 ± 0.2 ab232.3 ± 29.4 ab137.2 ± 7.9 a151.2 ± 9.6 a229.0 ± 27.8 a
1st year plantation3.6 ± 0.5 b302.8 ± 33.9 b145.4 ± 12.7 a191.5 ± 29.6 a228.8 ± 40.0 a
2nd year plantation2.6 ± 0.2 ab250.4 ± 14.5 ab122.6 ± 8.8 a179.7 ± 20.2 a248.2 ± 48.5 a
3rd year plantation2.3 ± 0.1 a231.9 ± 20.1 ab138.6 ± 9.3 a206.2 ± 19.4 a242.3 ± 41.1 a
4th year plantation2.9 ± 0.3 ab205.8 ± 11.9 a152.0 ± 6.1 a211.1 ± 21.0 a263.3 ± 24.7 a
ClP2O5K2OCa2+Mg2+
(mg kg–1)
Mature forest5.8 ± 0.2 a79.7 ± 9.2 a34.1 ± 2.9 a132.6 ± 10.8 ab41.8 ± 1.5 a
Clear-cut6.1 ± 0.4 a122.6 ± 26.2 ab35.3 ± 4.0 a121.3 ± 6.1 ab39.9 ± 2.1 a
1st year plantation6.7 ± 0.3 a169.1 ± 27.8 b36.6 ± 4.3 a122.8 ± 12.5 ab40.8 ± 3.1 a
2nd year plantation6.7 ± 0.4 a109.8 ± 12.1 ab31.3 ± 4.2 a120.4 ± 10.8 a37.7 ± 2.9 a
3rd year plantation6.7 ± 0.4 a101.0 ± 11.4 ab27.2 ± 2.4 a161.6 ± 9.7 b48.3 ± 5.6 a
4th year plantation6.9 ± 0.4 a107.9 ± 16.5 ab32.1 ± 3.8 a140.8 ± 12.3 ab50.6 ± 6.7 a
Table 3. Generated high-quality fungal sequences and detected diversity of the fungal taxa in the soil at different Pinus sylvestris L. sites in sampling sites. The data from the three study sites (A, L, and V) were combined.
Site DescriptionNo. of Fungal
Sequences
No. of Fungal TaxaShannon Diversity
Index H
Mature forest10,5234303.86
Clear-cut14,5344153.76
1st year plantation58463884.30
2nd year plantation78183924.00
3rd year plantation50783454.30
4th year plantation17,0995594.21
Total60,8981143
Table 4. Relative abundance and similarity of the 30 most common fungal OTUs (shown as a proportion of all the high-quality fungal sequences) in the soil samples from the Pinus sylvestris L. sites, representing mature forests, clear-cuts, and reforested 1st–4th year plantations; the data from three study sites (A, L, and V) were combined. The values followed by different letters within each row indicate statistically significant differences at p < 0.05.
OTUPhylum aReferencesSimilarity,
(%) b
Relative Abundance (%)
Mature ForestClear-Cut1st Year Plantation2nd Year Plantation3rd Year Plantation4th Year PlantationTotal
Archaeorhizomyces sp. 5425_1AMH248043207/207 (100)21.59 b18.52 ab5.03 ab0.97 a2.40 ab9.01 ab11.49
Helotiaceae sp. 5425_2AMK131613240/240 (100)1.84 a9.67 a2.51 a12.13 a5.45 a6.91 a6.82
Unidentified sp. 5425_18AMN902668258/258 (100)1.22 a4.67 a1.54 a3.61 a10.73 a8.30 a5.16
Oidiodendron chlamydosporicumAMG597466235/235 (100)2.26 ab6.31 b1.66 ab1.06 a5.71 ab7.94 b4.90
Penicillium camembertiAMT355566251/251 (100)3.24 a2.51 a2.10 a5.95 a6.64 a3.54 a3.67
Cladosporium sp. 5425_16AMT645945243/243 (100)4.68 a1.42 a5.61 a2.88 a4.21 a1.53 a2.84
Amanita fulvaBMT229863260/260 (100)2.14 a7.08 a----2.06
Jackrogersella multiformisAMT573483254/254 (100)9.52 a0.05 a1.54 a0.06 a1.93 a0.05 a1.99
Piloderma sphaerosporumBMK131527292/292 (100)1.45 a6.75 a-0.01 a0.10 a0.01 a1.88
Placynthiella oligotrophaAMK812378248/248 (100)0.02 a-0.10 a11.61 a0.10 a1.08 a1.81
Malassezia sp. 5425_17BMT594863369/369 (100)4.68 b0.96 ab2.82 ab0.84 a1.26 ab0.87 ab1.77
Unidentified sp. 5425_68AEU292507216/217 (99)0.29 ab-0.26 ab0.43 ab0.10 a5.22 b1.60
Mycena zephirusBMH856339304/304 (100)--16.08---1.54
Phanerochaete sp. 5425_7BKP135164293/293 (100)0.45 a0.94 ab6.55 b1.28 ab2.38 ab0.56 ab1.45
Cladophialophora minutissimaBMT644883313/313 (100)0.11 a0.21 a0.46 a8.14 a0.20 a0.97 a1.45
Thelephora terrestrisAMG597448253/254 (99)0.01 ab0.01 a0.65 ab-1.50 ab4.49 b1.45
Mortierella sp. 5425_53MHQ021936342/344 (99)1.59 a0.39 a0.33 a0.93 a2.58 a1.39 a1.12
Russula decoloransBMN992510359/359 (100)3.79 b1.73 ab0.03 a--0.05 ab1.08
Unidentified sp. 5425_0AJQ312914240/241 (99)0.68 a1.22 a1.03 a0.91 a1.44 a1.16 a1.07
Russula vinosaBMK838342366/367 (99)--0.02 a--3.63 a1.02
Collophora sp. 5425_14AMW449039244/244 (100)1.28 a0.72 a2.28 a0.69 a1.81 a0.45 a0.98
Xylaria hypoxylonAMK577428252/252 (100)4.41 b0.03 ab0.51 ab0.04 a0.85 ab0.04 ab0.90
Alternaria infectoriaAMT635276253/253 (100)0.29 a0.24 a1.80 a0.52 a2.09 a1.35 a0.90
Mortierella sp. 5425_47MMT601876293/293 (100)1.37 b0.50 ab0.19 a0.23 ab2.97 ab0.34 ab0.75
Cladophialophora sp. 5425_111AAB986417268/271 (99)-----2.540.71
Mortierella macrocystisMMH859487330/330 (100)0.45 ab1.14 b1.25 ab0.15 a1.34 ab0.30 ab0.68
Glonium pusillumAMT635300249/249 (100)0.48 a0.43 a0.94 a1.91 a0.51 a0.32 a0.65
Unidentified sp. 5425_67AHQ433092300/300 (100)0.13 ab1.86 b0.02 a0.18 ab0.02 a0.51 ab0.64
Solicoccozyma terricolaBMH487580329/329 (100)0.22 a0.52 a0.21 a1.04 a0.20 a1.06 a0.63
Lecanoromycetes sp. 5425_115AMT027951234/234 (100)0.07 a0.09 a0.31 a0.01 a0.96 a1.66 a0.61
Total of OTUs 68.2567.9655.8255.5957.4865.2663.63
a Ascomycota (A), Basidiomycota (B), Mucoromycota (M). b Sequence similarity column shows base pairs between the query sequence and the reference at GenBank, and the percentage of sequence similarity.
Table 5. Relative abundance and similarity of the 30 most common ectomycorrhizal (ECM) fungal OTUs in the soil samples from the Pinus sylvestris L. sites, representing mature forest stands, clear-cuts, and reforested 1st–4th year plantations; the data from three study sites (A, L, and V) were combined. The values followed by different letters within each row indicate statistically significant differences at p < 0.05.
OTUPhy-
lum a
ReferencesSimilarity, (%) bRelative Abundance (%)
Mature Forest Clear-Cut1st Year Plantation2nd Year Plantation3rd Year Plantation4th Year PlantationTotal
Amanita fulvaBMT229863260/260 (100)2.14 a7.08 a----2.06
Piloderma sphaerosporumBMK131527292/292 (100)1.45 a6.75 a-0.01 a0.10 a0.01 a1.88
Thelephora terrestrisBMT644883313/313 (100)0.01 ab0.01 a0.65 ab-1.50 ab4.49 b1.45
Russula decoloransBMN992510359/359 (100)3.79 b1.73 ab0.03 b--0.05 ab1.08
Russula vinosaBMK838342366/367 (99)--0.02 a--3.63 a1.02
Pseudotomentella sp. 5425_119BHM146848345/345 (100)-2.46----0.59
Elaphomyces cf. muricatusAKR029741287/288 (99)-2.20----0.53
Amphinema sp. 5425_155BMK838190288/288 (100)1.43 a0.01 a-0.04 a--0.25
Laccaria proximaBMN663149301/301 (100)--0.43 a-1.75 a0.08 a0.21
Tricholoma portentosumBLC375763304/304 (100)0.1a0.65 a-0.01 a0.02 a-0.19
Amanita pantherinaBMZ410633310/310 (100)0.13 a----0.59 a0.19
Russula vescaBMZ410735320/321 (99)0.76 a0.13 a-0.04 a--0.17
Russula albonigraBDQ422029321/321 (100)0.95-----0.16
Russula adustaBMG687346321/321 (100)-0.65 a0.07 a---0.16
Piloderma bicolorBMH809947283/283 (100)-0.65----0.15
Xerocomus badiusBMN947388284/284 (100)0.04 a-0.03 a--0.46 a0.14
Russula paludosaBLC192779358/358 (100)-0.44 a0.02 a---0.11
Pseudotomentella sp. 5425_255BMK290703316/316 (100)-0.36----0.09
Tomentella stuposaBMK838269313/314 (99)-0.30----0.07
Tricholoma virgatumBDQ389735302/302 (100)-0.30----0.07
Amanita porphyriaBMT345267296/296 (100)0.01 a0.21 a0.02 a---0.05
Cortinarius sp. 5425_463BMG597372303/305 (99)0.28-----0.05
Wilcoxina sp. 5425_54AMW238026257/257 (100)-0.01 a---0.11 a0.03
Pseudotomentella griseopergamaceaBMG597410321/321 (100)-----0.110.03
Russula aerugineaBMG680182301/301 (100)0.13 a0.01 a-0.04 a--0.03
Albatrellus sp. 5425_551BHQ204631330/338 (98)-0.12----0.03
Inocybe sp. 5425_176BMK838270303/303 (100)-----0.100.03
Piloderma olivaceumBMH864982281/281 (100)0.14 a0.01 a----0.03
Inocybe lutescensBMW845894295/295 (100)0.13 a0.01 a---0.01a0.03
Tylospora fibrillosaBMF926576287/287 (100)-0.10----0.02
Total of OTUs 11.5724.171.270.143.379.6310.89
a Ascomycota (A), Basidiomycota (B). b Sequence similarity column shows base pairs between the query sequence and the reference at GenBank, and the percentage of sequence similarity.
Table 6. Pearson’s correlation between chemical soil parameters (pHCaCl2, SOC, total N, P, K, Ca, and Mg, and also mobile Ca2+, Mg2+, and Cl) and the parameters of soil fungi in the studied sites.
VariablespHCaCl2SOC N P K Ca Mg Ca2+Mg2+Cl
g kg−1mg kg−1
No. of fungal sequences0.0500.0410.114−0.3420.2620.0990.327−0.079−0.1530.493
No. of fungal OTUs−0.2120.3210.3360.0110.3240.2990.3030.1520.1100.483
No. of mycorrhizal fungi−0.4130.518 *0.498 *−0.1770.4770.2250.4790.2120.0660.021
No. of pathogenic fungi−0.0280.0640.0870.263−0.0850.078−0.120−0.110−0.1810.389
No. of saprotrophic fungi−0.1730.2710.3500.2620.4060.4930.2980.4770.505 *0.206
No. of endophytes−0.2070.4360.3800.1410.4350.1420.3840.0680.1580.245
Shannon_H−0.2740.1830.0030.363−0.090−0.099−0.2000.1920.383−0.015
* Statistically significant correlations at p < 0.05.
Publisher’s Note: MDPI stays neutral with regard to jurisdictional claims in published maps and institutional affiliations.

