Article

Evaluation of Comprehensive Effect of Different Agroforestry Intercropping Modes on Poplar

1
Jilin Provincial Key Laboratory of Tree and Grass Genetics and Breeding, College of Forestry and Grassland Science, Jilin Agricultural University, Changchun 130118, China
2
State Key Laboratory of Tree Genetics and Breeding, Northeast Forestry University, Harbin 150040, China
3
Forestry Research Institute, Chinese Academy of Forestry, Beijing 100091, China
4
Forest Management Bureau of Changbai County in Jilin Province, Changbai 134400, China
*
Authors to whom correspondence should be addressed.
Forests 2022, 13(11), 1782; https://doi.org/10.3390/f13111782
Submission received: 23 August 2022 / Revised: 14 September 2022 / Accepted: 20 October 2022 / Published: 27 October 2022
(This article belongs to the Section Forest Ecology and Management)

Abstract

:
Forest–agriculture complex management is an efficient planting mode that can effectively improve soil utilization and bring greater economic value. However, this planting model has not yet been systematically carried out in the northeast of China. Thus, to provide a theoretical basis for agriculture and forestry intercropping in northeast China, the variation in the growth and wood characteristics of Populus cathayana × canadansis ‘xin lin 1’ and the economic benefits of intercropping crops under different intercropping patterns were analyzed. The results of a variance analysis show that there were significant differences in tree growth and wood characteristics among the different intercropping modes (p < 0.01). The variation coefficients of growth and wood characteristics ranged from 28.23% to 55.79% and 2.03% to 10.65%, respectively. There were significant correlations among tree height, diameter at breast height, ground diameter and wood volume of ‘P. ‘xin lin 1’, as well as between cellulose, hemicellulose, lignin, fiber length and fiber aspect ratio (r < 0.05). Meanwhile, we comprehensively evaluated intercropping modes based on growth traits such as tree height, chest diameter, diameter, wood volume and crown width. The ‘P. ‘xin lin 1’ + soybean’ mode proved to be the best intercropping mode, in which the gain of tree height, chest diameter, diameter, wood volume and crown width were 26.80%, 20.09%, 15.76%, 63.41% and 8.33%, respectively. When considering wood traits, the optimal intercropping pattern was ‘P. ‘xin lin 1’ + Cilantro + Cabbage’, but the gain of each wood trait in this pattern was not obvious compared with the total average. Among the six intercropping modes, ‘P. ‘xin lin 1’ + Watermelon + Chinese cabbage’ and ‘P. ‘xin lin 1’ + Cilantro + Chinese cabbage’ have the highest economic benefits, reaching 48,138 CNY/hm2 and 39,990 CNY/hm2, respectively. From our results, the poplar growth and wood characteristics under different intercropping modes are better than those of the pure forest, except for ‘P. ‘xin lin 1’ + Corn’, and each intercropping mode has higher economic benefits. These findings provide a scientific basis for alleviating the competition between local forestry and agriculture for land and address the selection of forestry and agricultural intercropping modes.

1. Introduction

Forest–agriculture complex management, also called agroforestry intercropping, is a promising strategy for improving land use efficiency and sustainable agriculture, enabling more efficient use of light, heat and water on land [1]. Traditionally, simplified agricultural systems lead to the loss of biodiversity, soil resilience and agroecosystem services, resulting in severe soil degradation, reduced crop yields and, in turn, deforestation in new areas in an attempt to fill gaps in food demand, ultimately leading to a series of new environmental problems [2,3]. In this context, the adoption of more diverse and intensive systems, such as trees combined with crops and/or livestock, can be an effective alternative to improve land use efficiency and agricultural sustainability [4]. In forest–agriculture complex management, plant yield and resource utilization efficiency are improved because of the complementarity between species so that light, heat and water can be more fully utilized. Compared with pure forests, forest–agriculture complex management can reduce soil moisture evaporation, improve soil condition and protect soil fertility [5]. Therefore, this planting mode can play a key role in alleviating the competition between agriculture and forestry for land and improving comprehensive benefits [6]. Combined management of forestry and agriculture can bring more economic, ecological and social benefits.
The growth status of forest trees is directly reflected by tree height, diameter at breast height (DBH) and crown width and is also the result of environmental and genetic factors in the test site [7,8]. As was previously reported, tree height and DBH are significantly higher under intercropping than without intercropping [9], although there is also a competitive relationship between forest trees and crops. For example, the shade created by forest trees affects the photosynthesis of crops under the forest, which in turn affects the growth and development of crops. There is also competition for resources such as nutrients and water [10]. Most studies have indicated that agroforestry is beneficial to tree growth [11,12]. How to reasonably control and choose the best forest–agriculture complex management configuration has become an urgent problem to be solved in current management.
Wood quality is quantitatively evaluated by wood properties such as wood density, wood strength, fiber length, fiber aspect ratio, cellulose content, hemicellulose content and lignin content [13]. Depending on the wood properties, wood uses are also inconsistent. Wood density is considered a heritable trait [14]. Wood density varies with soil, climatic environment and tree growth [15]. Wood density is the most important factor for wood quality. For pulp wood, wood density determines the output and quality of wood and fiber products, as well as the quality of paper and the pulp output per unit volume, fiber length and width of wood. It affects the structure of paper in the papermaking process and is closely related to the performance of pulp and paper [16,17]. The chemical composition of wood mainly includes cellulose, hemicellulose and lignin. The content of cellulose and hemicellulose is an important indicator for evaluating the value of pulp and paper. To improve pulp yield in the papermaking process, hemicellulose retained in pulp can increase pulp yield [18]; lignin has a large adverse effect on paper strength, and the lower the lignin content of wood is, the better its pulp and paper performance are [19].
Poplar has the characteristics of fast growth, early maturity, high yield and easy renewal. It is one of the fastest-growing timber tree species and has its largest cultivation area in the world’s midlatitude plains; it is most suitable for short-rotation industrial timber management. In 2016, the IPC (International Commission on Poplars and Other Fast-Growing Trees Sustaining People and the Environment) reported that the total area of planted poplars in the world had increased to 31.4 million ha [20]. Poplar wood is widely used in the production of pulpwood and plywood [21,22]. The objectives of this study were to (1) determine the variation of growth and wood properties for poplar in different intercropping modes, and (2) estimate the economic benefits in different modes and evaluate and select the best intercropping mode. This research was conducted to minimize the competition between forestry and agriculture combined management, give full play to its economic, ecological and social benefits, and alleviate competition for land between agriculture and forestry in northeast China.

2. Materials and Methods

2.1. Test Site and Materials

The test site is located in the state-owned Xinmin City Machinery Forest Farm, Xinmin City, Shenyang City, Liaoning Province (41°42′–42°17′ N, 122°27′–123°20′ E) and belongs to the temperate continental monsoon climate zone. The annual average temperature is 7.6 °C, the frost-free period is 151 days, and the mean annual rainfall is 656.5 mm. The soil texture is sandy loam, and the groundwater level is 1–3 m. The site is located on the alluvial plain of the Liaohe River, and the soil is mainly fine silt soil. The test material selects several intercropping modes mainly used by the local people for evaluation: P. cathayana × canadansis ‘xin lin 1’ + Watermelon + Chinese Cabbage (WC), P. cathayana × canadansis ‘xin lin 1’ + Corn (CO), P. cathayana × canadansis ‘xin lin 1’ + Soybean (SO), P. cathayana × canadansis ‘xin lin 1’ + Peanut (Pe), P. cathayana × canadansis ‘xin lin 1’ + Cilantro + Chinese Cabbage (CC) and pure forest planting (CK). P. cathayana × canadansis ‘xin lin 1’ was planted with roots and seedlings in the autumn of 2019, and the afforestation density was 2 m × 6 m. The area of intercropping for each model was 0.3 ha. The sample plots were randomly selected for each model, and the size of each plot was 72 m2. Three plots were selected for each mode. The experimental designs and fertilizations of different intercropping modes were shown in Table 1 and Table 2.

2.2. Determination of Growth Traits

In November 2021, the tree height (TH), ground diameter (GD), diameter at breast height (DBH) and crown width (CW) of P. cathayana × canadansis ‘xin lin 1’ under different models were investigated. A tower ruler was used to measure tree height; a tree-measuring steel perimeter was used to measure the ground diameter and diameter at breast height; and a measuring tape was used to measure the east–west crown width and the north–south crown width.
TH and DBH were used to calculate the volume per plant using the following formula [23]:
V = 0.00004119698 × D 1.3 1.9094595 × H 1.0413892
where V is the volume, D is the diameter at breast height and H is the tree height.

2.3. Wood Sample Collection and Determination of Wood Properties

For each intercropping mode, 6 trees with uniform growth were randomly selected, and the 20 cm lateral branches at the bottom end in the southeast direction were removed and brought back to the laboratory for the determination of wood properties. The wood segment was cut from the pith to 3 mm wide wood chips and split into thin strips the size of matchsticks. A mixed solution of nitric acid and chromic acid (10% concentrated nitric acid + 10% chromium trioxide solution) was used for isolation for 24 h [24]. The length (μm) and width (μm) of the fibers were measured under an optical microscope (10×), and 30 intact fibers were randomly selected for each wood sample. The basic density of each mode was determined with reference to the method of GB/T 1933–2009 [25]. The lignin content (%), cellulose content (%) and hemicellulose content (%) of the wood were determined by using an ANKOM A2000i automatic fiber analyzer with reference to the method of Ji [26].

2.4. Evaluation of Economic Benefit

Once the crops matured, the plots were tested for yield. Three plots were taken for each intercropping mode, and diagonal sampling was carried out. The sampling area was measured with a steel tape measure, and crop yield was weighed to the nearest gram. Crop weight unit area was then divided by the sampling area to estimate the yield per unit area. Crop yield was evaluated according to the data, and their price was calculated with reference to the average value of the local market circulation (http://pfsc.agri.cn/#/priceMarket. accessed on 5 November 2021). Estimated prices were as follows: watermelon: 1.6 CNY/kg; cilantro: 4 CNY/kg; cabbage: 0.4 CNY/kg; soybean: 6.6 CNY/kg; peanut: 6.2 CNY/kg; corn: 2.18 CNY/kg. The input–output ratio was calculated as the total output value divided by the total cost.

2.5. Statistical Analysis Methods

In this study, SPSS version 26.0 (IBM Corp., Armonk, NY, USA) was used for statistical testing, variance analysis and statistical calculation of experimental data, and the LSD method was used for multiple comparisons.
The ANOVA linear model is [27]:
X i j = μ + C i + e i j
where μ is the overall mean value, C i is the intercropping effect and e i j is the error effect.
The phenotypic coefficient of variation (PCV, %) was estimated using the following formula [28]:
P C V = S D / X × 100
where SD is the phenotype variance component of the trait and X is the average value of the trait.
The phenotypic correlation coefficient (r_p12) was calculated using the following formula [29]:
r p 12 = C o v p 12 σ p 1 2 σ p 2 2
where C o v p 12 denotes the phenotypic covariance between traits of 1 and 2, and σ p 1 2 and σ p 2 2 denote the phenotypic variance of traits 1 and 2, respectively.
The comprehensive analysis of multiple characters was computed using the comprehensive evaluation method of Wang et al. [30]:
Q i = j = 1 n a i , a i = X i j / X j m a x
where Q i is the value of colligation assessment, X i j is an average value of one trait, X j m a x is the maximum of the trait and n is the trait number.

3. Results

3.1. Analysis of Variance

A variance analysis was performed on the growth and wood properties of P. cathayana × canadansis ‘xin lin 1’ under different intercropping modes, and the results are shown in Table 3. In this study, there was abundant variation in tree growth traits among the intercropping modes. Among these intercropping modes, TH, DBH, GD, V and CW of P. cathayana × canadansis ‘xin lin 1’ were significantly different (p < 0.01). The variation coefficient of each growth trait ranged from 28.23% to 55.79%. The variation coefficient of V is the largest, reaching 55.79%. There was abundant variation in wood properties among the intercropping modes. Except for cellulose, which differed significantly among the different intercropping modes (0.01 < p < 0.05), all other wood characteristics exhibited extremely significant differences among different intercropping modes (p < 0.01). The coefficient of variation ranged from 2.03% to 10.65%, among which the coefficient of variation of fiber length was the largest, at 10.65%.

3.2. Average Values of Growth Traits in Different Intercropping Modes

The results of a multiple comparison analysis of the growth traits of P. cathayana × canadansis ‘xin lin 1’ under different intercropping modes are shown in Table 4. The tree heights of SO were significantly different from those of the other intercropping modes. There was no significant difference in diameter at breast height between SO, WC and CC, but it was significantly different from CO and CK. There was no significant difference in ground diameter between SO, WC, PE and CC. There were significant differences between CO and CK. There were significant differences in volume between SO and the other intercropping modes. Furthermore, tree crown width in CC was significantly different from that of the other intercropping modes.
The means of tree growth traits in different intercropping modes are shown in Table 4. The results show that the tree height, diameter at breast height, basal diameter and volume in SO all reached the maximum values across different modes, which were 7.46 m, 6.70 cm, 9.68 cm and 0.0131 m3, respectively. The tree height, DBH, basal diameter and volume in CO were the lowest; they were 4.56 m, 3.26 cm, 4.76 cm and 0.0021 m3, respectively. The tree height, diameter at breast height, basal diameter and volume of SO were 57.72%, 47.90%, 40.49% and 236.90% higher than those of CK, respectively. The crown width reached 2.72 m, which was 15.74% higher than that of CK.

3.3. Average Values of Wood Traits in Different Intercropping Modes

The average values of the wood traits in all intercropping modes are shown in Figure 1. It can be seen from the figure that the hemicellulose content of CO is 14.45%, which is significantly lower than that of the other intercropping modes. The cellulose contents of CO and CC were 58.97% and 58.74%, respectively, which were significantly higher than those of SO and PE. The lignin contents of SO and PE were the highest, reaching 16.80% and 17.36%, respectively, and were significantly higher than those of the CK, CO and CC treatments. The wood densities of CK and CO were the lowest; they were 0.334 g/cm3 and 0.320 g/cm3, respectively, and were significantly lower than those of the other intercropping modes. Regarding fiber lengths, CK and WC were the shortest, at 634.76 μm and 603.34 μm, respectively. These fiber lengths were significantly lower than those of the other four intercropping modes. The fiber aspect ratios of CK and WC were the smallest; they were 25.22 and 23.98, respectively, and they were significantly lower than those of the CO, PE and CC modes.

3.4. Correlation Analyses between Different Traits

Table 5 shows the results of the correlation analysis between different traits. There was a significant positive correlation among tree height, diameter at breast height, basal diameter, volume, crown width and basic density (0.531~0.977). There were significant positive correlations between lignin and tree height (0.542), lignin and diameter at breast height (0.422), lignin and basal diameter (0.455), and lignin and volume. Additional significant positive correlations were found between cellulose and fiber length (0.337), cellulose and fiber aspect ratio (0.415), hemicellulose and crown width (0.365), and hemicellulose and basic density (0.542). There were significant negative correlations between cellulose and tree height (−0.330), cellulose and hemicellulose (−0.420), and lignin and fiber aspect ratio (−0.348). Fiber length was strongly correlated with fiber aspect ratio, with correlation coefficients ranging from 0.894. There was a significant negative correlation between lignin and cellulose, with a correlation coefficient of 0.910. The correlations among other traits did not reach a significant level.

3.5. Comprehensive Evaluation of Different Traits

Due to the low correlation coefficients between growth traits and wood properties, superior intercropping modes were selected by evaluating their growth characteristics (TH, DBH, GD, V and CW) and wood properties (cellulose, hemicellulose, lignin, fiber length and basic density) separately. In order to avoid the one-sidedness and instability resulting from selection on a single trait, the method of comprehensive evaluation of multiple traits was used. The Qi values of the different intercropping modes are shown in Table 6. According to the comprehensive evaluation results of growth traits, SO was the optimal intercropping mode. Its average tree height was 7.46 m, which was 2.73 m higher than that of CK. The mean value of DBH was 6.70 cm, which was 2.17 cm higher than that of CK. The average ground diameter of SO was 9.68 cm, which was 40.37% higher than that of CK. The average volume of SO was 0.013 m3, which was 237.01% higher than that of CK. According to the comprehensive evaluation results of wood properties, CC was the best model. Its hemicellulose, cellulose and lignin were not significantly increased compared to those of CK. The fiber length and basal density of CC were higher than those of CK, at 12.09% and 11.14% higher, respectively.

3.6. Analysis of the Economic Benefit of Intercropping

The results of an economic analysis of different intercropping modes are shown in Table 7. WC had the highest total investment, reaching 78,462 CNY/hm2, followed by CC, which reached 54,210 CNY/hm2. These two modes were 22.7 and 15.7 times the total input of SO (3447 CNY/hm2). The intercropping mode with the highest net profit was WC, which had a net profit of 48,138 CNY/hm2, followed by CC, which produced 39,990 CNY/hm2. WC and CC net profits were 342% and 284% higher than those of the intercropping mode with the lowest net profit (CO: 14,085 CNY/hm2), respectively. The intercropping modes with the highest input–output ratios were SO (5.40), followed by CO (3.54) and WC, which was the lowest (1.61). CK was not intercropped, and its economic input and profit were both 0 CNY/hm2.

4. Discussion

Analysis of variance, as an important method for estimating the degree of variation in breeding populations, is of great significance to genetic improvement and breeding of forest trees [31,32]. The results of variance analysis in this study show that there were significant differences in each trait among different intercropping patterns, indicating that different intercropping patterns had significant effects on the growth and wood quality of P. cathayana × canadansis ‘xin lin 1’. This is consistent with the results of Silvano Kruchelski et al. [33] regarding the TH, DBH and basic density of Eucalyptus benthamii in different intercropping systems, as well as Wang [34], who researched TH and DBH under different crops of Populus tomentosa. The coefficient of variation is a widely used small-scale variability measure that can reflect the genetic variation of traits in a population. The larger the coefficient of variation is, the more conducive it is to the screening of high-quality materials [35]. In this study, the ranges of PCV of growth traits and wood traits were 18.23%~55.79% and 2.03%~10.65%, respectively. Among these traits, DBH, GD and V exhibited high coefficients of variation, while TH and CW also reached moderate coefficients of variation [36], indicating great room for genetic improvement. These results show that indices such as volume have more potential to indicate the optimal intercropping pattern.
Differences in the composition and habitat of different cultivation patterns affect the growth of the same plant [37]. In this study, the tree height, diameter at breast height, ground diameter and volume under intercropping of soybean, peanut, cilantro + cabbage and watermelon + cabbage were significantly improved compared with those of treatments without intercropping, indicating that intercropping crops promotes forest growth. These findings are related to the results of Yuan [38] and Jiang [9], who show that the growth traits after intercropping of P. tomentosa are consistent. Among the intercropping treatments, TH, DBH, GD and V were highest in SO, indicating that intercropping soybean could better promote tree growth This growth-promoting effect may be related to the root system of legumes harboring rhizobia, which enhance the nitrogen fixation ability of plants. Rhizobia promote an increase in soil nitrogen content, thus promoting the growth of non-leguminous crops [39,40]. Although peanut, as a leguminous crop, can promote plant growth in the intercropping system, it has a weaker effect in intercropping compared with other legume crops [41]. The growth of trees under intercropping maize was the weakest, which may be because maize, as a fast-growing high-stalk crop, absorbs a large amount of nutrients and light during the growing season, which causes interspecific competition and inhibits the growth of trees. This is consistent with the research of Su [42] and others on walnut–maize intercropping.
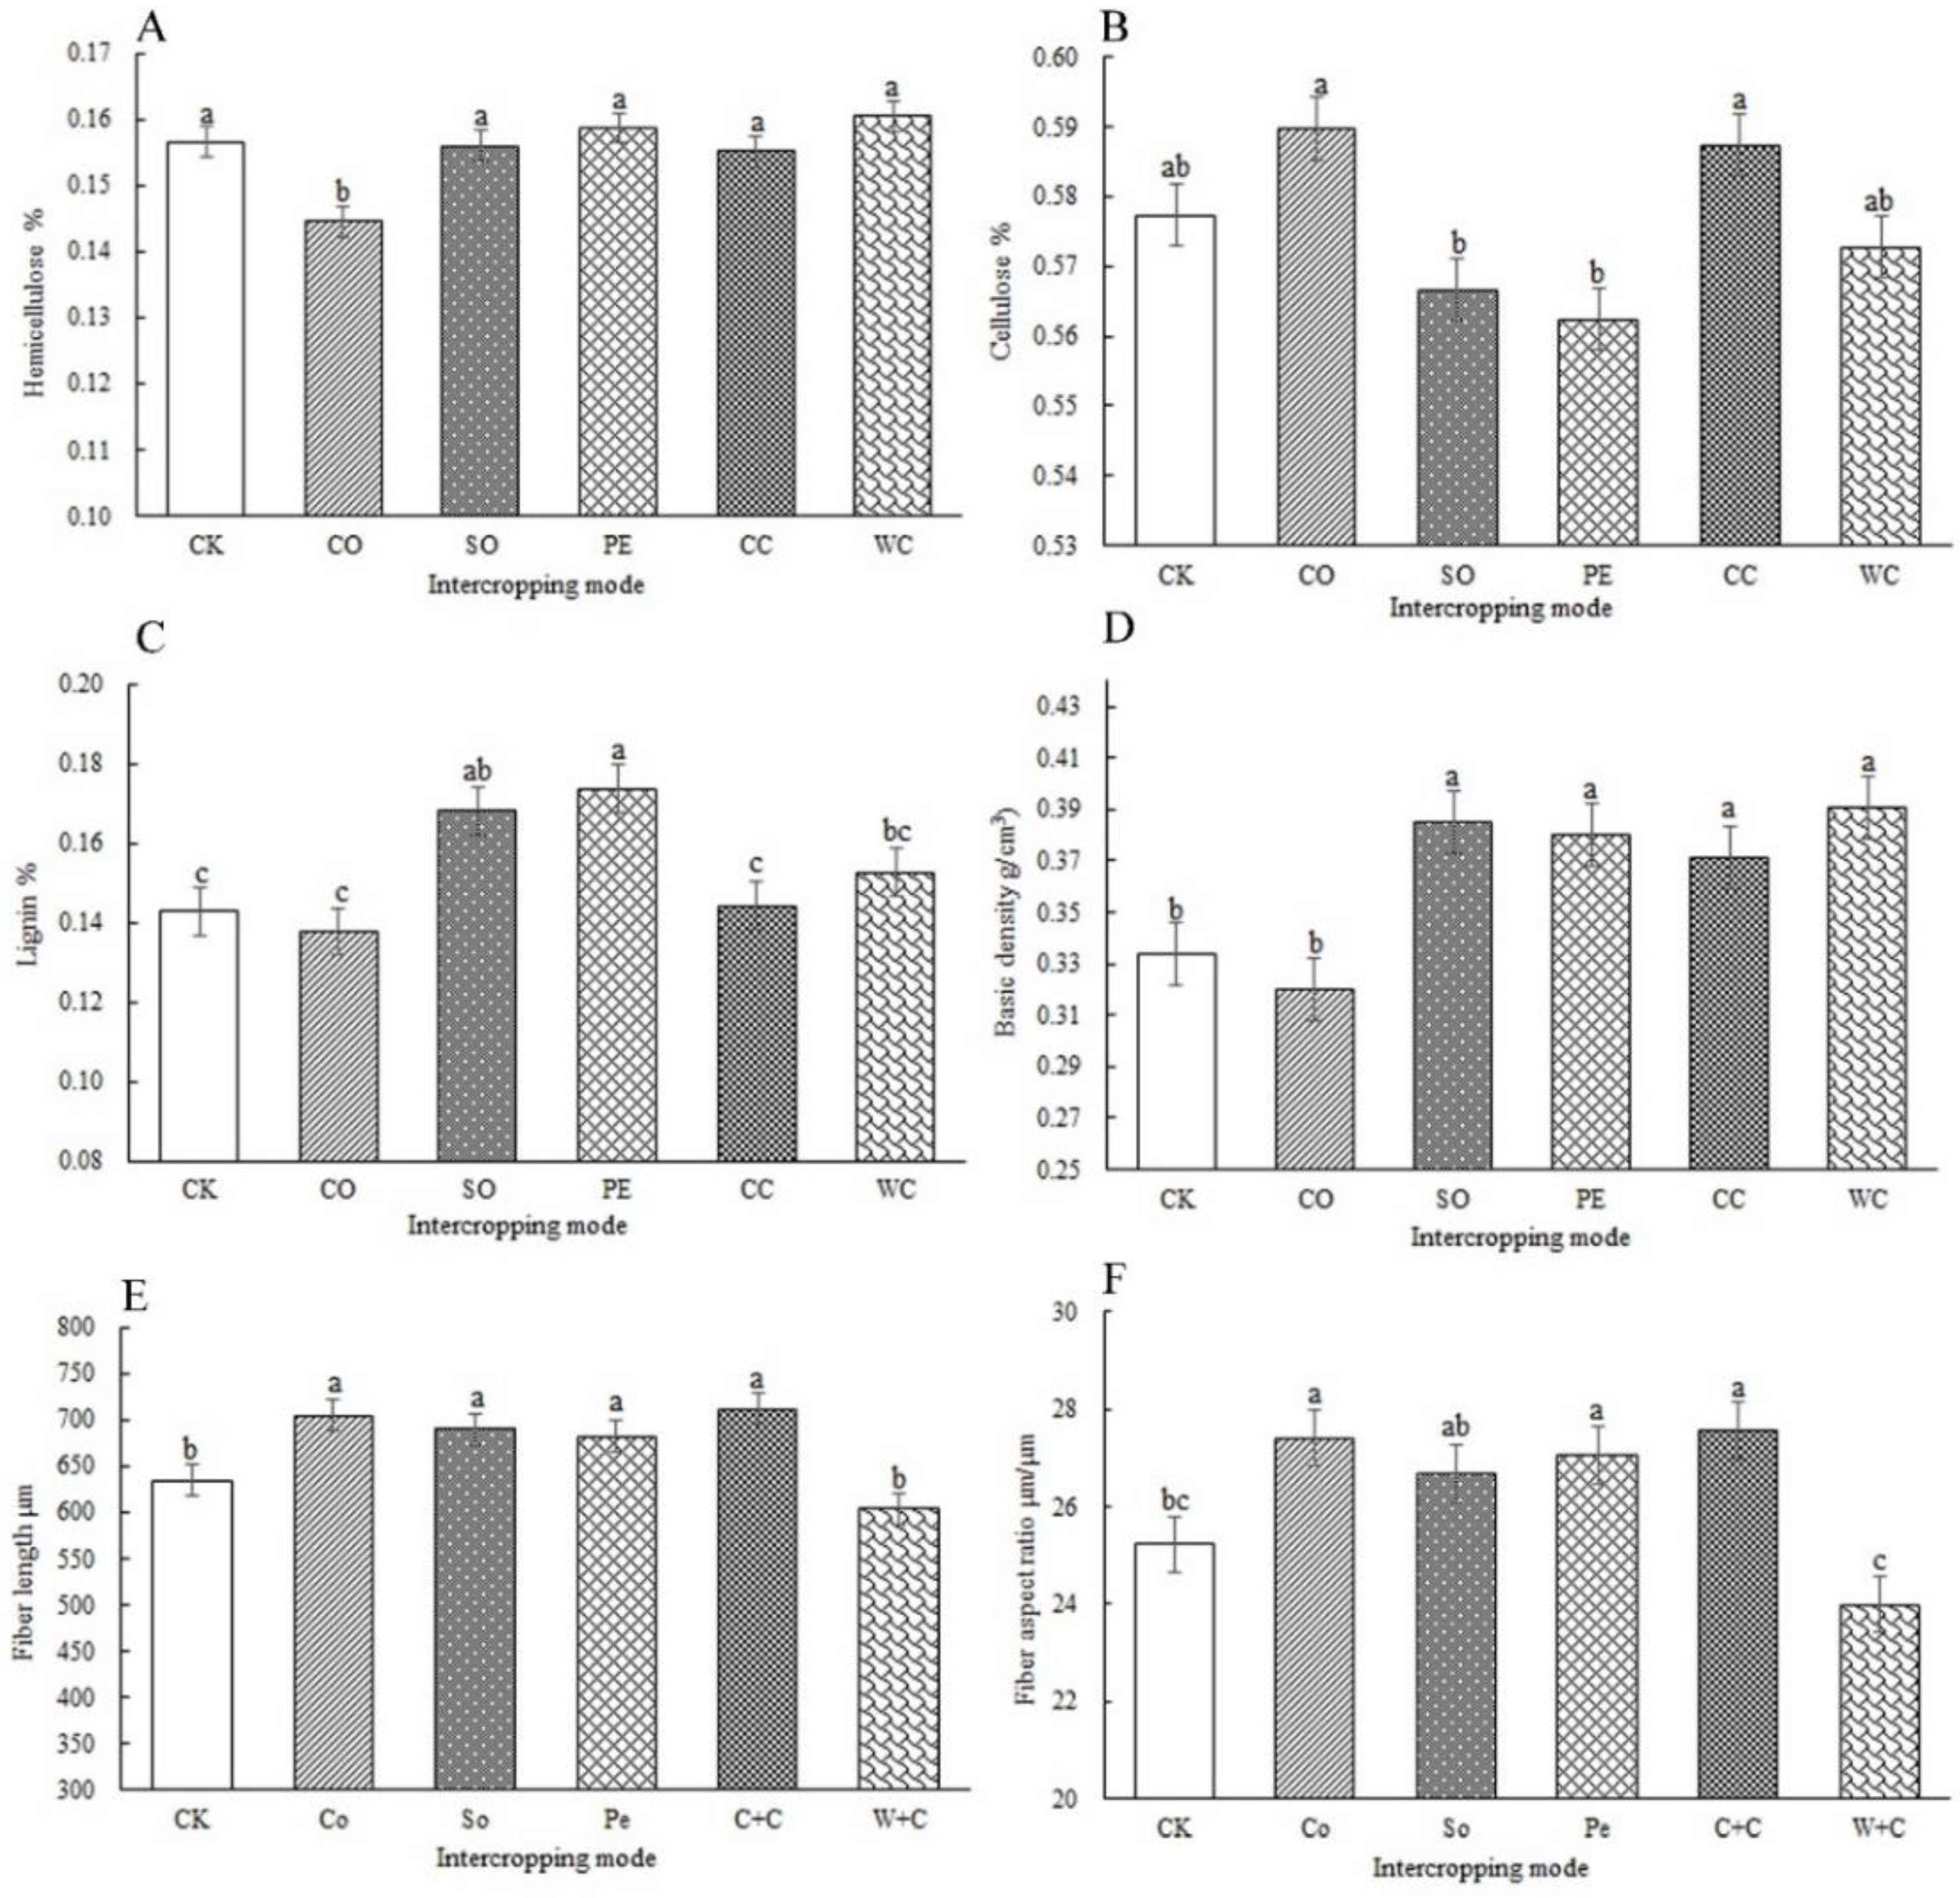
The wood’s chemical properties (cellulose, hemicellulose, lignin), basic density and anatomical properties (fiber length, fiber aspect ratio) directly affect pulp performance and paper quality [43,44]. Among the chemical properties of wood, cellulose content plays a decisive role in pulp yield. The higher the cellulose content is, the higher the pulp yield is. In contrast, an excessively high lignin content reduces the quality of the paper and adversely affects production [45]. In this study, the wood cellulose and lignin contents were 56.24%~58.97% and 13.78%~17.36%, respectively. This result is superior to that found by Lu [16] in P. deltoides clones and by Shen [46] in the F1 generation of Eucalyptus urophylla × Eucalyptus grandis hybrids. This indicates that the pulp yield and paper quality of the materials in this study are higher. There is a positive correlation between wood density and pulp yield; that is, the higher the wood density is, the higher the pulp yield in papermaking is [47]. In this study, the wood basic density of WC was the highest, reaching 0.391 g/cm3. This density is similar to that found by Lv et al. [48] in 25-year-old P. deltoides. The tree age of the material in this study is 2-years-old. Since wood density increases as trees age [49,50], when trees reach the peak of their growth, their basic density may be higher, which has guiding significance for the production of high-yield pulpwood. In this study, the range of fiber length and fiber aspect ratio was 603.34~711.52 μm and 23.98~27.55, respectively, which was consistent with the results of Jin [51] regarding the fiber length and fiber aspect ratio of different clones of P. ussuriensis.
In this study, the correlation coefficient between the height, DBH, ground diameter and volume of P. cathayana × canadensis ‘xin lin 1’ was extremely significant and positive. The cellulose content was significantly correlated with hemicellulose, lignin, fiber length and fiber aspect ratio. However, in the correlations between other wood traits, most growth traits and wood traits did not reach significance, which is similar to the results of Wei [52] on P. tomentosa. Since most of the correlations between growth traits and wood traits were not significant, and because tree growth traits and wood traits may be inherited independently, this study separately evaluated growth traits and wood traits in the evaluation of different intercropping modes.
The comprehensive evaluation and analysis of multiple traits avoided the one-sidedness and instability of a single indicator [53]. The purpose of cultivation can differ, and the focus of a comprehensive evaluation differs too [54,55]. In this study, the results of the correlation analysis were used to select the comprehensively evaluated traits. The Qi value was calculated by using the standardized data of different traits, and the results were more significant. From the results of the comprehensive evaluation of multiple traits, it can be seen that the intercropping patterns were evaluated with growth traits and indicators of wood traits. The optimal intercropping patterns differed depending on their application. For the purpose of cultivating a high pulp yield, the intercropping mode with large growth should be selected (SO). To maximize paper quality, the intercropping mode with a high cellulose content and low lignin content should be selected (CC).
The main purpose of intercropping agriculture and forestry is to change the management mode of traditional systems and improve the economic benefits of management. In this study, the economic yield of each intercropping model was higher than that of CK, which is consistent with the research results of Cao et al. [56] on four different forest–agriculture composite models. The economic benefits of WC and CC were the highest, reaching 48,138 CNY/hm2 and 39,990 CNY/hm2, respectively. These profits well exceeded those of the other three intercropping modes considered here. The ROI is the main indicator used to measure economic benefits. The success of intercropping between agriculture and forestry mainly depends on whether it improves the output value and economic benefits of operation [57]. Among the intercropping modes, WC and CC had the highest economic benefits, but their ROI was relatively low. This pattern is mainly due to the relatively high economic input in these two modes, indicating that the planting cost of these two intercropping modes is relatively high, but the planting profit is also relatively high. The ROI of SO was the highest, but its economic benefit was relatively low due to its low economic input. Therefore, SO is suitable for low-cost planting, but the planting profit is reduced accordingly.

5. Conclusions

The complex management of forestry and agriculture can effectively alleviate competition between forestry and agriculture for land, improve the productivity of forest trees, increase the efficiency of resource utilization and the economic status of farmers, and boost development potential. In this study, tree growth traits were analyzed. The results show that, with the exception of CO, the growth of intercropping modes was significantly improved compared with CK. Among these intercropping modes, the tree growth of SO was the fastest. The analysis of wood properties showed that intercropping of different crops had significant effects on the basic density, fiber quality and chemical properties of forest trees. Through a correlation analysis, the intercropping patterns were comprehensively evaluated using multiple wood and growth characteristics. The two intercropping patterns of SO and CC were screened out for demonstrating potential to have a high pulp yield and high paper quality, respectively. The economic benefits of each intercropping mode were analyzed, and the results show that the economic benefits of the two intercropping modes of WC and CC were highest, but the input cost was high. In contrast, SO economic benefits were relatively low, but the input cost was also low. The screening and evaluation of the local intercropping mode provide a scientific basis and scientific research support for the local people to choose an intercropping mode, further optimize the local intercropping type, and bring higher and more stable economic income to the people.

Author Contributions

X.Z. and X.P. designed the experiments and revised the manuscript; X.L. completed the experiment and wrote the manuscript; C.D. completed the analysis of the data, L.J., H.Y., R.H., G.Q. and C.L. completed the revision of the manuscript, J.X., B.L. and Z.Z. participated in the growth and wood determination. All authors have read and agreed to the published version of the manuscript.

Funding

This research was funded by [The National Key Research and Development Program of China] grant number [2021YFD2201204].

Conflicts of Interest

The authors declare no conflict of interest.

References

  1. Cheng, P.; Cao, F.L.; Wang, G.B. The progress of study on agroforestry. J. Nanjing For. Univ. (Nat. Sci. Ed.) 2010, 34, 151–156. [Google Scholar] [CrossRef]
  2. Hufnagel, J.; Reckling, M.; Ewert, F. Diverse approaches to crop diversification in agricultural research. A review. Agron. Sustain. Dev. 2020, 40, 3–17. [Google Scholar] [CrossRef]
  3. Lambin, E.F.; Geist, H.J.; Lepers, E. Dynamics of land-use and land-cover change in tropical regions. Annu. Rev. Environ. Resour. 2003, 28, 205–241. [Google Scholar] [CrossRef] [Green Version]
  4. Damian, J.M.; Firmano, R.F.; Cherubin, M.R.; Pavinato, P.S.; de Marchi Soares, T.; Paustian, K.; Cerri, C.E.P. Changes in soil phosphorus pool induced by pastureland intensification and diversification in Brazil. Sci. Total Environ. 2020, 703, 135463. [Google Scholar] [CrossRef] [PubMed]
  5. Xiao, H.; Wang, Y.; Luo, S. Functions and assessment methods of protecting soil fertility of agro-forestry ecosystems. Chin. J. Eco-Agric. 2008, 16, 1225–1229. [Google Scholar] [CrossRef]
  6. Hong, Y.; Heerink, N.; Jin, S.; Berentsen, P.; Zhang, L.; van der Werf, W. Intercropping and agroforestry in China—Current state and trends. Agric. Ecosyst. Environ. 2017, 15, 52–61. [Google Scholar] [CrossRef]
  7. Egbäck, S.; Liziniewicz, M.; Högberg, K.A.; Ekö, P.M.; Nilsson, U. Influence of progeny and initial stand density on growth and quality traits of 21 year old half-sib Scots pine (Pinus sylvestris L.). For. Ecol. Manag. 2012, 15, 1–7. [Google Scholar] [CrossRef]
  8. Saenger, P.; West, P.W. Phenotypic variation of the mangrove species Avicennia marina (Forssk.) Vierh. from seven provenances around Australia. Aquat. Bot. 2018, 149, 28–32. [Google Scholar] [CrossRef]
  9. Wu, B.; Jiang, Y.; Li, C.; Zhang, Q.; Liu, C.; Liu, J.; Zhang, S.; Liu, S.; Li, Y.; Wen, J.; et al. Effects of tree-crop intercropping on young plantations of Populus tomentosa. J. Beijing For. Univ. 2006, 28, 81–85. [Google Scholar] [CrossRef]
  10. Pallardy, S.G.; Gillespie, A.R.; Jose, S. Interspecific interactions in temperate agroforestry. Agrofor. Syst. 2004, 61, 237–255. [Google Scholar] [CrossRef]
  11. Qin, Z. Studying on Agro-Forestry Models of Young Taiwania flousiana Plantation. Master’s Thesis, Guangxi University, Nanning, China, 2013. [Google Scholar]
  12. Yang, C.; Li, J.; Huang, J.; Zhang, Z. Research of agroforestry compound management model and general benefits on Dongting Lake marshland plantation. J. Cent. South Univ. For. Technol. 2017, 37, 106–112. [Google Scholar] [CrossRef]
  13. Yin, H.; Liu, Q.; Zhou, Z.; Wan, X.; Yu, Q.; Fen, Z. Genetic variation of wood basic density and fiber morphology and selection of Pinus massoniana. J. Zhejiang A F Univ. 2020, 37, 1186–1192. [Google Scholar] [CrossRef]
  14. Nabais, C.; Hansen, J.K.; David-Schwartz, R.; Klisz, M.; Lopez, R.; Rozenberg, P. The effect of climate on wood density: What provenance trials tell us? For. Ecol. Manag. 2018, 408, 148–156. [Google Scholar] [CrossRef]
  15. Rocha, S.M.G.; Vidaurre, G.B.; Pezzopane, J.E.M.; Almeida, M.N.F.; Carneiro, R.L.; Campoe, O.C.; Scolforo, H.F.; Alvares, C.A.; Neves, J.C.L.; Xavier, A.C. Influence of climatic variations on production, biomass and density of wood in eucalyptus clones of different species. For. Ecol. Manag. 2020, 473, 118290. [Google Scholar] [CrossRef]
  16. Lu, W.H. Study on Variation of Wood Properties of Poplar Clones in Populus deltoides Marsh. Master’s Thesis, Nanjing Forestry University, Nanjing, China, 2008. [Google Scholar]
  17. Li, Y.X. The Genetic Variation and Multi-Trait Associated Selection of the Growth Traits and Material Quality Traits of the Excellent Progenies of Larix Olgensis. Master’s Thesis, Northeast Forestry University, Nanjing, China, 2012. [Google Scholar]
  18. Downes, G.M.; Hudson, I.L.; Raymond, C.A.; Dean, G.H.; Michell, A.J.; Schimleck, L.R.; Evans, R.; Muneri, A. Sampling Plantation Eucalypts for Wood and Fibre Properties; CSIRO Publishing: Collingwood, VIC, Australia, 1997. [Google Scholar]
  19. Luo, J.Z. Genetic and Environmental Effects of Eucalypt Hybrid Clones on Pulpwood Traits. Ph.D. Thesis, Nanjing Forestry University, Nanjing, China, 2012. [Google Scholar]
  20. Food and Agricultural Organization (FAO). Poplars and other fast-growing trees—Renewable resources for future green economies. Synthesis of Country Progress Reports. In Proceedings of the 25th Session of the International Poplar Commission, Berlin, Germany, 13–16 September 2016; Available online: http://www.fao.org/3/a-mt504e.pdf (accessed on 27 November 2021).
  21. El Haouzali, H.; Marchal, R.; Bléron, L.; Butaud, J.C.; Kifani-Sahban, F. Some properties of plywood produced from 10 cultivars of poplar. Int. Wood Prod. J. 2020, 11, 101–106. [Google Scholar] [CrossRef]
  22. Qin, N.; Yu, X.; Wei, J.; Shu, X.; Du, Q.; Qin, G.; Dong, Y. Integrative evaluation of wood pulping propertiesin poplar clones. Prot. For. Sci. Technol. 2021, 3, 4–7. [Google Scholar] [CrossRef]
  23. Li, Z.X.; Li, K.L. Geography, climate variability regularity of Populus ussuriensis Kom. growth traits. J. Anhui Agric. Sci. 2014, 42, 4. [Google Scholar] [CrossRef]
  24. Zhang, H. Study on Provenance Test of 39-Year-Old Larix Olgensis. Master’s Thesis, Northeast Forestry University, Harbin, China, 2021. [Google Scholar]
  25. GB/T 1933-2009; Method for Determination of Destiny of Wood. Standards Press of China: Beijing, China, 2009; Standardization Administration of the People’s Republic of China.
  26. Ji, K.B. Study on Content Determination Method and Structural Characterization of Lignin in Tobacco Stem. Master’s Thesis, South China University of Technology, Guangzhou, China, 2013. [Google Scholar]
  27. Xu, J.R. Trees Quantitative Genetic; China Forestry Publishing House: Beijing, China, 2006; Volume 31, p. 55. [Google Scholar]
  28. Metougui, M.L.; Mokhtari, M.; Maughan, P.J.; Jellen, E.N.; Benlhabib, O. Morphological Variability, Heritability and Correlation Studies within an Argan Tree Population (Argania spinosa (L.) Skeels) Preserved in situ. Int. J. Agric. For. 2017, 7, 42–51. [Google Scholar] [CrossRef]
  29. Zhao, X.; Hou, W.; Zheng, H.; Zhang, Z. Analyses of genotypic variation in white poplar clones at four sites in China. Silvae Genet. 2013, 62, 187–195. [Google Scholar] [CrossRef] [Green Version]
  30. Wang, F.; Zhang, Q.; Tian, Y.; Yang, S.; Wang, H.; Wang, L.; Li, Y.; Zhang, P.; Zhao, X. Comprehensive assessment of growth traits and wood properties in half-sib Pinus koraiensis families. Euphytica 2018, 214, 2–15. [Google Scholar] [CrossRef]
  31. Zhang, H.; Zhang, Y.; Zhang, D.; Dong, L.; Liu, K.; Wang, Y.; Yang, C.; Chiang, V.L.; Tigabu, M.; Zhao, X. Progeny performance and selection of superior trees within families in Larix olgensis. Euphytica 2020, 216, 60. [Google Scholar] [CrossRef]
  32. Li, C.X. Biostatistics, 5th ed.; Science Press: Beijing, China, 2013. [Google Scholar]
  33. Kruchelski, S.; Trautenmüller, J.W.; Deiss, L.; Trevisan, R.; Cubbage, F.; Porfírio-da-Silva, V.; de Moraes, A. Eucalyptus benthamii Maiden et Cambage growth and wood density in integrated crop-livestock systems. Agrofor. Syst. 2021, 95, 1577–1588. [Google Scholar] [CrossRef]
  34. Bogdan, S.; Katičić-Trupčević, I.; Kajba, D. Genetic variation in growth traits in a Quercus robur L. open-pollinated progeny test of the slavonian provenance. Silvae Genet. 2004, 53, 198–201. [Google Scholar] [CrossRef] [Green Version]
  35. Dongliang, W.K.F.M.; Song, L. Nonparametric interval estimators for the coefficient of variation. Int. J. Biostat. 2018, 14, 20170041. [Google Scholar] [CrossRef]
  36. Meena, B.L.; Das, S.P.; Meena, S.K.; Kumari, R.; Devi, A.G.; Devi, H.L. Assessment of GCV, PCV, heritability and genetic advance for yield and its components in field pea (Pisum sativum L.). Int. J. Curr. Microbiol. Appl. Sci. 2017, 6, 1025–1033. [Google Scholar] [CrossRef] [Green Version]
  37. Peng, F.; Li, J.; Zhang, J.; Shen, B. Studies on biomass productivity of three different agroforestry models in seacoast area. J. Nanjing For. Univ. 2000, 24, 78–82. [Google Scholar] [CrossRef]
  38. Yuan, Y.; Pei, B.; Jia, Y.; Wang, D.; Wang, W.; Wang, Y. Study on poplar growth under agro-silvicultural intercropping conditions. Sci. Silvae Sin. 2000, 1, 44–50. [Google Scholar] [CrossRef]
  39. Flores-Sanchez, D.; Pastor, A.; Lantinga, E.A.; Rossing WA, H.; Kropff, M.J. Exploring maize-legume intercropping systems in Southwest Mexico. J. Sustain. Agric. 2013, 37, 739–761. [Google Scholar] [CrossRef]
  40. Zhang, Y.; Liu, J.; Zhang, J.; Liu, H.; Liu, S.; Zhai, L.; Wang, H.; Lei, Q.; Ren, T.; Yin, C. Row Ratios of Intercropping maize and soybean can affect agronomic efficiency of the system and subsequent wheat. PLoS ONE 2015, 10, e129245. [Google Scholar] [CrossRef]
  41. Wang, G.; Wu, M.; Wang, D.; Wei, J.; Wu, B.; Wu, W.; Chen, Z.; Dong, R. Effects of plant growth and nitrogen absorption in the rubber-legume crops intercropping system. Chin. J. Trop. Agric. 2021, 41, 16–22. [Google Scholar] [CrossRef]
  42. Su, K.; Ma, Y.; Liao, C.; Xu, Y.; Wang, B.; Ye, C.; Hu, H. Effects of walnut||Maize Intercropping on Photosynthetic Day Changes, Overground Part and Root Characteristics of Plant. Molecular Plant Breeding. Available online: https://kns.cnki.net/kcms/detail/46.1068.S.20210317.1159.006.html (accessed on 27 November 2021).
  43. Ona, T.; Sonoda, T.; Ito, K.; Shibata, M.; Tamai, Y.; Kojima, Y.; Ohshima, J.; Yokota, S.; Yoshizawa, N. Investigation of relationships between cell and pulp properties in Eucalyptus by examination of within-tree property variations. Wood Sci. Technol. 2001, 35, 229–243. [Google Scholar] [CrossRef]
  44. Beveren, K.V.; Hudson, I.; Wilson, L. Vessel and fibre property variation in Eucalyptus globulus and Eucalyptus nitens: Some preliminary results. Iawa J. 1998, 19, 111–130. [Google Scholar] [CrossRef]
  45. Huang, Q.; Su, X.; Ma, C.; Liu, Z.; Wang, Y. The wood quality characteristics and the bio pulping feasibility of minoritarian coppice shoot of poplar. For. Res. 2008, 21, 74–78. [Google Scholar] [CrossRef]
  46. Shen, L.; Xu, J.; Li, G.; Wu, S.; Bai, H.; Liang, G. Genetic analysis for wood traits and chemical composition in Eucalyptus urophylla × E. grandis F1 hybrids. J. Cent. South Univ. For. Technol. 2020, 40, 143–149. [Google Scholar] [CrossRef]
  47. Nezu, I.; Ishiguri, F.; Aiso, H.; Diloksumpun, S.; Ohshima, J.; Iizuka, K.; Yokota, S. Selection of Eucalyptus camaldulensis families for sustainable pulpwood production by means of anatomical characteristics. Forests 2020, 12, 31. [Google Scholar] [CrossRef]
  48. Liu, Y.; Fang, S.; Tian, Y.; Xu, X. Genetic variation in growth and wood properties for southern type poplar clones. J. Nanjing For. Univ. (Nat. Sci. Ed.) 2018, 42, 20–26. [Google Scholar] [CrossRef]
  49. Zhang, X.; Yu, Q.; Zhang, W.; Zhao, L.; Zhang, L.; Luo, G.; Jia, Q.; Jia, Z. Study on wood physical properties and growth process of different tree age of Pinus tabulaeformis building timber forest. J. Cent. South Univ. For. Technol. 2020, 40, 122–131. [Google Scholar] [CrossRef]
  50. Gu, Y.; Zhong, L.; Luo, J.; Cao, X. Research on correlations of wood quality properties with height positions and ages of Populus deltoide × P. nigra cv. chile plants. J. Southwest For. Coll. 2007, 27, 61–65. [Google Scholar] [CrossRef]
  51. Jin, J.J. Genetic Variation of Wood Properties and Comprehensive Selection for Superior Clones on Populus ussuriensis Kom. Master’s Thesis, Northeast Forestry University, Harbin, China, 2019. [Google Scholar]
  52. Wei, Z. Study on Interitance and Variation in Growth and Wood Properties of Populus Tomentosa Clones. Master’s Thesis, Henan Agricultural University, Zhengzhou, China, 2005. [Google Scholar]
  53. Zhao, X.Y. Study on Hybridization and Evaluation of Multiple Characters of Hybrid Clones in Chinese White Poplar. Ph.D. Thesis, Beijing Forestry University, Beijing, China, 2010. [Google Scholar]
  54. Monclus, R.; Villar, M.; Barbaroux, C.; Bastien, C.; Fichot, R.; Delmotte, F.M.; Delay, D.; Petit, J.-M.; Bréchet, C.; Dreyer, E.; et al. Productivity, water-use efficiency and tolerance to moderate water deficit correlate in 33 poplar genotypes from a Populus deltoides × P. trichocarpa F1 progeny. Tree Physiol. 2009, 29, 1329–1339. [Google Scholar] [CrossRef] [Green Version]
  55. Karacic, A.; Weih, M. Variation in growth and resource utilization among eight poplar clones grown under different irrigation and fertilization regimes in Sweden. Biomass Bioenergy 2006, 30, 115–124. [Google Scholar] [CrossRef]
  56. Cao, J.S.; Xu, X.J.; Zhou, S.Y. 4 kinds economic forest complex management modes and their economic benefits analysis. Bull. Agric. Sci. Technol. 2012, 48, 227–230. [Google Scholar] [CrossRef]
  57. Tang, G.; Peng, J.; Du, Q.; Xu, J.; Xu, L.; Xu, B.; Liu, S. Agroforestry complex management mode of Sapium sebiferum and analysis of its economic benefits. Non-Wood For. Res. 1997, 15, 51–52. [Google Scholar]
Figure 1. Mean values of poplar wood properties in different intercropping models. Values marked with different letters in the figure differ significantly according to Duncan’s test (α = 0.05). In the figure, (AF) represent wood hemicellulose, cellulose, lignin, basic density, fiber length and fiber length width ratio, respectively.
Forests 13 01782 g001
Table 1. The experimental design of each intercropping mode.
Intercropping PlantsAfforestation DensityPlot Area (m2)Number of SamplesEvaluated Trees
Cilantro + Chinese Cabbage2 m × 6 m72318
Watermelon + Chinese Cabbage2 m× 6 m72318
Soybeans2 m × 6 m72318
Peanut2 m × 6 m72318
Corn2 m × 6 m72318
CK2 m × 6 m72318
Table 2. Fertilizer dosage for different crops.
CropWatermelonCilantroChinese CabbageSoybeansPeanutCorn
Fertilizer dosage (Kg/hm2)75005100300079515001500
Table 3. Analysis of variance of each trait for poplar under different intercropping modes.
TraitsMeandfMSFPCV/%
TH5.8 ± 1.1520.7959120.5980.00018.23
DBH5.5 ± 1.4533.372364.0100.00025.88
GD8.3 ± 2.1575.536970.3870.00025.64
V0.0078 ± 0.004450.000356.5060.00055.79
CW2.24 ± 0.4453.227373.2980.00019.60
Hemicellulose0.155 ± 0.00750.00045.6740.0012.55
Cellulose0.58 ± 0.01750.00073.1210.0222.03
Lignin0.15 ± 0.01950.00246.1810.0006.46
Basic density0.36 ± 0.0350.00310.2560.0018.44
Fiber length670.99 ± 69.96510,975.087.7460.00010.65
Fiber aspect ratio26.32 ± 2.48512.065.9690.0019.62
Table 4. Multiple comparison of poplar growth traits in different intercropping patterns.
Intercropping ModeTree Height/mDBH/cmGround Diameter/cmVolume/m3Crown Breadth/m
CC6.14 ± 0.36 bc6.51 ± 0.79 a9.47 ± 1.10 a0.0102 ± 0.0028 b2.72 ± 0.19 a
WC5.93 ± 0.57 c6.29 ± 0.77 ab9.66 ± 1.26 a0.0092 ± 0.0027 b2.38 ± 0.16 b
SO7.46 ± 0.29 a6.70 ± 0.86 a9.68 ± 1.16 a0.0131 ± 0.0033 a2.45 ± 0.26 b
PE6.26 ± 0.45 b5.96 ± 0.53 b9.47 ± 0.78 a0.0087 ± 0.0019 b2.05 ± 0.17 c
CO4.56 ± 0.44 d3.26 ± 0.79 d4.76 ± 1.05 c0.0021 ± 0.0012 d1.49 ± 0.24 d
CK4.73 ± 0.32 d4.53 ± 0.52 c6.89 ± 0.76 b0.0039 ± 0.0011 c2.35 ± 0.21 b
Note: Different letters in the table indicate significant differences among different drought stress conditions.
Table 5. Correlation analysis among different traits in poplar.
TraitsTree HeightBreast DiameterBasal DiameterVolumeCrown DiameterHemicelluloseCelluloseLigninFiber LengthFiber Aspect Ratio
Breast diameter0.839 **
Basal diameter0.805 **0.977 **
Volume0.908 **0.956 **0.911 **
Crown diameter0.531 **0.768 **0.724 **0.676 **
Hemicellulose0.2280.3130.406 *0.2330.365 *
Cellulose−0.330 *−0.265−0.309−0.313−0.278−0.420 *
Lignin0.542 **0.422 *0.455 **0.487 **0.3110.252−0.910 **
Fiber length0.0720.014−0.1390.0910.079−0.3200.337 *−0.250
Fiber aspect ratio0.0300.010−0.1300.0570.089−0.2540.415 *−0.348 *0.894 **
Basic density0.646 **0.731 **0.809 **0.660 **0.4180.542 *−0.2310.3580.177−0.043
Note: ** Represents correlation is significant at the 0.01 level; * Represents correlation is significant at the 0.05 level.
Table 6. Comprehensive evaluation for poplar of each intercropping mode.
Using Growth Traits to Calculate Qi ValuesUsing Wood Traits to Calculate Qi Values
Intercropping ModeQiIntercropping ModeQi
SO2.214CC1.755
CC2.133WC1.715
WC2.076SO1.709
PE2.031CO1.708
CK1.785CK1.697
CO1.516PE1.695
Table 7. Economic benefits for different crops within each intercropping mode (CNY/hm2).
Intercropping ModeSeedling FeeSow SeedsSoil PreparationFertilizerIrrigationFarm ChemicalHarvestTotal InvestmentTotal Output ValueNet ProfitROI
WC930013,65090016,800810018,46211,25078,462126,60048,1381.61
CC1800195075012,960825019,500900054,21094,20039,9901.74
SO30030030012720525750344718,61215,1655.40
PE26403003002400016501200849026,31917,8293.10
CO735300300240006001200553519,62014,0853.54
CK0000000000
Publisher’s Note: MDPI stays neutral with regard to jurisdictional claims in published maps and institutional affiliations.

