Abstract
The Himalayan region is likely particularly exposed to climate change indicated by the high regional rate of change. The number of high-resolution, well-calibrated, and long-term paleoclimate reconstructions are however regrettably few, to set this change in a longer-term context. The dendroclimatic reconstructions over Himalaya that do exist have only reconstructed summer season temperatures, and rarely or never attempted to reconstruct mean annual temperatures. The paucity of long meteorological records is a matter of concern when developing chronologies of climate sensitive tree-ring data in Bhutan, but the chronologies would theoretically be of high potential for extending short meteorological records back in time using trees in high-elevation ecotones. The objectives of this study were to explore dendroclimatic signals in tree-ring width chronologies of Abies densa growing in these extreme ecotones and to reconstruct, if possible, annual temperatures over Northern Bhutan. A point-by-point regression analysis revealed that the regional composite chronology was significantly and positively correlated with temperatures of all months of the current year, i.e., January to December. The chronology was highly correlated with annual temperatures (calibration period R = 0.67 and validation period R = 0.50; p < 0.001) allowing a reconstruction of temperature over Northern Bhutan (NB-TEMR). The NB-TEMR reveals some common variations with summer temperature reconstructions of the Northern Hemisphere as well as the Himalayan region, particularly w.r.t to the recent warming trend. The reconstruction covers the period of 1765 to 2017. This reconstruction reveals a warming trend since 1850 with higher rates of warming 1935 to 2017, but with a pause around 1940–1970. The warming is consistent with reduced volcanic activity and increase of greenhouse gases. We anticipate that our new reconstruction of annual mean temperature could be an important contribution for future climate change studies and assessments of climate models.
1. Introduction
More than two thousand tree-ring-based datasets used for paleoclimate reconstructions in Extratropical Northern Hemisphere have been archived in public repositories over the past two decades revealing a vast spatial extent of high-resolution climate proxy data [,,,,,]. The paleoclimate reconstructions existing over Himalaya are mostly concentrated in the Western part with little coverage in the East [,,,,,]. The records that do exist are few and challenged by low calibration statistics and brief temporal extension []. The insufficient data coverage hampers the assessment of long-term trends associated with global change [,].
As per Past Global Changes (PAGES) project [], dendrochronology is considered one of the most useful methodologies to inform about past climate changes because of its annual resolution and absolute dating [,,,]. To minimize noise in tree-ring data, it is advisable to collect many trees to stabilize the signal of interest, and to use the available state-of-the-art detrending/standardization procedure, prior to using the data for reconstruction purposes [,,,]. However, many regional reconstructions reveal notable variations in amplitude and timing of certain warm and cold periods [,,,,,,], and degradation in reconstruction skills from periods of calibration to verification is also of major concern [,]. Moreover, existing reconstructions over Himalaya [,,,,,,,] lack consistency in targeted climate variables, challenging larger data composites for robust climate trend analysis []. This is unfortunate since the Himalayan region is thought to be more vulnerable and sensitive to climate change, as a higher rate of change is happening here than in many other regions of the world [,]. For instance, the warming trend in Eastern Himalayas and Tibetan Plateau is increasingly steeper with increased altitudes [,,,,] as measured over the past 50 years [].
Bhutan is a relatively remote part of the Eastern Himalaya, and here it is rare to find meteorological data even beyond 35 years (Department of Hydrology and Meteorology Services, Bhutan: www.hydomet.gov.bt (accessed on 15 February 2022); []). The paucity of long meteorological records is a matter of concern [,,,], particularly in the most vulnerable areas, and efforts are therefore needed to develop robust climate reconstruction. Recently, Krusic et al., (2015) presented a summer (JJA) temperature reconstruction over Bhutan (hereafter JJA-TEMR-BT13). Unfortunately, it exhibited some uncertainties, perhaps caused by variable chronology replication and relatively weak climate signal. The authors concluded that the JJA-TEMR-BT13 skill could be substantially underestimated because of the quality of the local instrumental climate data. However, this conclusion could be insufficient because JJA-TEMR-BT13 did not fully capture well-known large-scale climate events and periods [].
The tree line in Bhutan is limited by cold temperatures, and elsewhere, historical treeline changes have been studied and used as a proxy for fluctuations in temperatures [,,,]. The advance of diffuse treelines has been associated with mean annual warming temperatures, which also envelope the growing season as an integral component [,,,,]. Previous research in Bhutan has not targeted treeline ecotones, and thus room for improvements in Bhutanese temperature reconstructions still exists. In this study, we therefore aim to develop a network of high-elevation sampling sites where Abies densa trees form treeline ecotones at 3800–4500 masl in very remote areas of northern Bhutan were targeted (Figure 1).
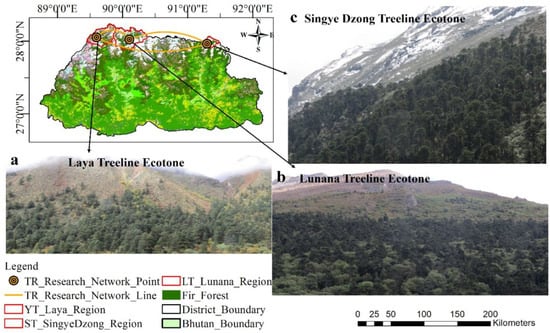
Figure 1.
Tree-ring research network sites and treeline ecotones at high elevation mountains of Northern Bhutan. A map shows three specific treeline research sites (golden concentric circles) and three treeline regions (Lunana, Laya, and Singye Dzong—pink polygons) connected by golden thick curved lines. Sampling treeline ecotones of three regions ((a) Laya and (b) Lunana and (c) Singye Dzong) are ground pictorial presentation. Land use types shaded by various colours—fir forest by dark green, and glacier/snow covers by white. The Figure was generated using ArcGIS10.8 and data from MOAF, and NLC and GPS and field photos from field sites.
The objectives of this study were to explore dendroclimatic signals in tree-ring width chronologies from the tree-ring network, and to reconstruct, if possible, mean annual temperatures over Northern Bhutan, Himalaya. Annual temperatures have rarely been used as predictand (dependent variable) from tree-ring predictors (independent variable), largely because tree growth usually occurs in the summer months [,,,,]. In fact, very few reconstructions of annual temperatures exist globally, and if attempted, poor results are often obtained [,,]. Since annual mean temperatures of meteorological observations are commonly used in research of climate change [], it would be a significant, practical, and relevant contribution in climate change research [].
2. Methods and Materials
2.1. Study Sites
The study sites are located in mountain treeline ecotones (Lunana at 4364 masl (28°05′51.87′′ N and 90°14′19.84′′ E), Laya at 3980 masl (28°03′43.68′′ N and 89°40′59.82′′ E) and Lingshi at 4007 masl (27°51′23.70′′ N and 89°26′09.68′′ E)) of central, western, eastern part of Northern Bhutan (Figure 1). Ecotones are by definition transition zones and thus sensitive to changes in climate [,,,,,]. In Bhutan in general, and in these sites especially (Figure 1), the upper natural treelines are made out of Abies densa Griff., Juniperus species and Rhododendron species that grow at around 4000 masl on north-facing slopes [,,]. Undisturbed, naturally grown Abies densa constituting the diffused treeline ecotone in northern exposed slopes were exclusively used in this study.
The sampling targeted sites that were similar in altitude and latitude, as well as history of geological formation (soil types, rock types, slope gradient, and aspects), climatic conditions, vegetation types, and management regimes [], to obtain samples from trees homogenous in their growth rate [].
2.2. Field Sampling
Ten altitudinal transect bands, 24 m wide and 300–750 m long, parallel to the slope (Figure 1a) were laid out at each ecotone [,,,]. The distances and slopes of the transect bands were measured using GPS, measuring tape, compass, and clinometer []. The horizontal distance of 300–500 m was maintained as interval between central lines of the transects (Figure 2). In all transects, individual trees suitable for use in dendroclimatic reconstruction were cored, and stem discs were cut using increment borers and chainsaw [,,]. Following standard dendrochronological techniques [,,,], the cores were sampled in the direction parallel to contour lines of the topography to avoid compression and tension wood [,,]. In case of flagging and leaning due to predominant wind direction [], geomorphological disturbances such as rockslides, avalanches, snow damages, etc., coring was avoided or sampled in the direction perpendicular to the direction of the disturbances. A total of 186 tree-ring samples from Lunana, 131 samples from Laya, and 302 samples from Singye Dzong were taken using the same sampling approach at all sites (Figure 1 and Figure 2). In total, 619 samples were brought to the laboratory for further analysis.
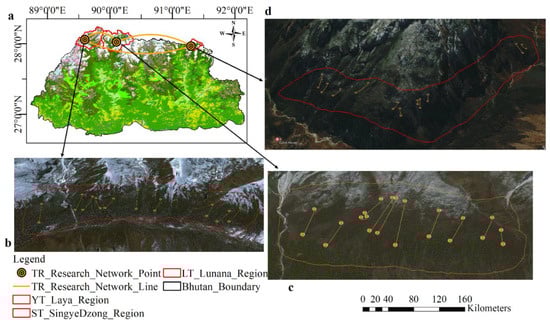
Figure 2.
Treeline ecotone network regions and transect band sampling layout in Northern Bhutan. Three specific treeline ecotone sites (golden concentric circles) and three treeline ecotone regions (Lunana, Laya and Singye Dzong—pink shaded polygons) are connected by golden thick curved lines. Map of three regions (scale is drawn) of sampling treeline ecotones, where transect bands (golden thick line) and stations (brown concentric circles) were laid, shown in (b) Laya, (c) Lunana and (d) Singye regions. (a) Land use types are shaded by various colours; fir forest cover is shaded by dark green colour and glaciers/snows by white colour (upper right panel). These figures were generated using ArcGIS10.8, Google Earth Pro 2022, and GPS data.
2.3. Laboratory Work
Wood samples (increment cores and stem discs) were dried mounted and sanded [,,,,] at the Tree-Ring Laboratory of Department of Forest Science, College of Natural Resources, Bhutan. Cores were sanded through progressively finer sandpaper (UK made) starting with ANSI 80, 120, 320, 400, 600, and 800 grits [,,,] until the individual cells were distinct under stereomicroscope at magnification of 45–90× [,,].
Cross-dating was initially performed using skeleton plotting [,,,,], and the software—COFECHA12k_AWE [,] was subsequently used to check cross-dating of each measurement []. After skeleton plotting, the ring widths were measured using the software J2X Measure V5.03 program [] coupled with the Velmex Tree Ring Measuring System (TA) or VMS [] and a stereomicroscope [,]. These instruments can measure ring width to a precision of 0.001 mm [,]. Missing rings were rare in these tree-ring samples.
2.4. Climate Data and Tree-Ring Data
A spatial correlation analysis was attempted to find out how regionally representative the tree-ring data is, using Climate Research Unit and Time Series 4.01 (hereafter CRU 4.01) (Figure 1 and Figure 2). Local instrumental data from meteorological stations [] closer to the research sites were used for comparative purposes. The CRU 4.01 data is interpolated station temperature means of 0.5° × 0.5° latitude/longitude grid cells covering the global land surface [,]. ArcGIS10.8 and GIS climate data were sourced from Ministry of Agriculture and Forest (MOAF) and National Land commission (NLC), Bhutan. ArcGIS10.8 [] and Global Position System (GPS) were used for mapping, interpolation, and comparison of gridded CRU temperature with local instrumental recorded temperature to evaluate the representativity over the treeline regions [,,,] (Figure 2 and Figure 3). Climate data and associated digital elevation models (DEM) were used in running Co-Kriging for interpolation and modelling of local climate. The nearest six CRU grids (19, 20, 27, 28, 21, and 29) revealed appropriate representativity to growing season and mean annual temperature of the local instrumental records []. The average of the six CRU grids was thus used (hereafter NBGridTEM-6) for analysis and reconstruction of past temperatures. GPSMap 60CSx was used to collect geocoordinates of the transect bands in the sampling sites [,].
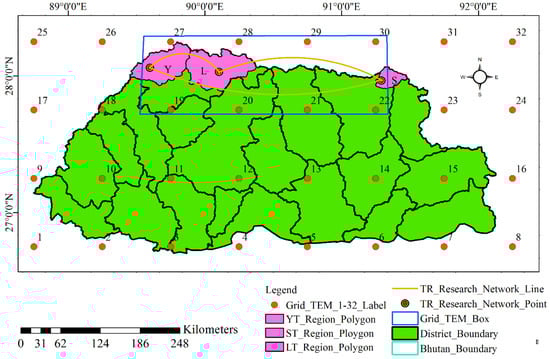
Figure 3.
Tree-ring treeline network research sites and 32 gridded CRU temperature data stations over Bhutan. A map shows three specific treeline sites (golden concentric circles) and three treeline regions (L—Lunana, Y—Laya, and S—Singye Dzong—pink polygons) connected by golden thick curved lines inside blue box. Gridded temperature stations dotted by red colour. Six gridded CRU –19, 27, 20, 28, 21, and 29 (inside blue box) were used as representative temperature variables (NBGridTEM-6).
2.5. Chronology Development
Prior to development of the final mean composite chronology, tree-ring series from 282 trees that germinated after 1900 CE were removed to mitigate modern sample bias [,]. A total of 66% of the tree-ring series exhibited positive trends in their growth, which is unusual compared to other studies. Tree-ring series that exhibited large distortions and disturbances were also rejected from further analysis. All in all, 89 percent of the total number of samples were rejected, resulting in sample depths of 21, 23, and 24 tree-ring chronologies from treeline region of Lunana, Laya, and Singye, respectively.
The process of removing non-climatic trends in measurements of each tree-ring sample is an important step in building a chronology []. The undesired variability is primarily due to the geometric consequence of adding a new wood layer to a stem of ever-increasing diameter [,,]. However, the measurements should be treated as an aggregation of many signals and for disaggregation of the signal of choice, standardization is most often required []. The software ARSTAN (Arstan_49v1a_AWE) [,,,,] was used to standardize and develop the mean composite tree-ring chronology [,,,]. ARSTAN produces four chronologies (raw, standard, residual, and arstan). The arstan chronology is the most advanced chronology version, where autocorrelation is initially removed and then reintroduced according to specified criteria [,]. The arstan chronology is expected to contain the most refined climatic signal of the chronology versions produced by the software []. For each raw tree-ring width series, dimensionless indices were computed as ratios from fitted growth curves, estimated with an age-dependent spline [,,]. Age-dependent splines with 30-, 50-, and 100-year starting spline stiffness were opted for []. “Negative exponential curves” and “horizontal line through mean” were also used for several measurement series [,]. This approach was adopted to remove growth trends related to age and stand dynamics, but to retain as much as possible of the common signal in the tree-ring indices []. ARSTAN was also used to calculate statistics such as sample depth, Running RBAR (RBAR), and Expressed Population Signal (EPS) for all three regions [,,,].
The mean composite arstan chronology of all regions was selected for temperature reconstruction (NB-CRNS) [,,]. The NB-CRNS further represents a high-grading of the signal due to cancellation of local non-climatic variability []. The robust (biweight) arithmetic mean function was used when computing NB-CRNS to reduce influence of outliers [,,,,]. The NB-CRNS covered 1765–2017 CE and its variance was stabilized [] to adjust the changes in variance influenced by decrease of sample size over time [].
2.6. Growth-Climate Relationship and Reconstruction Approach
The period 1901–2016 of CRU TS 4.01 [] was used for tree growth–climate correlation analysis. Correlation between chronologies of different sites was performed using COFECHA and principal component regression (PCR) to quantify the similarity in their patterns []. All the correlation coefficients were analysed with both the arstan chronology and the residual chronology. Mean monthly (MM) temperatures of the six CRU grids were used as monthly temperature variables (hereafter, NBGridTEM-MM-6). As tree growth can be influenced by temperature of the previous year, it can be appropriate to use growth for the next year (t + 1) to estimate temperature in the current year (t) [,,]. This is because evergreen trees continue photosynthesis into fall leading to production of carbohydrates and other elements, stored for growth in the following year []. In the point-by-point regression software (PPR_v2c3) [,], linear regressions were performed to determine correlation coefficients of NB-CRNS with months of previous (Pre) and current (Cur) year to identify monthly, seasonal, and annual temperatures [,,]. The advance of the diffuse tree lines has been associated with mean annual warming temperatures, which also envelope the growing season as an integral component [,]. The rising mean annual temperatures have favored regeneration of Abies densa, but not yet limited moisture accessibility in tree line regions []. As such, the temperature data from previous growing season months and annual aggregates can be rational to analyse [,]. The correlation analysis was carried out using treeclim [,] and graphically illustrated using the software Kaleida Graph 4.5.5 [].
The point-by-point regression (PPR) []) was used to reconstruct the most appropriate temperature target determined by the correlation analysis. PPR is the automated sequential fitting of single point PCR of tree-ring data to gridded climate variables [,]. The use of PPR is flexible to experiments even at small-scale level where a single predictand (climate) and single predictor (tree-ring chronology) are available []. The PPR is an advanced technique commonly used in dendroclimatology. Here, we used PPR for calibration and validation of the reconstruction, using NB-CRNS as predictor and gridded CRU mean annual temperature [] as predictand. A model was built from half (1960–2016) of the CRU data and validated against the other half (1901–1959) [,,,,,,].
2.7. Comparisons with Independent Reconstructions and Volcanic Cooling
The reconstruction (hereafter NB-TEMR) was compared visually and statistically with other relevant reconstructions from the region and of the northern hemisphere. As per Esper, et al. [], large volcanic cooling events have, for example, been identified through historical documents (Appendix A). Volcanic events [,,,,] and their subsequent cold years were visually compared with corresponding years in our NB-TEMR. The results were then compared to results obtained in other relevant studies such as the summer JJA temperature reconstruction over central Bhutan (hereafter JJA-TEMR-BT13) [], and MJJA temperature reconstruction over extratropical northern hemisphere (hereafter MJJA-TEMR-NTREND) []. Calibration and validation statistics of NB-TEMR were also compared with these studies. XLSTAT 2022 program [] was used in carrying out PCR for CRUTEM4.6-LNH [,,,,,] against NB-TEMR, MJJA-TEMR-NTREND, and JJA-TEMR-BT13 comparing and evaluating NB-TEMR. In addition to this, other temperature reconstructions were used for further comparisons [,,,,].
3. Results
3.1. Gridded versus Local Instrumental Temperature
The comparison of the GIS derived temperatures and the CRU data revealed an adequate representation for local climatic conditions over Bhutan particularly treeline regions in the CRU figure temperatures (Figure 1, Figure 2 and Figure 3). The grids 19, 27, 20, 28, 21, and 29 indicated a strong spatial and temporal relation with mean annual temperature of instrumental records []. The mean annual temperatures from CRU TS 4.01 datasets even revealed a higher correlation with the NB-CRNS than local instrument temperature data (Figure 2, Figure 3 and Figure 4). Similar results were reported in earlier studies [,].
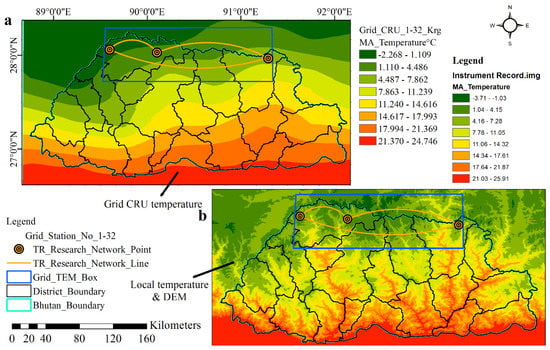
Figure 4.
Interpolation of 32 gridded CRU mean annual temperature ((a), mean of 1970–2016) and local instrumental mean annual temperature ((b), vary from 10 to 24 years of means from different stations) over Bhutan and neighbor regions. Tree-ring network and three treeline sites (golden concentric circles connected by thick curved lines inside blue box). 32 Gridded CRU stations with mean annual temperature (1970–2016) is labelled as Grid_CRU_1−32 (a) and local observed temperature is labelled as Instrument Record (b). Blue box shows locations of six CRU grids 19, 27, 20, 28, 21, and 29 that were used as representative climate variables (NBGridTEM-6) for reconstruction.
3.2. The Northern Bhutan Tree-Ring Chronology
COFECHA revealed that the 68 cross-dated series from Lunana, Laya, and Singye yielded had an average inter-series correlation of 0.47, mean sensitivity (mst) of 0.17, and standard deviation of 0.41 (Table 1 and Figure 5). ARSTAN revealed that NB−CRNS had an RBAR of 0.44 and EPS of 0.91 (Figure 5). Individual results for Lunana, Laya, and Singye yielded inter-series correlations of 0.45, 0.44, and 0.49 and mst of 0.17, 0.15, and 0.18. The average of inter-series correlation of NB−CRNS is thus similar to the results of the individual chronologies and thus rational to average into NB−CRNS. The correlation between the site-chronologies was relatively high at r = 0.87, 0.68, and 0.60, p < 0.001. The similarity between the chronologies suggests that common climatic factors limit growth in the sampled Abies densa trees [], further supporting pooling to NB-CRNS. The NB-CRNS had an EPS > 0.85 during the period 1765−2017 CE.

Table 1.
Statistic metrics of COFECHA and ARSTAN.
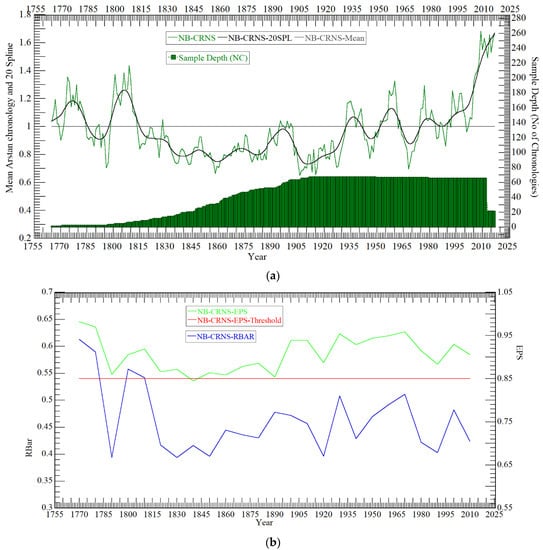
Figure 5.
Robust arithmetic mean, sample depth, RBAR, and EPS of composite annual tree-ring width chronology from three sampled treeline regions of Northern Bhutan. (a) Robust arithmetic mean composite tree-ring width chronology (NB−CRNS—green line) and sample depth (shaded dark green area) are shown. Black line represents 20-year Low Pass Filtered/smoothed mean composite arstan chronology. (b) Running RBAR (blue line) on Y1 axis and Express Population Signals (EPS—green line) on Y2 axis of mean composite arstan chronology from Northern Bhutan (NB-CRNS).
3.3. Growth-Climate Relationship
The correlation coefficients between mean temperature and tree ring-width data are positive (R = 0.173–0.395, p < 0.01) in most months [] with higher correlations occurring in May and August of the previous year (R = 0.344–0.395) and in March, May, June, August, and November (R = 0.309–0.387, p < 0.01) of the current year. The correlation coefficients were slightly lower in the previous year’s Spring (R = 0.27), Summer (R = 0.31), Autumn (R = 0.17), and Winter (R = 0.30) than in current Spring (R = 0.37), Summer (R = 0.44), Autumn (R = 0.33), and Winter (R = 0.42) seasons, respectively. Negative correlation coefficients are observed in previous months of June and September. Similar results of negative June and July temperatures and tree-ring data have previously been reported in other Himalayan regions such as Nepal [,]. The lower correlation in September matches with other dendrochronological studies [] that Abies spectabilis trees nearly cease its radial growth at tree line sites during September [].
The mean annual temperature was highly significant and positively correlated (R = 0.63, p < 0.001) to the NB-CRNS over the entire overlapped span of 1901–2016. Over the calibration period (1961–2016) the mean annual temperature correlation was slightly higher (R = 0.67, p < 0.001) (Figure 6b). When removing autocorrelation in the predictand and predictor the retained correlation is slightly lower but still highly significant (R = 0.54, p < 0.001). Temperature is thus likely the leading limiting climate factor for Abies densa tree species in all regions. Even though one month was insignificantly correlated with NB-CRNS, the mean annual temperature of all regions NBGridTEM-6 was used as predictand (explanatory variable) (Figure 6 and Figure 7). Similar results have been reported in northeastern Tibetan Plateau and Nepal [,], supporting this approach.
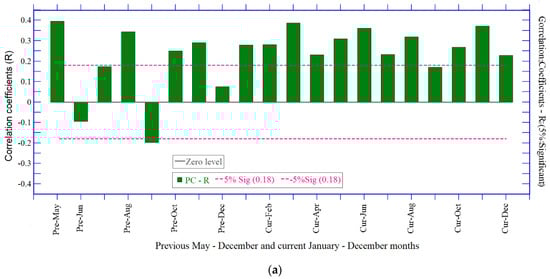
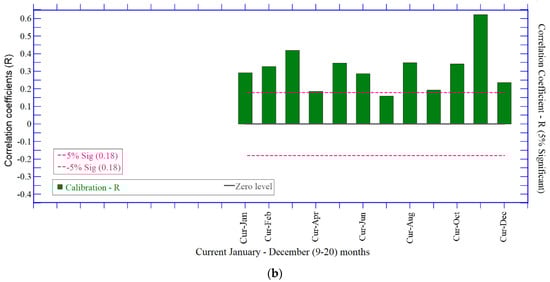
Figure 6.
(a) Correlation coefficient between NB−CRNS and monthly mean temperatures (NBGridTEM-MM-6) for the period of 1901–2016. (b) Correlation coefficients between NB−CRNS and monthly mean temperatures (NBGridTEM-MM-6) for the period of 1961–2016. The horizontal dashed lines show 5% significant threshold values [].
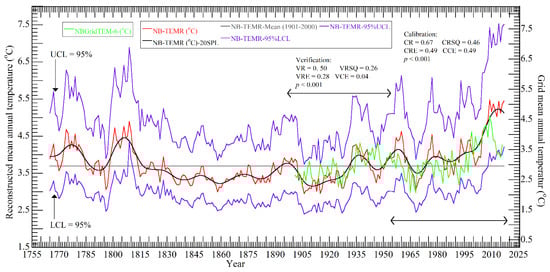
Figure 7.
NB-TEMR (red line with grey spline) and NBGridTEM-6 (aquamarine line). Calibration and validation regression metrics are shown for absolute data only. Reconstruction data has been filtered by 20-year Low Pass Filtered smoothing. Upper and lower 95% confidential level (UCL95% and LCL95%—purple lines). Note: CR—calibration correlation; CRSQ—calibration R-square; VR—verification correlation; VRSQ—verification R-square; VCE—verification coefficient of efficiency; VRE—verification reduction error; VCE—verification coefficient efficiency.
3.4. Reconstruction of Northern Bhutan Temperatures
The PCR analysis revealed encouraging calibration and verification R and RSQ statistics (CR = 0.67, CRSQ = 0.46; VR = 0.50, VRSQ = 0.28, p < 0.001). The full model f-ratio = 49.57, (df = 55; p < 0.0001), and positive reduction of error and coefficient of efficiency (VCE = 0.28, VRE = 0.04) points to a useful model (Figure 7). The reduction of error is a rigorous test and positive value indicates better model skill than simply using the mean value [,]. The NB-TEMR and the temperature target are compared visually in Figure 7 and reveal a good fit. The NB-TEMR arguably exhibits a statistically sound link with the temperature target despite meteorological station data of Bhutan not contributing to the field of gridded CRU TS 4.01 [,].
3.5. Comparison with Reconstructions from Himalaya and Extratropical Northern Hemisphere
The calibration metrics of NB-TEMR (CR = 0.67 and CRSQ = 0.46, p < 0.001) were observed to be slightly higher than for MJJA-TEMR-NTREND (CRSQ = 0.40, p < 0.05) and JJA-TEMR-BT13 (CR = 0.54, CRSQ = 0.32, p < 0.05). The validation metrics of NB-TEMR (VR = 0.50, VRSQ = 0.26, p < 0.001) were observed to be slightly higher than for MJJA-TEMR-NTREND (VRSQ = 0.10 to 0.40, p < 0.05) and JJA-TEMR-BT13 (VRSQ = 0.24, p < 0.05). Nevertheless, agreement among these products was evident, especially with JJA-TEMR-BT13 after 1965 CE. NB-TEMR, MJJA-TEMR-NTREND, and CRUTEM4.6-LNH agree on a warming trend since 1850 with some multi-decadal oscillations (Figure 8a,b). NB-TEMR, MJJA-TEMR-NTREND, and JJA-TEMR-BT13 reasonably agree on a cool period 1785–1820, which coincided with Dalton minima in solar energy output (Figure 8a,b). The decreased trend of global temperature during 1790–1820 was also found in reconstructions from eastern Himalaya and northeast Tibetan [,,]. Solar forcing during Dalton Minimum coincides with increased activities of volcanic forcing [] and as such it is difficult to differentiate their influence on decadal temperature variability during the relevant period [,,]. In contrast to the larger-scale cooling around 1795–1810, the NB-TEMR feature a warmer period (Figure 8a,b). The NB-TEMR warming could perhaps be attributed to influence of local site conditions and/or the drastic decrease of samples from 1810 to 1765. As replication becomes lower, the fidelity weakens [,]. Increasing the replication in this period as well as earlier periods would likely enhance the fidelity of the reconstruction [,].
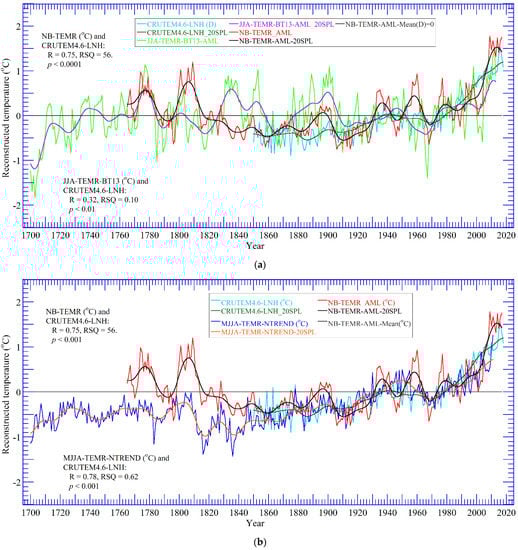
Figure 8.
Comparison with two reconstructions and an instrumental record—Bhutan Himalaya and Extratropical Northern Hemisphere. (a) NB−TEMR (red with black spline line) with JJA−TEMR-BT13 (lime with purple spline line) and CRUTEM4.6−LNH (cyan with green spline line). (b) NB−TEMR (red with black spline line) with MJJA−TEMR−NTREND (blue with orange spline line) and CRUTEM4.6−LNH (cyan with green spline line). Each reconstruction is represented as anomalies (°C) from 1901–2000 mean, 1881–1980 mean, and 1961–1990 mean (horizontal thick black line). Each reconstruction has been 20-year low pass filtered cubic smoothing spline.
The turn of the 1970s is portrayed as a colder excursion in NB-TEMR. This is supported by MJJA-TEMR-NTREND [], JJA-TEMR-BT13 [], as well as CRUTEM4.6-LNH (Figure 8a,b). NB-TEMR exhibited decadal cooling during 1785–1820, 1850–1870, 1900–1910, and 1945–1960 CE and warming 1875–1900 CE and from 1970 CE until present. NB-TEMR displays a drastic increased rate of warming from 1998 until 2018, not quite matched in the instrumental temperature record.
A visual comparison of NB-TEMR and JJA-TEMR-BT13, MJJA-TEMR-NTREND, and CRUTEM4.6-LNH reveal common variability around cold event years coinciding with volcanic eruptions (Figure 9a,b). Relevant cooling years in this context include eruptions of Laki, 1783; U.E., 1809; Mount Tambora, 1815; Coseguina, 1835; Krakatau, 1883; Novarupta, 1912; Agung, 1963–1964; Mount Pinatubo, 1991 (Figure 9a,b and Appendix A).
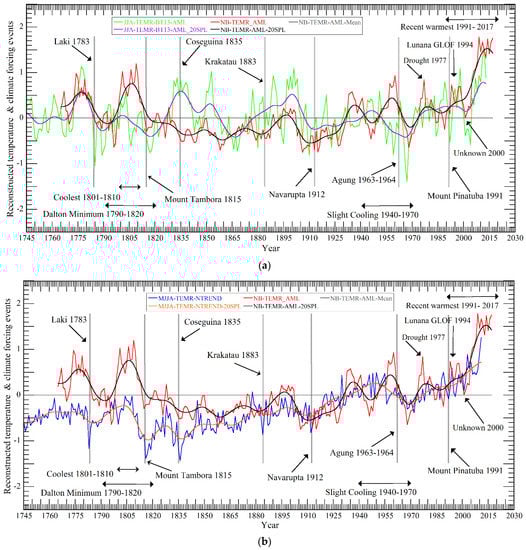
Figure 9.
NB-TEMR depicted with documented volcanic dates together with JJA−TEMR-BT13, and MJJA−TEMR-NTREND, respectively. (a) NB−TEMR (red with black spline line) with JJA−TEMR−BT13 (lime with purple spline line). (b) NB-TEMR (red with black spline line) with MJJA−TEMR−NTREND (blue with orange spline line). Above reconstructions are superimposed by approximate timespans of Dalton solar Minimum, eight volcanic eruptions and some cool and warm periods. The reconstructions are expressed as anomalies from the 1901––2000 mean (horizontal thick grey line). Reconstruction data has been filtered by 20-year low pass filtered smoothing.
The impacts of Krakatau in 1883, Mount Pinatubo in 1991, Agung in 1963–1964 and Novarupta 1912 were also present in CRUTEM4.6-LNH revealing the aptitude of NB-TEMR in evaluating perturbations of short-time climate cooling caused by such volcanic forcing events. The similarities of NB-TEMR and other local and hemispheric products suggests that cooling associated with volcanic eruptions may be captured in our new reconstruction as well. The NB-TEMR was also found to be similar to observed Northern Hemisphere temperatures (CRUTEM4.6-LNH) (R = 0.75; RSQ = 0.56, p < 0.001), on par with MJJA-TEMR-NTREND (R = 0.79 and RSQ = 0.62, p < 0.001) (Figure 8a,b). NB-TEMR may therefore be valuable for reconstructions beyond the Himalayan regions (Figure 8a,b and Figure 9a,b), and certainly if included in large-scale reconstructions, it is possible to extend the dataset back in time.
4. Discussion
4.1. Meteorological Relevance and Practical Application in Climate Change Research
Works on reconstructing temperature in the Northern Hemisphere using tree-ring data began in 1971 [] and 1974 [] in North America. However, reconstructions of temperature using tree-rings rarely provide estimates of global annual temperatures [,,,]. In fact, summer season proxies usually display a weak association with mean annual proxies and instrumental temperatures []. Annual temperature reconstructions from Southwest Tibet [], Northern Hemisphere and the Artic [], as well as the Northeastern margin of the Tibetan Plateau [] reveal modest fidelity. The reasons for this are not fully understood but could be related to a decoupling in the lower frequencies, where deterioration from periods of calibration to periods of verification are common [,].
Nevertheless, annual mean temperatures are commonly used in research of climate change, and reconstructions providing this should be considered relevant and of practical importance [,,]. More work is thus needed to fill spatial and temporal gaps of such reconstructions. This study is a rare example where it was possible to target annual temperatures [,,,,,]. Although the high correlations were found in winter months followed by summer months, the mean annual temperature of the current year (January–December) exhibited the highest correlations (R = 0.63, p < 0.001) with NB-CRNS. NB-TEMR thus arguably represents an unusually broad seasonal window for studying historical climate changes.
4.2. Comparisons between Himalayan and Northern Hemisphere Temperatures
The Earth surface has progressively warmed over the recent decades where the 1983–2012 period exhibited the highest increases in temperature over past 1400 years [,,,]. NB-TEMR also reveals an alarming degree of warming in recent decades, surpassing many other reconstructions (Figure 8a,b). NB-TEMR exhibited a cold trough of 1970s coinciding with a drought in 1970–1971 in Northwest Himalaya and Karakoram []. The droughts of 1970–1971 were severe in Afghanistan, Pakistan, and Tajikistan, and thought to be the result of lower-than-normal winter snowfall. The epoch was also characterized by cold conditions over southwest Tibet, Nepal Himalaya, western Himalaya, and extratropical Hemisphere [,,]. The NB-TEMR also suggest linkages with historic episodes of volcanic eruptions. As displayed in relevant reconstructions and NB-TEMR, the recent warming is coinciding with reduced number of volcanic eruptions, rising of insolation and increase of greenhouse gases [,,]. Further research is however needed to confirm the relationships between GHG and volcanic cooling and NB-TEMR.
Since 1950s, warming has been identified over Tibetan Plateau particularly during winter months and especially at higher elevations, increasing in rate since 1970 [,,]. Trees from high latitude [] sites and high altitude [] are primarily sensitive to temperature. The higher increase in NB-TEMR compared to instrumental and alternative reconstructions could be a result of NB-TEMR trees growing at the treeline, exhibiting a higher rate of change than lower elevations []. This is in contrast to the often-reported phenomenon of “divergence” in Northern Hemisphere tree-ring data []. Historically, the instrumental rising trend has been shown to be more pronounced than in tree-ring proxy temperatures after 1960. Reasons for this could be many, and perhaps related to warming-induced drought, global dimming, and anthropogenic disturbances in high altitudes of the North [,,]. Contrastingly, the divergence problem in this study differs from high latitudes of the North, with decreasing observed temperature and rising NB-TEMR values after 2010 (Figure 7). As mentioned earlier, a higher rate of change could take place at altitudes far higher than the meteorological stations, but the divergence could also be compounded by a prolongation of the growing season []. The earlier warming of spring can trigger an earlier start of cambial activity and support wider tree-ring widths []. The remoteness of the sampled areas likely precludes substantial anthropogenic disturbances, which could also foster increased growth rates not explained by temperatures alone. Thus, continued sampling of larger datasets in these and other similar biogeographic regions of Bhutan is required to provide even more robust estimates of mean annual temperatures [] in Bhutan.
5. Conclusions
Capitalizing on the strength of dendroclimatic methods, we reconstructed mean annual temperatures in Northern Bhutan. The point-by-point regression analysis revealed that NB-TEMR presents significant contribution to local temperature history and reveal a warming trend from the mid-19th century. The calibration and verification statistics, as well as the similarity with other reconstructions, supports the notion that tree-rings of Abies densa trees at the Northern Bhutan tree lines are sensitive to temperature and a valuable natural archive to study global warming. The NB-TEMR also appear to capture volcanic cooling, but further studies are needed to confirm this. It is thus of great importance to continue to work to extend this dataset back in time and to increase replication in earlier segments to allow exploration of the regional expression of the Little Ice Age, Medieval Climate anomaly, and volcanic cooling of the past millennium.
Author Contributions
Y.K. conceptualised and designed studies with minor changes from A.P. and S.I.N.A.; Y.K. conducted field sampling methods, laboratory processing, and analysis of tree-ring samples. Y.K. analysed dendroclimatic reconstructions and the wrote first original draft of the manuscript. Y.K., A.P. and S.I.N.A. reviewed and edited draft. A.P. provided overall supervision, project administration, and funding acquisition. S.I.N.A. assisted supervision and administration. Y.K., A.P. and S.I.N.A. contributed to manuscript revision and completion. All authors have read and agreed to the published version of the manuscript.
Funding
This research was funded by Thai International Cooperation Agency (TICA), Thailand, for lead author for PhD studies. Grant number:1603.3/5503.
Institutional Review Board Statement
Not applicable.
Informed Consent Statement
Not applicable.
Data Availability Statement
Not applicable.
Acknowledgments
We would like to thank Thai International Cooperation Agency (TICA), Thailand for providing funding support (grant number1603.3/5503) to lead author for his PhD research studies in Khon Kaen University, Thailand. College of Natural Resources, Bhutan is thanked for providing resources for processing and analyzing tree-ring samples and data at Tree-Ring Laboratory. Department of Hydro-Met Services and Department of Geology and Mines, Ministry of Economic Affairs; and Ministry of Agriculture and Forests, National Land Commission, Royal Government of Bhutan are thanked for providing meteorological data and GIS data including digital elevation model. Department of Forestry and Park Services, Royal Government of Bhutan is thanked for giving permission to conduct field sampling methods and collect tree-ring samples in treeline regions of Northern Bhutan. Faculty of Agriculture, Khon Kaen University, Thailand is thanked for providing all necessary supports of logistics and administration. We also thank the then Representative Office of Denmark (DANIDA), Thimphu for funding support given to development of Tree-Ring Laboratory at College of Natural Resources, Bhutan through the Danish–Bhutanese Joint Research Project, 2011–2013.
Conflicts of Interest
Authors declare no financial competing interest. This is also to confirm that this paper has not been published previously anywhere and not under consideration for publication by any another journal.
Appendix A
Table A1.
Volcanic eruptions and volcanic forced cold year prints in tree ring index-based reconstruction.
Table A1.
Volcanic eruptions and volcanic forced cold year prints in tree ring index-based reconstruction.
| Sl. No. | Volcano/Region | Eruption Year | Cold Year (2–3) | Sources |
|---|---|---|---|---|
| 1 | Tambora/Indonesia | 1815 | 1816 | [,,,,] |
| 2 | Laki/Iceland | 1783 | 1783 | [,,,,] |
| 3 | UE | 1809 | 1810 | [,,,] |
| 4 | Babuyan/Philippines | 1831 | 1832 | [,] |
| 5 | Krakatau/Indonesia | 1883 | 1884 | [,,] |
| 6 | SantaMaria/ Guatemala | 1902 | 1903 | [,,] |
| 7 | Ksudach/Russia | 1907 | [,] | |
| 8 | Novarupta or Katmai/Alaska/USA | 1912 | 1912 | [,,] |
| 9 | Colima/Mexico | 1913 | [,] | |
| 10 | Bezymianny/Russia | 1956 | [,] | |
| 11 | Pinatubo/Philippines | 1991 | 1991 | [,,,] |
| 12 | Coseguina | 1835 | 1836 | [] |
| 13 | Agung, Indonesia | 1963–1964 | 1963–1964 | [] |
Source: [,].
References
- St. George, S. An overview of tree-ring width records across the Northern Hemisphere. Quat. Sci. Rev. 2014, 95, 132–150. [Google Scholar] [CrossRef]
- St. George, S.; Ault, T.R. The imprint of climate within Northern Hemisphere trees. Quat. Sci. Rev. 2014, 89, 1–4. [Google Scholar] [CrossRef]
- Anchukaitis, K.J.; Wilson, R.; Briffa, K.R.; Büntgen, U.; Cook, E.R.; D’Arrigo, R.; Davi, N.; Esper, J.; Frank, D.; Gunnarson, B.E.; et al. Last millennium Northern Hemisphere summer temperatures from tree rings: Part II, spatially resolved reconstructions. Quat. Sci. Rev. 2017, 163, 1–22. [Google Scholar] [CrossRef]
- Masson-Delmotte, V.M.; Schulz, A.; Abe-Ouchi, J.; Beer, A.; Ganopolski, J.F.; González Rouco, E.; Jansen, K.; Lambeck, J.; Luterbacher, T.; Naish, T.; et al. Information from Paleoclimate Archives. In Climate Change 2013: The Physical Science Basis. Contribution of Working Group I to the Fifth Assessment Report of the Intergovernmental Panel on Climate Change; Stocker, T.F., Qin, D., Plattner, G.-K., Tignor, M., Allen, S.K., Boschung, J., Nauels, A., Xia, Y., Bex, V., Midgley, P.M., Eds.; Cambridge University Press: Cambridge, UK, 2013. [Google Scholar]
- Wilson, R.; Anchukaitis, K.; Briffa, K.R.; Büntgen, U.; Cook, E.; D’Arrigo, R.; Davi, N.; Esper, J.; Frank, D.; Gunnarson, B.; et al. Last millennium northern hemisphere summer temperatures from tree rings: Part I: The long term context. Quat. Sci. Rev. 2016, 134, 1–18. [Google Scholar] [CrossRef]
- Frank, D.; Esper, J.; Zorita, E.; Wilson, R. A noodle, hockey stick, and spaghetti plate: A perspective on high-resolution paleoclimatology. WIREs Clim. Change 2010, 1, 507–516. [Google Scholar] [CrossRef]
- Krusic, P.J.; Cook, E.R.; Dukpa, D.; Putnam, A.E.; Rupper, S.; Schaefer, J. Six hundred thirty-eight years of summer temperature variability over the Bhutanese Himalaya. Geophys. Res. Lett. 2015, 42, 2988–2994. [Google Scholar] [CrossRef]
- Fan, Z.-X.; Bräuning, A.; Tian, Q.-H.; Yang, B.; Cao, K.-F. Tree ring recorded May–August temperature variations since A.D. 1585 in the Gaoligong Mountains, southeastern Tibetan Plateau. Palaeogeogr. Palaeoclimatol. Palaeoecol. 2010, 296, 94–102. [Google Scholar] [CrossRef]
- Singh, J.; Yadav, R.R.; Wilmking, M. A 694-year tree-ring based rainfall reconstruction from Himachal Pradesh, India. Clim. Dyn. 2009, 33, 1149. [Google Scholar] [CrossRef]
- Yadav, R.R. Tree ring imprints of long-term changes in climate in western Himalaya, India. J. Biosci. 2009, 34, 699–707. [Google Scholar] [CrossRef]
- Treydte, K.S.; Schleser, G.H.; Helle, G.; Frank, D.C.; Winiger, M.; Haug, G.H.; Esper, J. The twentieth century was the wettest period in northern Pakistan over the past millennium. Nature 2006, 440, 1179–1182. [Google Scholar] [CrossRef]
- Sano, M.; Ramesh, R.; Sheshshayee, M.; Sukumar, R. Increasing aridity over the past 223 years in the Nepal Himalaya inferred from a tree-ring δ18O chronology. Holocene 2012, 22, 809–817. [Google Scholar] [CrossRef]
- National Research Council. Himalayan Glaciers: Climate Change, Water Resources and Water Security; The National Academies Press: Washington, DC, USA, 2012. [Google Scholar]
- Tse-ring, K.; Sharma, E.; Chettri, N.; Shrestha, A. Climate Change Vulnerability of Mountain Ecosystems in the Eastern Himalayas; Climate Change Impact and Vulnerability in the Eastern Himalayas—Synthesis Report; International Centre for Integrated Mountain Development: Kathmandu, Nepal, 2010; p. 116. [Google Scholar]
- Ahmed, M.; Anchukaitis, K.J.; Asrat, A.; Borgaonkar, H.P.; Braida, M.; Buckley, B.M.; Büntgen, U.; Chase, B.M.; Christie, D.A.; Cook, E.R.; et al. Continental-scale temperature variability during the past two millennia. Nat. Geosci. 2013, 6, 339–346. [Google Scholar] [CrossRef]
- Speer, J.H. Fundamentals of Tree-Ring Research; Hansen-Speer, K., Ed.; University of Arizona Press: Tucson, AZ, USA, 2010; p. 521. [Google Scholar]
- Cook, E.R. A Time Series Analysis Approach to Tree Ring Standardisation. PhD Thesis, University of Arizona, Tucson, AZ, USA, 1985. [Google Scholar]
- Wang, B.; Chen, T.; Xu, G.; Wu, G.; Li, C. Reconstructed annual mean temperatures for the northeastern margin of the Tibetan Plateau: Associations with the East Asian monsoons and volcanic events. Int. J. Climatol. 2017, 37, 3044–3056. [Google Scholar] [CrossRef]
- Fritts, H.C. Tree Rings and Climate; Academic Press Inc. Ltd.: New York, NY, USA, 1976; p. 571. [Google Scholar]
- Cook, E.R.; Kairiukstis, L.A. (Eds.) Methods of Dendrochronology: Applications in Environmental Science; International Institute for Applied System Analysis: Laxenburgu, Austria; Kluwer Academic Publisher: Dordrecht, The Netherlands, 1992; p. 394. [Google Scholar]
- Cook, E.; Holmes, R. A Guide for Computer Program ARSTAN; University of Arizona: Tucson, AZ, USA, 1986. [Google Scholar]
- Ahmed, M. The Science of Tree Rings: Dendrochronology; Qureshi Art Press: Karachi, Pakistan, 2014; p. 301. [Google Scholar]
- Mann, M.E.; Zhang, Z.; Rutherford, S.; Bradley, R.S.; Hughes, M.K.; Shindell, D.; Ammann, C.; Faluvegi, G.; Ni, F. Global Signatures and Dynamical Origins of the Little Ice Age and Medieval Climate Anomaly. Science 2009, 326, 1256–1260. [Google Scholar] [CrossRef]
- Mann, M.E.; Bradley, R.S.; Hughes, M.K. Global-scale temperature patterns and climate forcing over the past six centuries. Nature 1998, 392, 779–787. [Google Scholar] [CrossRef]
- Emile-Geay, J.; Cobb, K.M.; Mann, M.E.; Wittenberg, A.T. Estimating Central Equatorial Pacific SST Variability over the Past Millennium. Part II: Reconstructions and Implications. J. Clim. 2013, 26, 2329–2352. [Google Scholar] [CrossRef]
- Cook, E.R.; Krusic, P.J.; Jones, P.D. Dendroclimatic signals in long tree-ring chronologies from the Himalayas of Nepal. Int. J. Climatol. 2003, 23, 707–732. [Google Scholar] [CrossRef]
- Yang, B.; Kang, X.; Liu, J.; Bräuning, A.; Qin, C. Annual temperature history in Southwest Tibet during the last 400 years recorded by tree rings. Int. J. Climatol. 2010, 30, 962–971. [Google Scholar] [CrossRef]
- Shrestha, U.B.; Gautam, S.; Bawa, K.S. Widespread climate change in the Himalayas and associated changes in local ecosystems. PLoS ONE 2012, 7, e36741. [Google Scholar] [CrossRef]
- Gaire, N.P.; Koirala, M.; Bhuju, D.R.; Carrer, M. Site- and species-specific treeline responses to climatic variability in eastern Nepal Himalaya. Dendrochronologia 2017, 41, 44–56. [Google Scholar] [CrossRef]
- Bhattacharyya, A.; Chaudhary, V. Late-summer temperature reconstruction of the eastern Himalayan region based on tree-ring data of Abies densa. Tree Ring Res. 2003, 35, 196–202. [Google Scholar] [CrossRef]
- Körner, C. Alpine Treelines: Functional Ecology of the Global High Elevation Tree Limits; Springer Science & Business Media: Berlin/Heidelberg, Germany, 2012. [Google Scholar]
- Liu, X.; Chen, B. Climatic warming in the Tibetan Plateau during recent decades. Int. J. Climatol. 2000, 20, 1729–1742. [Google Scholar] [CrossRef]
- Thapa, U.; St. George, S.; Kharal, D.; Gaire, N. Tree growth across the Nepal Himalaya during the last four centuries. Prog. Phys. Geogr. Earth Environ. 2017, 41, 478–495. [Google Scholar] [CrossRef]
- Shrestha, A.B.; Devkota, L.P. Climate Change in the Eastern Himalayas: Observed Trends and Model Projections; Climate Change Impact and Vulnerability in the Eastern Himalayas—Technical Report 1; International Centre for Integrated Mountain Development: Kathmandu, Nepal, 2010. [Google Scholar]
- Cook, E.R.; Anchukaitis, K.J.; Buckley, B.M.; D’Arrigo, R.D.; Jacoby, G.C.; Wright, W.E. Asian Monsoon Failure and Megadrought During the Last Millennium. Science 2010, 328, 486. [Google Scholar] [CrossRef] [PubMed]
- Cook, E.R.; Krusic, P.J.; Anchukaitis, K.J.; Buckley, B.M.; Nakatsuka, T.; Sano, M.; Members, P.A.k. Tree-ring reconstructed summer temperature anomalies for temperate East Asia since 800 C.E. Clim. Dyn. 2013, 41, 2957–2972. [Google Scholar] [CrossRef]
- LaMarche, V.C.J.; Mooney, H.A. Altithermal timberline advance in western United States. Nature 1967, 213, 980–982. [Google Scholar] [CrossRef]
- LaMarche, V.C., Jr.; Stockton, C.W. Chronologies from termperature-sensitive bristlecone pines at upper treeline in Western United States. Tree Ring Bull. 1974, 34, 21–45. [Google Scholar]
- Esper, J.; Shiyatov, S.G.; Mazepa, V.S.; Wilson, R.J.S.; Graybill, D.A.; Funkhouser, G. Temperature-sensitive Tien Shan tree ring chronologies show multi-centennial growth trends. Clim. Dyn. 2003, 21, 699–706. [Google Scholar] [CrossRef]
- D’Arrigo, R.; Wilson, R.; Jacoby, G. On the long-term context for late twentieth century warming. J. Geophys. Res. Atmos. 2006, 111, 1–12. [Google Scholar] [CrossRef]
- LaMarche, V.C. Paleoclimatic inferences from long tree-ring records: Intersite comparison shows climatic anomalies that may be linked to features of the general circulation. Science 1974, 183, 1043–1048. [Google Scholar] [CrossRef]
- Crawford, R.M.M. Peripheral Plant Population Survival in Polar Regions. In Mountain Ecosystems: Studies in Treeline Ecology; Broll, G., Keplin, B., Eds.; Springer: Berlin/Heidelberg, Germany, 2005; pp. 43–76. [Google Scholar]
- Harsch, M.A. Treeline Dynamics: Pattern and Process at Multiple Spatial Scales; Research Lincoln University: Lincoln, New Zealand, 2010. [Google Scholar]
- Schickhoff, U. The upper timberline in the Himalayas, Hindu Kush and Karakorum: A review of geographical and ecological aspects. In Mountain Ecosystems: Studies in Treeline Ecology; Broll, G., Keplin, B., Eds.; Springer: Berlin/Heidelberg, Germany, 2005; pp. 275–354. [Google Scholar]
- Gratzer, G.; Rai, P.B.; Schieler, K. Structure and regeneration dynamics of Abies densa forests in central Bhutan. Austrian J. For. Sci. 2002, 3, 279–288. [Google Scholar]
- Gratzer, G.; Rai, P.B.; Glatzel, G. The influence of the bamboo Yushania microphylla on regeneration of Abies densa in central Bhutan. Can. J. For. Res. 1999, 29, 1518–1527. [Google Scholar] [CrossRef]
- Melvin, T. Historical Growth Rates and Changing Climatic Sensitivity of Boreal Conifers; University of East Anglia: London, UK, 2004. [Google Scholar]
- Tiwari, A.; Fan, Z.-X.; Jump, A.S.; Li, S.-F.; Zhou, Z.-K. Gradual expansion of moisture sensitive Abies spectabilis forest in the Trans-Himalayan zone of central Nepal associated with climate change. Dendrochronologia 2016, 41, 34–43. [Google Scholar] [CrossRef]
- Ababneh, L. Analysis of Radial Growth Patterns of Strip-Bark and Whole-Bark Bristlecone Pine Trees in the White Mountains of California: Implications in Paleoclimatology and Archaeology of the Great Basin; The University of Arizona: Tucson, AZ, USA, 2006. [Google Scholar]
- Stokes, M.; Smiley, T. An Introduction to Tree-Ring Dating; University of Chicago Press: Chicago, IL, USA, 1968. [Google Scholar]
- Chen, F.; Wang, H.; Chen, F.-h.; Yuan, Y.; Zhang, R.-B. Tree-ring reconstruction of July–May precipitation (AD 1816–2010) in the northwestern marginal zone of the East Asian summer monsoon reveals the monsoon-related climate signals. Int. J. Climatol. 2015, 35, 2109–2121. [Google Scholar] [CrossRef]
- Chen, F.; Shang, H.; Panyushkina, I.P.; Meko, D.M.; Yu, S.; Yuan, Y.; Chen, F. Tree-ring reconstruction of Lhasa River streamflow reveals 472 years of hydrologic change on southern Tibetan Plateau. J. Hydrol. 2019, 572, 169–178. [Google Scholar] [CrossRef]
- Khandu, Y. Regeneration and Expansion of Native Pinewoods of Birse Forest in Scotland; Department of Plant and Soil Science, College of Life Science and Medicine, University of Aberdeen: Aberdeen, UK, 2007. [Google Scholar]
- Schweingruber, F.H. Tree Rings: Basic and Application of Dendrochronology; D. Reidel Publishing Company: Dordrecht, The Netherlands, 1988; p. 276. [Google Scholar]
- Prasad Gaire, N.; Fan, Z.-X.; Bräuning, A.; Panthi, S.; Rana, P.; Shrestha, A.; Bhuju, D.R. Abies spectabilis shows stable growth relations to temperature, but changing response to moisture conditions along an elevation gradient in the central Himalaya. Dendrochronologia 2020, 60, 125675. [Google Scholar] [CrossRef]
- Gaire, N.P.; Bhuju, D.R.; Koirala, M.; Shah, S.K.; Carrer, M.; Timilsena, R. Tree-ring based spring precipitation reconstruction in western Nepal Himalaya since AD 1840. Dendrochronologia 2017, 42, 21–30. [Google Scholar] [CrossRef]
- Orvis, K.H.; Grissino-Mayer, H.D. Standardizing the reporting of abrasive papers used to surface tree-ring samples. Tree Ring Res. 2002, 58, 47–50. [Google Scholar]
- Holmes, R.L. Computer-assisted quality control in tree-ring dating and measurement. Tree Ring Bull. 1983, 43, 69–78. [Google Scholar]
- Grissino-Mayer, H.D. Evaluating crossdating accuracy: A manual and turtorial for the computer program COFECHA. Tree Ring Res. 2001, 57, 205–221. [Google Scholar]
- VoorTech Consulting; ProjectJ2X. Measure J2X V5.01; VoorTech Consulting: Holderness, NH, USA; New York, NY, USA, 2016. [Google Scholar]
- Velmex, I. Velmex Tree Ring Measuring System (TA); Velmex Inc.: Bloomfield, NY, USA, 2016. [Google Scholar]
- Meteorological Observations. Departmentof Hydrology and Meteorology Services, Ministry of Economic Affairs, Thimphu, Bhuan. 2021. Available online: www.hydomet.gov.bt (accessed on 17 January 2022).
- Harris, I.; Jones, P.D.; Osborn, T.J.; Lister, D.H. Updated high-resolution grids of monthly climatic observations–the CRU TS3.10 Dataset. Int. J. Climatol. 2014, 34, 623–642. [Google Scholar] [CrossRef]
- British Atmospheric Data Centre. Climatic Research Unit (CRU) Time-Series (TS) Version 4.01 of High-Resolution Gridded Data of Month-by-Month Variation in Climate (January 1901–December 2016). 2016. Available online: https://catalogue.ceda.ac.uk/uuid/b2f81914257c4188b181a4d8b0a46bff (accessed on 22 January 2022).
- ESRI (Ed.) ArcGIS 10.8 for Desktop; Environmental Systems Research Institute, Inc.: Redlands, CA, USA, 2015; Available online: http://www.esri.com/ (accessed on 23 February 2022).
- Zhang, R.-B.; Yuan, Y.-J.; Wei, W.-S.; Gou, X.-H.; Yu, S.-L.; Shang, H.-M.; Chen, F.; Zhang, T.-W.; Qin, L. Dendroclimatic reconstruction of autumn–winter mean minimum temperature in the eastern Tibetan Plateau since 1600 AD. Dendrochronologia 2015, 33, 1–7. [Google Scholar] [CrossRef]
- Shrestha, K.B.; Hofgaard, A.; Vandvik, V. Recent treeline dynamics are similar between dry and mesic areas of Nepal, central Himalaya. J. Plant Ecol. 2014, 8, 347–358. [Google Scholar] [CrossRef]
- Wigley, T.M.L.; Briffa, K.R.; Jones, P.D. On the Average Value of Correlated Time Series, with Applications in Dendroclimatology and Hydrometeorology. J. Clim. Appl. Meteorol. 1984, 23, 201–213. [Google Scholar] [CrossRef]
- Addinsoft. XLSTAT Statistical and Data Analysis Solution; Addinsoft: New York, NY, USA, 2022; pp. 1–1276. [Google Scholar]
- Borgaonkar, H.P.; Sikder, A.B.; Ram, S. High altitude forest sensitivity to the recent warming: A tree-ring analysis of conifers from Western Himalaya, India. Quat. Int. 2011, 236, 158–166. [Google Scholar] [CrossRef]
- Cook, E.R.; Meko, D.M.; Stahle, D.W.; Cleaveland, M.K. Drought Reconstructions for the Continental United States. J. Clim. 1999, 12, 1145–1162. [Google Scholar] [CrossRef]
- Jacoby, G.C.; D’Arrigo, R. Reconstructed Northern Hemisphere annual temperature since 1671 based on high-latitude tree-ring data from North America. Clim. Change 1989, 14, 39–59. [Google Scholar] [CrossRef]
- Zang, C.; Biondi, F. treeclim: An R package for the numerical calibration of proxy-climate relationships. Ecography 2015, 38, 431–436. [Google Scholar] [CrossRef]
- Biondi, F.; Waikul, K. DENDROCLIM2002: A C++ program for statistical calibration of climate signals in tree-ring chronologies. Comput. Geosci. 2004, 30, 303–311. [Google Scholar] [CrossRef]
- Synergy Software. Kaleida Graph Manual (Window); Synergy Software: Reading, PA, USA, 2020; p. 340. [Google Scholar]
- Wang, T.; Zhang, Q.B.; Ma, K.P. Treeline dynamics in relation to climatic variability in the central Tianshan Mountains, northwestern China. Glob. Ecol. Biogeogr. 2006, 15, 406–415. [Google Scholar] [CrossRef]
- Esper, J.; Büntgen, U.; Luterbacher, J.; Krusic, P.J. Testing the hypothesis of post-volcanic missing rings in temperature sensitive dendrochronological data. Dendrochronologia 2013, 31, 216–222. [Google Scholar] [CrossRef]
- Sigl, M.; Winstrup, M.; McConnell, J.R.; Welten, K.C.; Plunkett, G.; Ludlow, F.; Büntgen, U.; Caffee, M.; Chellman, N.; Dahl-Jensen, D.; et al. Timing and climate forcing of volcanic eruptions for the past 2500 years. Nature 2015, 523, 543. [Google Scholar] [CrossRef]
- Alfaro-Sánchez, R.; Nguyen, H.; Klesse, S.; Hudson, A.; Belmecheri, S.; Köse, N.; Diaz, H.F.; Monson, R.K.; Villalba, R.; Trouet, V. Climatic and volcanic forcing of tropical belt northern boundary over the past 800 years. Nat. Geosci. 2018, 11, 933–938. [Google Scholar] [CrossRef]
- Osborn, T.J.; Jones, P.D. The CRUTEM4 land-surface air temperature data set: Construction, previous versions and dissemination via Google Earth. Earth Syst. Sci. Data 2014, 6, 61–68. [Google Scholar] [CrossRef]
- Brohan, P.; Kennedy, J.J.; Harris, I.; Tett, S.F.B.; Jones, P.D. Uncertainty estimates in regional and global observed temperature changes: A new dataset from 1850. J. Geophys. Res. 2006, 111, 1–21. [Google Scholar] [CrossRef]
- Morice, C.P.; Kennedy, J.J.; Rayner, N.A.; Jones, P.D. Quantifying uncertainties in global and regional temperature change using an ensemble of observational estimates: The HadCRUT4 dataset. J. Geophys. Res. 2012, 117, 1–22. [Google Scholar] [CrossRef]
- Jones, P.D.; Lister, D.H.; Osborn, T.J.; Harpham, C.; Salmon, M.; Morice, C.P. Hemispheric and large-scale land surface air temperature variations: An extensive revision and an update to 2010. J. Geophys. Res. 2012, 117, 1–29. [Google Scholar] [CrossRef]
- Jones, P.D.; Osborn, T.J.; Briffa, K.R.; Folland, C.K.; Horton, B.; Alexander, L.V.; Parker, D.E.; Rayner, N.A. Adjusting for sampling density in grid-box land and ocean surface temperature time series. J. Geophys. Res. Atmos. 2001, 106, 3371–3380. [Google Scholar] [CrossRef]
- Jones, P.D.; New, M.; Parker, D.E.; Martin, S.; Rigor, I.G. Surface air temperature and its variations over the last 150 years. Rev. Geophys. 1999, 37, 173–199. [Google Scholar] [CrossRef]
- Mann, M.E.; Zhang, Z.; Hughes, M.K.; Bradley, R.S.; Miller, S.K.; Rutherford, S.; Ni, F. Proxy-based reconstructions of hemispheric and global surface temperature variations over the past two millennia. Proc. Natl. Acad. Sci. USA 2008, 105, 13252–13257. [Google Scholar] [CrossRef]
- Leclercq, P.W.; Oerlemans, J. Global and hemispheric temperature reconstruction from glacier length fluctuations. Clim. Dyn. 2012, 38, 1065–1079. [Google Scholar] [CrossRef]
- Ge, Q.; Hao, Z.; Zheng, J.; Shao, X. Temperature changes over the past 2000 yr in China and comparison with the Northern Hemisphere. Clim. Past 2013, 9, 1153–1160. [Google Scholar] [CrossRef]
- Liang, E.; Shao, X.; Qin, N. Tree-ring based summer temperature reconstruction for the source region of the Yangtze River on the Tibetan Plateau. Glob. Planet. Change 2008, 61, 313–320. [Google Scholar] [CrossRef]
- Briffa, K.R.; Jones, P.D.; Schweingruber, F.H.; Osborn, T.J. Influence of volcanic eruptions on Northern Hemisphere summer temperature over the past 600 years. Nature 1998, 393, 450–455. [Google Scholar] [CrossRef]
- Dai, J.; Mosley-Thompson, E.; Thompson, L.G. Ice core evidence for an explosive tropical volcanic eruption 6 years preceding Tambora. J. Geophys. Res. Atmos. 1991, 96, 17361–17366. [Google Scholar] [CrossRef]
- Jones, G.S.; Stott, P.A.; Christidis, N. Attribution of observed historical near-surface temperature variations to anthropogenic and natural causes using CMIP5 simulations. J. Geophys. Res. Atmos. 2013, 118, 4001–4024. [Google Scholar] [CrossRef]
- Shrestha, A.B.; Aryal, R. Climate change in Nepal and its impact on Himalayan glaciers. Reg. Environ. Change 2011, 11, 65–77. [Google Scholar] [CrossRef]
- D’Arrigo, R.; Wilson, R.; Liepert, B.; Cherubini, P. On the ‘divergence problem’ in northern forests: A review of the tree-ring evidence and possible causes. Glob. Planet. Change 2008, 60, 289–305. [Google Scholar] [CrossRef]
- Briffa, K.R.; Jones, P.D.; Schweingruber, F.H.; Karlén, W.; Shiyatov, S.G. Tree-Ring Variables as Proxy-Climate Indicators: Problems with Low-Frequency Signals; Springer: Berlin/Heidelberg, Germany, 1996; pp. 9–41. [Google Scholar]
- Vieira, J.; Nabais, C.; Campelo, F. Extreme Growth Increments Reveal Local and Regional Climatic Signals in Two Pinus pinaster Populations. Front. Plant Sci. 2021, 12, 658777. [Google Scholar] [CrossRef]
Publisher’s Note: MDPI stays neutral with regard to jurisdictional claims in published maps and institutional affiliations. |
© 2022 by the authors. Licensee MDPI, Basel, Switzerland. This article is an open access article distributed under the terms and conditions of the Creative Commons Attribution (CC BY) license (https://creativecommons.org/licenses/by/4.0/).