Article

The Growth and Physiological Characteristics of the Endangered CAM Plant, Nadopungnan (Sedirea japonica), under Drought and Climate Change Scenarios

1
Department of Crops and Forestry, Korea National University of Agriculture and Fisheries, Jeonju 54874, Jeollabuk-do, Korea
2
Research Center for Endangered Species, Division of Restoration Research, National Institute of Ecology, Yeongyang 36531, Gyeongsangbuk-do, Korea
3
Wetland Center, National Institute of Ecology, Changnyeong 50303, Gyeongsangnam-do, Korea
*
Author to whom correspondence should be addressed.
These authors contributed equally to this work.
Forests 2022, 13(11), 1823; https://doi.org/10.3390/f13111823
Submission received: 20 September 2022 / Revised: 19 October 2022 / Accepted: 19 October 2022 / Published: 2 November 2022
(This article belongs to the Section Forest Ecophysiology and Biology)

Abstract

:
No natural habitat of Sedirea japonica has been found in Korea for the past 20 years. This study was conducted to provide basic physiological data for the conservation strategy of this endangered plant in response to climate change. Soil fruit daylight system (SFDS) chambers were used and four treatment groups (2.6LVPD, 2.6HVPD, 8.5LVPD, and 8.5HVPD) were designed based on the RCP scenario (RCP 2.6, and 8.5) and VPD conditions (low VPD; LVPD, and high VPD; HVPD). Air dryness was induced in the HVPD groups during the daytime by increasing the atmospheric vapor pressure deficit (VPD). There was no significant difference based on the RCP scenario. However, the difference between LVPD and HVPD was considerable. Total CO2 uptake and transpiration were lower than those of LVPD due to the duration decrease of Phase I in 2.6HVPD and 8.5HVPD. There was a reduction in total biomass, leaf thickness, length, and the number of leaves. ABS/RC, DI0/RC, φD0, VK, VJ, and other chlorophyll fluorescence markers increased. φP0, RE0/RC, φE0, ψE0, φR0, RC/CS0, Sm, N, PIabs, DFabs, SFIabs, and PIabs,Total declined. Daily drought stresses impact the physiological mechanisms occurring at nighttime. The defense mechanisms against drought stress occur by conserving water by controlling the stomata, inactivating the reaction center, and increasing the dissipated energy through heat. In summary, S. japonica is flexible against drought stress.

1. Introduction

Climate change is caused by human activities that alter the composition of the global atmosphere, either directly or indirectly. Climate change happens in addition to natural climate variability observed over a prolonged period [1,2]. Notably, it is understood that the primary contributors to climate change are carbon dioxide and other greenhouse gases released by industrialization and the use of fossil fuels. Over the last 60 years, atmospheric CO2 concentration has grown by around 30% annually [3]. The Intergovernmental Panel on Climate Change (IPCC) offers representative concentration pathway scenarios (RCP scenarios), which are classified into four categories (2.6, 4.5, 6.0, and 8.5, respectively) based on the possible range of radiative forcing values in the year 2100. RCP 2.6 describes how an effective greenhouse gas reduction policy is implemented. RCP 8.5 illustrates a scenario that may occur if climate change accelerates relative to the present [2].
Crassulacean acid metabolism (CAM) plants use water efficiently [4]. Additionally, while C3 plants must adjust to changing climatic conditions, CAM plants have an advantage in surviving, even under these circumstances. CAM plants can withstand the current harsh climatic conditions and promote efficient photosynthetic pathway functioning by inhibiting photorespiration [5].
In general, CO2 absorption of CAM plants has four different phases depending on the period [6,7]. During Phase I, which lasts from nighttime until sunrise, CO2 is absorbed through open stomata with high stomatal conductivity and stored as malic acid in the vacuole [6,8]. Phase II represents a phase in which PEPC is inactivated and the gradual activation of Ribulose-1,5 bisphosphate carboxylase/oxygenase (RuBisCO) while the stomata are still open in the early morning. Phase III takes place during the daytime when the stomata are closed. CO2 is released during this phase and supplied to the Calvin cycle by the decarboxylation of the organic acids stored in the vacuoles [6,7,9]. Finally, Phase IV occurs when the stored organic acid is depleted as the time changes from day to night and is the phase in which CO2 emission and absorption are switched. CAM plants can absorb CO2 while conserving water even in a resource-poor environment [4,8].
However, many studies on the physiological responses and functions of CAM plants have not been conducted [9,10]. Specifically, studies on (1) the differences in susceptibility to climate change and environmental stress among CAM plant types, (2) the effects of concentrated CO2 on CAM plant carbon acquisition under climate change conditions, or (3) whether environmental stress during the day when the stomata are closed affects Phase I and carbon uptake at night are still missing. This is likely because CAM plants are less essential in agriculture than C3 and C4 crops [11,12].
Sedirea japonica, a CAM plant, has been registered as endangered by the Ministry of Environment in Korea [10,13,14]. No natural habitats for this species have been reported for the past 20 years, except for those transplanted into nature in Korea. For this reason, it has been selected as a priority restoration target species, and restoration projects are underway [14].
Endangered species plants with high ecological vulnerability, such as S. japonica, are seriously threatened by climate change [1,15]. Consequently, the physiological responses of these species to environmental factors can provide critical information for effective restoration.
In particular, S. japonica is an epiphyte orchid that grows on the surface of rocks or trees [16]. When local restoration is conducted, various levels of drought stress can be experienced due to complex factors, such as dry atmospheric conditions or a lack of moisture due to precipitation interruption. This study aims to provide physiological information on the impacts of drought stress on S. japonica with limited water supply under climate change conditions. It also aimed to evaluate the effects on CO2 absorption for S. japonica at night when additional dry atmospheric conditions occur during the day. The damage and recovery of the photosynthetic electron transport chain were also examined. Consequently, baseline data for developing a conservation strategy for endangered plant species, such as S. japonica, are presented.

2. Materials and Methods

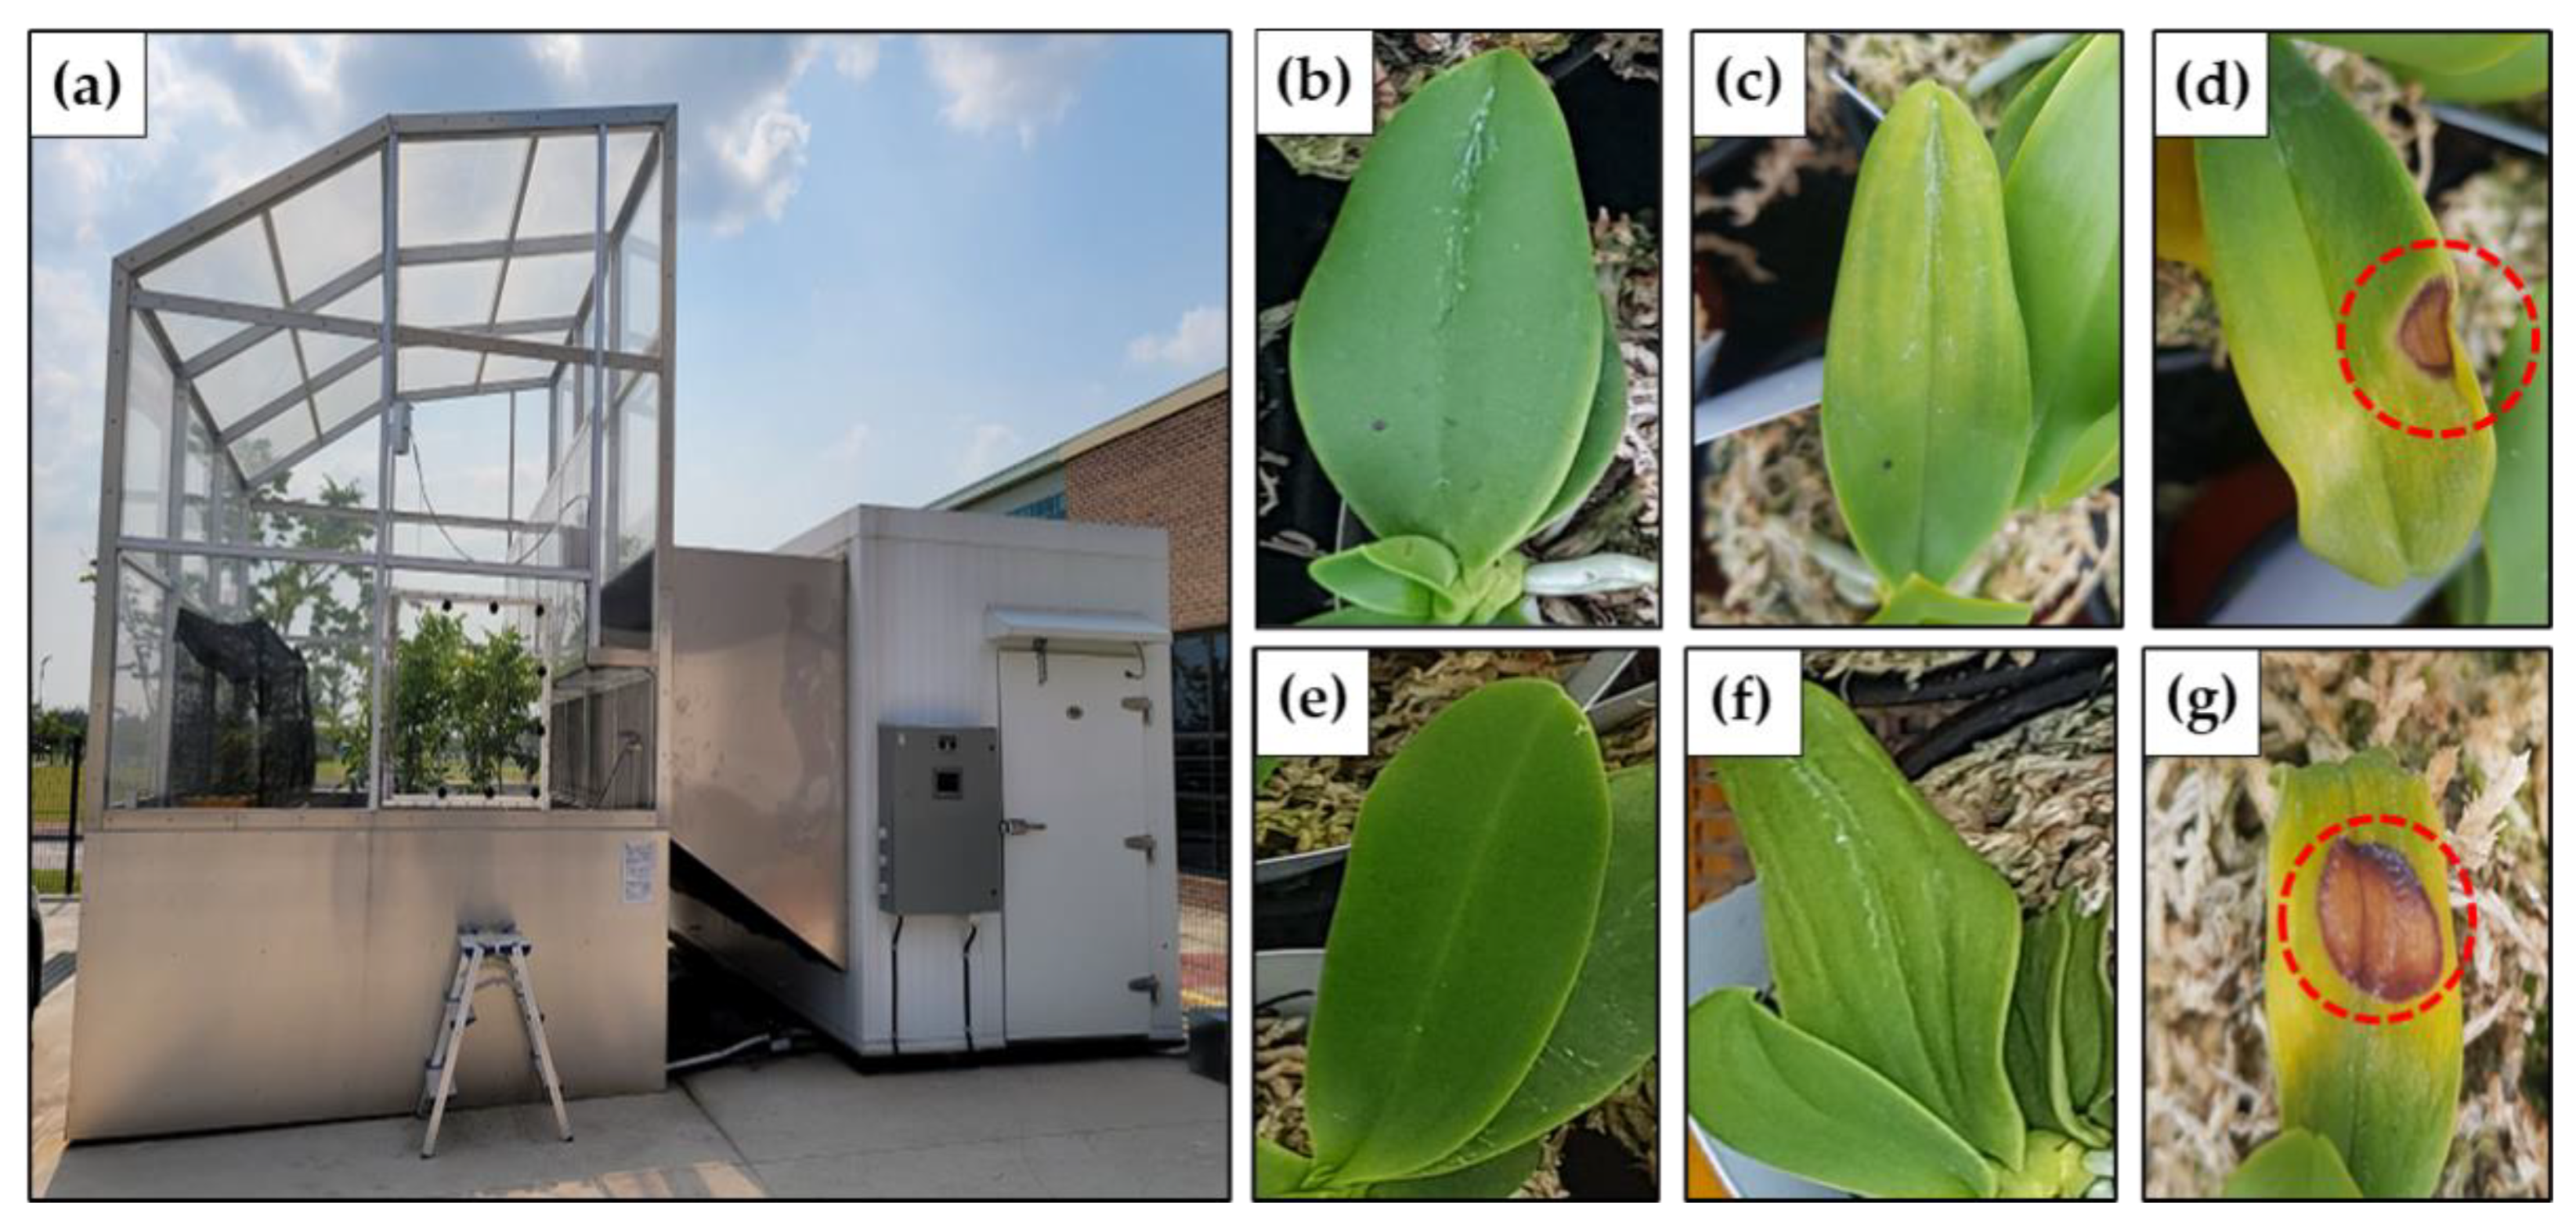
2.1. Plant Materials and Growth Conditions

A total of 100 specimens of S. japonicas were utilized in this experiment. The specimens were grown in a greenhouse for a year after being propagated via tissue culture at the National Institute of Ecology’s Endangered Species Restoration Center. On 15 June 2021, one S. japonica was planted in the center of a 10 cm diameter sphagnum-moss-filled pot. Then, it was cared for by bottom watering twice a week to keep the sphagnum moss from drying out.
Four natural light-type soil fruit daylight system (SFDS) chambers at the Korea National University of Agriculture and Fisheries, Climate Change Education Center (CCEC), were used. Precise environmental control is available in the SFDS chamber, which enabled us to conduct experiments related to climate change. Thus, atmospheric CO2 concentration and temperatures based on the RCP 2.6 and 8.5 scenarios have been given. In each chamber, 25 S. japonica were placed, with five repetitions of five specimens in each experimental group (2.6LVPD, 2.6HVPD, 8.5LVPD, and 8.5HVPD).
From the end of June to 5 August, climate change conditions were maintained for five weeks. The CO2 concentration of 2.6LVPD and 2.6HVPD was set to 400 ppm, and 940 ppm was maintained in the 8.5LVPD and 8.5HVPD groups. The temperature in the chamber was modified by season based on the average temperature in the Jeon-Ju during the previous three years. However, RCP 8.5 was set to RCP 2.6 + 2.6 °C, and the relative humidity was set to 60%, which was applied to all treatment groups.
Furthermore, the SFDS chamber was covered with plexiglass, which allowed up to 94% of natural light, raising concerns about high-intensity light damage. The damage induced by strong light intensity is reduced by 60% in darkened conditions [10]. Hence, shading nets were utilized in all treatment groups to provide an approximately 55% dark environment.
From 5 August 2021, atmospheric CO2 concentrations were maintained at 400 ppm and 940 ppm, respectively, in line with the current climate change scenario conditions. Still, drought stress was induced in the LVPD by cutting off the water. For HVPD, a temperature of 35 °C and a humidity of 35% were fixed from 10 a.m. to 4 p.m., along with water outage, and the visual damage patterns were monitored while providing dry atmospheric conditions based on the rise in atmospheric vapor pressure deficit (VPD) during the day. As a result, on 25 August, following three weeks of drought stress, the visual (foliar) damage to the leaves indicated in the figure was visible in 8% of all individuals at 2.6HVPD and 20% at 8.5HVPD (data not shown). It was also determined that the high water stress level induced by drought and air dryness had been reached (see Figure 1). The temperature and relative humidity were maintained at the same levels as before drought stress. The physiological recovery of S. japonica was seen for roughly one month until 25 September 2021. During the experiment, temperature, humidity, and CO2 concentration were monitored at one-hour intervals using a weather sensor mounted in the chamber.
During the experiment, the CO2 concentration in the chamber was kept constant at 443 ± 30.1, 432 ± 32.0, 944 ± 51.0, and 953 ± 40.4 ppm to mimic the conditions of the RCP 2.6 LVPD, RCP 2.6 HVPD, RCP 8.5 LVPD, and RCP 8.5 HVPD experimental groups. Furthermore, when comparing the difference in atmospheric vapor pressure deficit during the drought stress treatment period, 2.6LVPD and 8.5LVPD were treated with only water outages of 2.5 ± 0.1 and 2.9 ± 0.1 kPa, respectively. At the same time, HVPDs provided both water outages, and dry atmospheric conditions showed 4.4 ± 0.1 kPa, indicating a relatively harsh stress environment. However, temperature and humidity were controlled equally at night. Throughout the re-irrigation recovery phase, about 1.9 ± 0.3 kPa and 1.7 ± 0.2 kPa were maintained during the day (Figure 2).

2.2. Nocturnal Total CO2 Uptake and Transpiration

CO2 exchange rate and stomatal transpiration were measured twice: on 25 and 26 August, immediately after three weeks of drought stress treatment, and on September 17 and 18, after three weeks of recovery by re-irrigation. The experiment lasted from 5 p.m. until 8 a.m. the next day, with two individuals extracted randomly in four repetitions for each treatment group, and 32 samples were measured. A portable photosynthesis system, Li-6800, was used, as no light was irradiated. Additionally, the airflow into the chamber was set to 600 µmols−1, temperature 25 °C, relative humidity 60%, and CO2 concentration was adjusted to 400 ppm and 940 ppm, depending on the treated concentration. The total CO2 uptake and transpiration at night (7 p.m. to 6 a.m.; 12 h) were computed based on the measured results [10,17].

2.3. Growth Characteristics

The leaf thickness, length, and several leaves of all individuals were measured three times on 4 August, 25 August, and 24 September to investigate the characteristics of leaf growth before and after drought stress, and after re-irrigation. The thickness and length of the leaves were measured with vernier calipers. The leaf thickness was measured at the center of the leaf. On 25 September 2021, after all physiological experiments were completed, the dry weight of the leaves and roots from 40 subjects of S. japonica were measured by selecting two subjects in five repetitions for each treatment group. The samples were dried for 48 h at 80 °C using a Dryer (DS-80-5, Dasol Scientific Co., Ltd., Gyeonggi-do, Korea). The S/R ratio (shoot/root ratio), LWR, and RWR were calculated based on the data gathered.

2.4. Chlorophyll and Carotenoid Content

After monitoring the daily change in CO2 absorption, the chlorophyll and carotenoid contents of 20 subjects were tested in five repetitions for each treatment group. Except for the foliar phenomenon, samples were obtained from the center of the leaves. According to Hiscox and Isarelstam [18], 0.1 g of a leaf sample was put into a 20 mL UV-blocking brown vial containing 10 mL of DMSO (Dimethyl Sulfoxide). Leaf pigments were extracted for 6 h at 60 °C in a thermostat. The absorbance of the extracted samples was measured using an ultraviolet/visible spectrophotometer (UV/VIS Spectro-photometer, HP 8453, Hewlett-Packard, USA) at wavelengths of 663, 645, and 470 nm. The above results were used to compute chlorophyll (Chl) a, b, total chlorophyll content, and carotenoid (Car) content, as well as chlorophyll a/b and total Chl /Car [19,20].

2.5. Chlorophyll a Fluorescence

OKJIP analysis was performed to analyze chlorophyll fluorescence to demonstrate the polyphasic rise of chlorophyll a fluorescence transients, and a Plant Efficiency Analyzer (Hansatech Instrument Ltd., King’s Lynn, UK) was used. From 4 August to 8 September, 80 specimens were measured weekly by choosing four specimens per five repetitions for each treatment group. The area showing foliar burn phenomena was excluded. After 20 min of dark adaptation, the leaves were irradiated with 3500 molm−2s−1 of light for 1 s. Chlorophyll fluorescence densities of 50 μs (stage O), 300 μs (stage K), 2 ms (stage J), 30 ms (stage I), and 500 ms (stage P) were investigated. Through the OKJIP analysis results, biophysical parameters (ABS/RC, DI0/RC, TR0/RC, ET0/RC, RE0/RC, φP0, ψE0, φE0, δR0, φR0, φD0, ρR0, RC/ABS, RC/CS0, VK, VJ, VI, M0, Sm, N, VK/VJ, 1-VI, PIabs, DFabs, SFIabs, and PIabs,Total) [21] were computed (Table 1).

2.6. Statistical Analysis

The homogeneity of the variance assumption was tested using Levene’s test for each measurement date, total CO2 exchange rate and transpiration rate at night time, chlorophyll a fluorescence, chlorophyll, and carotenoid contents, and growth characteristics. The growth characteristics evaluated were leaf thickness, length, number of leaves, and dry weight of each part. A one-way ANOVA and Tukey’s HSD test was used if the assumptions were satisfied. If the assumptions were not fulfilled, Welch’s test and Games–Howell’s post hoc analysis were used. Furthermore, the change in chlorophyll fluorescence index as drought stress persisted was displayed using a spider plot. A principal component analysis (PCA) was used to illustrate the relationship between growth conditions and the chlorophyll fluorescence index in the third week of drought stress. The SPSS Statistics Program (Version 19.0) was used for all statistical analyses. A biplot based on the PCA results was prepared using a CSM analyzer (ver. 7).

3. Results

3.1. Nocturnal Total CO2 Uptake and Transpiration

It is shown in Figure 3 that S. japonica features scotoactive stomata, similar to other CAM plants, with stomata that close during the day and open at night. During the third week of drought stress treatment (25 August), there was no difference in the beginning time of Phase IV and Phase II between the climate change treatments (RCP 2.6 and RCP 8.5). However, based on drought stress levels (LVPD and HVPD), 2.6HVPD and 8.5HVPD had relatively late Phase IV entry and early Phase II onset. Such a result is a confirmation that the overall length of Phase I was shortened. Remarkably, 2.6HVPD remained in Phase IV until 8 p.m., whereas Phase II began at 4 a.m. This is an indication that Phase I, in which stomata are opened to absorb CO2, was the shortest (Figure 3a). This can be interpreted as a mechanism for reducing water loss by decreasing the stomata opening time in response to the comparatively low partial pressure of CO2 in the atmosphere and a lack of moisture due to drought stress. It can be seen that dry atmospheric conditions during the day affect CO2 absorption at night.
In the third week of re-irrigation recovery (17 September), 8.5HVPD entered Phase I around 6–7 p.m., one hour earlier than other treatment groups, which began absorbing CO2 at 7–8 p.m. However, there was no significant difference in the length of Phase I in the treatment group (Figure 3b).
Comparing the total CO2 uptake and the transpiration rate at night according to drought stress (Figure 4), individuals adapted to the RCP 8.5 scenario had a relatively high CO2 uptake tendency compared to RCP 2.6. Scenario 8.5LVPD had the highest CO2 uptake of 83.8 mmol CO2 m−2, which was about twice as high as 2.6LVPD and was adapted to an atmospheric CO2 concentration of 400 ppm. However, under extreme drought stress conditions (2.6HVPD and 8.5HVPD), with increased atmospheric dryness throughout the day, the CO2 partial pressure effect in the atmosphere was considerably decreased due to stomata limitation, resulting in the lowest CO2 absorption (p > 0.05). On 17 September, three weeks after re-irrigation, total CO2 absorption at night was 8.5LVPD > 8.5HVPD > 2.6LVPD, and 2.6HVPD, indicating an increase in total CO2 absorption under climate change conditions. Notably, drought stress under dry atmospheric conditions increased 2.6HVPD and 8.5HVPD by 3.1–3.3 times, respectively. There was a recovery to levels not statistically different from 2.6LVPD and 8.5LVPD (Figure 4a). When the stoma was opened, the transpiration calculated in Phase I showed the lowest transpiration at 8.5HVPD. In the 2.6HVPD experimental group, there was also a relatively low trend compared to 2.6LVPD and 8.5LVPD. However, during recovery through re-irrigation, 2.6HVPD increased production to a level similar to 2.6LVPD and 8.5LVPD. In contrast, 8.5HVPD had the lowest transpiration rate, suggesting that the accumulated water shortage throughout the drought stress period had not been fully fixed (Figure 4b).

3.2. Growth Characteristics

There was no significant difference in leaf thickness based on the climate change conditions until around August 5 (p > 0.05). However, as the drought stress treatment continued, all treatment groups tended to decline gradually. The 8.5HVPD experimental group had the lowest value, as leaf thickness decreased by ~25%. 2.6LVPD, on the other hand, showed the least decline in leaf thickness. After one month of recovery by re-irrigation, physical recovery was seen to be at the same level as in all treatment groups (Figure 5).
The leaf length in scenario RCP 2.6 was slightly longer than that of RCP 8.5, depending on the climate change conditions. The 2.6LVPD and 8.5LVPD experimental groups had no significant change in leaf length compared to the 2.6HVPD and 8.5HVPD groups. These latter scenarios tended to shorten leaf length by 3.2% and 8.1%, respectively (Figure 5). These decreases in leaf length were all within 10%, which is thought to be related to the contraction of the mesophyll tissue owing to a lack of water rather than necrosis at the tip of the leaf.
According to the climate change scenario, individuals grown under the RCP 8.5 condition tended to have fewer leaves than those grown under the RCP 2.6 condition. Furthermore, neither the 2.6LVPD nor the 8.5LVPD saw any leaf fallout during the drought stress period. Nonetheless, the 2.6HVPD and 8.5HVPD groups experienced a rather noticeable decrease in the number of leaves. Notably, the 8.5HVPD had 4.9 ± 1.6 leaves, roughly 1.8 fewer than the 2.6LVPD (Figure 5). Even after recovery, the tendency continued to decline. Still, this also happened for the 2.6LVPD and 8.5LVPD groups of relatively low-intensity drought stress. All treatments had leaf loss by the end of September. This was assumed to be due to a seasonal phenomenon in which the temperature declined, and growth ceased.
The dry weight of S. japonica reported in Table 2 was measured after growing for approximately three months under climate change circumstances from June to September. This drought stress treatment was reflected for three weeks throughout this period. Although no significant difference was observed based on climate change treatment, leaves, roots, and total dry weight were significantly reduced in the experimental groups 2.6HVPD and 8.5HVPD. Compared to 8.5LVPD, the total dry weight of 8.5HVPD fell by roughly 33%, while 2.6HVPD decreased by approximately 23%. It was shown that under climate change conditions (RCP 8.5), the overall growth rate decreased substantially when drought stress was combined with increased air dryness. Additionally, in the case of S/R ratio, leaf weight ratio (LWR), and root weight ratio (RWR), which can be compared with the size of growth by leaves and roots, respectively, there was no significant trend in all treatment groups (p < 0.05). This result indicated no difference in the size of the relative growth of the leaves or roots.

3.3. Chlorophyll and Carotenoid Content

As a result of comparing the chlorophyll and carotenoid contents of S. japonica, no significant difference was observed depending on the climate change conditions in both the third week of the drought stress treatment and the third week after the recovery treatment. However, the chlorophyll a/b of 2.6HVPD and 8.5HVPD showed a significantly lower trend (p < 0.05). Additionally, after re-irrigation, chlorophyll a, b, total chlorophyll, and carotenoid contents were significantly increased in all treatment groups compared to the third week of drought stress. Still, chlorophyll a/b was 36%–42% lower than the drought stress period in other treatments. The exception was 2.6LVPD, which tended to decrease. In the case of 2.6LVPD, chlorophyll a/b increased by ~10% compared to the third week of drought stress, showing the highest value (Table 3).

3.4. Chlorophyll a Fluorescence

The spider plot in Figure 6 illustrates the relative size of the chlorophyll fluorescence index, about 2.6LVPD, during climate change and drought stress conditions. It demonstrates changes in indicators, such as PSII reaction center activity and the electron transport pathway leading to PSI.
There were increases in ABS/RC, DI0/RC, TR0/RC, φD0, VK, and VJ due to drought stress and decreases in φP0, RE0/RC, ψE0, φE0, φR0, RC/CS0, Sm, and N of S. japonica. However, there was a significant difference in the range of changes between the indicators based on the treatment group, with 2.6HVPD and 8.5HVPD showing a more significant difference than 8.5LVPD. Additionally, unlike the 2.6HVPD and 8.5LVPD groups, which had a gradual increase or decrease as drought stress continued, 8.5HVPD had the highest ABS/RC, DI0/RC, and φD0 at two weeks of drought stress (18 August). φP0 and φE0 had the lowest trends. Still, they temporarily recovered three weeks after drought stress treatment (24 August) (Figure 6).
The indications that changed most among the chlorophyll fluorescence indicators were the absorbed light energy per reaction center, ABS/RC. Additionally, the energy missed by the reaction center dissipated as heat, DI0/RC. Compared to 2.6LVPD, 2.6HVPD grew by 2.7 and 6.6 times in three weeks (24 August) following drought stress treatment, and 8.5HVPD increased by 2.7 and 6.8 times, respectively (Figure 6).
There were significant decreases in indexes, such as the quantum yield of the electron transport process, φP0, the maximum quantum yield in the initial photochemical reaction, φE0, the energy transfer ratio of electron transport after QA-, and φR0, quantum yield for terminal acceptor reduction of PSI per absorbed photon. Remarkably, after three weeks of drought stress treatment (24 August), all three indicators were <50% compared to 2.6LVPD. On the other hand, ψE0, the ratio at which the trapped exciton transports an electron into the electron transport chain beyond QA- did not drop significantly (Figure 6).
In the RC/CS0, which showed the number of active PSII reaction centers per cross-section, there was no significant change in 8.5LVPD. However, 2.6HVPD and 8.5HVPD were 40% and 22% lower in the second week of drought stress (18 August) compared to 2.6LVPD. After three weeks of drought stress (24 August), temporary recovery was achieved by 51% and 44%, respectively. On 8 September, two weeks after re-irrigation recovery treatment, most indicators had an apparent recovery, while ABS/RC and DI0/RC remained significantly high (Figure 6).
VK/VJ is an indicator of PSII donor-side limitation, and a temporary drop was observed in all treatment groups until seven days of drought stress. Following that, under constant stress, 2.6HVPD and 8.5HVPD rose linearly. After three weeks (25 August), 8.5HVPD had the highest VK/VJ, followed by 2.6HVPD > 8.5LVPD > 2.6LVPD. During recovery through re-irrigation, VK/VJ of 8.5HVPD showed a relatively prolonged recovery (Figure 7).
1-VI, which refers to the efficiency/probability with which a PSII trapped electron is transferred to the PSI acceptor side, shows an overall trend in contrast to VK/VJ. After three weeks of drought stress, 8.5HVPD and 2.6HVPD showed only 62% and 65% of 8.5LVPD and 2.6LVPD, respectively. Additionally, one week after recovery, 2.6HVPD did recover to a level almost identical to 2.6LVDP, while 8.5HVPD recovered gradually (Figure 7).
PIabs, DFabs, SFIabs, and PIabs,Total are indicators of the vitality indexes of the photosynthetic apparatus. There was no significant change for groups 2.6LVPD and 8.5LVPD, which stopped only irrigation during drought stress, while PIabs and PIabs,Total indicated a slight increase. However, the groups such as 2.6HVPD and 8.5HVPD showed a very sharp decrease, showing an opposite trend. In particular, DFabs significantly decreased on August 18, the second week of drought stress, and then recovered considerably, indicating divergence from other vitality indicators (Figure 7).

4. Discussion

4.1. Nocturnal Total CO2 Uptake and Transpiration

It is known that CO2 absorption in CAM plants works independently with light, and the stomatal opening is regulated by the internal CO2 concentration and the circadian clock [9,22]. In CAM plants, the stomata close as the internal CO2 concentration of the leaf rises at the beginning of Phase III. The onset of Phase IV, which begins to open the stomata, is regulated not only indirectly by light intensity and internal CO2 reduction but also by circadian rhythms that impose restrictions on the circadian clock [9,23,24,25]. Relatively late Phase IV entry and early Phase II activation were observed in 2.6HVPD and 8.5HVPD, which increased the air dryness in addition to the water outage. This indicates that Phase I was the shortest overall (Figure 3), indicating that CAM plants are more susceptible to drought conditions than climate change. It is thought to provide resilience for optimizing carbon capture and water consumption by shortening the time of net CO2 uptake during drought stress. These findings support the idea that when CAM plants are exposed to acute drought stress, their net CO2 uptake declines. Therefore, they may have an idle phase that prevents excess water loss by recycling respiration CO2 in closed stomatal conditions during the day cycle [7,26].
CAM plants generally absorb more CO2 when exposed to high atmospheric CO2 concentrations [27]. When the atmospheric CO2 concentration doubled, CO2 uptake of Agave salmiana rose to 59% [28], while it rose to 25%–31% with Phalaenopsis. This reaction is also commonly observed in C3 plants. Kimball et al. [29] reported that an increase in atmospheric CO2 concentration increases the partial pressure of CO2 in the plant. Therefore, there is the facilitation of CO2 diffusion from the atmosphere to the photosynthetic organ, increasing the photosynthetic rate. Additionally, it has been reported that a high atmospheric CO2 concentration enhances the activity of RuBisCO in phases II and IV. Consequently, the fixed amount of CO2 also increases [27,30]. In the case of S. japonica, the individuals acclimatized to the RCP 8.5 scenario also showed relatively high CO2 uptake, which was more pronounced after recovery through re-irrigation. However, under extreme drought stress conditions (2.6HVPD and 8.5HVPD groups) the influence of partial CO2 pressure in the atmosphere was reduced due to stomatal limitation. Thus, it resulted in relatively low CO2 absorption and transpiration (p > 0.05). This indicates a mechanism for responding to drought by suppressing CO2 absorption and transpiration while minimizing stomatal opening at night for water retention. In the case of CAM plants, even under drought-stress circumstances where CO2 absorption is significantly reduced, CO2 produced during respiration may be collected and reassimilated, allowing for long-term survival [8].

4.2. Growth Characteristics

The drought stress decreased the leaf thickness of S. japonica, and the length and number of leaves tended to decrease. The highest change was seen at 8.5HVPD. Differences in plant water potential commonly control leaf growth rates [31]. With higher CO2 concentrations, plants enhance water use efficiency and raise cell expansion pressure, resulting in cell wall relaxation and cell division [32]. A CO2-enriched environment is known to dramatically improve leaf growth, as assessed by the number of leaves, leaf length, and leaf width via this response [33].
It is known that CAM plants exposed to a high CO2 environment become thicker overall, with a larger plant body and a more fleshy texture [34]. A decrease in leaf thickness can affect the size of the intercellular vacuole, with the actual size of the vacuole acting as a limiting factor for the vacuole’s storage capacity [9,35]. Because CAM plants, such as S. japonica, store CO2 absorbed at night as malate in the vacuole, the development of the vacuole can have a significant impact on CO2 absorption [36]. This tendency was not observed in S. japonica grown for three months under climate change circumstances (Table 3). Long-term treatment is required to continue research into the link between changes in leaf thickness, vacuole storage capacity, and the amount of CO2 uptake. Even in the case of the Phalaenopsis Orchid (Doritaenopsis Queen Beer ‘Mantefon’), a plant akin to S. japonica, leaf thickness development was not found [37].
In the case of S. japonica, when grown under climate change conditions, it may affect the length and number of leaves rather than the thickness of the leaves. It can be observed that when drought stress is accompanied, leaf thickness, leaf length, and the number of leaves are all significantly reduced. Primarily based on the scale of drought stress, the leaf thickness and number of leaves, rather than the length of the leaves, were considerably reduced. It can be regarded as an adaptive response to drought by removing the assimilation organ responsible for transpiration and energy consumption.
A dramatic decrease tendency was seen in the leaves, roots, and total dry weight of the drought stress-treated group, equivalent to the total CO2 uptake as evaluated during the third week of drought stress. As can be observed, even with the eventual recovery increasing total CO2 absorption, the low CO2 absorption at this time has a significant negative impact on growth.
However, the total nighttime CO2 absorption and biomass did not match, depending on how climate change is handled. It was demonstrated that 8.5HVPD was over double the total CO2 absorption at night compared to 2.6LVPD. Still, biomass only increased by approximately 3%, and no statistical significance was found (p > 0.05). CAM plants absorb carbon at a rate that is only half that of C3 plants and a third that of C4 plants per day, which causes them to develop relatively slowly, even under conditions of sufficient water and atmospheric CO2 concentration [8]. Even when the total nighttime CO2 uptake grows, as the temperature and atmospheric CO2 concentration rise, the total biomass does not change considerably, or even slightly declines, because of the increased material consumption caused by respiration [10,33]. The total dry weight of individuals grown in environments with 650 ppm atmospheric CO2 and a temperature of +3 °C higher than the control was around 17%–56% lower [10]. Phalaenopsis ‘Fuller’s Pink Swallow’ also showed no significant difference in the biomass and dry weight of the shoot due to raising the CO2 concentration from 450 ppm to 800 ppm. The root dry weight was also reported to be 1.92 g and 1.96 g, respectively, with no significant difference [33].

4.3. Chlorophyll and Carotenoid Content

In drought circumstances, a shortage of water in the leaves causes damage to the chloroplast membrane, resulting in a decrease in chlorophyll content [38] and an increase in leaf damage owing to photo-oxidative stress [39]. Munné-Bosch et al. [40] observed that a decrease in chlorophyll concentration during drought is also a negative factor limiting plant growth. However, it has an effective aspect in reducing photo-oxidative damage. In the case of S. japonica, chlorophyll content and visible damage trends were not observed in the drought group when a simple water outage was treated. However, partial leaf foliation was found in the groups that had their atmospheric vapor pressure deficit enhanced (Figure 1). Notably, this foliar phenomenon was found in 20% of all samples at 8.5HVPD. The SPAD value also indicated a significant downward trend (p < 0.05), which implies that the photo damage to leaves is thought to be exacerbated when severe drought stress is evident. Additionally, the 60% shading rate [10] reported as an appropriate amount of light for growth in previous studies shows that photo-damage may occur due to additional stress conditions such as drought. In the instance of Phalaenopsis orchid “Edessa,” a plant in the same family as S. japonica, no significant variation in chlorophyll a, chlorophyll b, and total chlorophyll was seen in the control and drought stress treatment groups after six weeks of water outage [7]. However, in the case of chlorophyll a/b, significant reductions were observed at 2.6HVPD and 8.5HVPD. This trend indicated that the difference in chlorophyll a was more significant than the difference in chlorophyll b compared to LVPD. This implies that the reduction in chlorophyll a is the primary source of the drop in chlorophyll a/b. Chlorophyll a is mainly bound to the reaction center, and the decrease in chlorophyll a is highly related to the inactivation of the reaction center [7]. As a result, it is believed that water outages and high air dryness under climate change conditions cause severe drought stress, and chlorophyll a/b decreases more dramatically.

4.4. Chlorophyll a Fluorescence

Continuous drought stress leads to an increase in the closed reaction center (M0) [41] and a decrease in the active reaction centers (RC/CS0), and the absorbed light energy per reaction center (ABS/RC) is rapidly increasing. It is known that this increase in ABS/RC is highly related to the decrease in effective antenna size due to early leaf aging (decomposition of chlorophyll) induced by drought stress and inactivation of PSII response centers [42]. Additionally, chlorophyll a and a/b decreased in 2.6HVPD and 8.5HVPD, which is mainly related to the reaction center [43]. (Table 2).
As drought stress continued in all treatments, VK, VJ, and VK/VJ gradually increased. The oxygen-evolving complex (OEC) activity must be maintained for the primary electron donor to transfer electrons to the initial electron acceptor QA- via pheophytin [8]. An increase in VK is known as an indication of OEC inactivation. Furthermore, efficient regeneration of the initial electron acceptor QA- (ψE0) in the electron transport chain (ETC) is essential for the smooth photosynthetic process. In the case of S. japonica, drought stress delays QA- regeneration, and electrons transferred from the charge separation of pheophytin accumulate excessively. This inhibition of electron transport at the PSII receptor site has been shown by an increase in VJ [44,45]. However, because the rise in VK/VJ emerged one week following drought stress treatment, the limitation on the electron donor side (VK) of PSII, rather than the restriction on the electron acceptor side (VJ, ψE0), can be considered a primary component in increasing chlorophyll fluorescence.
Additionally, Sm, which shows the energy required to close all reaction centers, and N, which shows the number of QA turnovers, reflect the size of the PQ pool through which electrons move after QB [44,46]. This implies that the size of PSII continuously decreases due to drought stress.
Excessively excited energy limits damage to the thylakoid membrane and the energy transfer process in PSII by inactivating the PSII reaction center [44,47]. There is a positive relationship between the degree of thylakoid membrane damage and the reliability of chlorophyll fluorescence data [48]. It can be seen that drought stress affects electron transport in PSII by decreasing the maximum quantum yield (φP0), the quantum yield of electron transport after QA-, and the energy transfer rate (φE0). Additionally, under drought stress circumstances, φR0, δR0, and ρR0, related to the reduction of the terminal receptor of PSI and the energy ratio of captured energy to PSI, had a considerable drop. As can be seen, the limitation on the electron acceptor side of PSI occurs concurrently.
Increases in DI0/RC and φD0 are excitation energy dissipation to prevent damage to these photosynthetic apparatuses and reduce restriction on energy flow. It is known that a decrease in RC/CS0 and an increase in DI0/CS0 can act as a sink of excitation energy in the reactive PSII reaction center, preventing further damage to itself and protecting the RC of the adjacent active PSII [44]. Particularly, it can be shown that in 8.5HVPD, DI0/RC and φD0 dramatically rose in the two weeks of drought stress, a little earlier than 2.6HVPD. RC/CS0 was also reduced to the lowest value, contributing to the temporary recovery of φP0 and φE0. P680 of PSII (TR0) captures the energy absorbed by the antenna (ABS). The captured excitation energy was used for charge separation from pheophytin into QA and QB at the reaction center of PSII. After the reduction of QA, the reduction of the reaction center of PSI (RE0) occurs through electron transport (ET0) [7].
In the case of S. japonica, TR0/RC maintained a relatively low level at 2.6HVPD and 8.5HVPD during the second week of drought stress but increased to 19% and 27%, respectively, during the third week of drought stress. This suggests that it is efficiently dissipated as heat (DI0), and relatively ET0/RC does not decrease under drought stress, suggesting that the photosynthetic apparatus of PSII is protected from excessive excitation energy.
PIabs is a combined value of three indicators: the density of active reaction centers in chlorophyll (RC/ABS), the initial photochemical reaction (φP0), and electron transfer (ψ0). This represents the energy conservation efficiency in reducing electron carriers using absorbed light energy. DFabs is an indicator that quantifies the potential of photosynthesis, and SFIabs is an indicator showing the structural and functional response of PSII, which induces electron transport during photosynthesis [49,50]. The energy conservation efficiency and structural and functional damage of the photosynthetic apparatus at 2.6HVPD and 8.5HVPD tended to diminish dramatically until the second week of drought stress. Due to the highly active response of DI0/RC and φD0 in the case of 8.5HVPD, the driving force (DFabs) of the electron transport process was momentarily restored during the third week of drought stress.
Notably, for 2.6LVPD, PIabs,Total, which depicts the performance of PIabs and PSI terminal electron acceptors [51], demonstrated a progressive increase from drought stress to recovery. This is also thought to be connected to the rise in chlorophyll content. Due to an improvement in water conditions overall, 2.6LVPD increased in chlorophyll content, but in other treatment groups, chlorophyll a/b declined. The rise in PIabs and PIabs,Total is believed to be positively impacted by the increase in chlorophyll bound to the reaction center.
Consequently, when drought stress is accumulated, in contrast to 8.5LVPD, in 2.6HVPD and 8.5HVPD, the limit of the electron acceptor of PSI and the restriction of the electron donor of PSII are both demonstrated. A significant decrease in Sm, N, φE0, φR0, and PIabs suggests that only a portion of the absorbed light energy is used for electron transport, in contrast to the increase in ABS/RC. These results show that conditions with water outage and increased air dryness during the week provide significantly higher stress than drought stress caused simply by water outage and prevent a smooth electron transport process. However, the mechanism that limits the antenna size and dissipates thermal energy to protect the photosynthetic apparatus is actively operating, demonstrating that recovery also happens swiftly.
The activity of enzymes, such as phosphoenolpyruvate carboxylase (PEPcase), involved in carbon reduction and electron transport in photosynthesis, may be impacted by specific stressors, such as extreme water deprivation [52]. PEPcase is an enzyme involved in the initial fixation of atmospheric CO2, and is activated at night and must be deactivated during the day so that carbon dioxide derived from malic acid is not consumed. The activity of PEPcase is regulated by reversible phosphorylation [8,53]. Additionally, PEPcase has a CO2 affinity that is approximately 10 times greater than RuBisCO [54]. Hence, PEPcase activity is a major limiting factor for CAM plant carbon assimilation [4].
Becerril and Valdivia [55] found that acute water deprivation reduced PEPcase activity by 20% and electron transfer rate by 29% in Opuntia ficus-indica, a CAM plant. Lopes et al. [52] proposed that these physiological characteristics were caused by changes in protein synthesis induced by dehydration.
Even in S. japonica, under extremely dry circumstances, the entire electron transport flow, including PIabs, SFIabs, DFabs, and PIabs,Total, was inhibited. In particular, it was discovered that an increase in VK/VJ led to an increase in the inactivation of OEC, which decomposes water molecules. This result is believed to affect photophosphorylation, which contributes to PEPcase activation [8].
According to the principal component analysis (PCA), the dispersion of chlorophyll a fluorescence parameters following climate change and drought stress may explain 68.3% in main component 1 (PC 1), 16.0% in principle component 2, and 84.3% overall. The distribution of 2.6LVPD and 8.5HVPD, which experienced extreme drought stress by rising atmospheric vapor pressure deficit at the same time as water outages under RCP 8.5 was noted to be on opposite sides of PC 1. The location of 8.5HVPD on the left side of the PC 1 axis was in a region where the indications of the functional index (PIabs, PIabs,Total, SFIabs, and DFabs), energy yield (φP0, ψE0, φE0, φR0), and reaction center activity (RC/CS0) were sensitively lowered. At the same time, the indicators of BS/RC, VK/VJ, VK, VJ, and φD0 were sensitively enhanced. On the other hand, it was found that 2.6LVPD was distributed to the right of the PC 1 axis (Figure 8).

5. Conclusions

Severe drought stress was observed under the RCP 8.5 scenario conditions when there was a water outage and an increase in the daytime atmospheric vapor pressure deficit. This shortened the period of net CO2 absorption at nighttime, while total CO2 uptake and transpiration decreased. It was also shown to affect leaf growth (thickness, length, and number of leaves). It was discovered that re-irrigation resulted in a relatively rapid recovery. It was determined to have elasticity in photosynthetic function and physical structure to optimize carbon acquisition and water consumption. It was found that under drought stress caused by water outage, water retention in the system and electron transport flow in the photosynthetic process remained relatively efficient under climate change conditions. However, when accompanied by high air dryness during the daytime, an effective protection mechanism from excessive excitation and photo-damage caused by drought stress occurred. In such a mechanism, chlorophyll a/b reduction, reaction center inactivation, decrease in energy transfer to the ETC, and a dramatic increase in heat dissipation occur. These responses contribute to avoiding irreversible damage to the photosynthetic apparatuses under severe drought stress after recovering through re-irrigation.
These findings indicate that S. japonica has photosynthetic and water retention flexibility under extreme drought stress. Such flexibilities allow CAM plants to bear ecological adaptations under various environmental conditions by advancing the physiological understanding of the relationship between electron transport chains and carbon fixation mechanisms.

Author Contributions

Conceptualization, K.C.L.; data curation, J.E.H.; investigation, J.E.H., P.B.K., H.B.P., H.J.P., S.K., C.W.L. and B.D.L.; project administration, N.Y.K. and K.C.L.; writing—original draft, Y.G.S.; writing—review & editing, J.A. All authors have read and agreed to the published version of the manuscript.

Funding

This research was supported by the National Institute of Ecology (NIE), NIE-C-2022-47.

Conflicts of Interest

The authors declare no conflict of interest.

References

  1. IPCC. Climate Change 2014: Synthesis Report. Contribution of Working Group I, II, and III to the Fifth Assessment Report of the Intergovernmental Panel on Climate Change; IPCC: Geneva, Switzerland, 2014; pp. 1–151. [Google Scholar]
  2. Korea Meteorological Administration. Analysis of Climate Change Forecasts on the Korean Peninsula; Korea Meteorological Administration: Seoul, Korea, 2018; p. 16.
  3. Malhi, G.S.; Kaur, M.; Kaushik, P. Impact of climate change on agriculture and its mitigation strategies: A review. Sustainability 2021, 13, 1318. [Google Scholar] [CrossRef]
  4. Taiz, L.; Zeiger, E. Plant Physiology, 4th ed.; Sinauer Associates: Sunderland, MA, USA, 2006; pp. 180–183. [Google Scholar]
  5. Rathore, A.; Jasrai, Y.T. Growth and chlorophyll levels of selected plants with varying photosynthetic pathways (C3, C4, and CAM). Int. J. Sci. Eng. Res. 2013, 4, 1–4. [Google Scholar]
  6. Osmond, C.B. Crassulacean acid metabolism: A curiosity in context. Annu. Rev. Plant Physiol. 1978, 29, 379–414. [Google Scholar] [CrossRef]
  7. Ceusters, N.; Valcke, R.; Frans, M.; Claes, J.E.; Van den Ende, W.; Ceusters, J. Performance index and PSII connectivity under drought and contrasting light regimes in the CAM orchid Phalaenopsis. Front. Plant Sci. 2019, 10, 1012. [Google Scholar] [CrossRef] [PubMed] [Green Version]
  8. Hopkins, W.G.; Hüner, N.P.A. Introduction to Plant Physiology, 4th ed.; John Wiley and Sons: New York, NY, USA, 2008; pp. 205–208. [Google Scholar]
  9. Hogewoning, S.W.; van den Boogaart, S.A.; van Tongerlo, E.; Trouwborst, G. CAM-physiology and carbon gain of the orchid Phalaenopsis in response to light intensity, light integral, and CO2. Plant Cell Environ. 2021, 44, 762–774. [Google Scholar] [CrossRef]
  10. Lee, K.C.; An, J.; Hwang, J.E.; Kim, P.B.; Park, H.B.; Kim, S.; Park, H.J.; Lee, C.W.; Lee, B.D.; Kim, N.Y. Effects of light condition on growth and physiological characteristics of the endangered species Sedirea japonica under RCP 6.0 climate change scenarios. Plants 2021, 10, 1891. [Google Scholar]
  11. Davis, S.C.; Simpson, J.; Gil Vega, K.d.C.; Niechayev, N.A.; van Tongerlo, E.; Castano, N.H.; Dever, L.V.; Búrquez, A.A. Undervalued potential of crassulacean acid metabolism for current and future agricultural production. J. Exp. Bot. 2019, 70, 6521–6537. [Google Scholar] [CrossRef] [Green Version]
  12. Yang, X.; Cushman, J.C.; Borland, A.M.; Edwards, E.J.; Wullschleger, S.D.; Tuskan, G.A.; Owen, N.A.; Griffiths, H.; Smith, J.A.; De Paoli, H.C.; et al. A roadmap for research on crassulacean acid metabolism (CAM) to enhance sustainable food and bioenergy production in a hotter, drier world. New Phytol. 2015, 207, 491–504. [Google Scholar] [CrossRef]
  13. Suetsugu, K.; Tanaka, K. Pollination of Sedirea japonica (Orchidaceae) by Bombus diversus (Hymenoptera: Apidae). Eur. J. Entomol. 2013, 110, 545. [Google Scholar] [CrossRef] [Green Version]
  14. Shim, Y.J.; Park, Y.S.; Jang, R.H.; Yoon, Y.J.; Kim, S.R.; Han, S.H. The development of Habitat Suitability Index Model of Class I endangered wildlife, Sedirea japonica. J. Korean Isl. 2020, 32, 153–172. [Google Scholar] [CrossRef]
  15. Lee, S.I.; Lee, E.P.; Kim, E.J.; Park, J.H.; Cho, K.T.; Lee, S.Y.; You, Y.H. Growth response and variation of ecological niche breadth of Hibiscus hamabo, the endangered plant, according to light, moisture, and nutrient under elevated CO2 concentration and temperature. Korean J. Environ. Ecol. 2017, 31, 279–286. [Google Scholar] [CrossRef]
  16. Kim, Y.K.; Jo, S.J.; Kim, K.J. Phylogenetic position of Neofinetia and Sedirea (Orchidaceae) and their species identification using the chloroplast matK and the nuclear ITS sequences. Korean J. Plant Taxon. 2014, 44, 39–50. [Google Scholar] [CrossRef]
  17. Guo, W.J.; Lee, N. Effect of leaf and plant age, and day/night temperature on net CO2 uptake in Phalaenopsis amabilis var. formosa. J. Am. Soc. Hortic. Sci. 2006, 131, 320–326. [Google Scholar] [CrossRef] [Green Version]
  18. Hiscox, J.D.; Israelstam, G.F. A method for the extraction of chlorophyll from leaf tissue without maceration. Can. J. Bot. 1979, 57, 1332–1334. [Google Scholar] [CrossRef]
  19. Arnon, D.I. Copper enzymes in isolated chloroplasts. Polyphenoloxidase in Beta vulgaris. Plant Physiol. 1949, 24, 1–15. [Google Scholar]
  20. Lichtenthaler, H.K. Chlorophylls and carotenoids: Pigments of photosynthetic biomembranes. Methods Enzymol. 1987, 148, 350–382. [Google Scholar]
  21. Strasser, R.J.; Srivastava, A.; Tsimilli-Michael, M. The fluorescence transient as a tool to characterize and screen photosynthetic samples. In Probing Photosynthesis: Mechanism, Regulation, and Adaptation; Yunus, M., Pathre, U., Mohanty, P., Eds.; Taylor and Francis: London, UK; New York, NY, USA, 2000; pp. 445–483. [Google Scholar]
  22. Males, J.; Griffiths, H. Stomatal biology of CAM plants. Plant Physiol. 2017, 174, 550–560. [Google Scholar] [CrossRef] [Green Version]
  23. Dodd, A.N.; Borland, A.M.; Haslam, R.P.; Griffiths, H.; Maxwell, K. Crassulacean acid metabolism: Plastic, fantastic. J. Exp. Bot. 2002, 53, 569–580. [Google Scholar] [CrossRef] [Green Version]
  24. Hartwell, J. The coordination of central plant metabolism by the circadian clock. Biochem. Soc. Trans. 2005, 33, 945–948. [Google Scholar] [CrossRef] [Green Version]
  25. Von Caemmerer, S.; Griffiths, H. Stomatal responses to CO2 during a diel Crassulacean acid metabolism cycle in Kalanchoe daigremontiana and Kalanchoe pinnata. Plant Cell Environ. 2009, 32, 567–576. [Google Scholar] [CrossRef]
  26. Ceusters, J.; Borland, A.M.; De Proft, M.P. Drought adaptation in plants with crassulacean acid metabolism involves the flexible use of different storage carbohydrate pools. Plant Signal. Behav. 2009, 4, 212–214. [Google Scholar] [CrossRef] [PubMed] [Green Version]
  27. Drennan, P.M.; Nobel, P.S. Responses of CAM species to increasing atmospheric CO2 concentrations. Plant Cell Environ. 2000, 23, 767–781. [Google Scholar] [CrossRef] [Green Version]
  28. Nobel, P.S.; Israel, A.A.; Wang, N. Growth, CO2 uptake, and responses of the carboxylating enzymes to inorganic carbon in two highly productive CAM species at current and doubled CO2 concentrations. Plant Cell Environ. 1996, 19, 585–592. [Google Scholar] [CrossRef]
  29. Kimball, B.A.; Kobayashi, K.; Bindi, M. Responses of agricultural crops to free-air CO2 enrichment. Adv. Agron. 2002, 77, 293–368. [Google Scholar]
  30. Winter, K.; Smith, J.A.C. Crassulacean acid metabolism: Current status and perspectives. In Crassulacean Acid Metabolism: Biochemistry. Ecophysiology and Evolution; Winter, K., Smith, J.A.C., Eds.; Springer: Berlin/Heidelberg, Germany, 1996; pp. 230–246. [Google Scholar]
  31. Taylor, G.; Ranasinghe, S.; Bosac, C.; Gardner, S.D.L.; Ferris, R. Elevated CO2 and plant growth: Cellular mechanisms and responses of whole plants. J. Exp. Bot. 1994, 45, 1761–1774. [Google Scholar] [CrossRef]
  32. Pritchard, S.; Rogers, H.; Prior, S.A.; Peterson, C. Elevated CO2 and plant structure: A review. Glob. Chang. Biol. 1999, 5, 807–837. [Google Scholar] [CrossRef] [Green Version]
  33. Kim, H.J.; Cho, A.R.; Park, K.S.; Kim, Y.J. Effect of CO2 enrichment on growth and flowering of Phalaenopsis. Horticult. J. 2017, 86, 1–6. [Google Scholar]
  34. Cui, M.; Miller, P.M.; Nobel, P.S. CO2 exchange and growth of the Crassulacean acid metabolism plant Opuntia ficus-indica under elevated CO2 in open-top chambers. Plant Physiol. 1993, 103, 519–524. [Google Scholar] [CrossRef] [Green Version]
  35. Holtum, J.A.M.; Smith, J.A.C.; Neuhaus, H.E. Intracellular transport and pathways of carbon flow in plants with crassulacean acid metabolism. Funct. Plant. Biol. 2005, 32, 429–449. [Google Scholar] [CrossRef]
  36. Popp, M.; Janett, H.P.; Lüttge, U.; Medina, E. Metabolite gradients and carbohydrate translocation in rosette leaves of CAM and C3 bromeliads. New Phytol. 2003, 157, 649–656. [Google Scholar] [CrossRef]
  37. Lim, N.H.; Lee, H.B.; An, S.K.; Kim, K.S. Acclimation of young Doritaenopsis Queen Beer ‘Mantefon’ plants under increased CO2 concentration. Flower Res. J. 2018, 26, 11–18. [Google Scholar] [CrossRef]
  38. Saraswathi, S.G.; Paliwal, K. Drought induced changes in growth, leaf gas exchange, and biomass production in Albizia lebbeck and Cassia siamea seedlings. J. Environ. Biol. 2011, 32, 173–178. [Google Scholar] [PubMed]
  39. Brunetti, C.; Tattini, M.; Guidi, L.; Velikova, V.; Ferrini, F.; Fini, A. An integrated overview of physiological and biochemical responses of Celtis australis to drought stress. Urban For. Urban Green 2019, 46, 126480. [Google Scholar] [CrossRef]
  40. Munné-Bosch, S.; Alegre, L. Drought-induced changes in the redox state of α-tocopherol, ascorbate, and the diterpene carnosic acid in chloroplasts of Labiatae species differing in carnosic acid contents. Plant Physiol. 2003, 131, 1816–1825. [Google Scholar] [CrossRef] [PubMed] [Green Version]
  41. Bukhov, N.G.; Sabat, S.C.; Mohanty, P. Analysis of chlorophyll a fluoresence changes in weak light in heat treated Amaranthus chloroplasts. Photosynth. Res. 1990, 23, 81–87. [Google Scholar] [CrossRef]
  42. Boureima, S.; Oukarroum, A.; Diouf, M.; Cisse, N.; Van Damme, P. Screening for drought tolerance in mutant germplasm of sesame (Sesamum indicum) probing by chlorophyll a fluorescence. Environ. Exp. Bot. 2012, 81, 37–43. [Google Scholar] [CrossRef]
  43. Evans, J.R. The dependence of quantum yield on wavelength and growth irradiance. Funct. Plant Biol. 1987, 14, 69–79. [Google Scholar] [CrossRef]
  44. Jiang, H.X.; Chen, L.S.; Zheng, J.G.; Han, S.; Tang, N.; Smith, B.R. Aluminum-induced effects on Photosystem II photochemistry in Citrus leaves assessed by the chlorophyll a fluorescence transient. Tree Physiol. 2008, 28, 1863–1871. [Google Scholar] [CrossRef]
  45. Zhang, H.; Feng, P.; Yang, W.; Sui, X.; Li, X.; Li, W.; Zhang, R.; Gu, S.; Xu, N. Effects of flooding stress on the photosynthetic apparatus of leaves of two Physocarpus cultivars. J. For. Res. 2018, 29, 1049–1059. [Google Scholar] [CrossRef]
  46. Lotfi, R.; Kalaji, H.M.; Valizadeh, G.R.; Khalilvand Behrozyar, E.; Hemati, A.; Gharavi-Kochebagh, P.; Ghassemi, A. Effects of humic acid on photosynthetic efficiency of rapeseed plants growing under different watering conditions. Photosynthetica 2018, 56, 962–970. [Google Scholar] [CrossRef] [Green Version]
  47. Rapacz, M.; Sasal, M.; Kalaji, H.M.; Kościelniak, J. Is the OJIP test a reliable indicator of winter hardiness and freezing tolerance of common wheat and Triticale under variable winter environments? PLoS ONE 2015, 10, e0134820. [Google Scholar] [CrossRef] [PubMed] [Green Version]
  48. Rapacz, M.; Sasal, M.; Gut, M. Chlorophyll fluorescence-based studies of frost damage and the tolerance for cold-induced photoinhibition in freezing tolerance analysis of Triticale (×Triticosecale Wittmack). J. Agron. Crop Sci. 2011, 197, 378–389. [Google Scholar] [CrossRef]
  49. Begovic, L.; Galic, V.; Abicic, I.; Loncaric, Z.; Lalic, A.; Mlinaric, S. Implications of intra-seasonal climate variations on chlorophyll a fluorescence and biomass in winter barley breeding program. Photosynthetica 2020, 58, 995–1008. [Google Scholar] [CrossRef]
  50. Lee, K.C.; Kweon, H.; Sung, J.W.; Kim, Y.S.; Song, Y.G.; Cha, S.; Koo, N. Physiological response analysis for the diagnosis of drought and waterlogging damage in Prunus yedoensis. For. Sci. Technol. 2022, 18, 14–25. [Google Scholar] [CrossRef]
  51. Yao, X.; Li, C.; Li, S.; Zhu, Q.; Zhang, H.; Wang, H.; Yu, C.; St. Martin, S.K.; Xie, F. Effect of shade on leaf photosynthetic capacity, light-intercepting, electron transfer and energy distribution of soybeans. Plant Growth Regul. 2017, 83, 409–416. [Google Scholar] [CrossRef]
  52. Lopes, M.N.; Gomes, G.M.F.; Maranhão, T.D.; Silveira, W.M.; Pompeu, R.C.F.F.; Silva, R.G.D.; Bezerra, M.A.; Cândido, M.J.D. Photochemical activity modulated by water, nitrogen, and phosphorus status in cactus pear. Rev. Bras. Zootecn. 2021, 50, 1–14. [Google Scholar] [CrossRef]
  53. Borland, A.M.; Hartwell, J.; Jenkins, G.I.; Wilkins, M.B.; Nimmo, H.G. Metabolite control overrides circadian regulation of phosphoenol pyruvate carboxylase kinase and CO2 fixation in Crassulacean acid metabolism. Plant Physiol. 1999, 121, 889–896. [Google Scholar] [CrossRef]
  54. Murillo-Amador, B.; Córdoba-Matson, M.V.; Villegas-Espinoza, J.A.; Hernández-Montiel, L.G.; Troyo-Diéguez, E.; García-Hernández, J.L. Mineral content and biochemical variables of Aloe vera L. under salt stress. PLoS ONE 2014, 9, e94870. [Google Scholar]
  55. Becerril, G.A.; Valdivia, C.B.P. Physiological alterations induced by drought stress on prickly pear (Opuntia ficus-indica). Rev. Fitot. Mex. 2006, 29, 231–237. [Google Scholar]
Figure 1. (a) SFDS chamber, S. japonica under (b) 2.6LVPD, (c) 2.6HVPD, (d) 2.6HVPD with visible damage, (e) 8.5LVPD, (f) 8.5HVPD, and (g) 8.5HVPD with visible damage on 25 August.
Forests 13 01823 g001
Figure 2. Temperature (T), relative humidity (RH), vapor pressure deficit (VPD), and CO2 concentration under (a,b) 2.6LVPD, (c,d) 2.6HVPD, (e,f) 8.5LVPD, and (g,h) 8.5HVPD. The red dotted line represents the period of drought stress (5 August to 25 August).
Forests 13 01823 g002
Figure 3. Changes in CO2 uptake during the nighttime of S. japonica under 2.6LVPD, 2.6HVPD, 8.5LVPD, and 8.5HVPD during (a) drought stress (25 August) and (b) after recovery through re-irrigation (17 September). Bars represent means ± SE (n = 8).
Forests 13 01823 g003
Figure 4. Differences between total (a) CO2 uptake and (b) transpiration of S. japonica during drought stress (August 25) and after recovery (17 September) under 2.6LVPD, 2.6HVPD, 8.5LVPD, and 8.5HVPD. Bars represent means ± SD, and different letters indicate significant differences (p < 0.05, n = 8) among treatments as determined by Tukey’s HSD.
Forests 13 01823 g004
Figure 5. Changes in the leaf characteristics: leaf thickness, leaf length, and the number of leaves, (a) before and (b) during drought stress, and (c) after recovery through re-irrigation. Bars represent means ± SE, and different letters indicate significant differences (p < 0.05, n = 23) and ns meaning non-significance among treatments as determined by Tukey’s HSD.
Forests 13 01823 g005
Figure 6. Spider plot of selected chlorophyll a fluorescence parameters characterizing PSII of S. japonica under 2.6LVPD, 2.6HVPD, 8.5LVPD, and 8.5HVPD groups in different periods; (a) 12 August, (b) 18 August, (c) 24 August, (d) 8 September. The data are shown as a percentage of 2.6LVPD, and the parameters are described in Table 1. The asterisks indicate significant differences (* p < 0.05, ** p < 0.01, n = 20) among treatments as determined by Tukey’s HSD.
Forests 13 01823 g006
Figure 7. Chlorophyll a fluorescence parameters: (a) VK/VJ, (b) 1-VI, (c) PIabs, (d) DFabs, (e) SFIabs, and (f) PIabs,Total of S. japonica under 2.6LVPD, 2.6HVPD, 8.5LVPD, and 8.5HVPD. The parameters are described in Table 1, and the red dotted line represents the drought stress period. Bars represent means ± SE, and the asterisks indicate significant differences (* p < 0.05, ** p < 0.01, n = 20), and ns meaning non-significance among treatments as determined by Tukey’s HSD.
Forests 13 01823 g007
Figure 8. Principle component analysis (PCA) of chlorophyll a fluorescence parameters based on the relationship between climate change and drought stress under 2.6LVPD, 2.6HVPD, 8.5LVPD, and 8.5HVPD.
Forests 13 01823 g008
Table 1. JIP-test parameters used for the analysis of chlorophyll a fluorescence transient OJIP.
ParametersDescription
VKRelative variable fluorescence at the K-step
VJRelative variable fluorescence at the J-step
VIRelative variable fluorescence at the I-step
M0The initial slope of the fluorescence transient normalized on the maximal variable fluorescence
SmThe normalized total complementary area above the OJIP transient or total electron carriers per RC
NThe total complementary area between the fluorescence induction curve and F = FM
φPoThe maximum quantum yield of primary photochemistry at t = 0
ψEoEfficiency with which a trapped exciton moves an electron into the ETC beyond QA at t = 0
φEoQuantum yield of electron transport at t = 0
δRoThe efficiency with which an electron from the intersystem electron carriers is transferred to reduce end electron acceptors at the PSI acceptor side
φRoQuantum yield of reduction of end electron acceptors at the PSI acceptor side
φDoQuantum yield of energy dissipation at t = 0
ρRoThe efficiency with which a trapped exciton can move an electron into the electron transport chain from QA to the PSI end electron acceptors
1-VIThe efficiency with which a PSII trapped electron is transferred to the PSI acceptor side
VK/VJThe ratio of variable fluorescence in time 0.3 ms to variable fluorescence in time 2 ms as an indicator of the PSII donor-side limitation
RC/ABSQA- reducing RCs per PSII antenna chlorophyll
ABS/RCAbsorption flux per RC
DI0/RCEnergy dissipation flux per RC
TR0/RCTrapped energy flux per RC
ET0/RCElectron transport flux from QA to QB per RC
RE0/RCElectron transport flux until PSI acceptors per RC
RC/CS0Amount of active PSII RCs per CS at t = 0
PIabsPerformance index on absorption basis
PIabs,TotalTotal PI, measuring the performance up to the PSI end electron acceptors
DFabsDriving force on absorption basis
SFIabsStructural and functional index on absorption basis
Table 2. Effects of growth characteristics of S. japonica under 2.6LVPD, 2.6HVPD, 8.5LVPD, and 8.5HVPD.
TreatmentDry Mass Production (g)S/RLWRRWR
LeafRootTotal Dry Weight
2.6LVPD1.38 ± 0.30 b2.28 ± 0.70 b3.66 ± 0.93 b0.64 ± 0.16 ns0.38 ± 0.06 ns0.62 ± 0.06 ns
2.6HVPD1.13 ± 0.32 ab1.68 ± 0.47 a2.81 ± 0.69 a0.70 ± 0.20 ns0.41 ± 0.07 ns0.59 ± 0.07 ns
8.5LVPD1.34 ± 0.41 b2.42 ± 0.52 b3.76 ± 0.90 b0.55 ± 0.09 ns0.35 ± 0.04 ns0.65 ± 0.04 ns
8.5HVPD0.92 ± 0.17 a1.58 ± 0.39 a2.5 ± 0.53 a0.59 ± 0.09 ns0.37 ± 0.03 ns0.63 ± 0.03 ns
Different letters indicate significant differences (p < 0.05, n = 10) and ns meaning non-significance among treatments as determined by Tukey’s HSD.
Table 3. Effects on chlorophyll, carotenoid contents, and SPAD of S. japonica under 2.6LVPD, 2.6HVPD, 8.5 LVPD, and 8.5HVPD during drought stress (25 August) and after recovery through re-irrigation (24 September).
DateTreatmentChl (mg·g−1)CarChl a/bT Chl/CarSPAD
aba + b(mg·g−1)
Aug 252.6LVPD2.38 ± 0.39 ns0.61 ± 0.11 ns2.99 ± 0.50 ns0.81 ± 0.08 ns3.88 ± 0.09 b3.65 ± 0.31 ns58.0 ± 6.1 c
2.6HVPD2.04 ± 0.130.57 ± 0.042.61 ± 0.160.88 ± 0.083.60 ± 0.18 ab3.01 ± 0.4350.2 ± 6.3 b
8.5LVPD2.26 ± 0.320.60 ± 0.102.86 ± 0.410.86 ± 0.133.82 ± 0.26 b3.38 ± 0.4755.5 ± 7.0 bc
8.5HVPD2.05 ± 0.500.63 ± 0.172.68 ± 0.660.92 ± 0.113.28 ± 0.31 a2.86 ± 0.4843.6 ± 9.8 a
Sept 242.6LVPD3.04 ± 0.51 ns0.75 ± 0.23 ns3.79 ± 0.70 ns1.52 ± 0.11 ns4.24 ± 0.84 b2.48 ± 0.31 ns55.3 ± 8.0 ns
2.6HVPD2.81 ± 0.371.16 ± 0.363.98 ± 0.571.55 ± 0.122.64 ± 0.81 ab2.56 ± 0.3156.5 ± 6.0
8.5LVPD2.66 ± 0.291.13 ± 0.423.79 ± 0.551.25 ± 0.172.69 ± 0.94 ab3.14 ± 0.8755.3 ± 6.7
8.5HVPD2.48 ± 0.201.17 ± 0.353.65 ± 0.181.43 ± 0.232.31 ± 0.69 a2.62 ± 0.4351.0 ± 7.4
Different letters indicate significant differences (p < 0.05, n = 5) and ns meaning non-significance among treatments as determined by Tukey’s HSD.
Publisher’s Note: MDPI stays neutral with regard to jurisdictional claims in published maps and institutional affiliations.

