Article

Epigenetic and Genetic Variability in Contrasting Latitudinal Fagus sylvatica L. Provenances

by
María Ángeles Guevara
1,2,
David Sánchez-Gómez
1,
María Dolores Vélez
1,2,
Nuria de María
1,2,
Luis Miguel Díaz
1,2,
José Alberto Ramírez-Valiente
3,
José Antonio Mancha
1,
Ismael Aranda
1 and
María Teresa Cervera
1,2,*
1
Instituto de Ciencias Forestales ICIFOR (INIA-CSIC), Carretera de la Coruña Km 7.5, 28040 Madrid, Spain
2
Unidad Mixta de Genómica y Ecofisiología Forestal, INIA/UPM, 28040 Madrid, Spain
3
Ecological and Forestry Applications Research Centre (CREAF), Campus de Bellaterra, Edifici C, 08193 Cerdanyola del Vallès, Spain
*
Author to whom correspondence should be addressed.
Forests 2022, 13(12), 1971; https://doi.org/10.3390/f13121971
Submission received: 28 October 2022 / Revised: 17 November 2022 / Accepted: 17 November 2022 / Published: 22 November 2022
(This article belongs to the Special Issue Epigenetic Variation: A Component of the Woody Plant Adaptation)

Abstract

:
The adaptive capacity of a species and its population is determined by both genetic and epigenetic variation, which defines the potential for adaptive evolution and plastic response to environmental changes. In this study, we used Methylation Sensitive Amplified Polymorphism (MSAP) and Amplified Fragment Length Polymorphism (AFLP), similar genome-wide profiling techniques, to analyze the epigenetic and genetic variability in European beech provenances from Germany (DE), Spain (ES) and Sweden (SE), representing the latitudinal distribution of the species. In addition, we evaluated the effect of moderate water stress on cytosine methylation dynamics by comparing two latitudinal contrasting provenances. Our analysis revealed that trees from ES showed lower values of epigenetic and genetic diversity than those from DE and SE. Analyses of molecular variance for MSAPs and AFLPs showed that 16% and 15% of the among population variations were associated with epigenetic and genetic variation, respectively. The study of the effect of water stress on cytosine methylation dynamics in seedlings from ES and SE revealed no significant levels of epigenetic differentiation between well-watered and stressed plants. Only 2% of the epigenetic variation was explained by the watering regime in ES without changes in SE. The results support that DNA methylation may play a role in the local adaptation of Fagus sylvatica to environmental variation.

1. Introduction

Expectations of an environmental harshening as a consequence of the increase recurrence and intensity of droughts in many parts of Europe have been reinforced in recent years [1,2], especially at the southern rear edge margins of some forest tree species [3,4]. These expected harsher conditions might affect the current area of distribution northward for some species with local extinctions in the south, or bring about altitudinal displacements [5,6]. However, due to habitat fragmentation, limited dispersal ability or low migration rates, population migration to new areas might not be possible for many species [7]. Considering the expected accelerated changes worldwide in local climate, a high degree of within-population genetic diversity is advanced as one of the prerequisites suggested to buffer the negative impacts on adaptability of forest tree populations [8,9]. Epigenetic variability has been suggested to play a relevant role in promoting the adaptation of widespread species [10,11] since underpinning phenotypic plasticity occurs at the molecular level [12,13,14], mediating, among others, their responses to multiple abiotic and biotic stresses [15,16]. Epigenetic mechanisms are of a reversible nature as they do not alter the DNA sequence; thus, enabling these sessile organisms to cope with environmental changes over their long lives [17,18].
Epigenetic marks, which largely determine the phenotypic plasticity of plant species, allow them to regulate their interaction with the environment, and to respond rapidly to changes that may compromise their development and even their survival [19,20]. The onset of a stressful condition triggers changes in gene expression, in just a few minutes [21]. However, it is the duration and frequency of the environmental stimulus, as well as the ontogenetic state in the life cycle of the plant, that determines whether the epigenetic marks are maintained as a molecular memory and even transmitted to subsequent generations [22]. In addition, epigenetic regulation plays a key role in how gene expression changes during developmental transitions [23,24] and cell differentiation at broader stages of plant development [25]. The impact of epigenome changes on the ecology and evolution of plants is now beginning to be elucidated [12,26,27,28,29,30,31].
In forest trees, preliminary studies on natural variation in epigenetic marks have been restricted to a few species, mostly to examine the extent of the epigenetic variability in natural populations, yet only a few of them also explore their functional consequences [32]. Methylation of the 5′ cytosines in DNA strands is one of the epigenetic mechanisms related to modulation of the expression or silencing of genes in plants [33,34]. Studies of the variability in DNA methylation marks have allowed researchers to identify polymorphisms associated with climatic conditions of the population origins and with phenotypic traits such as budburst phenology or wood quality [35,36]. Significant correlations between DNA methylation and changes in gene expression patterns of different plant species grown under water stress have been described. Drought-tolerant plants of rice [37], maize [38] and mulberry [39] have a more stable methylome under drought. Comparative analysis of methylation patterns between drought-sensitive and drought-tolerant apple varieties showed different dynamics when grown under contrasting hydric conditions [40]. Citrus grafted plants exposed to recurrent water deficit revealed epigenetic variation was not only associated with a scion and rootstock combination but also with a progressive tolerance to water stress [41]. In Eucalyptus globulus, although global DNA methylation increased during dehydration, the analysis of specific DNA sequences showed an induction of redox and methylation changes during stress imposition and recovery [42]. Populus, considered a model genus in forest tree genomics, has concentrated most of the efforts geared towards unravelling the role of DNA methylation in response to drought [14,43]. The analysis of black cottonwood (P. trichocarpa) response to drought showed an association between DNA methylation and variable splicing, with non-methylated cis-splicing sites versus a high level of methylated trans-splicing sites. The identification of methylated transposable elements (TEs) in promoters and the gene body of transcription factors involved in drought signal transduction pathways demonstrated the role of DNA methylation in the regulation of stress-responsive genes [44]. The analysis of differentially expressed genes and differentially methylated regions in the shoot apical meristems of Populus × euramericana (P. deltoides × P. nigra) grown under different water regimes, revealed a significant enrichment in the genes related to phytohormone metabolism and signaling [45]. Sow et al. [46] observed that RNAi-ddm1 lines (undermethylated) were more tolerant to drought-induced cavitation than control P. tremula × P. alba plants. Mapping of differentially methylated regions revealed colocalization with differentially expressed genes, mainly involved in hormone-related stress responses, as well as with active TEs. This highlights the role of DNA methylation in the repression of TEs, and therefore, in the maintenance of genome integrity. The impact of environmental history on the capacity of a tree to respond to an environmental stimulus was observed in poplar clonal material harvested from different geographical locations and grown under common environmental conditions [47]. In this study, transcriptomic profiles associated with the response to drought were correlated, with differences in DNA methylation as well as with the geographical origin of the clones with the longest time since establishment. The usefulness of global DNA methylation as a potential marker for population differentiation, performance, and selection under stressful conditions was validated by the estimation of heritability and phenotypic differentiation for global DNA methylation in P. nigra trees from natural populations grown under different soil water availability [48].
The present study aims to compare the epigenetic and genetic variability of European beech (Fagus sylvatica L.); a widespread tree species in Europe of high economic and ecological value. Its distribution in the Mediterranean basin is limited by drought sensitivity since this species needs moist soils, abundant rain and atmospheric humidity. The high sensitivity of beech to water stress [49,50,51] was clearly observed in the main core range of distribution in central Europe after the acute dry period in the summer of 2003 [52,53], and more recently after the severe drought of 2018 and its dire consequences on beechwood health [54]. On the other hand, the species has a complex recent history of recolonization after the last glacial period from different refugees in the Holocene, and with extant populations that, in the case of the Iberian Peninsula at the trailing edge in the south, could probably have its origin from even more antique refugia dating back to the Pleistocene [55]. This would add complexity to the understanding of the current genetic population structure of the species [56,57,58]. In this study, we explored the epigenetic and genetic divergence among three provenances of European beech spanning along the latitudinal gradient of the species [59]. This includes one of the southern-most populations of the range, which is highly threatened by intense recurrent droughts. In addition, we explored to what extent drought stress modified DNA cytosine methylation comparing two latitudinal contrasting provenances. We used Amplified Fragment Length Polymorphism (AFLP) and Methylation-Sensitive Amplified Polymorphism (MSAP) techniques to analyze the genetic and cytosine methylation of specific anonymous CG and CCG sequences, respectively. Specifically, we have tested two hypotheses: (i) epigenetic variability is as important as genetic variability in molecular differentiation of beech provenances; and (ii) the change in cytosine methylation status of some loci is related to a drought response.

2. Materials and Methods

2.1. Plant Material and Experimental Layout

Seeds from three beech provenances from Spain, Germany and Sweden representing the latitudinal distribution range of the species were collected (Table 1). After a chilling treatment for 8 weeks at 4 °C, most of the seeds began to germinate. Between 25 and 30 seedlings with 1–2 cm long radicle per provenance were transplanted into 2 L pots filled with a 3:1 volume mixture of peat: sand. The substrate was supplemented with 2 kg m−3 of Osmocote Plus fertilizer (16-9-12 NPK+2 micronutrients, Scotts, Heerlen, The Netherlands).
Two-year old seedlings were transplanted into 25 L pots and watered regularly to field capacity. The plants were maintained in a greenhouse under controlled conditions with a photosynthetic photon flux density (PPFD) of 353 to 454 µmol m−2 s−1, minimum and maximum temperatures of 18.8 ± 3.1 °C and 32.5 ± 4.0 °C, respectively, a minimum relative humidity throughout the experiment of 66.6% ± 3.8%, and natural lighting.

2.2. Watering Treatment and Water Potential Measurements Layout

In order to study the effects of drought stress, the experimental layout of seedlings from the Spanish (ES) and additional Swedish (SE) provenances (Table 1, assay 2), representing the latitudinal extremes of the range of distribution of the species, followed a random factorial design with two main factors: provenance and watering. During the establishment phase of one month, the ES and SE seedlings were grown under the conditions previously described and watered to field capacity. In a second phase, half of the seedlings of each provenance (12–14 seedlings per each combination of provenance and watering regime) were randomly assigned to the water-stress (WS) or well-water (WW) treatments, respectively. WW seedlings were watered to field capacity during the whole experiment. At the beginning of the experiment, seedlings were watered every 5 days, increasing the frequency of the watering according to plant growth. By the second month of the experiment and afterward, the WW seedlings were watered every two days. In contrast, the WS seedlings were progressively subjected to drought by watering withdrawal. Drought peaked after 50 days when the soil water content reached a soil volumetric water content (VWC vol%) of 13. The watering protocol resulted in a moderated water stress that was maintained for almost two months. The VWC was individually monitored throughout the experiment with time domain reflectometry, TDR (TRIME-FM, Imko Micromodultechnik GMBH, Ettlingen, Germany). A similar level of water deficit across the provenances was ensured by an intensive (three–four times a week) individualized control of the soil moisture and watering according to the individual differences in water consumption. The water potential at predawn (Ψpd) and midday (Ψmd) was measured with a Scholander pressure chamber using one leaf per seedling (PMS Instrument Co. 7000, Corvallis, OR, USA). More detailed experimental protocols are reported in Sánchez-Gómez et al. [59].

2.3. DNA Extraction

The leaf tissues of well-watered and water-stressed seedlings were harvested and immediately frozen in liquid nitrogen and stored at −80 °C. Samples were maintained at −80 °C in a freezer until molecular analysis.
DNA was extracted from frozen leaves ground in a Retsch MM300 mixer mill (Retsch GmbH & Co. KG, Hann, Germany) using a DNeasy Plant Mini Kit (Qiagen, Hilden, Germany), according to the manufacturer’s instructions. Extracted DNAs were quantified using a Nanodrop 1000 Spectrophotometer (Thermo Fisher Scientific, Waltham, MA, USA).

2.4. MSAP Analysis and Scoring

The Methylation-Sensitive Amplified Polymorphism (MSAP) technique, a modification of the AFLPs, was used to study anonymous methylation sensitive restriction sites at the wide genome [60]. The isoschizomers MspI and HpaII endonucleases, that show different sensitivity to 5′-cytosine methylation, were used, each in combination with the rare-cutting restriction enzyme EcoRI. Both isoschizomers recognize the tetranucleotide 5′-CCGG but their cutting ability depends on the methylation status of one (internal or external) of the cytosines [61,62,63,64]. MspI cleaves sites whose internal cytosines (5’-CmCGG) are hemi- (one strand) or fully- (both strands) methylated, but does not cut when the external cytosines are methylated (5′-mCCGG); whereas, HpaII only cleaves sites whose external cytosines are hemi-methylated (5′-hmCCGG).
For the MSAP analysis, 250 ng of total DNA was digested with each restriction enzyme combination EcoRI/HpaII and EcoRI/MspI as described by Cervera et al. [62]. Following the ligation of adaptors, the resulting fragments were used as a template for pre-amplification using an EcoRI + A//HpaII/MspI + A primer combination followed by EcoRI + 2 or + 3//HpaII/MspI + 3 selective nucleotides in the selective amplification. A total of 30 different EcoRI + 2 or + 3//HpaII/MspI + 3 primer combinations were tested initially using a subset of 8 samples to identify the most informative combinations (data not shown). Four primer combinations were finally selected and used: EcoRI + AAC//HpaII/MspI + AAT, EcoRI + AAC//HpaII/MspI +ATC, EcoRI + AAC//HpaII/MspI + ACT and EcoRI ACG//HpaII/MspI + ACT. The sequences of adaptors and primers used are listed in Supplementary Table S1. EcoRI + 3 selective primers were labeled at their 5′ end with fluorescent dye 800 IRDye to allow visualization of the fragments on a Li-Cor 4300 DNA Analyzer (Li-Cor Biosciences, Lincoln, NE, USA). Electrophoresis was performed using 25 cm denaturing polyacrylamide gels [16% Long Ranger® 50% Gel Solution (Lonza, Rockland ME, USA), 7 M urea, 1 × TBE] and run at 1500 V. Before loading, the samples were denatured by adding an equal volume of formamide buffer (98% formamide, 10 mM EDTA, pH 8.0, and 0.06% bromophenol blue) and heated at 94 °C for 2 min.
Comparative analysis between EcoRI/HpaII and EcoRI/MspI profiles revealed information about the methylation status of each targeted restriction site and were used to infer the genetic variability associated with “Methylation-insensitive polymorphisms” (MIP) and the epigenetic variability associated with “Methylation-sensitive polymorphisms” (MSP). The MIPs were polymorphic fragments that showed a common EcoRI/HpaII and EcoRI/MspI pattern, MSP were polymorphic fragments that differed in their presence or absence, or in their intensity between EcoRI/HpaII and EcoRI/MspI profiles for one or more samples (Supplementary Figure S1). Thus, methylation of the internal cytosine would lead to the presence of amplified fragments in EcoRI/MspI but not in EcoRI/HpaII profiles. Indeed, hemi-methylation of the CCGG site, in which the external cytosine is methylated only in one strand, would lead to the appearance of fragments in EcoRI/HpaII but not in the EcoRI/MspI profile (reviewed by Schulz et al. [63,65]).
The MSAP fragment presence or absence was visually determined by two independent observers. For the methylation-sensitive loci, we adopted a methylation scoring described by Salmon et al. [66] and the review by Schulz et al. [63]. Four score-types could be distinguished for a given sample and MSAP fragment: class 1, which included fragments present in both EcoRI/HpaII and EcoRI/MspI profiles, was scored as 0; class 2, which included fragments present in EcoRI/MspI and absent in EcoRI/HpaII profiles, was scored as 1; class 3, which included fragments present in EcoRI/HpaII and absent in the EcoRI/MspI profiles, was scored as 1; and finally, class 4, which included fragments absent in both profiles, was scored as 0.

2.5. AFLP Analysis and Scoring

Samples were also analyzed using the Amplified Fragment Length Polymorphism (AFLP) technique. A total of 250 ng DNA was digested with EcoRI/MseI restriction enzymes according to Cervera et al. [67]. Following the ligation of adaptors, the resulting fragments were used as a template for the pre-amplification, using an EcoRI + A/MseI + C primer combination followed by a selective amplification using EcoRI + 3/MseI + 3 selection. Five primer combinations were used: EcoRI + ATC/MseI + CAT, EcoRI + ATA/MseI + CAT, EcoRI + ACC/MseI + CAT, EcoRI + AAT/MseI + CCA, and EcoRI + ACA/MseI + CCA, (Sequences of adapters and primers are listed in Supplementary Table S1). EcoRI + 3 selective primers were labeled at their 5′ ends with fluorescent dye 800 IRDye to allow visualization of the fragments on a Li-Cor 4300 DNA Analyzer as previously described for MSAP. The data matrix was developed by scoring the presence (1) or absence (0) of each fragment in each sample.

2.6. Statistical Analysis

Epigenetic and genetic differentiation was assessed using GenAlEx version 6.503 (Australian National University, Canberra, Australia) [68,69]. The Analysis of Molecular Variance (AMOVA) allowed a hierarchical partitioning of the total epigenetic or genetic variation estimated among the provenances or treatments, using a PhiP index, an analogue of FST, (where PhiPT = VAP/(VWP + VAP), VAP = Variance among the provenances or treatments and VWP = Variance within the provenances or treatments), using 9999 random permutations to test its significance. Locus-by-locus analyses were performed to determine the significant and informative markers in terms of variability between the watering regimes. Additionally, Principal Coordinate Analysis (PCoA) was carried out on a pairwise genetic distance matrix to identify the main patterns within the epigenetic or genetic data.
To estimate the epigenetic and genetic diversity, we calculated the percentage of polymorphic bands (P%), number of alleles (Na), number of effective alleles (Ne), Shannon’s diversity index (I) and expected heterozygosity (He) for the epigenetic (MSAP-MSP) and genetic (MSAP-MIP and AFLPs) markers using GenAlEx version 6.503.
Additionally, Bayesian clustering analyses using Structure v.2.3.4 software (Pritchard Lab, Stanford University, Stanford, CA, USA) [70,71] were performed to infer the epigenetic and genetic structure of the analyzed individuals. We applied a burning time of 10,000 and 100,000 Markov Chain Monte Carlo repetitions with K values (number of populations) from 1 to 7. The best K was estimated using the delta k method [72] using Structure Harvester software (CA University, Berkeley, CA, USA).
Mantel tests were applied to the distance matrices for MSP-MSAP and AFLP loci or MIP-MSAP loci in order to establish the statistical correlations between the epigenetic and genetic variability and, to the distance matrices for MIP-MSAP loci and AFLP loci to test for a correlation between the genetic markers.
The effect of water stress was assessed from the water potential at sampling time. ANOVA was applied to evaluate the effect of the population and watering regimes as main factors.

3. Results

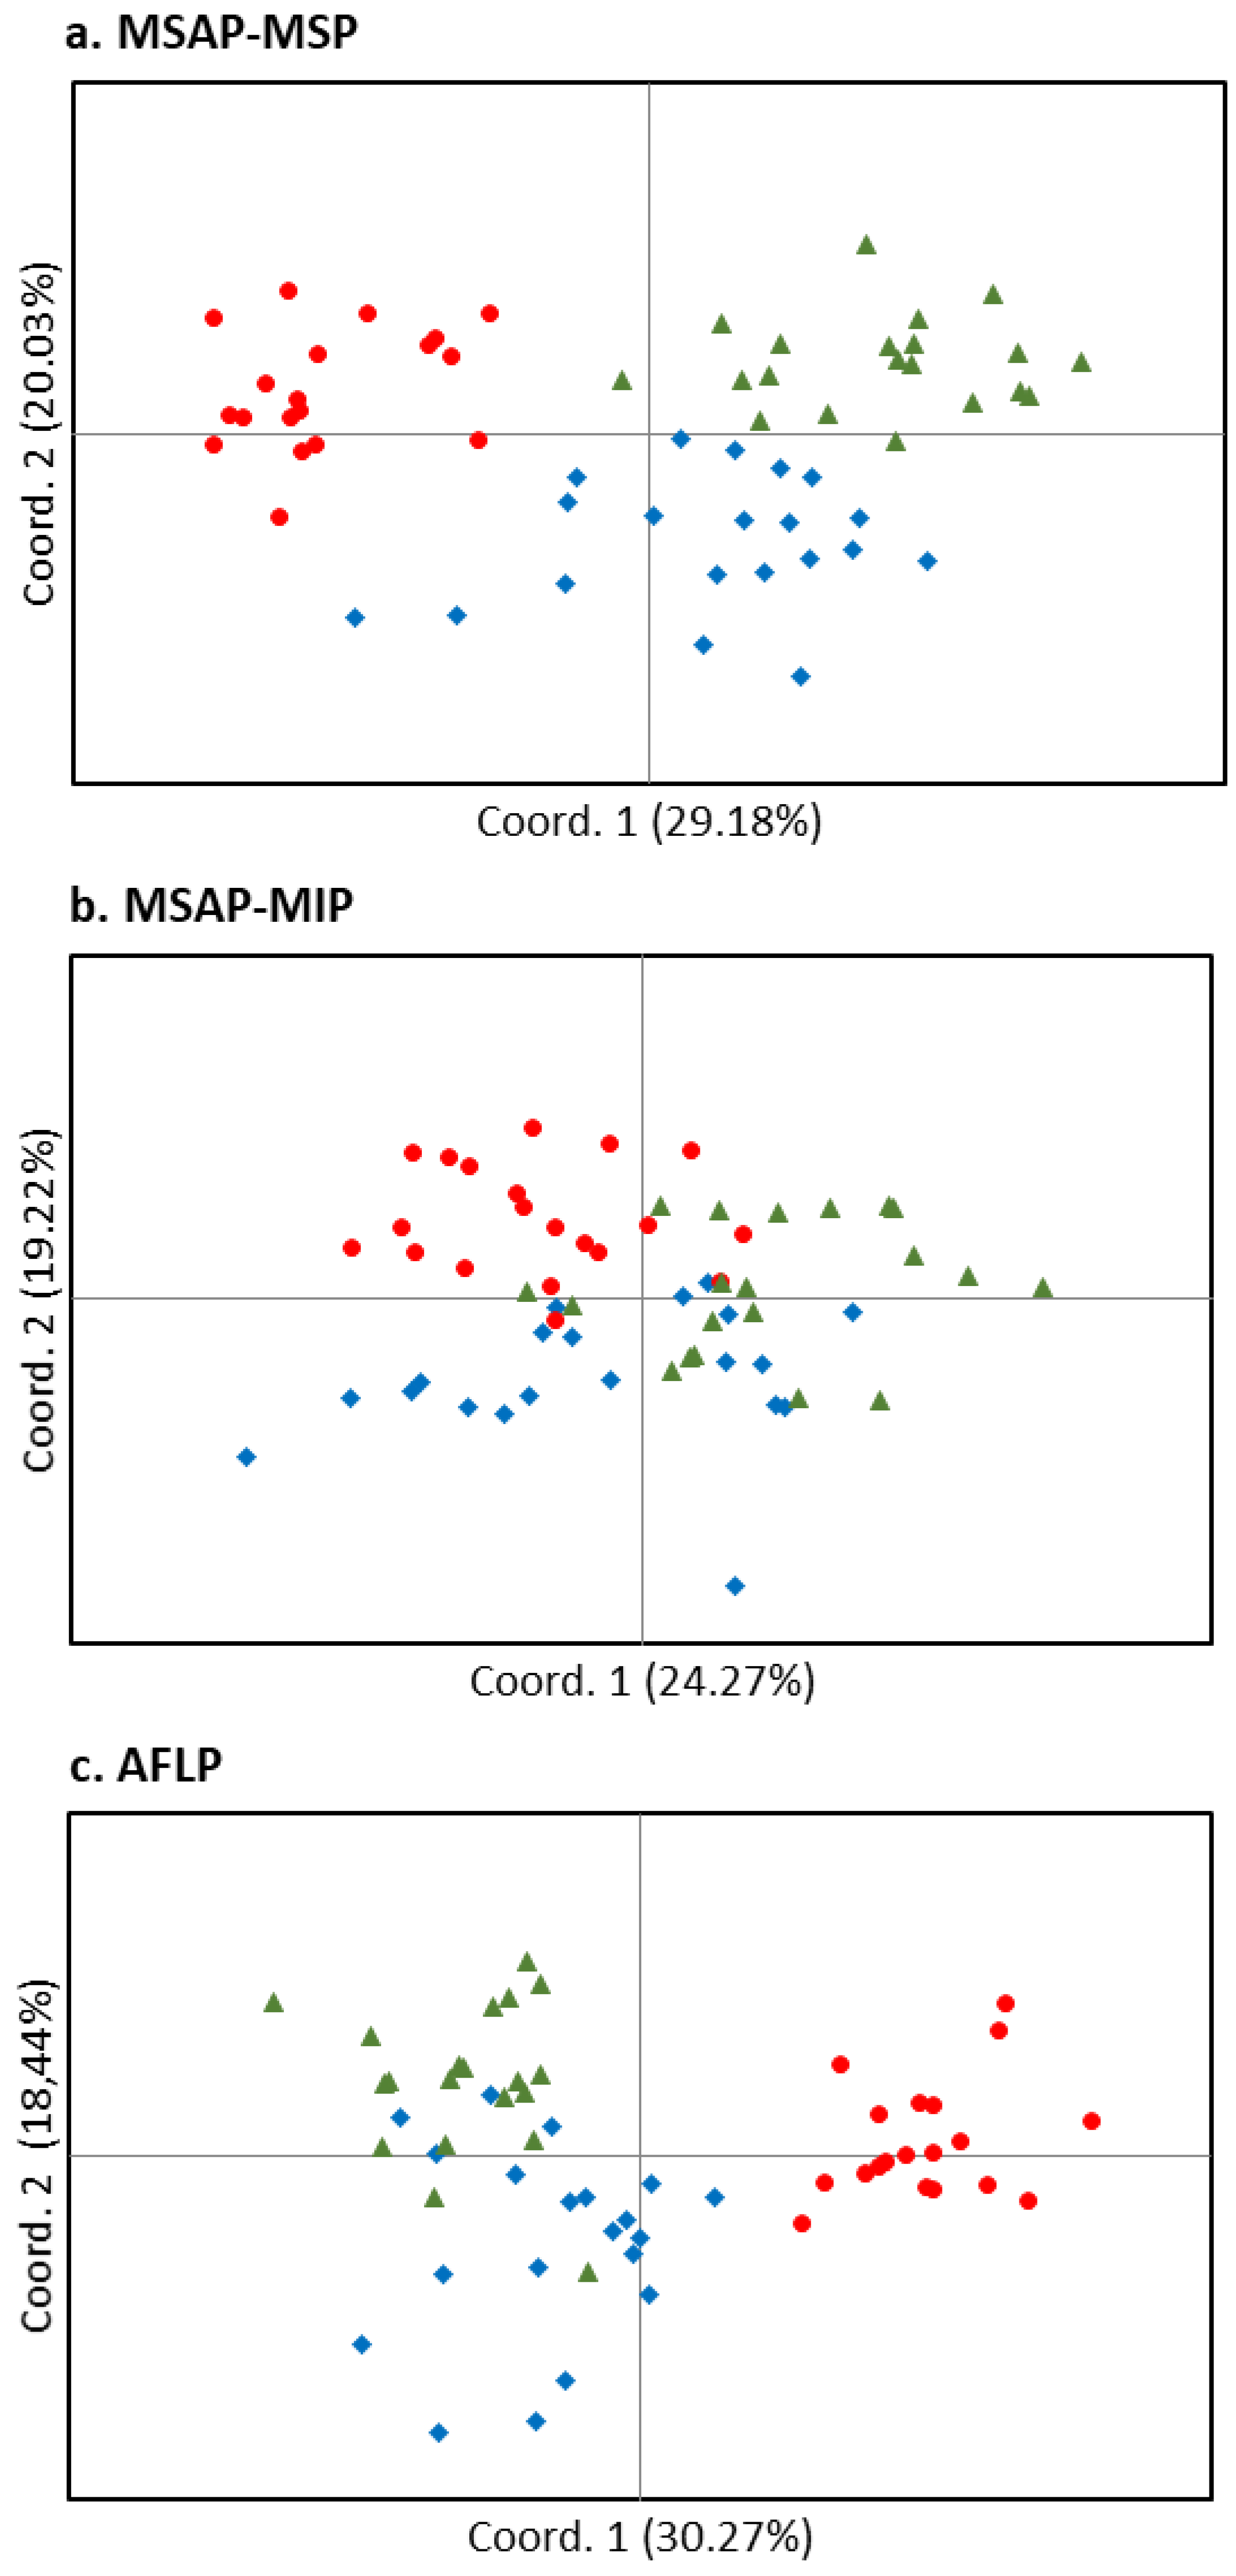
3.1. Epigenetic and Genetic Variability among Provenances

MSAP analysis of 60 beeches from Spanish (ES), German (DE) and Swedish (SE) provenances, 20 beech per provenance that represent the latitudinal distribution of the species, was performed in order to analyze the epigenetic and genetic variability.

3.1.1. Epigenetic Variability

MSAP analysis was performed to infer the variability of cytosine methylation throughout the genome, analyzing specific anonymous CCGG motifs. Three out of the 30 primer combinations initially tested were selected based on the number of polymorphic markers and easy scoring. The selected MSAP primer combinations rendered 205 amplified fragments (Table 2), of which 144 could be scored. A total of 83 markers out of 144 were classified as methylation-sensitive (MS), 97.59% and 2.41% of them identified as methylation-sensitive polymorphic (MSP) and methylation-sensitive monomorphic (MSM) markers, respectively. The remaining 61 markers were classified as methylation-insensitive (MI), 55.74% and 44.26% identified as methylation-insensitive polymorphic (MIP), and methylation-insensitive monomorphic (MIM) markers, respectively (Table 2).
The overall percentage of analyzed methylated restriction sites was estimated, ranging from 32.0% of the total fragments in the Swedish provenance (SE) to 32.3% in the Spanish provenance (ES) (Table 3). The percentage of full or hemi-methylated internal C, markers present in EcoRI/MspI and absent in EcoRI/HpaII, was also very similar ranging from 30.7% of the total fragments in the ES to 31.1% in the German provenance (DE), while the percentage of hemi-methylated external C, markers present in EcoRI/HpaII and absent in EcoRI/MspI, was much lower, ranging from 0.9% in DE to 1.5% in ES.
Epigenetic diversity parameters, such as the average number of observed alleles (Na), number of effective alleles (Ne), Shannon’s diversity index (I) and expected heterozygosity (He), were lower in the ES than in the DE and SE provenances (Table 4a), with the DE and SE showing similar values for all of them (Table 4a).
An analysis of molecular variance (AMOVA) was carried out to explore the differentiation between the provenances. The analysis revealed a moderate–high epigenetic differentiation among the provenances with an estimated PhiPT value of 0.156 (p = 0.0001): Most (84%) of total epigenetic variation resided within the provenances, while 16% resided among the analyzed provenances.
The distance matrix by provenances evidenced strong epigenetic differences among them with all pairwise distances being statistically significant (p < 0.001). ES was the provenance more epigenetically differentiated with pairwise epigenetic distances of 0.165 and 0.191 relative to the DE and SE populations, respectively. The pairwise epigenetic distance between DE and SE was 0.112. The distance matrix between individuals was subjected to a PCoA, where the first and second axes explained 29.18% and 20.03% of the variance, respectively, and the individuals were clustered into three groups corresponding with the DE, ES and SE provenances (Figure 1a).
Epigenetic structure analysis of the three provenances using Structure software showed that the best K using the delta K method was K = 2 (Figure 2a). For this K value, the individuals were clustered into two main groups: SE and DE provenances, and ES provenance. For K = 3, the program sorted individuals into three groups which corresponded to the three provenances sampled in the study (Figure 2a).

3.1.2. Genetic Variability

MIP markers were uninformative with regard to sensitivity to methylation, but informative with respect to the degree of potential genetic polymorphism. MIP markers allowed for the construction of a second binary matrix that was used to establish a proxy of putative genetic differentiation between the individuals and provenances. The presence of a fragment in both the EcoRI/HpaII and EcoRI/MspI profiles is associated with unmethylated cytosines at these CCGG site, and therefore, this type of fragment could be treated as genetic. However, the analysis of MIP fragments must be interpreted carefully since this class of fragments may contain not only true genetic fragments but also fully methylated mCmCGG sequences. To avoid this type of bias, the Amplified Fragment Length Polymorphism technique (AFLP) was also used to analyze the differentiation between provenances. The same 60 trees from DE, ES, and SE provenances were analyzed using two primer combinations that revealed a total of 227 makers. From them, 180 markers were finally scored, 105 of them (58.33%) were polymorphic (Table 5).
The average number of observed alleles (Na), number of effective alleles (Ne), Shannon’s (I), and expected heterozygosity (He), calculated for provenances were consistent for both genetic markers (MIPs and AFLPs) (Table 4b,c). ES presented the lowest values for all parameters of genetic diversity except for the Ne for MIP markers (Table 4b,c). DE exhibited the highest values for all genetic diversity parameters indicating a higher genetic diversity of this provenance originating from the core distribution of Fagus sylvatica (Table 4b,c).
The AMOVA revealed that genetic variation mainly occurred within provenances (86% and 85% for MIP and AFLP markers, respectively), while the variation among the provenances was 14% and 15%, respectively. The estimated PhiPT value was 0.136 (p = 0.0001) and 0.152 (p = 0.001) using MIPs and AFLPs, indicating a moderate differentiation.
The distance matrix by provenances shows significant genetic differences among them for both MIP and AFLP markers. Similar to the epigenetic analysis (based on MSAP-MSPs), ES was the provenance more differentiated using genetic markers (MIP and AFLP). The PCoA analysis did not group the individuals in three separated clusters corresponding to the three provenances (Figure 1b, 1c) but the ES provenance could be differentiated from DE and SE provenances with AFLP markers. The first and second axes explained 24.27 and 19.22% of the variance using MIP markers, and 30.27 and 18.44% of the variance using AFLP markers.
A structure analysis of the AFLP markers showed that the best K was K = 2 (Figure 2c). As with the MSP markers, the individuals were clustered into two groups: SE and DE provenances, and ES provenance. For K = 3, most individuals were grouped mainly into three groups corresponding to the three studied provenances (Figure 2c). With the MIP markers, the individuals could not be clustered into different groups (Figure 2b).

3.1.3. Mantel Test

A positive correlation was detected between the epigenetic distance (based on MSPs) and the genetic distance estimated with MIPs or AFLPs (R = 0.172, p = 0.010 or R = 0.253, p = 0.010, respectively). Additionally, a lower but significant correlation was found between the genetic distances calculated with MIPs and AFLPs (R = 0.102, p = 0.020) (Supplementary Figure S2).

3.2. Water Stress Response

In order to study the response to drought, we analyzed 54 seedlings from the Spanish (ES) and an additional Swedish (SE) provenance, representing the latitudinal extremes of the distribution range of the species.

3.2.1. Water Status of Seedlings

The watering effect was significant for the predawn water potential, Ψpd (p < 0.0001) but not for the midday water potential, Ψmd (p >0.05 after ANOVA). The provenance effect was not significant for either the water potential at predawn (Ψpd), or for the water potential at midday (Ψmd) (p >0.05 after ANOVA). Specifically, after almost two months of progressive withdrawal of watering, the WS seedlings showed a significant decrease in Ψpd in comparison with the WW seedlings (Figure 3). There were no significant differences between the two provenances, and seedlings from both provenances had a similar decrease in Ψpd in response to water stress. In general, WS seedlings had slightly lower values of Ψmd than the WW seedlings, but the differences were not statistically significant (Figure 3). During the drought period, the soil moisture content was similar for both provenances in each watering treatment according to the water potential measurements (see more details on Sanchez-Gómez et al. [59]).

3.2.2. Epigenetic Analysis

MSAP analysis was performed in order to analyze the methylation status of the cytosine residues in response to drought. With the aim of increasing the number of polymorphic markers, a total of four MSAP primer combinations were selected based on the number of polymorphic markers and easy scoring. Among the selected combinations, EcoRI-ACG HpaII-ACT and EcoRI-AAC HpaII-AAT were the most and less informative primer combinations, respectively. The four selected MSAP primer combinations rendered a total number of 235 markers, of which 188 could be scored (Table 6): 109 markers were classified as MS (105 MSPs and 4 MSMs) and 79 as MI (29 MIPs and 50 MIMs).
The percentage of analyzed methylated restriction sites ranged between 31.7% of the total fragments in ES-WS and 32.5% in both SE-WW and SE-WS (Table 7). The percentage of full or hemi-methylated internal C ranged from 29.5% to 31% in ES-WW and SE-WS, respectively, while the percentage of hemi-methylated external C ranged from 1.2% to 2.4% in ES-WS and ES-WW, respectively. No significant differentiation between the WS and WW plants was observed in the Spanish or Swedish provenance nor between the provenances.
The average number of observed alleles (Na), number of effective alleles (Ne), Shannon’s (I), and expected heterozygosity (He), for epigenetic markers (MSAP-MSP) was similar for both the provenances and experimental treatments (Table 8a).
AMOVA based on PhiPT values indicated that most of the epigenetic diversity occurred within the provenances (82%), while the variability among the provenances contributed 18% when the ES-WW and SE-WW plants were compared. A PhiPT value of 0.180 revealed a significant differentiation between the provenances (p = 0.0001). The analysis of the SE provenance showed that the total epigenetic variation occurred within treatments, whereas 2% of the epigenetic variation was attributed to treatment in the ES provenance. A total of 4 out of 105 MSPs were associated with water stress response in the ES provenance (PhiPT per locus > 0.150, p < 0.05), and responsible for the 34% differentiation detected by AMOVA between the WW and WS plants (PhiPT = 0.345, p = 0.0001).
The calculated distance by provenances evidenced a strong epigenetic differentiation between the Swedish and Spanish provenances and a marginal differentiation between treatments for the Spanish provenance (pairwise genetic distance = 0.022, p = 0.067). A PCoA clustered the samples into two groups (Figure 4a), where the first and second axes explained 17.52% and 7.48% of the variance, respectively. One group included the SE-WW and SE-WD samples, while the other group integrated the ES samples with a higher differentiation between the WW and WD plants. Similarly, Structure software also clustered the individuals into two groups, the SE and ES provenances, regardless of the treatment (data not shown).

3.2.3. Genetic Variation

To further explore the genetic relationships between the ES and SE provenances subjected to drought, we increased the number of primer combinations. Both the MIPs and AFLPs obtained with five primer combinations were used to assess the genetic variability of the samples. We identified 29 MIPs with MSAPs and 232 out of 352 scorable fragments (66%) as polymorphic markers by AFLPs (Table 6 and Table 9).
The average number of observed alleles (Na), number of effective alleles (Ne), Shannon’s (I), and expected heterozygosity (He), were similar for both the provenances and treatments within the provenances for both the MIP and AFLP markers (Table 8b,c). The only exception was the Na estimated with the AFLPs that was slightly lower for the Spanish provenances (Table 8c).
Although most genetic variation from AMOVA was attributed to being within provenances, a significant differentiation was observed between provenances. Thus, the value of the differentiation index (PhiPT) between the SE and ES provenances was 0.208 (p = 0.0001) for Ms and 0.162 (p = 0.001) for AFLPs.
A PCoA analysis using a genetic distance matrix based on the MIPs or AFLPs grouped the individuals into two clusters corresponding with the ES and SE provenances (Figure 4b,c). The first and second axes explained 20.88 and 11.68% of the variance using MIPs, and 18.99 and 7.96% of the variance using AFLPs. These clearly differentiated groups were confirmed using Structure software (data not shown).

3.2.4. Correlation between Genetic and Epigenetic Variability

Correlation between the genetic and epigenetic variability was explored using a Mantel test. There was a positive correlation (R = 0.252, p = 0.001) between the pairwise genetic (AFLP) and epigenetic (MSAP-MSP) distance matrices while a marginally significant correlation (R = 0.126, p = 0.02) was detected between the genetic (MSAP-MIP) and epigenetic (MSAP-MSP) distance matrices. Furthermore, we also detected a positive correlation between both genetic distance matrices assessed from the AFLPs and MSAP-MIPs (R = 0.384, p = 0.001).

4. Discussion and Conclusions

During the last decades, patterns of genetic and epigenetic diversity in natural populations have been studied in different plant species [73,74]. Additional information is, however, still required to disentangle their relative role in determining the adaptive capacity of plants. Most epigenetic studies have focused on plant species of agronomic importance, although in recent years studies have been carried out on forest species, which have important socio-economic and ecological value [10,13,14,17,35,43,75,76,77,78,79,80]. In this study, we present the analysis of the genetic and epigenetic variation of three beech provenances that represent the latitudinal range of distribution of the species, which have been previously characterized at the metabolic and physiological levels [81,82]. Epigenetic variability of Fagus sylvatica was previously assessed on provenances from North and Central Europe [35]. Our study revealed strong epigenetic differentiation among European beech populations using MSAP markers, particularly separating central and northern populations from the southern population. In contrast, the exposure to water withdrawn for 50 days did not have a significant effect on epigenetic patterns in the studied provenances. Overall, these results point to the role that DNA methylation may play in local adaptation of F. sylvatica to environmental variation.
The total percentage of methylated sites was approximately 32% considering the whole data set, with very similar values across the provenances. Similar values have been found in other forest tree species such as Populus tomentosa or P. simonii with 36.43% and 32.36% of methylated sites, respectively. These two species also exhibited differences among populations [83,84]. In contrast, results for Fraxinus interspecific hybrids showed remarkably lower values of percentage of methylated sites, from 20.12% to 24.61%, depending on the genotype [85]. In conifers, differences between populations of Pinus sylvestris were not significant when methylation levels were compared. Percentages depend on the organ analyzed and the stage of development of the plant varying from 21.3% to 38.8% when megagametophytes and embryos were studied [86]. In other species, total methylation ranged from 13.50% to 44.70% in a full-sib family of Cupressus sempervirens L. [76], and from 30.3% to 33.8% in Larix kaempferi intraspecific hybrids [87]. The methylation levels were lower than in Pinus pinea populations (64.4%), a species characterized by very low levels of genetic variation [77]. It is important to highlight that MSAP provides information about cytosine methylation status at CCGG motives and different results may be obtained using other massive techniques such as bisulfite sequencing. The percentages of full or hemi-methylated internal C were much higher than percentages of hemi-methylated external C. This result, which supports Hrivnák et al. [35] observation in a previous work with beech populations, has also been detected in other forest trees, such as Quercus lobata and Q. ilex [88,89], Fraxinus mandshurica and F. americana [85], Ilex paraguariensis and I. dumosaspecies [90] or Pinus pinea [77].
Diversity analyses revealed that the ES provenance showed lower values of epigenetic and genetic diversity than the DE and SE provenances, which, despite their geographical distance, showed similar values. Although the highest epigenetic variation was within the provenances, the data showed that differences among populations explained 16% of the epigenetic variation, a value similar to the among-population genetic variation observed with AFLPs (15%) and MIPs (14%). Previous studies had already detected high levels of genetic variation within populations, although lower levels were detected among beech trees from different geographic origins [91]. This result is in line with the ecophysiological studies focused on assessing intra-population variability in response to drought. Analysis of half-siblings from different mother trees revealed a high degree of phenotypic differentiation among families for growth and functional traits [82,92]. Our analysis also revealed significant epigenetic differentiation (PhiPT = 0.156), similar to the genetic differentiation observed with AFLPs (PhiPT = 0.152) and slightly higher than with MIPs (PhiPT = 0.136). Previous studies have found contrasting patterns of epigenetic differentiation across species. Low epigenetic population differentiation and high genetic differentiation were detected in Prunus avium [75], while higher epigenetic differentiation was detected within and between mangrove populations from contrasting environments [78] as well as in valley oaks from climate gradients [93]. These results align with the idea that epigenetic variation in natural populations plays an important role in the local adaptation to different environments.
The grouping analysis based on PCoA and Structure resulted in three groups that corresponded to the DE, SE and ES provenances or in two groups, one of them including the DE and SE provenances. A similar differentiation between the DE and SE, and the ES provenance had been previously observed in the relative concentration of several metabolites [82]. DE and SE are two provenances located in Central and Northern Europe, with a markedly lower annual temperature than the ES provenance. Gugger et al. [88], using reduced-representation bisulphite sequencing data, identified 43 single-methylation variants that were significantly associated with climate variables, most of them with mean maximum temperature. These results also suggested that DNA methylation could be involved in local adaptation of plant populations to their environments. In addition, Hrivnák et al. [35] observed that the longitude of beech populations significantly correlated with cytosine methylation levels, identifying MSAPs correlating with environmental variables, that may suggest that weather or the photoperiod during embryogenesis could determine the methylation status of specific loci. In Norway spruce, a significant number of genes encoding epigenetic regulators involved in DNA and histone methylation, as well as sRNAs were differentially expressed during embryogenesis, acting in the epigenetic memory of temperature during this process [94]. Considering that the epigenetic marks can be inherited across generations, they could be associated with maternal effects or with lasting effects of exposure to environmental conditions. The analysis of progenies from trees located in natural mangrove populations in a common garden experiment revealed that, 25% of epigenetic differences could be explained by the maternal effect [95].
In this study, we also aimed to analyze the effect of moderate water stress on cytosine methylation dynamics in beeches from two contrasting latitudinal provenances (SE and ES). The Swedish provenance, from a region with a low evaporative demand, regular rainfall distribution and higher availability of groundwater, is particularly sensitive to water deficit [59]. In contrast, the Spanish provenance, which is located at the southern limit of beech’s distribution, is subjected to frequent and severe multi-year and recurrent droughts, combined with heatwaves leading to a high evaporative demand. The analyses of the percentage of DNA methylation revealed no significant differentiation between water-stressed and well-watered plants. This result is in contrast with the increase in DNA methylation level reported in different plant species grown under water deficit, such as in Quercus ilex [89], Populus trichocarpa [44], Fraxinus [85] and Hippophae rhamnoides [96]; or decreased DNA methylation levels as found in Lolium perenne [97] and Vicia faba L [98]; or genotype-dependent variations as observed in Populus euramericana [43]. The analyses of epigenetic variation showed that most of the variation was attributed to the origin of the provenances and only 2% of the variation was explained by the watering regime in the ES population, mainly associated with 4 out of the 105 MSP loci. Although the number of total loci analyzed is limited, given the genome-wide nature of the MSAPs, a higher coverage would reveal additional loci whose methylation status is associated with the water status of beech trees. This evidence for local adaptation to drought is in line with the higher variation in stress-related genes expression observed among beech progenies from different populations rather than in the drought response [91], which could be associated to the development, in xeric populations, of different functional strategies to face the low water availability than those from mesic populations.
Duration and intensity are important factors in plant stress response. It is possible that longer intensities and/or periods of exposure may trigger longer-term responses, causing a higher number of changes as observed when analyzing the MSAP patterns of Quercus ilex subjected to drought for 12 years [89]. Additionally, recurrent exposure to extreme events, such as drought, may also elicit a very different response compared to single sporadic exposure [99].
This study provides new data about the genetic and epigenetic variability of beech provenances from the latitudinal range of the species. The results on cytosine methylation dynamics of contrasting provenances revealed that within the provenance, variation is stronger than that associated with drought-induced responses. Further studies are required to improve our understanding about how drought response can be modified by its intensity, duration and recurrence. Additionally, our study focused on two-year-old seedlings, it would be important to explore the response of adult trees as well as the response of their progenies in order to acquire information not only about somatic memory but also intergenerational memory.

Supplementary Materials

The following supporting information can be downloaded at: https://www.mdpi.com/article/10.3390/f13121971/s1, Table S1: Sequences of adapters and primers used in the MSAP and AFLP assay; Figure S1: Scoring and interpretation of different banding patterns obtained in the MSAP assay; Figure S2: Graphical representation of the Mantel test results between epigenetic distance and genetic distance.

Author Contributions

Conceptualization, M.Á.G., I.A. and M.T.C.; methodology, M.Á.G. and M.T.C.; formal analysis, M.Á.G. and J.A.R.-V.; investigation, M.Á.G., N.d.M., M.D.V. and L.M.D.; resources, D.S.-G., J.A.M. and I.A.; writing—original draft preparation, M.Á.G.; writing—review and editing, M.Á.G., D.S.-G., J.A.R.-V., N.d.M., I.A. and M.T.C.; visualization, M.Á.G.; supervision, M.Á.G. and M.T.C.; project administration, M.Á.G.; funding acquisition, I.A. and M.T.C. All authors have read and agreed to the published version of the manuscript.

Funding

This research was funded by the Spanish Ministry of Science and Innovation (AGL2014-57762-R and AGl2011-25365).

Data Availability Statement

Not applicable.

Conflicts of Interest

The authors declare no conflict of interest. The funders had no role in the design of the study; in the collection, analyses, or interpretation of data; in the writing of the manuscript; or in the decision to publish the results.

References

  1. Douville, H.; Raghavan, K.; Renwick, J.; Allan, R.P.; Arias, P.A.; Barlow, M.; Cerezo-Mota, R.; Cherchi, A.; Gan, T.Y.; Gergis, J.; et al. 2021: Water Cycle Changes. In Climate Change 2021: The Physical Science Basis; Masson-Delmotte, V., Zhai, P., Pirani, A., Connors, S.L., Péan, C., Berger, S., Caud, N., Chen, Y., Goldfarb, L., Gomis, M.I., et al., Eds.; Cambridge University Press: Cambridge, UK; New York, NY, USA, 2021; pp. 1055–1210. [Google Scholar] [CrossRef]
  2. IPCC. 2022: Climate Change 2022: Impacts, Adaptation and Vulnerability; Pörtner, H.O., Roberts, D.C., Tignor, M., Poloczanska, E.S., Mintenbeck, K., Alegría, A., Craig, M., Langsdorf, S., Löschke, S., Möller, V., et al., Eds.; Contribution of Working Group II to the Sixth Assessment Report of the Intergovernmental Panel on Climate Change; Cambridge University Press: Cambridge, UK; New York, NY, USA, 2022; p. 3056. [Google Scholar] [CrossRef]
  3. Peñuelas, J.; Boada, M. A global change-induced biome shift in the Montseny mountains (NE Spain). Glob. Chang. Biol. 2003, 9, 131–140. [Google Scholar] [CrossRef] [Green Version]
  4. Jump, A.S.; Hunt, J.M.; Peñuelas, J. Rapid climate change-related growth decline at the southern range edge of Fagus sylvatica. Glob. Chang. Biol. 2006, 12, 2163–2174. [Google Scholar] [CrossRef] [Green Version]
  5. Peñuelas, J.; Ogaya, R.; Boada, M.; Jump, A.S. Migration, invasion and decline: Changes in recruitment and forest structure in a warming-linked shift of European beech forest in Catalonia (NE Spain). Ecography 2007, 30, 829–838. [Google Scholar] [CrossRef]
  6. Rabasa, S.G.; Granda, E.; Benavides, R.; Kunstler, G.; Espelta, J.M.; Ogaya, R.; Peñuelas, J.; Scherer-Lorenzen, M.; Gil, W.; Grodzki, W.; et al. Disparity in elevational shifts of European trees in response to recent climate warming. Glob. Chang. Biol. 2013, 19, 2490–2499. [Google Scholar] [CrossRef]
  7. Shaw, R.G.; Etterson, J.R. Rapid climate change and the rate of adaptation: Insight from experimental quantitative genetics. New Phytol. 2012, 195, 752–765. [Google Scholar] [CrossRef]
  8. Alberto, F.J.; Aitken, S.N.; Alía, R.; González-Martínez, S.G.; Hänninenk, H.; Kremer, A.; Lefèvre, F.; Lenormand, T.; Yeaman, S.; Whetten, R.; et al. Potential for evolutionary responses to climate change—Evidence from tree populations. Glob. Chang. Biol. 2013, 19, 1645–1661. [Google Scholar] [CrossRef] [Green Version]
  9. Borthakur, D.; Busov, V.; Cao, H.; Du, Q.; Gailing, O.; Isik, F.; Ko, J.H.; Li, C.; Li, Q.; Niu, S.; et al. Current status and trends in forest genomics. For. Res. 2022, 2, 11. [Google Scholar] [CrossRef]
  10. Balao, F.; Paun, O.; Alonso, C. Uncovering the contribution of epigenetics to plant phenotypic variation in Mediterranean ecosystems. Plant Biol. 2018, 20, 38–49. [Google Scholar] [CrossRef]
  11. Thiebaut, F.; Hemerly, A.S.; Ferreira, P.C.G. A role for epigenetic regulation in the adaptation and stress responses of non-model plants. Front. Plant Sci. 2019, 10, 246. [Google Scholar] [CrossRef] [Green Version]
  12. Nicotra, A.B.; Atkin, O.K.; Bonser, S.P.; Davidson, A.M.; Finnegan, E.J.; Mathesius, U.; Poot, P.; Purugganan, M.D.; Richards, C.L.; Valladares, F.; et al. Plant phenotypic plasticity in a changing climate. Trends Plant Sci. 2010, 15, 684–692. [Google Scholar] [CrossRef]
  13. Bräutigam, K.; Vining, K.J.; Lafon-Placette, C.; Fossdal, C.G.; Mirouze, M.; Marcos, J.G.; Fluch, S.; Fernández Fraga, M.; Guevara, M.A.; Abarca, D.; et al. Epigenetic regulation of adaptive responses of forest tree species to the environment. Ecol. Evol. 2013, 3, 399–415. [Google Scholar] [CrossRef] [PubMed]
  14. Amaral, J.; Ribeyre, Z.; Vigneaud, J.; Sow, M.D.; Fichot, R.; Messier, C.; Pinto, G.; Nolet, P.; Maury, S. Advances and promises of epigenetics for forest trees. Forests 2020, 11, 976. [Google Scholar] [CrossRef]
  15. Sahu, P.P.; Pandey, G.; Sharma, N.; Puranik, S.; Muthamilarasan, M.; Prasad, M. Epigenetic mechanisms of plant stress responses and adaptation. Plant Cell Rep. 2013, 32, 1151–1159. [Google Scholar] [CrossRef] [PubMed]
  16. Arora, H.; Singh, R.K.; Sharma, S.; Sharma, N.; Panchal, A.; Das, T.; Prasad, A.; Prasad, M. DNA methylation dynamics in response to abiotic and pathogen stress in plants. Plant Cell Rep. 2022, 41, 1931–1944. [Google Scholar] [CrossRef]
  17. Wu, W.Q.; Yi, M.R.; Wang, X.F.; Ma, L.L.; Jiang, L.; Li, X.W.; Xiao, H.X.; Sun, M.Z.; Li, L.F.; Bao, L. Genetic and epigenetic differentiation between natural Betula ermanii (Betulaceae) populations inhabiting contrasting habitats. Tree Genet. Genomes 2013, 9, 1321–1328. [Google Scholar] [CrossRef]
  18. Klupczynska, E.A.; Ratajczak, E. Can forest trees cope with climate change?—Effects of DNA methylation on gene expression and adaptation to environmental change. Int. J. Mol. Sci. 2021, 22, 13524. [Google Scholar] [CrossRef]
  19. Bossdorf, O.; Richards, C.L.; Pigliucci, M. Epigenetics for ecologists. Ecol. Let. 2008, 1, 106–115. [Google Scholar] [CrossRef]
  20. Richards, E.J. Natural epigenetic variation in plant species: A view from the field. Curr. Opin. Plant Biol. 2011, 14, 204–209. [Google Scholar] [CrossRef]
  21. Zhu, J.K. Abiotic stress signaling and responses in plants. Cell 2016, 167, 313–324. [Google Scholar] [CrossRef] [Green Version]
  22. Oberkofler, V.; Pratx, L.; Bäurle, I. Epigenetic regulation of abiotic stress memory: Maintaining the good things while they last. Curr. Opin. Plant Biol. 2021, 61, 102007. [Google Scholar] [CrossRef]
  23. Goodrich, J.; Puangsomlee, P.; Martin, M.; Long, D.; Meyerowitz, E.M.; Coupland, G. A Polycomb-group gene regulates homeotic gene expression in Arabidopsis. Nature 1997, 386, 44–51. [Google Scholar] [CrossRef] [PubMed]
  24. Bouyer, D.; Roudier, F.; Heese, M.; Andersen, E.D.; Gey, D.; Nowack, M.K.; Goodrich, J.; Renou, J.-P.; Grini, P.E.; Colot, V.; et al. Polycomb repressive complex 2 controls the embryo-to-seedling phase transition. PLoS Genet. 2011, 7. [Google Scholar] [CrossRef] [PubMed] [Green Version]
  25. Ikeuchi, M.; Iwase, A.; Sugimoto, K. Control of plant cell differentiation by histone modification and DNA methylation. Curr. Opin. Plant Biol. 2015, 28, 60–67. [Google Scholar] [CrossRef] [PubMed]
  26. Richards, C.; Schrey, A.W.; Pigliucci, M. Invasion of diverse habitats by few Japanese knotweed genotypes is correlated with epigenetic differentiation. Ecol. Lett. 2012, 15, 1016–1025. [Google Scholar] [CrossRef] [PubMed]
  27. Richards, C.; Pigliucci, M. Epigenetic Inheritance. A Decade into the Extended Evolutionary Synthesis. Paradigmi 2020, 38, 463–494. [Google Scholar] [CrossRef]
  28. Zhang, Y.-Y.; Fischer, M.; Colot, V.; Bossdorf, O. Epigenetic variation creates potential for evolution of plant phenotypic plasticity. New Phytol. 2013, 197, 314–322. [Google Scholar] [CrossRef]
  29. Herrera, C.M.; Bazaga, P. Epigenetic differentiation and relationship to adaptive genetic divergence in discrete populations of the violet Viola cazorlensis. New Phytol. 2010, 187, 867–876. [Google Scholar] [CrossRef]
  30. Herrera, C.M.; Bazaga, P. Epigenetic correlates of plant phenotypic plasticity: DNA methylation differs between prickly and non-prickly leaves in heterophyllous Ilex aquifolium (Aquifoliaceae) trees. J. Linn. Soc. Bot. 2013, 171, 441–452. [Google Scholar] [CrossRef]
  31. Herrera, C.M.; Medrano, M.; Bazaga, P. Comparative epigenetic and genetic spatial structure of the perennial herb Helleborus foetidus: Isolation by environment, isolation by distance, and functional trait divergence. Am. J. Bot. 2017, 104, 1195–1204. [Google Scholar] [CrossRef] [Green Version]
  32. Thumma, B.R.; Matheson, B.A.; Zhang, D.; Meeske, C.; Meder, R.; Downes, G.M.; Southerton, S.G. Identification of a Cis-acting regulatory polymorphism in a Eucalypt COBRA-like gene affecting cellulose content. Genetics 2009, 183, 1153–1164. [Google Scholar] [CrossRef] [Green Version]
  33. Bender, J. DNA methylation and epigenetics. Annu. Rev. Plant Biol. 2004, 55, 41–68. [Google Scholar] [CrossRef] [PubMed]
  34. Zilberman, D.; Gehring, M.; Tran, R.K.; Ballinger, T.; Henikoff, S. Genome-wide analysis of Arabidopsis thaliana DNA methylation uncovers an interdependence between methylation and transcription. Nat Genet. 2007, 39, 61–69. [Google Scholar] [CrossRef] [PubMed]
  35. Hrivnák, M.; Krajmerova, D.; Frýdl, J.; Gömöry, D. Variation of cytosine methylation patterns in European beech (Fagus sylvatica L.). Tree Genet. Genomes. 2017, 13, 117. [Google Scholar] [CrossRef]
  36. Inácio, V.; Barros, P.M.; Costa, A.; Roussado, C.; Goncalves, E.; Costa, R.; Graca, J.; Oliveira, M.M.; Morais-Cecílio, L. Differential DNA methylation patterns are related to phellogen origin and quality of Quercus suber cork. PLoS ONE 2017, 12. [Google Scholar] [CrossRef] [Green Version]
  37. Wang, W.S.; Qin, Q.; Sun, F.; Wang, Y.X.; Xu, D.D.; Li, Z.K.; Fu, B.Y. Genome-wide differences in DNA methylation changes in two contrasting rice genotypes in response to drought conditions. Front. Plant Sci. 2016, 7, 1675. [Google Scholar] [CrossRef] [Green Version]
  38. Wang, Q.; Xu, J.; Pu, X.M.; Lv, H.Z.; Liu, Y.J.; Ma, H.L.; Wu, F.K.; Wang, Q.J.; Feng, X.J.; Liu, T.H.; et al. Maize DNA methylation in response to drought stress is involved in target gene expression and alternative splicing. Int. J. Mol. Sci. 2021, 22, 8285. [Google Scholar] [CrossRef]
  39. Ackah, M.; Guo, L.; Li, S.; Jin, X.; Asakiya, C.; Aboagye, E.T.; Yuan, F.; Wu, M.; Essoh, L.G.; Adjibolosoo, D.; et al. DNA methylation changes and its associated genes in mulberry (Morus alba L.) Yu-711 response to drought stress using MethylRAD sequencing. Plants 2022, 11, 190. [Google Scholar] [CrossRef]
  40. Xu, J.; Zhou, S.; Gong, X.; Song, Y.; van Nocker, S.; Ma, F.; Guan, Q. Single-base methylome analysis reveals dynamic epigenomic differences associated with water deficit in apple. Plant Biotechnol. J. 2018, 16, 672–687. [Google Scholar] [CrossRef]
  41. Neves, D.M.; Almeida, L.A.D.H.; Santana-Vieira, D.D.S.; Freschi, L.; Ferreira, C.F.; Soares Filho, W.D.S.; Costa, M.G.C.; Micheli, F.; Coelho Filho, M.A.; Gesteira, A.D.S. Recurrent water deficit causes epigenetic and hormonal changes in citrus plants. Sci. Rep. 2017, 7, 13684. [Google Scholar] [CrossRef] [Green Version]
  42. Correia, B.; Valledor, L.; Hancock, R.D.; Jesus, C.; Amaral, J.; Meijon, M.; Pinto, G. Depicting how Eucalyptus globulus survives drought: Involvement of redox and DNA methylation events. Funct. Plant Biol. 2016, 43, 838–850. [Google Scholar] [CrossRef] [Green Version]
  43. Gourcilleau, D.; Bogeat-Triboulot, M.B.; Le Thiec, D.; Lafon-Placette, C.; Delaunay, A.; El-Soud, W.A. DNA methylation and histone acetylation: Genotypic variations in hybrid poplars, impact of water deficit and relationships with productivity. Ann. For. Sci. 2010, 67, 2009101. [Google Scholar] [CrossRef] [Green Version]
  44. Liang, D.; Zhang, Z.; Wu, H.; Huang, C.; Shuai, P.; Ye, C.-Y.; Tang, S.; Wang, Y.; Yang, L.; Wang, J.; et al. Single-base-resolution methylomes of Populus trichocarpa reveal the association between DNA methylation and drought stress. BMC Genet. 2014, 15, S9. [Google Scholar] [CrossRef] [PubMed] [Green Version]
  45. Lafon-Placette, C.; Le Gac, A.L.; Chauveau, D.; Segura, V.; Delaunay, A.; Lesage-Descauses, M.C.; Hummel, I.; Cohen, D.; Jesson, B.; Le Thiec, D.; et al. Changes in the epigenome and transcriptome of the poplar shoot apical meristem in response to water availability affect preferentially hormone pathways. J. Exp. Bot. 2018, 69, 537–551. [Google Scholar] [CrossRef] [PubMed]
  46. Sow, M.D.; Le Gac, A.L.; Fichot, R.; Lanciano, S.; Delaunay, A.; Le Jan, I.; Lesage-Descauses, M.C.; Citerne, S.; Caius, J.; Brunaud, V.; et al. RNAi suppression of DNA methylation affects the drought stress response and genome integrity in transgenic poplar. New Phytol. 2021, 232, 80–97. [Google Scholar] [CrossRef]
  47. Raj, S.; Bräutigam, K.; Hamanishi, E.T.; Wilkins, O.; Thomas, B.R.; Schroeder, W.; Mansfield, S.D.; Plant, A.L.; Campbell, M.M. Clone history shapes Populus drought responses. Proc. Natl Acad. Sci. USA 2011, 108, 12521–12526. [Google Scholar] [CrossRef] [PubMed] [Green Version]
  48. Sow, M.D.; Segura, V.; Chamaillard, S.; Jorge, V.; Delaunay, A.; Lafon-Placette, C.; Fichot, R.; Faivre-Rampant, P.; Villar, M.; Brignolas, F.; et al. Narrow-sense heritability and pST estimates of DNA methylation in three Populus nigra L. populations under contrasting water availability. Tree Genet. Genomes 2018, 14, 78. [Google Scholar] [CrossRef]
  49. Backes, K.; Leuschner, C. Leaf water relations of competitive Fagus sylvatica and Quercus petraea trees during 4 years differing in soil drought. Can. J. For. Res. 2000, 30, 335–346. [Google Scholar] [CrossRef]
  50. Aranda, I.; Gil, L.; Pardos, J.A. Seasonal changes in apparent hydraulic conductance and their implications for water use of European beech (Fagus sylvatica L.) and sessile oak [Quercus petraea (Matt.) Liebl] in South Europe. Plant Ecol. 2005, 179, 155–167. [Google Scholar] [CrossRef]
  51. Cano, F.J.; Sánchez-Gómez, D.; Rodríguez-Calcerrada, J.; Warren, C.R.; Gil, L. Aranda, I. Effects of drought on mesophyll conductance and photosynthetic limitations at different tree canopy layers. Plant Cell Environ. 2013, 36, 1961–1980. [Google Scholar] [CrossRef]
  52. Leuzinger, S.; Zotz, G.; Asshoff, R.; Körner, C. Responses of deciduous forest trees to severe drought in Central Europe. Tree Physiol. 2005, 25, 641–650. [Google Scholar] [CrossRef] [Green Version]
  53. Ciais, P.; Reichstein, M.; Viovy, N.; Granier, A.; Ogee, J.; Allard, V.; Aubinet, M.; Buchmann, N.; Bernhofer, C.; Carrara, A.; et al. Europe-wide reduction in primary productivity caused by the heat and drought in 2003. Nature 2005, 437, 529–533. [Google Scholar] [CrossRef] [PubMed]
  54. Brun, P.; Psomas, A.; Ginzler, C.; Thuiller, W.; Zappa, M.; Zimmermann, N.E. Large scale early-wilting response of central European forests to the 2018 extreme drought. Glob. Change Biol. 2020, 26, 7021–7035. [Google Scholar] [CrossRef] [PubMed]
  55. Magri, D.; Vendramin, G.G.; Comps, B.; Dupanloup, I.; Geburek, T.; Gömöry, D.; Latałowa, M.; Litt, T.; Paule, L.; Roure, J.M.; et al. A new scenario for the quaternary history of European beech populations: Palaeobotanical evidence and genetic consequences. New Phytol. 2006, 171, 199–221. [Google Scholar] [CrossRef] [PubMed]
  56. Hampe, A.; Petit, R. Conserving biodiversity under climate change: The rear edge matters. Ecol. lett. 2005, 8, 461–467. [Google Scholar] [CrossRef] [Green Version]
  57. De Lafontaine, G.; Ducousso, A.; Lefevre, S.; Magnanou, E.; Petit, R.J. Stronger spatial genetic structure in recolonized areas than in refugia in the European beech. Mol. Ecol. 2013, 22, 4397–4412. [Google Scholar] [CrossRef]
  58. Postolache, D.; Oddou-Muratorio, S.; Vajana, E.; Bagnoli, F.; Guichoux, E.; Hampe, A.; Le Provost, G.; Lesur, I.; Popescu, F.; Scotti, I.; et al. Genetic signatures of divergent selection in European beech (Fagus sylvatica L.) are associated with the variation in temperature and precipitation across its distribution range. Mol. Ecol. 2021, 30, 5029–5047. [Google Scholar] [CrossRef]
  59. Sánchez-Gómez, D.; Robson, T.M.; Gasco, A.; Gil-Pelegrín, E.; Aranda, I. Differences in the leaf functional traits of six beech (Fagus sylvatica L.) populations are reflected in their response to water limitation. Environ. Exp. Bot. 2013, 87, 110–119. [Google Scholar] [CrossRef] [Green Version]
  60. Reyna-López, G.; Simpson, J.; Ruiz-Herrera, J. Differences in DNA methylation patterns are detectable during the dimorphic transition of fungi by amplification of restriction polymorphisms. Mol. Gen. Genet. 1997, 253, 703–710. [Google Scholar] [CrossRef]
  61. McClelland, M.; Nelson, M.; Raschke, E. Effect of site-specific modification on restriction endonucleases and DNA modification methyltransferases. Nucleic Acids Res 1994, 22, 3640–3659. [Google Scholar] [CrossRef] [Green Version]
  62. Cervera, M.T.; Ruiz-García, L.; Martínez-Zapater, J.M. Analysis of DNA methylation in Arabidopsis thaliana based on methylation-sensitive AFLP markers. Mol. Genet. Genomics. 2002, 268, 543–552. [Google Scholar] [CrossRef] [Green Version]
  63. Schulz, B.; Eckstein, R.L.; Durka, W. Scoring and analysis of methylation-sensitive amplification polymorphisms for epigenetic population studies. Mol. Ecol. Resour. 2013, 13, 642–653. [Google Scholar] [CrossRef] [PubMed] [Green Version]
  64. Fulneček, J.; Kovařík, A. How to interpret methylation sensitive amplified polymorphism (MSAP) profiles? BMC Genet. 2014, 15. [Google Scholar] [CrossRef] [PubMed] [Green Version]
  65. Guevara, M.Á.; de María, N.; Sáez-Laguna, E.; Vélez, M.D.; Cervera, M.T.; Cabezas, J.A. Analysis of DNA Cytosine Methylation Patterns Using Methylation-Sensitive Amplification Polymorphism (MSAP). In Plant Epigenetics. Methods in Molecular Biology; Kovalchuk, I., Ed.; Humana Press: Boston, MA, USA, 2017; Volume 1456, pp. 99–112. [Google Scholar] [CrossRef]
  66. Salmon, A.; Clotault, J.; Jenczewski, E.; Chable, V.; Manzanares-Dauleux, M.J. Brassica oleracea displays a high level of DNA methylation polymorphism. Plant Sci. 2008, 174, 61–70. [Google Scholar] [CrossRef] [Green Version]
  67. Cervera, M.T.; Remington, D.; Frigerio, J.M.; Storme, V.; Ivens, B.; Boerjan, W.; Plomion, C. Improved AFLP analysis of tree species. Can. J. For. Res. 2000, 30, 1608–1616. [Google Scholar] [CrossRef]
  68. Peakall, R.; Smouse, P.E. GenAlEx 6: Genetic analysis in Excel. Population genetic software for teaching and research. Mol. Ecol. Notes. 2006, 6, 288–295. [Google Scholar] [CrossRef]
  69. Peakall, R.; Smouse, P.E. GenAlEx 6.5: Genetic analysis in Excel. Population genetic software for teaching and research-an update. Bioinformatics 2012, 28, 2537–2539. [Google Scholar] [CrossRef] [Green Version]
  70. Pritchard, J.K.; Stephens, M.; Donnelly, P. Inference of population structure using multilocus genotype data. Genetics 2000, 155, 945–959. [Google Scholar] [CrossRef]
  71. Falush, D.; Stephens, M.; Pritchard, J.K. Inference of population structure using multilocus genotype data: Linked loci and correlated allele frequencies. Genetics 2003, 164, 1567–1587. [Google Scholar] [CrossRef]
  72. Evanno, G.; Regnaut, S.; Goudet, J. Detecting the number of clusters of individuals using the software structure: A simulation study. Mol. Ecol. 2005, 14, 2611–2620. [Google Scholar] [CrossRef] [Green Version]
  73. Medrano, M.; Alonso, C.; Bazaga, P.; López, E.; Herrera, C.M. Comparative genetic and epigenetic diversity in pairs of sympatric, closely related plants with contrasting distribution ranges in south-eastern Iberian mountains. AoB Plants 2020, 12, 2041–2851. [Google Scholar] [CrossRef]
  74. Herrera, C.M.; Medrano, M.; Bazaga, P. Comparative spatial genetics and epigenetics of plant populations: Heuristic value and a proof of concept. Mol. Ecol. 2016, 25, 1653–1664. [Google Scholar] [CrossRef] [PubMed]
  75. Avramidou, E.V.; Ganopoulos, I.V.; Doulis, A.G.; Tsaftaris, A.S.; Aravanopoulos, F.A. Beyond population genetics: Natural epigenetic variation in wild cherry (Prunus avium). Tree Genet. Genomes. 2015, 11, 1–9. [Google Scholar] [CrossRef]
  76. Avramidou, E.V.; Doulis, A.G.; Aravanopoulos, F.A. Determination of epigenetic inheritance, genetic inheritance, and estimation of genome DNA methylation in a full-sib family of Cupressus sempervirens L. Gene 2015, 162, 180–187. [Google Scholar] [CrossRef]
  77. Sáez-Laguna, E.; Guevara, M.A.; Díaz, L.M.; Sánchez-Gómez, D.; Collada, C.; Aranda, I.; Cervera, M.T. Epigenetic variability in the genetically uniform forest tree species Pinus pinea L. PLoS ONE 2014, 9. [Google Scholar] [CrossRef] [PubMed] [Green Version]
  78. Lira-Medeiros, C.F.; Parisod, C.; Fernandes, R.A.; Mata, C.S.; Cardoso, M.A.; Ferreira, P.C.G. Epigenetic variation in mangrove plants occurring in contrasting natural environment. PLoS ONE 2010, 5. [Google Scholar] [CrossRef] [PubMed]
  79. Plomion, C.; Bastien, C.; Bogeat-Triboulot, M.B.; Bouffier, L.; Déjardin, A.; Sébastien Duplessis, S.; Bruno Fady, B.; Heuertz, M.; Le Gac, A.-L.; Le Provost, G.; et al. Forest tree genomics: 10 achievements from the past 10 years and future prospects. Ann. For. Sci. 2016, 73, 77–103. [Google Scholar] [CrossRef] [Green Version]
  80. García-García, I.; Méndez-Cea, B.; Martín-Gálvez, D.; Seco, J.I.; Gallego, F.J.; Linares, J.C. Challenges and Perspectives in the Epigenetics of Climate Change-Induced Forests Decline. Front. Plant Sci. 2022, 12, 797958. [Google Scholar] [CrossRef] [PubMed]
  81. Cadahía, E.; Fernández de Simón, B.; Aranda, I.; Sanz, M.; Sánchez-Gómez, D.; Pinto, E. Non-targeted metabolomic profile of Fagus Sylvatica L. leaves using liquid chromatography with mass spectrometry and gas chromatography with mass spectrometry. Phytochem. Anal. 2015, 26, 171–182. [Google Scholar] [CrossRef] [PubMed]
  82. Aranda, I.; Bahamonde, H.A.; Sánchez-Gómez, D. Intra-population variability in the drought response of a beech (Fagus sylvatica L.) population in the southwest of Europe. Tree Physiol. 2017, 37, 938–949. [Google Scholar] [CrossRef] [Green Version]
  83. Ma, K.F.; Song, Y.P.; Yang, X.H.; Zhang, Z.Y.; Zhang, D.Q. Variation in genomic methylation in natural populations of Chinese white poplar. PLoS ONE 2013, 8. [Google Scholar] [CrossRef] [Green Version]
  84. Ci, D.; Song, Y.; Du, Q.; Tian, M.; Han, S.; Zhang, D. Variation in genomic methylation in natural populations of Populus simonii is associated with leaf shape and photosynthetic traits. J. Exp. Bot. 2016, 67, 723–737. [Google Scholar] [CrossRef] [PubMed] [Green Version]
  85. Zeng, F.S.; Zhou, S.; Zhan, Y.G.; Dong, J. Drought resistance and DNA methylation of interspecific hybrids between Fraxinus mandshurica and Fraxinus americana. Trees 2014, 28, 1679–1692. [Google Scholar] [CrossRef]
  86. Alakärppä, E.; Salo, H.M.; Valledor, L.; Cañal, M.J.; Häggman, H.; Vuosku, J. Natural variation of DNA methylation and gene expression may determine local adaptations of Scots pine populations. J. Exp. Bot. 2018, 69, 5293–5305. [Google Scholar] [CrossRef] [PubMed] [Green Version]
  87. Li, A.; Song, W.Q.; Chen, C.B.; Zhou, Y.N.; Qi, L.W.; Wang, C.G. DNA methylation status is associated with the formation of heterosis in Larix kaempferi intraspecific hybrids. Mol. Breeding 2013, 31, 463–475. [Google Scholar] [CrossRef]
  88. Gugger, P.F.; Fitz-Gibbon, S.; Pellegrini, M.; Sork, V.L. Species-wide patterns of DNA methylation variation in Quercus lobate and their association with climate gradients. Mol. Ecol. 2016, 25, 1665–1680. [Google Scholar] [CrossRef] [PubMed]
  89. Rico, L.; Ogaya, R.; Barbeta, A.; Peñuelas, J. Changes in DNA methylation fingerprint of Quercus ilex trees in response to experimental field drought simulating projected climate change. Plant Biol. 2014, 16, 419–427. [Google Scholar] [CrossRef]
  90. Cascales, J.; Acevedo, R.M.; Paiva, D.I.; Gottlieb, A.M. Differential DNA methylation and gene expression during development of reproductive and vegetative organs in Ilex species. J. Plant Res. 2021, 134, 559–575. [Google Scholar] [CrossRef]
  91. Carsjens, C.; Ngoc, Q.N.; Guzy, J.; Knutzen, F.; Meier, I.C.; Müller, M.; Finkeldey, R.; Leuschner, C.; Polle, A. Intra-specific variations in expression of stress-related genes in beech progenies are stronger than drought-induced responses. Tree Physiol. 2014, 34, 1348–1361. [Google Scholar] [CrossRef] [Green Version]
  92. Aranda, I.; Sánchez-Gómez, D.; Cadahía, E.; Fernández de Simón, M.B. Ecophysiological and metabolic response patterns to drought under controlled condition in open-pollinated maternal families from a Fagus sylvatica L. population. Environ. Exp. Bot. 2018, 150, 209–221. [Google Scholar] [CrossRef]
  93. Platt, A.; Gugger, P.F.; Pellegrini, M.; Sork, V.L. Genome-wide signature of local adaptation linked to variable CpG methylation in oak populations. Mol. Ecol. 2015, 24, 3823–3830. [Google Scholar] [CrossRef]
  94. Yakovlev, I.A.; Carneros, E.; Lee, Y.; Jorunn, E.; Olsen, J.E.; Fossdal, C.G. Transcriptional profiling of epigenetic regulators in somatic embryos during temperature induced formation of an epigenetic memory in Norway spruce. Planta 2016, 243, 1237–1249. [Google Scholar] [CrossRef] [PubMed]
  95. Mounger, J.; Boquete, M.T.; Marc, W.; Schmid, M.W.; Granado, R.; Robertson, M.H.; Voors, S.A.; Langanke, K.L.; Alvarez, M.; Wagemaker, C.A.M.; et al. Inheritance of DNA methylation differences in the mangrove Rhizophora mangle. Evol. Dev. 2021, 23, 351–374. [Google Scholar] [CrossRef] [PubMed]
  96. Lyu, Z.; Zhang, G.; Song, Y.; Diao, S.; He, C.; Zhang, J. Transcriptome and DNA methylome provide insights into the molecular regulation of drought stress in sea buckthorn. Genomics 2022, 114, 110345. [Google Scholar] [CrossRef]
  97. Tang, X.M.; Tao, X.; Wang, Y.; Ma, D.W.; Li, D.; Yang, H.; Ma, X.R. Analysis of DNA methylation of perennial ryegrass under drought using the methylation-sensitive amplification polymorphism (MSAP) technique. Mol. Genet. Genomics 2014, 289, 1075–1084. [Google Scholar] [CrossRef] [PubMed]
  98. Abid, G.; Mingeot, D.; Muhovski, Y.; Mergeai, G.; Aouida, M.; Abdelkarim, S.; Aroua, I.; Ayed, M.E.; M´hamdi, M.; Sassi, K.; et al. Analysis of DNA methylation patterns associated with drought stress response in faba bean (Vicia faba L.) using methylation-sensitive amplification polymorphism (MSAP). Environ. Exp. Bot. 2017, 142, 34–44. [Google Scholar] [CrossRef]
  99. Liu, N.; Staswick, P.E.; Avramova, Z. Memory responses of jasmonic acid-associated Arabidopsis genes to a repeated dehydration stress. Plant Cell. Environ. 2016, 39, 2515–2529. [Google Scholar] [CrossRef]
Figure 1. Principal Component Analyses (PCoA) of German (blue diamond), Spanish (red circles) and Swedish (green triangles) provenances based on MSAP-MSP (a), MSAP-MIP (b) or AFLP (c). The explained variance percentages for each coordinate are shown in brackets.
Forests 13 01971 g001
Figure 2. Plot of delta K values and the population structure diagram of the Spanish (ES), Swedish (SE) and German (DE) provenances using MSAP-MSP (a), MSAP-MIP (b), or AFLP (c).
Forests 13 01971 g002
Figure 3. Predawn (top) and midday (bottom) water potential measured in well-watered (WW) and water-stressed (WS) seedlings from Spanish (ES) and Swedish (SE) provenances.
Forests 13 01971 g003
Figure 4. Principal Component Analyses (PCoA) of Spanish (red circles) and Swedish (green triangles) provenances based on MSAP-MSP (a), MSAP-MIP (b), or AFLP (c). The explained variance percentages for each coordinate are shown in brackets. Well-watered (solid symbols) and water-stressed (open symbols) seedlings.
Forests 13 01971 g004
Table 1. Location and climatic details of the provenances studied in the diversity (1) and water treatment (2) assays.
Provenance CodeAssayCountryLocationLatitudeLongitudeAltitude
(m. a. s. l)
Rainfall (mm)Average
Temperature
(°C)
DE1GermanyKempten47° 44′10° 23′860–90013166.9
ES1, 2SpainMontejo de
la Sierra
42° 01′3° 05′1250–1400950–11008.1
SE1SwedenBlaviksliarna57° 90′13° 14′758606.5
SE2SwedenFalkenberg56° 52′12° 51′1509007
Table 2. Number of MSAPs detected with the primer combinations used to analyze the seedlings from Spanish, German and Swedish Fagus sylvatica provenances.
HpaII/MspI-ATC EcoRI-AACHpaII/MspI-ACT EcoRI-ACGHpaII/MspI-AAT EcoRI-AACTotal
No. total markers647269205
No. scorable markers494748144
Methylation-insensitive markers (MI)
 No. polymorphic markers (MIP)13101134
 No. monomorphic markers (MIM)910827
Methylation-sensitive fragments (MS)
 No. polymorphic markers (MSP)27252981
 No. monomorphic markers (MSM)0202
Table 3. Percentage of analyzed methylated restriction sites (mean values ± SD) in German (DE), Spanish (ES), and Swedish (SE) provenances.
DEESSE
Full or hemi-methylated internal C31.1% ± 2.9%30.7% ± 2.4%30.8% ± 2.5%
Hemi-methylated external C0.9% ± 1.0%1.5% ± 0.7%1.2% ± 1.1%
Total32.1% ± 2.7%32.3% ± 2.7%32.0% ± 2.7%
Table 4. Epigenetic (a) and genetic (b,c) diversity parameters estimated for individuals of three provenances of Fagus sylvatica, Germany (DE), Spain (ES) and Sweden (SE), using MSAP-MSP (a), MSAP-MIP (b) and AFLP (c) markers. No. loci = Number of loci, P% = Percentage of polymorphic fragments, I = Shannon’s diversity index, Na = Number of alleles, Ne = Number of effective alleles, He = Expected Heterozygosity, (mean values ± SD).
a)
ProvenanceSample sizeNo. lociP%NaNeIHe
DE208175.311.519 ± 0.0951.324 ± 0.0380.313 ± 0.0280.200 ± 0.020
ES198167.901.432 ± 0.0961.268 ± 0.0350.273 ± 0.0270.171 ± 0.019
SE208175.311.543 ± 0.0911.337 ± 0.0380.322 ±0.0280.207 ± 0.020
b)
ProvenanceSample sizeNo. lociP%NaNeIHe
DE203485.291.735 ± 0.1141.355 ± 0.0650.327 ± 0.0450.210 ± 0.033
ES203461.761.235 ± 0.0961.326 ± 0.0640.289 ± 0.0490.191 ± 0.035
SE203467.651.412 ± 0.1531.319 ± 0.0620.297 ±0.0460.192 ± 0.033
c)
ProvenanceSample sizeNo. lociP%NaNeIHe
DE2010587.621.810 ± 0.0531.428 ± 0.0340.397 ± 0.0230.258 ± 0.017
ES1910565.711.419 ± 0.0831.369 ± 0.0360.326 ± 0.0270.216 ± 0.019
SE2010574.291.562 ± 0.0761.374 ± 0.0330.353 ± 0.0250.229 ± 0.018
Table 5. Number of AFLPs detected with the primer combinations used to analyze the three Fagus sylvatica provenances.
EcoRI + ATC
MseI + CAT
EcoRI + ATA
MseI + CAT
Total
No. total markers121106227
No. scorable markers9090180
No. polymorphic markers5154105
No. monomorphic markers393675
Table 6. Number of MSAPs detected with the primer combinations used to analyze seedlings from Spanish (ES) and Swedish (SE) Fagus sylvatica provenances subjected to different hydric regimes.
HpaII/MspI-AAT EcoRI-AACHpaII/MspI-ACT EcoRI-ACGHpaII/MspI-ATC EcoRI-AACHpaII/MspI-ACT EcoRI-AAC Total
No. total markers48636064235
No. scorable markers30595445188
Methylation-insensitive markers (MI)
No. polymorphic markers (MIP)21016129
No. monomorphic markers (MIM)716121550
Methylation-sensitive fragments (MS)
No. polymorphic markers (MSP)21292629105
No. monomorphic markers (MSM)04004
Table 7. Percentage of analyzed methylated restriction sites (mean values ± SD) of well-watered (WW) and water-stressed (WS) seedlings from Spanish (ES) and Swedish (SE) provenances.
SE-WWSE-WSES-WWES-WS
Full or hemi-methylated internal C30.9% ± 2.7%31.0% ± 2.7%29.5% ± 2.1%30.5% ± 2.6%
Hemi-methylated external C1.6% ±1.4%1.5% ± 1.1%2.4% ± 1.7%1.2% ± 1.1%
Total32.5% ± 2.9%32.5% ± 2.7%32.0% ± 2.8%31.7% ± 2.8%
Table 8. Epigenetic (a) and genetic (b,c) diversity parameters estimated for well-watered (WW) and water-stressed (WS) seedlings of Spanish (ES) and Swedish (SE) provenances using MSAP-MSP (a), MSAP-MIP (b) and AFLP (c) markers. No. loci = Number of loci; P% = Percentage of polymorphics fragments; I = Shannon’s diversity index; Na = Number of alleles; Ne = Number of effective alleles; He = Expected Heterozygosity, (mean values ± SD).
a)
ProvenanceTreatmentSample sizeNo. lociP%NaNeIHe
SEWS1310474.041.519 ± 0.0821.335 ± 0.0330.321 ± 0.0250.206 ± 0.018
SEWW1310465.381.356 ± 0.0901.335 ± 0.0360.304 ± 0.0270.199 ± 0.019
ESWS1410466.351.346 ± 0.0911.331 ± 0.0330.311 ±0.0260.202 ± 0.018
ESWW1110475.001.529 ± 0.0821.353 ± 0.0350.331 ± 0.0250.214 ± 0.018
b)
ProvenanceTreatmentSample sizeN lociP%NaNeIHe
SEWS142958.621.207 ± 0.1821.348 ± 0.0660.313 ± 0.0530.208 ± 0.037
SEWW142979.311.586 ± 0.1531.413 ± 0.0700.370 ± 0.0490.243 ± 0.036
ESWS152965.521.379 ± 0.1681.328 ± 0.0690.297 ± 0.0510.195 ± 0.037
ESWW122965.521.379 ± 0.1681.369 ± 0.0720.322 ± 0.0530.214 ± 0.038
c)
ProvenanceTreatmentSample sizeN lociP%NaNeIHe
SEWS1423278.021.621 ± 0.0491.394 ± 0.0230.364 ± 0.0170.237 ± 0.012
SEWW1423277.161.603 ± 0.0501.359 ± 0.0220.346 ± 0.0160.222 ± 0.011
ESWS1523268.971.453 ± 0.0561.390 ± 0.0240.349 ± 0.0180.231 ± 0.013
ESWW1223269.831.487 ± 0.0541.373 ± 0.0240.339 ± 0.0180.223 ± 0.012
Table 9. Number of AFLPs detected with the primer combinations used to analyze the seedlings from the Spanish and Swedish provenances subjected to different hydric regimes.
EcoRI + ATCEcoRI + ATAEcoRI-ACCEcoRI-AAT EcoRI-ACATotal
MseI + CATMseI + CATMse-CATMse-CCAMse-CCA
No. total markers124136466581452
No. scorable markers10184416166352
No. polymorphic markers7857263141232
No. monomorphic markers2327153025120
Publisher’s Note: MDPI stays neutral with regard to jurisdictional claims in published maps and institutional affiliations.

