Abstract
Alterations in plant litter inputs into the soil are expected to significantly affect soil greenhouse gas (GHG) emissions. However, the influence on boreal forest soils is not clear, given the large amount of accumulated soil organic matter that may buffer the impacts from the input of fresh litter. In this study, we conducted a litter manipulation experiment to explore the effects of the litter layer on soil GHG fluxes in a Dahurian larch (Larix gmelinii) forest ecosystem in northeastern China. Three litter treatments were implemented, namely aboveground litter removal (LR), litter double (LD), and unchanged litter input (CK). The associated microclimate, litter characteristics, and soil properties were also measured. The results showed that this larch forest soil acts as a source of CO2 and N2O but acts as a sink for CH4 for all litter manipulation treatments. LD increased the soil CO2 and N2O fluxes by 15% and 34%, while LR decreased them by 8% and 21%, respectively. However, soil CH4 uptake decreased by 34% in LD treatment and increased by 22% in LR treatment, respectively. Litter manipulation treatments can not only affect soil GHG fluxes directly but also, via their effects on soil MBC, NH4+−N, and NO3−−N content, indirectly affect variations in soil CO2, CH4 and N2O fluxes, respectively. Our study highlights the importance of the plant litter layer in regulating soil GHG between the atmosphere and soil in a Dahurian larch forest ecosystem, especially for litter addition. Considering the natural increase in litter quantity over time, this important regulatory function is essential for an accurate estimation of the role of boreal forests in mitigating future climate change.
1. Introduction
Forests cover 31% of the land area and contain large carbon and nitrogen pools [1]. Forest soils play a vital role in modulating the global greenhouse gas (GHG) budget, and they act predominantly as CO2 and N2O sources and CH4 sinks [2,3], and even small variations in the forest soil GHG fluxes can substantially affect global climate change [4,5]. Soil–atmosphere exchanges of CO2, CH4, and N2O in forest ecosystems are strongly influenced by plant species, soil properties and climate change [6,7]. Warming can considerably alter the quantity of plant litter input into soils and further impact soil GHG emissions [8]. Therefore, how and to what extent soil GHG fluxes respond to litter input is critical for understanding future climate forcing.
Soil GHG fluxes are strongly affected by soil nutrient and substrate availability, soil microenvironmental factors including soil temperature and moisture, and soil physicochemical properties [9]. In forest ecosystems, alterations to the litter input can regulate soil GHG production and diffusion by affecting these soil factors. Litter is an important source of soil organic matter and nutrients, and is the main pathway for transferring nutrients and organic matter from the vegetation to the soil due to rapid turnover [10,11]. The litter layer can also release and consume GHG. Litter respiration is an important component of soil CO2 fluxes, and the litter-induced contribution to the total CO2 fluxes can even be more than 46% [12]. An increase in fresh litter input could result in a “priming effect” that can enhance the soil respiration and nutrient input by accelerating the litter decomposition [13,14]. However, the occurrence and magnitude of the “priming effect” depend on the quantity and quality of the litter [15]. The litter layer can act as a sink and a source of CH4 and N2O [16,17,18,19]. Alterations in the litter input can change the soil microenvironment, including the soil temperature, moisture, and soil oxygen conditions, and ultimately affect soil GHG fluxes [20,21]. A thick litter layer can act as a physical barrier against soil GHG diffusion [22] and can also change the soil oxygen conditions, affecting soil GHG fluxes by influencing related microbial processes [9]. Variation in the litter layer can also affect the soil structure, including soil aggregates, and regulate soil GHG fluxes [23]. Although many studies have focused on the effects of litter manipulation on soil GHG fluxes, given that these complex interactive effects and plants differ in terms of litter input among different forest ecosystems, there is little agreement on soil GHG patterns of variation in the context of litter input. Therefore, a knowledge gap remains regarding the magnitude and direction of soil GHG fluxes in litter input alteration, especially in boreal forests.
The boreal forest is the second largest terrestrial biome worldwide and plays a critical role in the global carbon and nitrogen cycles [24]. As one of the regions most sensitive to climate change [25], warming is believed to enhance soil GHG fluxes in boreal regions by promoting the thawing of permafrost, which releases large amounts of carbon and nitrogen in the form of GHGs [26,27]. However, the regulation of soil GHG fluxes by the litter layer is ignored during this process. Due to long-term low temperatures, there is a lower litter decomposition rate in boreal forests, and the litter layer accumulates over time. The thickness of the litter layer can influence the belowground biogeochemical processes by modifying nutrient inputs and biotic activities [28], thereby affecting soil GHG emissions. Therefore, a better understanding of the effects of variations in litter quantity, especially addition of litter, on soil GHG emissions is necessary to better predict the feedback of boreal forests on future climate change.
The northern area of the Daxing’an Mountains is the only cold-temperate zone in China with a concentrated distribution of boreal forest areas [29,30]. The natural forest in this region harbors large standing litter layers. Because of the cold temperatures, the litter decomposition rate is lower than the production rate [31]. The standing litter layers increase over time [32]. Although variation in the litter input has significant effects on the soil nutrient input [33], there is a lack of understanding of how this litter increase affects the soil GHG fluxes in this region. As one of the regions that responds most rapidly to global warming in recent decades [34], rapid increases in temperature in this region over the years can affect the litter decomposition and the litter production, considerably affecting soil GHG fluxes [35,36]. Considering the huge carbon and nitrogen sinks and ecosystem vulnerability in this region [30,37], changes in the soil GHG emissions due to alterations in plant litter input may have considerable effects on the ecological benefits and sink functions of these forests. To identify how soil GHG fluxes respond to future changes in the quantity of plant litter inputs, we conducted a short-term litter addition and removal study in a Dahurian larch (Larix gmelinii) forest, which is the top community of the forest ecosystems in this area. Considering the importance of litter in providing soil nutrients and the lower litter decomposition rates in this region, our study addressed the following questions: (1) How and to what extent do litter manipulation treatments regulate soil GHG fluxes? (2) Is there the same level of effect from the litter double (LD) treatment and the litter removal (LR) treatment on soil GHG fluxes compared with the control (CK)? (3) How do the factors, individually or together, drive soil GHG fluxes in the three different litter manipulation treatments?
2. Materials and Methods
2.1. Study Area
This study was conducted in an 83-year-old Dahurian larch (Larix gmelinii) forest at Heilongjiang Mohe Forest Ecosystem Research Station, located in the Daxing’an Mountains of northeastern China (122°06′–122°27′ E, 53°17′–53°30′ N). This forest is characterized by the canopy tree species Larix gmelinii. The understory is dominated by Rhododendron dauricum. This site is situated in the continuous permafrost region, with elevations of 300–500 m. The region has a typical cold-temperate continental monsoon climate, with average annual temperature of −4.9 °C and average annual precipitation of 430–550 mm. The frost-free period spans 80–90 days (June to August) for plant growth. The soil type in this site is mainly a brown coniferous forest soil based on the soil classification of China, and the soil organic carbon and total nitrogen stocks (0–100 cm) are 99.46 Mg ha−1 and 10.00 Mg ha−1, respectively. Meadow soil and marsh soil are also interspersed here. The stand and surface soil (0–10 cm) characteristics are shown in Table 1. The typical natural vegetation is deciduous coniferous forest with Larix gmelinii as the dominant species.

Table 1.
The basic characteristics of the larch forest. The soil characteristics were shown in 0–10 cm soil layer. The values are followed by mean ± SD.
2.2. Experimental Design
The experimental plots were established in September 2018. Three 20 m × 30 m plots, at intervals of >20 m, were placed randomly in a 1 ha permanent research plot in a larch forest ecosystem, with the slope <5°. In each plot, nine subplots (1 m × 1 m) free of trees were randomly selected, and three of these neighboring subplots were separated into one block, making a total of three blocks per plot. In order to eliminate the potential spatial differences in soil gas samples, the plots were located away from tree bases. The three litter manipulation treatments were conducted in every block with one replicate of each treatment in each block—therefore, three replicates per treatment in total. The litter manipulation treatments included an unchanged litter input treatment (CK), a litter double treatment (LD) and a litter removal treatment (LR). The CK subplots received no treatment and had normal annual aboveground litter inputs. In the LR subplots, the total aboveground litter and debris on the soil surface were removed carefully by hand, and then we installed a 1 mm nylon net (1 m × 1 m) to prevent new litter input. The height of the nylon net was about 20 cm above the ground. At the same time, we transferred the litter removed from each of the LR subplots to the corresponding LD subplots. In addition, the aboveground litterfall collected from inside the nylon net was also transferred to the LD subplots every month, and the fresh litterfall was removed 2 days before measurement. The thickness of the natural litter layer ranged from 5 to 6 cm in this area, and no significant differences were found among the nine subplots before litter manipulation. During the whole period of our study, shrubs and grasses in all treatments were removed (cutting the aboveground parts to avoid interference from aboveground vegetation).
In our study, soil GHG fluxes were measured with a closed opaque static chamber. In September 2018, a permanent open square-framed base (50 cm × 50 cm) was placed in the middle of each subplot (a total of 27 base collars). Each chamber base was pushed into the soil to approximately 5 cm depth. The soil GHG fluxes were measured monthly from May to October in 2019 twice every month. However, we missed measurements once in June and August, respectively. In October, there was a heavy snowfall after we finished the first measurement; given that the snow cover would change the structure and properties of the litter layer, we also only had one measurement. Thus, our study included nine sampling events in total. Sampling took place between 9:00 and 11:00 a.m. During sampling, an open-bottom polypropylene chamber (50 cm × 50 cm × 50 cm) with insulation material outside was placed over each of the permanent bases to allow accumulation of soil gases. There were three holes in the top of the polypropylene chamber. The sampling port, the fan power cable and the thermometer probe were connected through a rubber septum. The fan installed in the chamber was powered by a 12-volt battery to increase air circulation. Meanwhile, water was poured in the groove of the base to seal the connection between the chamber and base and avoid gas loss.
Gas samples were collected from each chamber at 0, 15, 30, and 45 min after chamber closure using a 50 mL plastic syringe. The gas samples were injected into a 100 mL pre-evacuated gas sampling bag (Delin Gas Packing Co., Dalian, China) and transported to the lab for gas analysis. Simultaneously, we measured the air temperature inside the chamber when we collected a gas sample. The gas samples were stored at air temperature and analyzed within 1 week. Gas concentrations in all samples were determined with a gas chromatograph (TRACE 1300 GC, Thermo Fisher Scientific, Waltham, MA, USA). Soil CO2, CH4, and N2O fluxes were determined based on linear model regression analysis of the change in gas concentration in the chambers with time over a 45 min period for each chamber. The detailed method is described in previous studies [38,39].
2.3. Soil Samples and Analysis
Soil samples were collected from the three different litter manipulation treatments at all 27 subplots monthly. At each sample plot, nine surface soil core samples (0–10 cm) were collected, with one at each subplot when collecting the gas sample. Soil samples from the same litter manipulation treatment were mixed in each sample plot. Before soil cores were taken, the litter layer was carefully moved aside, and only mineral soil was sampled. Meanwhile, soil temperatures at 10 cm soil depth (ST) were measured by a portable thermometer (Delta TRAK, Pleasanton, CA, USA). Soil samples were transported to the laboratory inside an insulated box to determine soil ammonium nitrogen (NH4+−N), nitrate nitrogen (NO3−−N), and soil microbial biomass carbon (MBC) and soil microbial biomass nitrogen (MBN).
All soil samples were sieved by a 2 mm screen to further remove roots and debris. The soil samples were then divided into two subsamples. One subsample was air-dried at room temperature (20 °C) for other analysis of soil properties; another subsample was stored at 4 °C for soil microbial biomass and soil inorganic nitrogen analyses. Soil mass water content was measured gravimetrically. Soil NO3−−N and NH4+−N contents were extracted with 1 mol L−1 potassium chloride (KCl) solution and the suspensions analyzed using a flow injection auto-analyzer (Seal Analytical AA3, Norderstedt, Germany). Soil MBC and MBN were measured by the fumigation extraction method [40].
2.4. Litter Sample Analysis
2.4.1. Litter Decomposition
Freshly senesced litter was collected in September 2018 from the larch forest study site and was then transported to the laboratory. All of the litter was cleaned to remove the semi-decomposed litter and other debris. The litter was then dried at room temperature (20 °C) for 10 days and then stored until further use. Nylon bags with 1 mm mesh were filled with 10 g of dried litter and closed with nylon ties. The litter bags were placed horizontally in the surface soil at five random locations throughout the larch forest in October 2018, before the first snow event, with seven bags at each site and 35 litter bags in total. All of the litter bags were retrieved between May and November 2019. At the beginning of each month, one litter bag was taken from each of the five locations, with a total of five litterbags each time. The litter collected was carefully cleaned and dried at 65 °C for at least 24 h to constant weight. The remaining contents of each replicate litter bag were weighed individually to determine the mass loss, and the values of the five replicates were averaged. The litter decomposition was determined by the mass loss percentage (%) each month, calculated as the difference between adjacent samples. For example, the litter mass loss percentage in May was calculated as the difference in the litter dry weight between May and June.
2.4.2. Fresh Litter Production and Litter Standing Crop
The forest litter was collected monthly from early May 2019 to October 2019 using five traps. The collecting traps were conical net bags made of nylon mesh that were 1 m in diameter and height. The traps were supported using a 1.5 m PVC pipe with a circular frame structure. The litter was collected from each trap at the beginning of each month and dried to constant weight in an oven at 65 °C. The standing litter crop, including the total aboveground litter and debris on the soil surface, was determined monthly inside five 0.5 m × 0.5 m quadrats set randomly in each plot. After each monthly collection, the litter was transported to the laboratory and dried to constant weight at 65 °C.
2.5. Statistical Analyses
Data analysis was performed using IBM SPSS Statistics 21.0 (Armonk, NY, USA). One-way analysis of variance (ANOVA), followed by the LSD test, was used to examine the statistical significance of the litter manipulation treatments (CK, LD, and LR) on soil properties and soil GHG fluxes. Two-way ANOVA was used to test the statistical significance of the litter manipulation treatment and sampling date on the soil properties, soil temperature, soil water content, and soil GHG fluxes. The Pearson correlation analysis and stepwise multiple linear analysis were used to test the correlations between soil GHG fluxes and measured edaphic factors and explore the main factors affecting the seasonal variations in soil GHG fluxes. A structural equation model (SEM) was used to explore the pathways of litter manipulation treatments affecting soil GHG fluxes. The best fit model was assessed by fit indices, including non-significant paths (p > 0.05) and χ2 test (0 ≤ χ2/df ≤ 2), and standardized root mean square residual (SRMR < 0.05). The SEM analyses were conducted using AMOS 20.0 software (SPSS Inc., Chicago, IL, USA). All of the figures were drawn using OriginPro 2016 software (OriginLab Corp., Northampton, MA, USA).
3. Results
3.1. Litter Characteristics
Litter production, decomposition, and standing litter showed clear seasonal variation during the study period (Figure 1), with standing litter also showing an increasing trend. The highest standing litter was observed in October (7.64 Mg·ha−1) and was 1.7 times that of May. Litter decomposition (mass loss rate) ranged from 1.84% to 5.91% during the study period, with litter decomposition peaking in August. Litter production showed significant differences among months. The highest litter production of 128.71 g·m2 in September was significantly higher than that in the other months (p < 0.01).
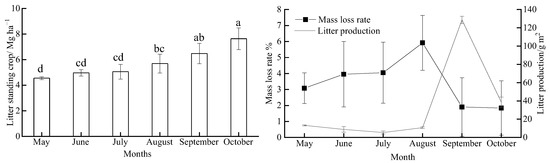
Figure 1.
Monthly variations in the litter standing crop, litter decomposition, and litter production during our study period (n = 5). The different lowercase letters above the bars show the significant difference (p < 0.05) among months; values are the mean ± SD.
3.2. Effects of Litter on the Soil Microclimate and Soil Properties
Soil temperature and soil water content under different litter manipulation treatments showed similar temporal variations over time during the study period (Figure 2; Table A1). Soil temperature presented a single-peak curve, with the highest soil temperature values in July (Figure 2a). Soil water content fluctuated considerably during the study period and was significantly higher in May and July than in the other months (Figure 2c). Based on the average values, there were no significant differences in soil temperature among different litter manipulation treatments (p > 0.05) (Figure 2b; Table A1). However, soil water content in the LD treatment (48.04%) was significantly higher than that in the LR treatment (37.16%) (p < 0.05) (Figure 2d).
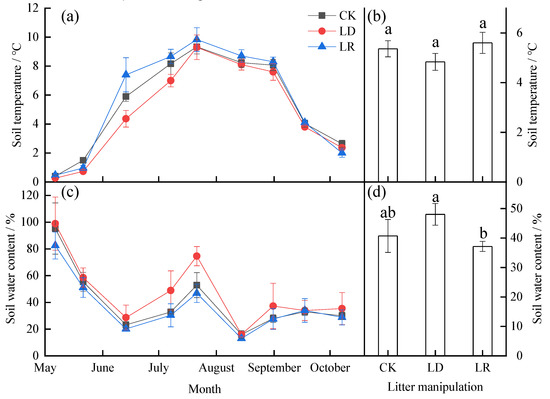
Figure 2.
Monthly dynamics of the soil temperature (a) and soil water content (c) and their averages (b,d) under different litter manipulation treatments during the study period. The subplots with three bars show the average soil temperature and soil water content for the entire study period (n = 3). The different lowercase letters above the bars indicate significant differences among different litter manipulation treatments (n = 27); values are the mean ± SD. Litter manipulation treatment abbreviations: CK, unchanged litter input; LD, doubled litter; LR, litter removal.
Soil NO3−−N, NH4+−N, MBC, and MBN also showed strong temporal dynamics during the study period (Figure 3; Table A1). The soil NO3−−N and NH4+−N contents showed decreasing trends during observation, while higher values were also found in July (Figure 3a,b). The soil MBC and MBN contents showed significant seasonal fluctuations (Figure 3c,d). During the study period, higher soil MBC content was found in July and October, whereas higher soil MBN content was found only in July among the three litter manipulation treatments. Based on the average values, compared with the CK treatment, the LD treatment significantly increased soil NO3−−N, NH4+−N, MBC, and MBN content by 23%, 26%, 30%, and 36% (p < 0.05), respectively, and the LR treatment decreased them by 19% (p < 0.05), 5%, 14%, and 13% (p > 0.05), respectively. The interaction between litter manipulation and the sampling date also had a significant effect on the soil NO3−−N, MBC, and MBN content (Table A1).
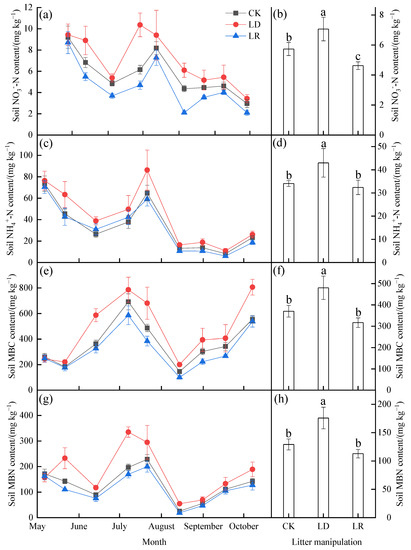
Figure 3.
Monthly variations in the soil NO3−−N (a), NH4+−N (c), MBC (e), and MBN (g) contents, and their averages (b,d,f,h) under different litter manipulation treatments during the study period (n = 3). The subplots with three bars show the average soil temperature and water content for the entire study period. The different lowercase letters above the bars indicated significant differences among different litter manipulation treatments (n = 27); values are the mean ± SD. Litter manipulation treatment abbreviations: CK, unchanged litter input; LD, doubled litter; LR, litter removal.
3.3. Temporal Variation in Soil GHG Fluxes among Litter Manipulation Treatments
The soil GHG fluxes exhibited clear seasonal variation across all litter manipulation treatments (Figure 4, Table A1). The soil CO2 fluxes showed pronounced single-peak curves in the three litter manipulation treatments, with the highest emissions in August (Figure 4a). All of the observed CH4 fluxes, that is, the net CH4 uptake, were negative during the study period (Figure 4c). The soil CH4 uptake rate showed inverted peaks, with the highest uptake rates in August (Figure 4e). There were also strong seasonal fluctuations in the soil N2O fluxes under litter manipulation during the study period (Figure 4e). Based on the average soil flux during the study period, the LD treatment significantly increased soil CO2 and N2O emissions by 15%and 34%, respectively, and decreased soil CH4 uptake by 34% (p < 0.05), whereas the LR treatment significantly increased N2O emission by 21% and increased soil CH4 uptake by 22% (p < 0.05). The soil CO2 fluxes only slightly decreased, by 8%, in the LR treatment (Figure 4b) (p > 0.05).
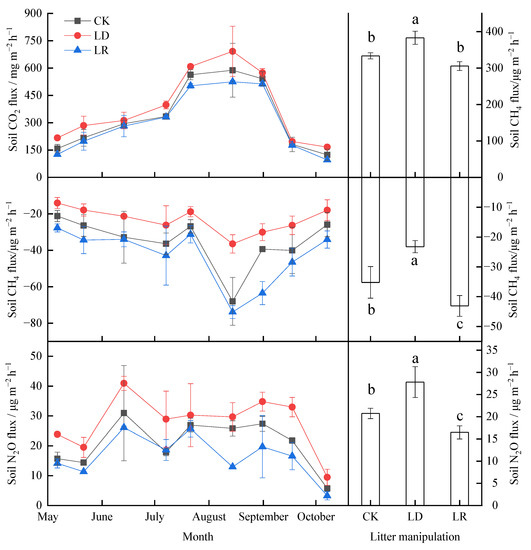
Figure 4.
Temporal variations (a,c,e) and average (b,d,f) soil GHG emissions from the larch forest soils under different litter manipulation treatments during the study period (n = 3). The different lowercase letters above the bars indicated significant differences among different litter manipulation treatments (n = 27); values are the mean ± SD. Litter manipulation treatment abbreviations: CK, unchanged litter input; LD, doubled litter; LR, litter removal.
3.4. Effects of Environmental Factors on the Soil GHG Fluxes
During the study period, soil CO2, CH4 and N2O fluxes were significantly correlated with soil temperature in the three litter manipulation treatments (p < 0.05) (Table 2). The soil CH4 fluxes were also significantly correlated with the soil water content in all of the litter manipulation treatments. Meanwhile, a significantly negative correlation between the soil water content and soil CO2 flux was found only for the LR treatment. There were significantly positive relationships between the soil CH4 fluxes and soil inorganic N and microbial biomass (Table 2).
Table 2.
Correlations of soil GHG fluxes with soil NO3−-N, NH4+-N, MBC, and MBN contents measured under different litter manipulation treatments (* p < 0.05; ** p < 0.01). Litter manipulation treatment abbreviations: CK, unchanged litter input; LD, doubled litter; LR, litter removal.
The stepwise linear multiple models showed that the soil temperature and MBC content were the dominant factors controlling the soil CO2 flux among the three litter manipulation treatments during the study period (Table 3). Soil NH4+−N content was also the main factor affecting the monthly dynamics of the soil CO2 flux in the CK and LD treatments. In the CK treatment, the dynamics of the soil CH4 fluxes were mainly determined by the soil water content, NO3−−N content and MBN content, whereas they were mainly determined by the soil temperature and the soil NO3−−N content in the LD and LR treatments. Meanwhile, soil NH4+−N and MBC content also played vital roles in regulating soil CH4 fluxes seasonality variations in LD and LR, respectively. The main factors affecting the soil N2O flux dynamics were soil NO3−−N and MBN content in the CK and LD treatments, and soil temperature and NO3−−N content in the LR treatment.
Table 3.
The stepwise multiple linear regression model between the soil GHG fluxes and the soil factors in three litter manipulation treatments (* p < 0.05; ** p < 0.01; *** p < 0.001; numbers are the model coefficients). Litter manipulation treatment abbreviations: CK, unchanged litter input; LD, doubled litter; LR, litter removal.
3.5. Litter Manipulation Treatments Effects on Soil GHG Fluxes
The structural equation models (SEM) suggested the major pathways of litter manipulation treatments affecting soil GHG fluxes. SEM explained 81%, 71% and 56% of variations in soil CO2, CH4 and N2O fluxes among the different litter manipulation treatments, respectively. Both litter manipulation and soil temperature were the main factors affecting soil CO2, CH4 and N2O fluxes directly. Meanwhile, litter manipulation also indirectly regulated soil CO2 and N2O fluxes by its effects on soil MBC and NO3−−N content, respectively. Soil NH4+−N content had significantly direct effects on variations in soil CH4 fluxes among different litter manipulation treatments.
4. Discussion
4.1. Effects of Litter Manipulation Treatments on the Soil CO2 Fluxes
The litter manipulation treatments had significant effects on the soil GHG fluxes in the present study (Figure 4, Table A1). The soil CO2 fluxes significantly increased, by 15%, in the LD treatment but slightly decreased, by 8%, in the LR treatment, compared with CK. This point can be explained by soil MBC content that contributed substantially to variations in soil CO2 fluxes among the different litter manipulation treatments (Figure 5a). Generally, the litter layer has been recognized as an important source of soil organic matter and nutrients, which can strongly affect the energy supply and microbial substrate availability [41,42]. Previous studies and meta-analyses have reported that the increase in soil respiration with litter addition is mainly due to the strong positive effects of the litter inputs on soil substrate availability, such as nutrient availability, labile carbon, and the abundance of soil microorganisms [43,44,45]. Lower soil nutrients and substrates for soil microorganisms in LR could decrease the soil respiration [46,47]. The soil microbial biomass is a major labile nutrient pool [48]. Thus, high soil MBC content induced high soil CO2 fluxes in the LD treatment (Figure 3).
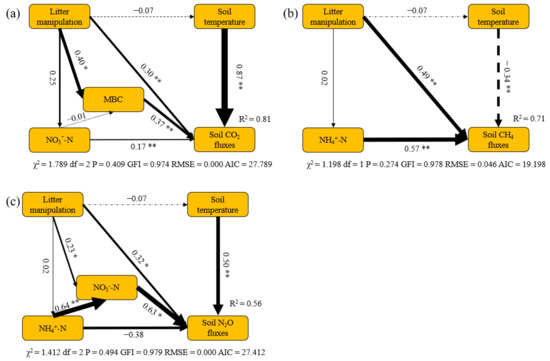
Figure 5.
Structural equation models (SEM) show the major pathways of litter manipulation treatments on variations in soil CO2 (a), CH4 (b) and N2O (c)fluxes in larch forest. Single arrows represent direct linear causal relationships. Numbers beside arrows are standardized path coefficients. Significance of the correlation is indicated at the 0.01 (**) and 0.05 (*) level. Arrow width is proportional to the size of the standardized path coefficients. Solid and dotted arrows indicate positive and negative relationships, respectively. R2 denotes the proportion of variance explained by SEM.
Litter itself can also regulate soil CO2 fluxes directly (Figure 5a). Litter decomposition is an important component of soil respiration. However, there is a lower litter decomposition rate due to lower temperatures and recalcitrant substrate quality in this region [49], which leads to a lower contribution from the litter layer to total respiration, compared with other biomes [12]. Thus, there were no significant differences in soil CO2 fluxes between the CK and LR treatments. On the contrary, increased plant litter inputs could increase litter decomposition because the priming effects resulting from the litter increase could accelerate the decomposition of organic matter and enhance soil respiration [13,50]. This priming effect was also reported in our study area [51], which is another reason explaining the high CO2 fluxes in the LD treatment. Meanwhile, soil CO2 fluxes were also positively related to soil temperature (Figure 5a), the main factor affecting seasonal variations in soil GHG fluxes (Table 2 and Table 3).
4.2. Effects of Litter Manipulation Treatments on Soil CH4 Fluxes
We found that the average soil CH4 fluxes were negative across all litter manipulation treatments (Figure 4), indicating a net CH4 sink in our study area during observation. Our study findings are consistent with the evidence that larch forest soil is a net CH4 sink during the growing season in this region [3]. In the present study, the soil CH4 fluxes were particularly low in the LR treatment, which is in line with previous studies in which litter removal enhanced the soil CH4 uptake [12,22]. Gas diffusion is the primary factor controlling the soil CH4 uptake because of the high potential for CH4 oxidation by methanotrophs in forest ecosystems [52,53]. The litter layer can act as a barrier against exchanges of CH4 between the atmosphere and the soil [2,12]. Therefore, the soil CH4 uptake increased in the LR treatment in our study. Similarly, the LD treatment significantly decreased the soil CH4 uptake by 34% in our study (Figure 4 and Figure 5b). Although previous studies have suggested that the CH4 uptake can also be consumed by the litter layer [2], litter layers in boreal forests have been suggested to have litter CH4 oxidation capacity [53].
The variations in CH4 fluxes were also significantly affected by the soil NH4+−N content, with a positive relationship between them (Figure 5b), which is similar to the findings of a previous study [54]. Indeed, a higher rate of soil N turnover could decrease CH4 oxidation because of the inhibitory effect on CH4 oxidation [55]. On the one hand, high NH4+−N content can promote soil CH4 production by enhancing the abundance of methanogens; one the other hand, it also can inhibit CH4 oxidation by competing for methane monooxygenase and thus decreases CH4 uptake [56,57].Therefore, the higher soil NH4+−N content explained the lower soil CH4 uptake in the LD treatment in our study. However, there was similar soil NH4+−N content between the LR and CK treatments. Thus, we also found stronger variations of CH4 fluxes in LD treatments than that in the LR treatment. The soil temperature, by affecting methanogenic and methanotrophic activities, was also one of the most important factors controlling soil CH4 fluxes in our study [58,59]. In our study, given that the larch soil is a net CH4 sink, high soil temperature can promote soil methanotrophic activities and ultimately enhance soil CH4 uptake. Therefore, the highest soil CH4 uptake rates were found in August, when there was a higher soil temperature among the three litter manipulation treatments (Figure 2a and Figure 4c). Meanwhile, the effects of soil temperature on soil CH4 fluxes are also affected by soil water content [60]. The highest soil temperature in July could not induce higher soil CH4 uptake rates mainly due to the higher soil water content in our study (Figure 2 and Figure 4c).
4.3. Effects of Litter Manipulation Treatments on Soil N2O Fluxes
There were significant effects of litter manipulation on the soil N2O fluxes during the observation period (Figure 4 and Table A1). Litter addition increased soil N2O fluxes by 34%, while litter removal decreased them by 21%, which is partially in line with other studies that found that soil N2O fluxes significantly decreased in LR but slightly increased in LD [61]. It has been suggested that soil N2O fluxes are primarily regulated by changes in the soil nutrients and microbes [38,62]. Denitrification under anaerobic conditions and nitrification under aerobic conditions are important pathways that produce N2O [9]. In the present study, higher soil NO3−−N content enhanced substrate availability, promoting soil N2O emissions in LD (Figure 4 and Figure 5c). Meanwhile, the lower soil NO3−−N content also significantly decreased soil N2O emissions in the LR treatment. This phenomenon suggested that denitrification may be the dominant process in this region [3,38].
Compared with CK, the response of soil N2O fluxes to LD treatment was stronger than that to LR. This result can be explained by the following reasons. First, soil NH4+−N content can affect soil N2O fluxes indirectly via its effect on soil NO3−−N content (Figure 5c). Moreover, soil N2O can be produced by nitrification using NH4+−N as substrate. Thus, high NH4+−N content may result in high soil N2O fluxes in LD. Second, the litter layer itself can also produce N2O, especially in the wet litter layer [63]. Meanwhile, LD can also enhance the anaerobic soil environment, where more soil N2O can be produced by denitrification. Thus, the thicker litter layer and its induced soil conditions would lead to higher soil N2O fluxes in the LD treatment. Although the LR treatment could also decrease soil N2O emissions due to the reduction in N2O production from the litter layer, the priming effect from the LD treatment could also enhance soil N2O production and emission in the litter layer in the LD treatment [64].
4.4. Limitations and Implications
Although soil GHG fluxes were strongly responsive to litter manipulation treatments, especially to LD treatment, in the present study, this does not mean that the soil GHG fluxes would reach the expected level with the increase in the litter layer over time in the future. There are still some limitations in our study. First, compared to previous studies, the 1 m × 1 m subplot was small, and edge effects may be likely [65]. Second, the study was conducted in only one grow season with a total of nine gas sampling events; the limitation of sampling strategy and relatively infrequent observations may miss or hit some episodic sporadic flux events, which may overestimate or underestimate the effects of litter on soil GHG fluxes to some extent. Third, in the present study, we explored only the short-term effects of litter manipulation on soil GHG fluxes. In the litter manipulation experiments, the responses of the soil GHG fluxes to plant litter alteration were also related to the experimental duration [46,66]. The long-term effects of plant litter inputs may differ from the short-term effects. In forest ecosystems, there is a long-term balance between litter decomposition and plant growth [67]. On the one hand, global warming affects primary productivity in forest ecosystems and, in turn, regulates the long-term litter and soil nutrient inputs [68]. However, warming can also accelerate litter decomposition. On the other hand, warming can also directly enhance soil CO2 and N2O emissions and CH4 uptake in larch soils. However, changes in precipitation distribution patterns, happening with warming, can also affect the responses of soil GHG fluxes to temperature. This may induce uncertainties of variations in forest soil GHG fluxes to litter input in the future.
Despite the limitations of experimental duration, our study also provided important evidence of the litter layer in regulating soil GHG fluxes in boreal forests. For litter addition, as shown in our study, there was high litter production at the end of growing season, which may have significant effects on soil GHG fluxes in the next growing season. Meanwhile, there were significant priming effects resulting from double litter in our study. Thus, long-term, sustained soil priming due to litter addition may play a vital role in regulating carbon and nitrogen cycling in larch forest ecosystems [28]. This result further demonstrates the necessity of litter research in the process of soil–atmosphere GHG exchange under continuous warming. Our future studies will also continue to explore the underlying driving mechanisms from long-term measurements.
5. Conclusions
Our study explored and quantified the significant effects of short-term litter manipulation treatments on soil GHG fluxes in a typical boreal larch forest. In particularly, LD treatment led to significant increases in all soil GHG fluxes. However, only soil CH4 and N2O fluxes were significantly affected by LR treatment. Meanwhile, short-term LD significantly increased the soil inorganic nitrogen and microbial biomass, whereas LR only decreased the soil NO3−−N content. In response to litter manipulation treatment, soil GHG fluxes were directly related to litter biomass and soil temperature. Moreover, soil MBC, NH4+−N, and NO3−−N content were also the main factors affecting CO2, CH4, and N2O fluxes, respectively. Our study highlights the significant effects of short-term litter manipulation treatments on soil GHG fluxes. Given that litter accumulates gradually over time in boreal regions and warming may further accelerate this process in the future, litter regimes, especially for more litter input, should be paid more attention in regulating soil GHG emissions and global climate change.
Author Contributions
Conceptualization, T.C. and X.M.; methodology, X.M.; software, B.D.; validation, T.C., X.M. and M.M.; investigation, R.X., B.D., Z.G. and M.G.; resources, T.C.; writing—original draft preparation, B.D. and R.X.; writing—review and editing, B.D. and R.X.; visualization, B.D.; supervision, T.C. and X.M.; project administration, T.C., B.D. and R.X. T.C., B.D. and R.X. contributed equally in this work and should be considered first co-authors. All authors have read and agreed to the published version of the manuscript.
Funding
This work was supported by the National Key R&D Program of China (No. 2021YFD2200405).
Data Availability Statement
The data is contained in the article.
Acknowledgments
We acknowledge the Mohe Forest Ecological Research Station for providing places for field studies. We also appreciate Xiaoming Wang for helping us with field studies. Thanks to the China Scholarship Council (202006600021).
Conflicts of Interest
The authors declare that they have no known competing financial interests or personal relationships that could have appeared to influence the work reported in this paper.
Appendix A

Figure A1.
Effect size of litter manipulation on the soil GHG fluxes during the study period. The effect size is the variation rate of the soil GHG fluxes in the LD and LR treatments, compared with the CK treatment. Lowercase letters represent significant differences in the effect size between the LD and the LR treatments for each individual gas. Litter manipulation treatment abbreviations: CK, unchanged litter input; LD, doubled litter; LR, litter removal.

Table A1.
Effect of litter manipulation, sampling date and their interactions on soil GHG fluxes, soil temperature (ST), soil water content (SWC), soil inorganic nitrogen, and soil microbial biomass based on the two-way ANOVA test (* p < 0.05; ** p < 0.01; n.s means not significant).
Table A1.
Effect of litter manipulation, sampling date and their interactions on soil GHG fluxes, soil temperature (ST), soil water content (SWC), soil inorganic nitrogen, and soil microbial biomass based on the two-way ANOVA test (* p < 0.05; ** p < 0.01; n.s means not significant).
| Source of Variation | CO2 | CH4 | N2O | ST | SWC | NH4+−N | NO3−−N | MBC | MBN |
|---|---|---|---|---|---|---|---|---|---|
| Treatment | ** | ** | ** | ** | ** | ** | ** | ** | ** |
| Sampling date | ** | ** | ** | ** | ** | ** | ** | ** | ** |
| Treatment × Sampling date | n.s | n.s | n.s | ** | n.s | n.s | * | ** | ** |
References
- FAO. Global Forests Resources Assessment 2010—Main Report; FAO: Rome, Italy, 2010; Volume 163, pp. 44–48. [Google Scholar]
- Wu, J.; Lu, M.; Feng, J.; Zhang, D.; Chen, Q.; Li, Q.; Long, C.; Zhang, Q.; Cheng, X. Soil net methane uptake rates in response to short-term litter input change in a coniferous forest ecosystem of central China. Agric. For. Meteorol. 2019, 271, 307–315. [Google Scholar] [CrossRef]
- Wu, X.; Zang, S.; Ma, D.; Ren, J.; Chen, Q.; Dong, X. Emissions of CO2, CH4, and N2O fluxes from forest soil in permafrost region of Daxing’an mountains, northeast China. Int. J. Environ. Res. Public Health 2019, 16, 2999. [Google Scholar] [CrossRef] [PubMed]
- Bond-Lamberty, B.; Thomson, A. Temperature-associated increases in the global soil respiration record. Nature 2010, 464, 579–582. [Google Scholar] [CrossRef] [PubMed]
- Ghosh, A.; Patra, P.K.; Ishijima, K.; Umezawa, T.; Ito, A.; Etheridge, D.M.; Sugawara, S.; Kawamura, K.; Miller, J.B.; Dlugokencky, E.J.; et al. Variations in global methane sources and sinks during 1910–2010. Atmos. Chem. Phys. 2015, 15, 2595–2612. [Google Scholar] [CrossRef]
- Wang, X.; Gao, S.; Chen, J.; Yao, Z.; Zhang, X. Reducing soil CO2, CH4, and N2O emissions through management of harvest residues in Chinese fir plantation. For. Ecol. Manag. 2022, 511, 120140. [Google Scholar] [CrossRef]
- Gong, Y.; Wu, J.; Vogt, J.; Le, T.B. Warming reduces the increase in N2O emission under nitrogen fertilization in a boreal peatland. Sci. Total Environ. 2019, 664, 72–78. [Google Scholar] [CrossRef]
- Yue, K.; Fornara, D.A.; Yang, W.; Peng, Y.; Peng, C.; Liu, Z.; Wu, F. Influence of multiple global change drivers on terrestrial carbon storage: Additive effects are common. Ecol. Lett. 2017, 20, 663–672. [Google Scholar] [CrossRef]
- Oertel, C.; Matschullat, J.; Zurba, K.; Zimmermann, F.; Erasmi, S. Greenhouse gas emissions from soils—A review. Geochemistry 2016, 76, 327–352. [Google Scholar] [CrossRef]
- Osborne, B.B.; Nasto, M.K.; Soper, F.M.; Asner, G.P.; Balzotti, C.S.; Cleveland, C.C.; Taylor, P.G.; Townsend, A.R.; Porder, S. Leaf litter inputs reinforce islands of nitrogen fertility in a lowland tropical forest. Biogeochemistry 2020, 147, 293–306. [Google Scholar] [CrossRef]
- Wang, M.; Tian, Q.; Liao, C.; Zhao, R.; Wang, D.; Wu, Y.; Li, Q.; Wang, X.; Liu, F. The fate of litter-derived dissolved organic carbon in forest soils: Results from an incubation experiment. Biogeochemistry 2019, 144, 133–147. [Google Scholar] [CrossRef]
- Leitner, S.; Sae-Tun, O.; Kranzinger, L.; Zechmeister-Boltenstern, S.; Zimmermann, M. Contribution of litter layer to soil greenhouse gas emissions in a temperate beech forest. Plant Soil 2016, 403, 455–469. [Google Scholar] [CrossRef]
- Fang, X.; Zhao, L.; Zhou, G.; Huang, W.; Liu, J. Increased litter input increases litter decomposition and soil respiration but has minor effects on soil organic carbon in subtropical forests. Plant Soil 2015, 392, 139–153. [Google Scholar] [CrossRef]
- Wieder, W.R.; Cleveland, C.C.; Townsend, A.R. Throughfall exclusion and leaf litter addition drive higher rates of soil nitrous oxide emissions from a lowland wet tropical forest. Glob. Change Biol. 2011, 17, 3195–3207. [Google Scholar] [CrossRef]
- Hamer, U.; Marschner, B. Priming effects in different soil types induced by fructose, alanine, oxalic acid and catechol additions. Soil Biol. Biochem. 2005, 37, 445–454. [Google Scholar] [CrossRef]
- Chi, J.; Nilsson, M.; Wallerman, J.; Fransson, J.; Kljun, N.; Lindroth, A.; Laudon, H.; Lundmark, T.; Peichl, M. The greenhouse gas balance of a managed boreal landscape measured from a tall tower in northern Sweden. Geophys. Res. Abstr. 2018, 20, 15839. [Google Scholar]
- Pihlatie, M.; Pumpanen, J.; Rinne, J.; Ilvesniemi, H.; Simojoki, A.; Hari, P.; Vesala, T. Gas concentration driven fluxes of nitrous oxide and carbon dioxide in boreal forest soil. Tellus B Chem. Phys. Meteorol. 2007, 59, 458–469. [Google Scholar] [CrossRef]
- Wolf, K.; Flessa, H.; Veldkamp, E. Atmospheric methane uptake by tropical montane forest soils and the contribution of organic layers. Biogeochemistry 2012, 111, 469–483. [Google Scholar] [CrossRef]
- Gao, J.; Zhou, W.; Liu, Y.; Zhu, J.; Sha, L.; Song, Q.; Ji, H.; Lin, Y.; Fei, X.; Bai, X.; et al. Effects of litter inputs on N2O emissions from a tropical rainforest in southwest China. Ecosystems 2017, 21, 1013–1026. [Google Scholar] [CrossRef]
- Chen, Q.; Long, C.; Chen, J.; Cheng, X. Differential response of soil CO2, CH4, and N2O emissions to edaphic properties and microbial attributes following afforestation in central China. Glob. Change Biol. 2021, 27, 5657–5669. [Google Scholar] [CrossRef]
- Yue, P.; Cui, X.; Gong, Y.; Li, K.; Goulding, K.; Liu, X. Fluxes of N2O, CH4 and soil respiration as affected by water and nitrogen addition in a temperate desert. Geoderma 2019, 337, 770–772. [Google Scholar] [CrossRef]
- Wang, Y.; Wang, H.; Ma, Z.; Dai, X.; Wen, X.; Liu, Y.; Wang, Z.-L. The litter layer acts as a moisture-induced bidirectional buffer for atmospheric methane uptake by soil of a subtropical pine plantation. Soil Biol. Biochem. 2013, 66, 45–50. [Google Scholar] [CrossRef]
- Trivedi, P.; Delgado-Baquerizo, M.; Jeffries, T.C.; Trivedi, C.; Anderson, I.C.; Lai, K.; McNee, M.; Flower, K.; Pal Singh, B.; Minkey, D.; et al. Soil aggregation and associated microbial communities modify the impact of agricultural management on carbon content. Environ. Microbiol. 2017, 19, 3070–3086. [Google Scholar] [CrossRef] [PubMed]
- Bhatti, J.; Jassal, R.; Black, T.A. Decarbonization of the atmosphere: Role of the boreal forest under changing climate. In Recarbonization of the Biosphere; Springer: Dordrecht, The Netherlands, 2012; pp. 203–228. [Google Scholar]
- IPCC. Climate change 2013: The physical science basis. In Contribution of Working Group I to the Fifth Assessment Report of the Intergovernmental Panel on Climate Change; Cambridge University Press: Cambridge, UK; New York, NY, USA, 2013; p. 1535. [Google Scholar]
- Harden, J.W.; Koven, C.D.; Ping, C.L.; Hugelius, G.; David McGuire, A.; Camill, P.; Jorgenson, T.; Kuhry, P.; Michaelson, G.J.; O’Donnell, J.A.; et al. Field information links permafrost carbon to physical vulnerabilities of thawing. Geophys. Res. Lett. 2012, 39, L15704. [Google Scholar] [CrossRef]
- Pi, K.; Bieroza, M.; Brouchkov, A.; Chen, W.; Dufour, L.J.P.; Gongalsky, K.B.; Herrmann, A.M.; Krab, E.J.; Landesman, C.; Laverman, A.M.; et al. The cold region critical zone in transition: Responses to climate warming and land use change. Annu. Rev. Environ. Resour. 2021, 46, 111–134. [Google Scholar] [CrossRef]
- Man, M.; Pierson, D.; Chiu, R.; Tabatabaei Anaraki, M.; van den Enden, L.; Ye, R.; Lajtha, K.; Simpson, M.J. Twenty years of litter manipulation reveals that above-ground litter quantity and quality controls soil organic matter molecular composition. Biogeochemistry 2022, 159, 393–411. [Google Scholar] [CrossRef]
- Yang, G.; Di, X.; Guo, Q.; Shu, Z.; Zeng, T.; Yu, H.; Wang, C. The impact of climate change on forest fire danger rating in China’s boreal forest. J. For. Res. 2011, 22, 249–257. [Google Scholar] [CrossRef]
- Xiao, R.; Man, X.; Duan, B. Carbon and nitrogen stocks in three types of Larix gmelinii forests in Daxing’an mountains, Northeast China. Forests 2020, 11, 305. [Google Scholar] [CrossRef]
- Zhao, P. Studies on Litterfall Dynamics and Nutrient Release Regularity of Larix gmelinii in Greet Xingan Mountains. Master’s Thesis, Inner Mongolia Agricultural University, Hohhot, China, 2009. [Google Scholar]
- Wang, F.; Ye, D.; Liu, H.; Zhang, Q. Understory vegetation biomass allocation features of Larix gmelinii in different growth stages. J. Northwest For. Univ. 2016, 31, 30–33. [Google Scholar]
- Xiao, R.; Man, X.; Duan, B.; Cai, T. Short-term litter manipulations have strong impact on soil nitrogen dynamics in Larix gmelinii forest of Northeast China. Forests 2020, 11, 1205. [Google Scholar] [CrossRef]
- Sun, F.; Yuan, J.; Lu, S. The change and test of climate in northeast China over the last 100 years. Clim. Environ. Res. 2006, 11, 101–108. [Google Scholar]
- Wang, X.; Zhao, C.; Jia, Q. Impacts of climate change on forest ecosystems in northeast China. Adv. Clim. Change Res. 2013, 4, 230–241. [Google Scholar]
- Alster, C.J.; Allison, S.D.; Treseder, K.K. Carbon budgets for soil and plants respond to long-term warming in an Alaskan boreal forest. Biogeochemistry 2020, 150, 345–353. [Google Scholar] [CrossRef]
- Babst, F.; Esper, J.; Parlow, E. Landsat tm/etm+ and tree-ring based assessment of spatiotemporal patterns of the autumnal moth (Epirrita autumnata) in northernmost Fennoscandia. Remote Sens. Environ. 2010, 114, 637–646. [Google Scholar] [CrossRef]
- Gao, W.; Yao, Y.; Liang, H.; Song, L.; Sheng, H.; Cai, T.; Gao, D. Emissions of nitrous oxide from continuous permafrost region in the Daxing’an mountains, northeast China. Atmos. Environ. 2019, 198, 34–45. [Google Scholar] [CrossRef]
- Duan, B.; Cai, T.; Man, X.; Xiao, R.; Gao, M.; Ge, Z.; Mencuccini, M. Different variations in soil CO2, CH4, and N2O fluxes and their responses to edaphic factors along a boreal secondary forest successional trajectory. Sci. Total Environ. 2022, 838, 155983. [Google Scholar] [CrossRef]
- Vance, E.D.; Brookes, P.C.; Jenkinson, D.S. An extraction method for measuring soil microbial biomass C. Soil Biol. Biochem. 1987, 19, 703–707. [Google Scholar] [CrossRef]
- Jiang, L.; Yue, K.; Yang, Y.; Wu, Q. Leaching and freeze-thaw events contribute to litter decomposition—A review. Sains Malays. 2016, 45, 1041–1047. [Google Scholar]
- Aminiyan, M.M.; Hosseini, H.; Heydariyan, A. Microbial communities and their characteristics in a soil amended by nanozeolite and some plant residues: Short time in-situ incubation. Eurasian J. Soil Sci. 2018, 7, 9–19. [Google Scholar] [CrossRef][Green Version]
- Zhang, Y.J.; Junliang, Z.; Siwen, X.; Shuina, D.; Osborne, B.; Yuanyuan, R.; Ting, L.; Keke, Y. Effects of litter inputs on soil respiration: A meta-analysis. Authorea 2020, 20, 4369. [Google Scholar] [CrossRef]
- Gong, C.; Song, C.; Zhang, D.; Zhang, J. Litter manipulation strongly affects CO2 emissions and temperature sensitivity in a temperate freshwater marsh of northeastern China. Ecol. Indic. 2019, 97, 410–418. [Google Scholar] [CrossRef]
- Peng, Q.; Dong, Y.; Qi, Y.; Xiao, S.; He, Y.; Ma, T. Effects of nitrogen fertilization on soil respiration in temperate grassland in Inner Mongolia, China. Environ. Earth Sci. 2010, 62, 1163–1171. [Google Scholar] [CrossRef]
- Liu, X.; Lin, T.-C.; Yang, Z.; Vadeboncoeur, M.A.; Lin, C.; Xiong, D.; Lin, W.; Chen, G.; Xie, J.; Li, Y.; et al. Increased litter in subtropical forests boosts soil respiration in natural forests but not plantations of Castanopsis carlesii. Plant Soil 2017, 418, 141–151. [Google Scholar] [CrossRef]
- Wu, J.; Zhang, Q.; Yang, F.; Yao, L.; Zhang, Q.; Cheng, X. Does short-term litter input manipulation affect soil respiration and its carbon-isotopic signature in a coniferous forest ecosystem of central China? Appl. Soil Ecol. 2017, 113, 45–53. [Google Scholar] [CrossRef]
- Sun, B.; Hallett, P.D.; Caul, S.; Daniell, T.J.; Hopkins, D.W. Distribution of soil carbon and microbial biomass in arable soils under different tillage regimes. Plant Soil 2010, 338, 17–25. [Google Scholar] [CrossRef]
- Aerts, R. The freezer defrosting: Global warming and litter decomposition rates in cold biomes. J. Ecol. 2006, 94, 713–724. [Google Scholar] [CrossRef]
- Kuzyakov, Y. Priming effects: Interactions between living and dead organic matter. Soil Biol. Biochem. 2010, 42, 1363–1371. [Google Scholar] [CrossRef]
- Wei, H.; Man, X. Increased litter greatly enhancing soil respiration in Betula platyphylla forests of permafrost region, northeast China. Forests 2021, 12, 89. [Google Scholar] [CrossRef]
- Brumme, R.; Borken, W. Site variation in methane oxidation as affected by atmospheric deposition and type of temperate forest ecosystem. Glob. Biogeochem. Cycles 1999, 13, 493–501. [Google Scholar] [CrossRef]
- Saari, A.; Heiskanen, J.; Martikainen, P.J. Effect of the organic horizon on methane oxidation and uptake in soil of a boreal Scots pine forest. FEMS Microbiol. Ecol. 1998, 26, 245–255. [Google Scholar] [CrossRef]
- Li, Y.; Dong, S.; Liu, S.; Zhou, H.; Gao, Q.; Cao, G.; Wang, X.; Su, X.; Zhang, Y.; Tang, L.; et al. Seasonal changes of CO2, CH4 and N2O fluxes in different types of alpine grassland in the Qinghai-Tibetan plateau of China. Soil Biol. Biochem. 2015, 80, 306–314. [Google Scholar] [CrossRef]
- Hütsch, B.W. Tillage and land use effects on methane oxidation rates and their vertical profiles in soil. Biol. Fertil. Soils 1998, 27, 284–292. [Google Scholar] [CrossRef]
- Kuzyakov, Y.; Xu, X. Competition between roots and microorganisms for nitrogen: Mechanisms and ecological relevance. New Phytol 2013, 198, 656–669. [Google Scholar] [CrossRef]
- Bédard, C.; Knowles, R. Physiology, biochemistry, and specific inhibitors of CH4, NH4+, and CO oxidation by methanotrophs and nitrifiers. Microbiol. Rev. 1989, 53, 68–84. [Google Scholar] [CrossRef]
- Malyan, S.K.; Bhatia, A.; Kumar, A.; Gupta, D.K.; Singh, R.; Kumar, S.S.; Tomer, R.; Kumar, O.; Jain, N. Methane production, oxidation and mitigation: A mechanistic understanding and comprehensive evaluation of influencing factors. Sci. Total Environ. 2016, 572, 874–896. [Google Scholar] [CrossRef]
- Luo, G.J.; Kiese, R.; Wolf, B.; Butterbach-Bahl, K. Effects of soil temperature and moisture on methane uptake and nitrous oxide emissions across three different ecosystem types. Biogeosciences 2013, 10, 3205–3219. [Google Scholar] [CrossRef]
- Song, Y.; Song, C.; Hou, A.; Sun, L.; Wang, X.; Ma, X.; Jiang, L.; Liu, C.; Gao, J. Temperature, soil moisture, and microbial controls on CO2 and CH4 emissions from a permafrost peatland. Environ. Prog. Sustain. Energy 2021, 40, e13693. [Google Scholar] [CrossRef]
- Jiang, J.; Wang, Y.-P.; Zhang, H.; Yu, M.; Liu, F.; Xia, S.; Yan, J. Contribution of litter layer to greenhouse gas fluxes between atmosphere and soil varies with forest succession. Forests 2022, 13, 544. [Google Scholar] [CrossRef]
- Xu, L.; Deng, X.; Ying, J.; Zhou, G.; Shi, Y. Silicate fertilizer application reduces soil greenhouse gas emissions in a Moso bamboo forest. Sci. Total Environ. 2020, 747, 141380. [Google Scholar] [CrossRef]
- Dong, Y.; Scharffe, D.; Lobert, J.M.; Crutzen, P.J.; Sanhueza, E. Fluxes of CO2, CH4 and N2O from a temperate forest soil: The effects of leaves and humus layers. Tellus 1998, 50, 243–252. [Google Scholar] [CrossRef]
- Rothstein, D.E. Spring ephemeral herbs and nitrogen cycling in a northern hardwood forest: An experimental test of the vernal dam hypothesis. Oecologia 2000, 124, 446–453. [Google Scholar] [CrossRef]
- Fang, X.-M.; Wang, G.G.; Xu, Z.-J.; Zong, Y.-Y.; Zhang, X.-L.; Li, J.-J.; Wang, H.; Chen, F.-S. Litter addition and understory removal influenced soil organic carbon quality and mineral nitrogen supply in a subtropical plantation forest. Plant Soil 2021, 460, 527–540. [Google Scholar] [CrossRef]
- Chen, X.; Chen, H.Y.H. Global effects of plant litter alterations on soil CO2 to the atmosphere. Glob. Change Biol. 2018, 24, 3462–3471. [Google Scholar] [CrossRef] [PubMed]
- Eppinga, M.B.; Baudena, M.; Johnson, D.J.; Jiang, J.; Mack, K.M.L.; Strand, A.E.; Bever, J.D. Frequency-dependent feedback constrains plant community coexistence. Nat. Ecol. Evol. 2018, 2, 1403–1407. [Google Scholar] [CrossRef] [PubMed]
- Brechet, L.M.; Lopez-Sangil, L.; George, C.; Birkett, A.J.; Baxendale, C.; Castro Trujillo, B.; Sayer, E.J. Distinct responses of soil respiration to experimental litter manipulation in temperate woodland and tropical forest. Ecol. Evol. 2018, 8, 3787–3796. [Google Scholar] [CrossRef]


Publisher’s Note: MDPI stays neutral with regard to jurisdictional claims in published maps and institutional affiliations. |
© 2022 by the authors. Licensee MDPI, Basel, Switzerland. This article is an open access article distributed under the terms and conditions of the Creative Commons Attribution (CC BY) license (https://creativecommons.org/licenses/by/4.0/).