
Mechanical Property Prediction of Larix gmelinii Wood Based on Vis-Near-Infrared Spectroscopy

Abstract
:1. Introduction
2. Material and Methods
2.1. Wood Sample Collection
2.2. Visible-Near-Infrared Spectra Collection
2.3. Modeling and Optimization
2.3.1. Spectral Preprocessing and Band Optimization
2.3.2. Modeling Methods and Model Evaluation
3. Results
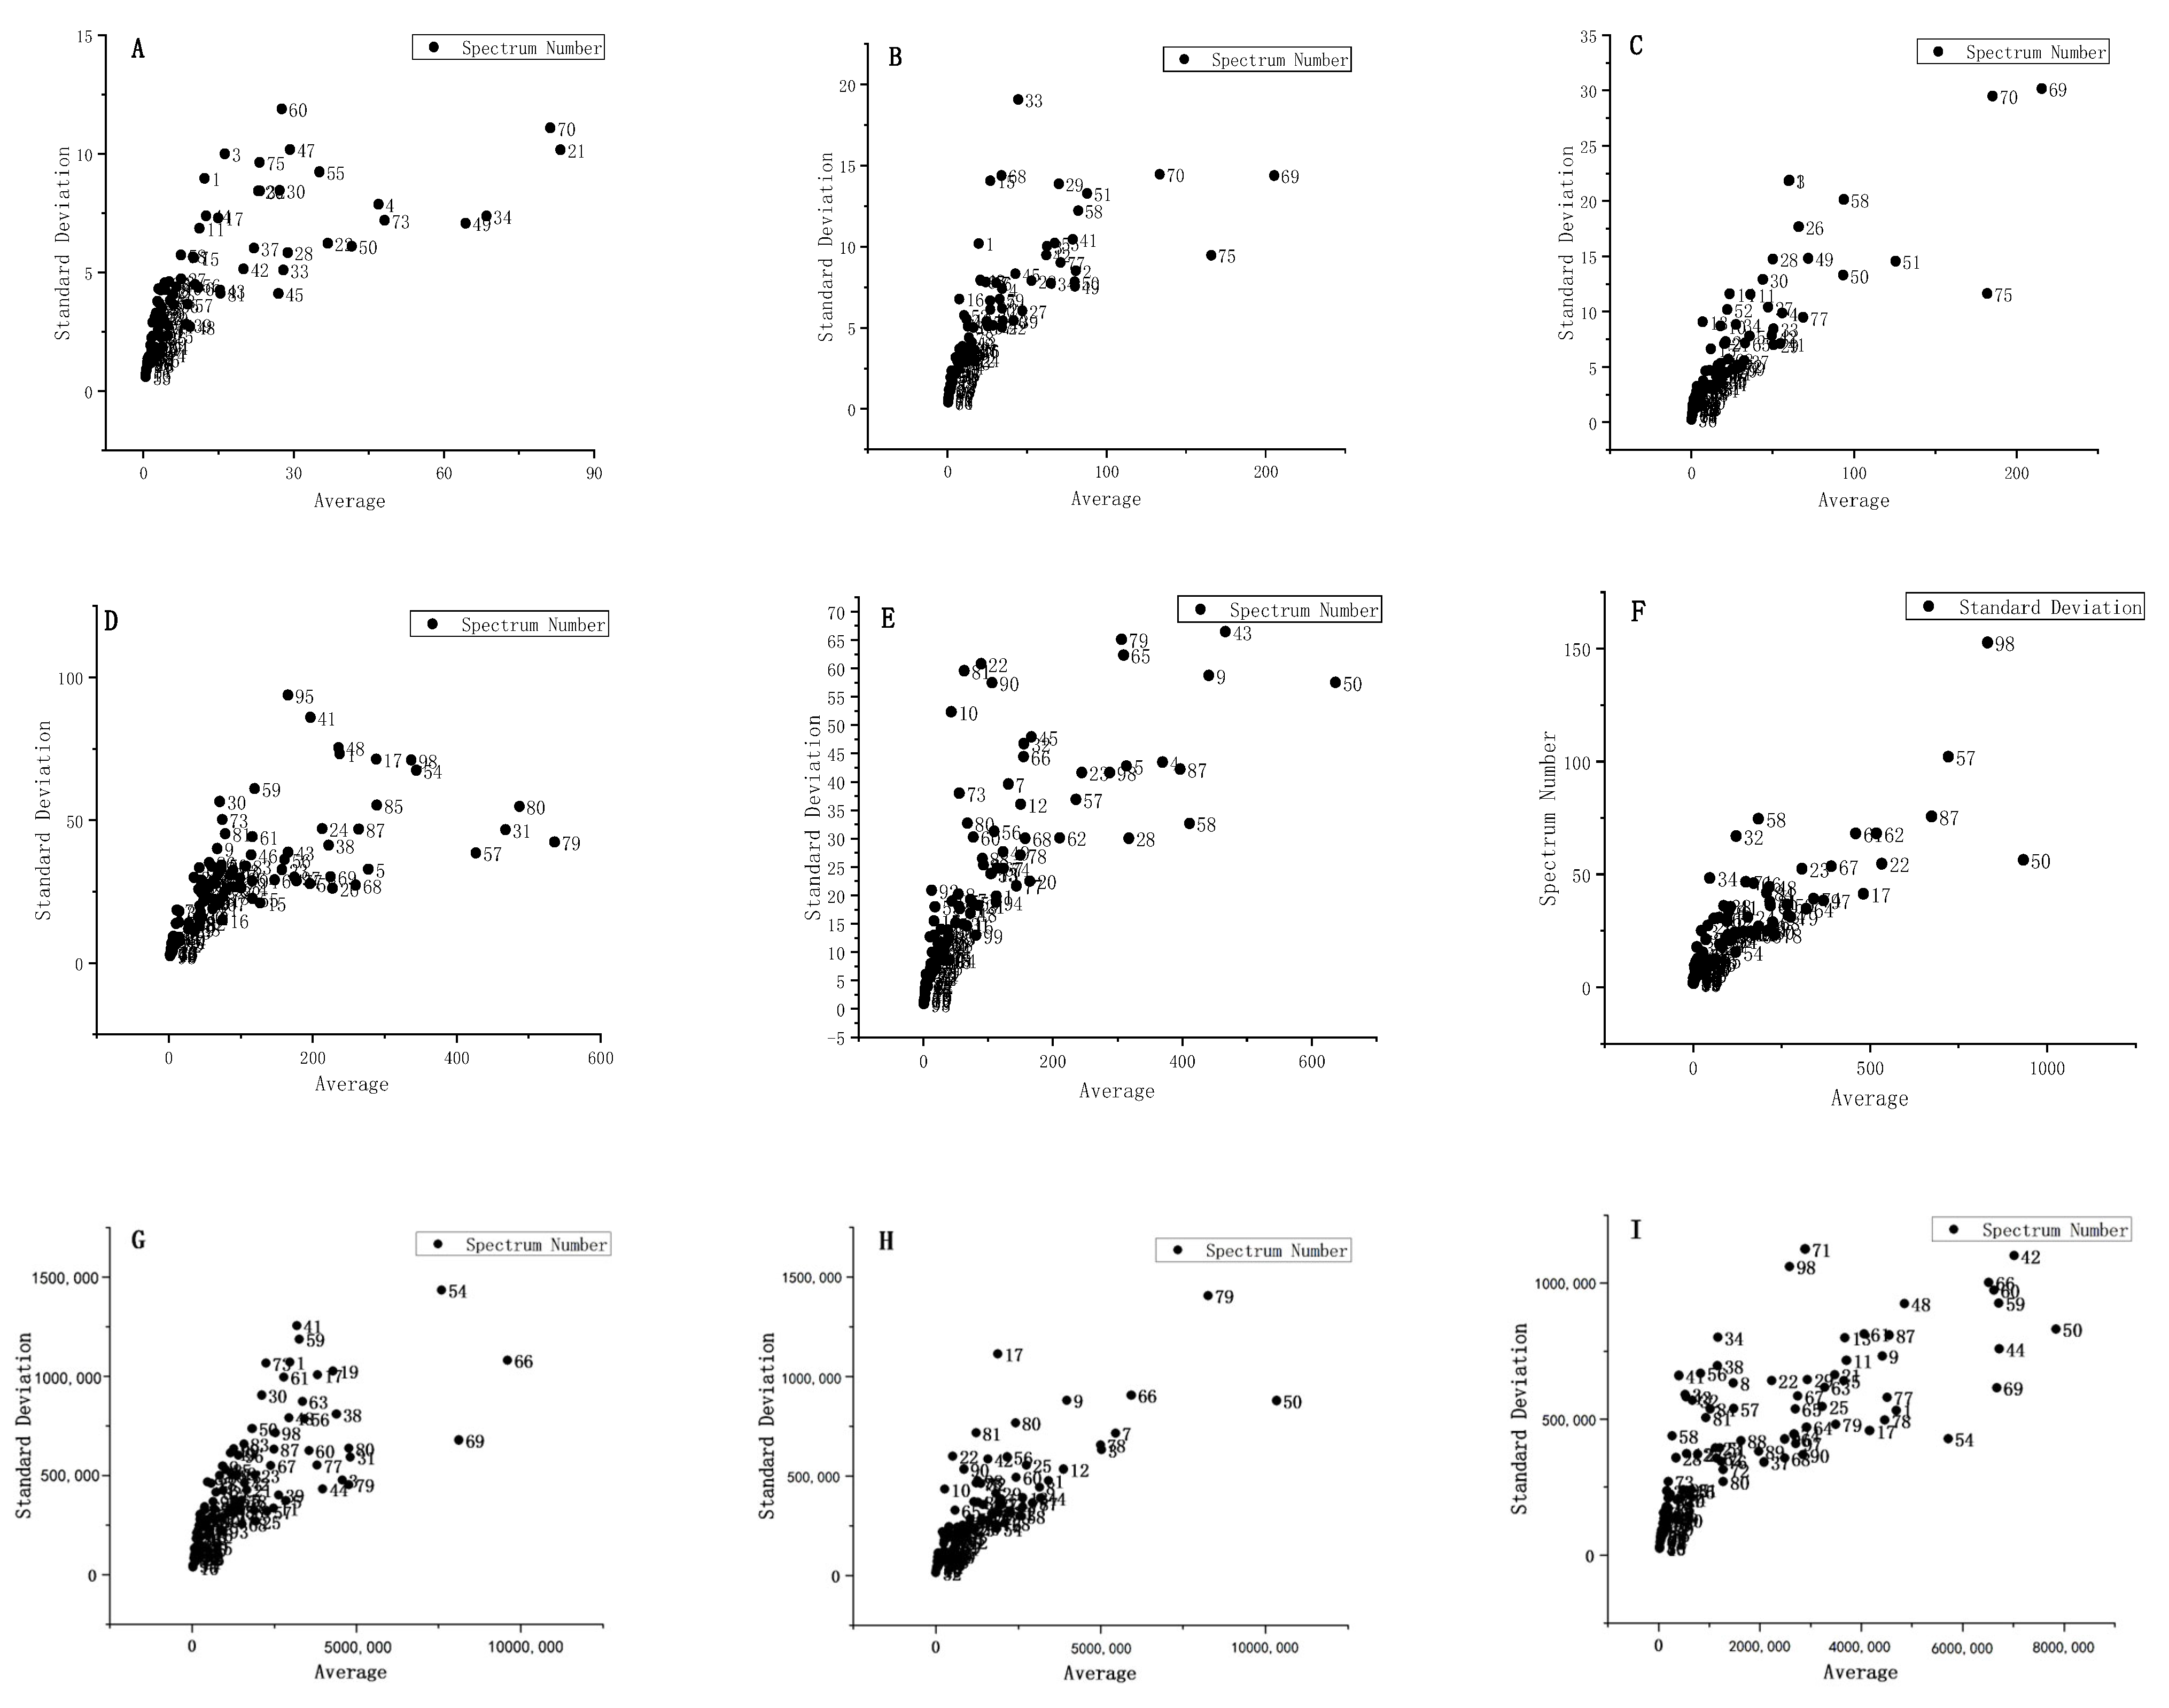
3.1. Screening of Singular Samples
3.2. Partition of Sample Sets
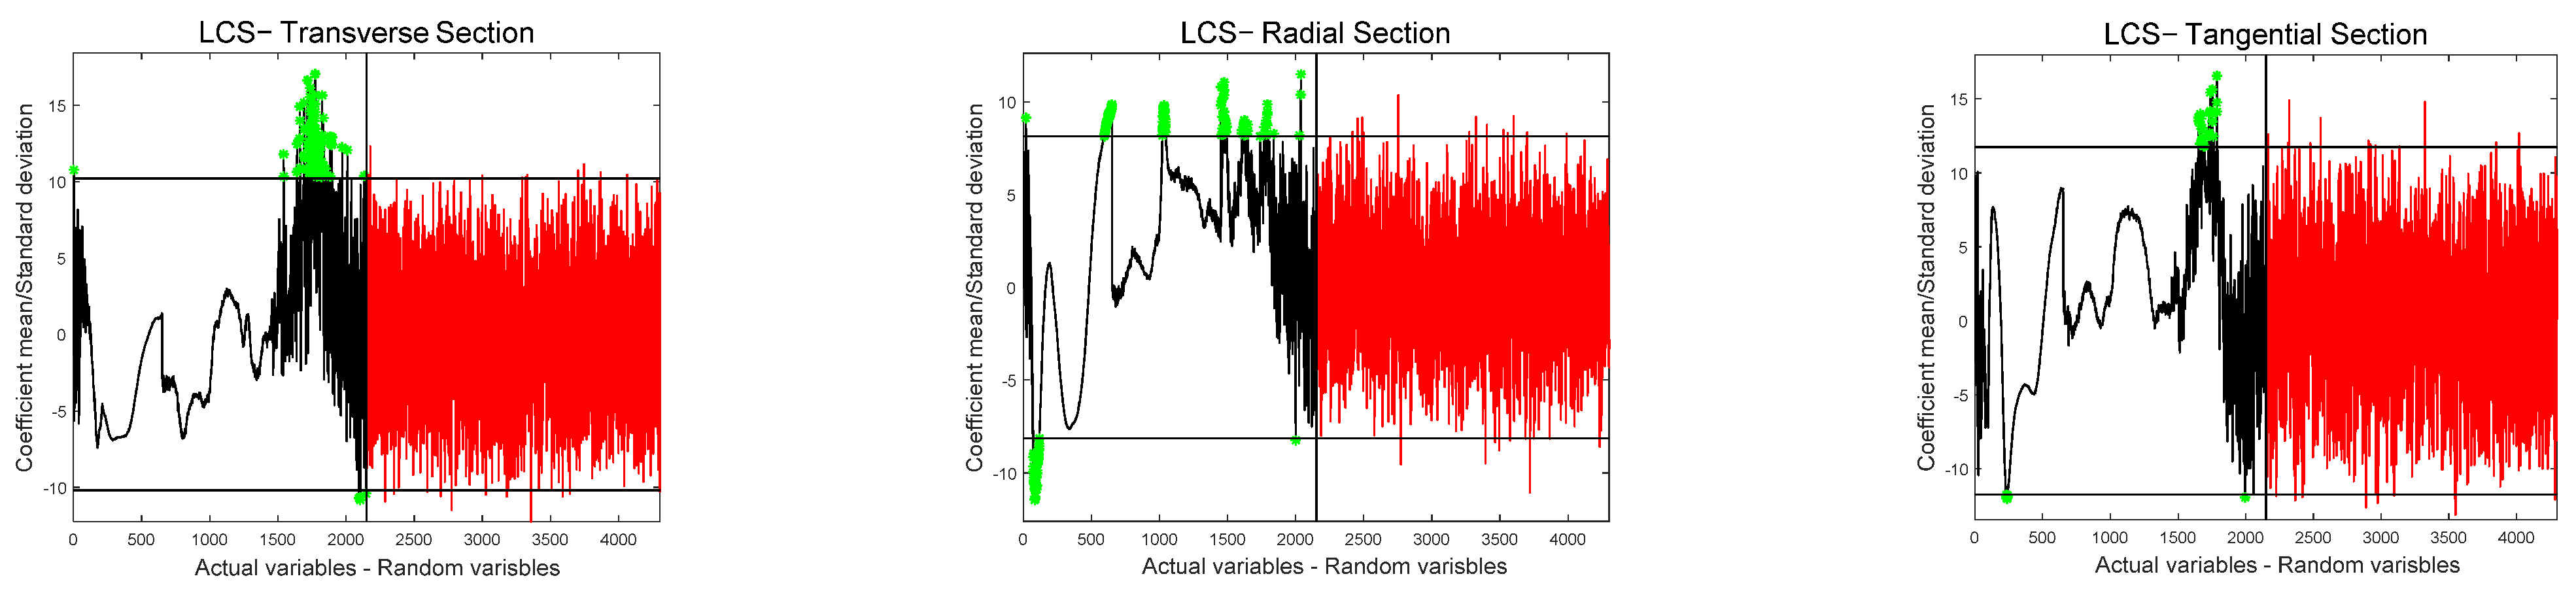
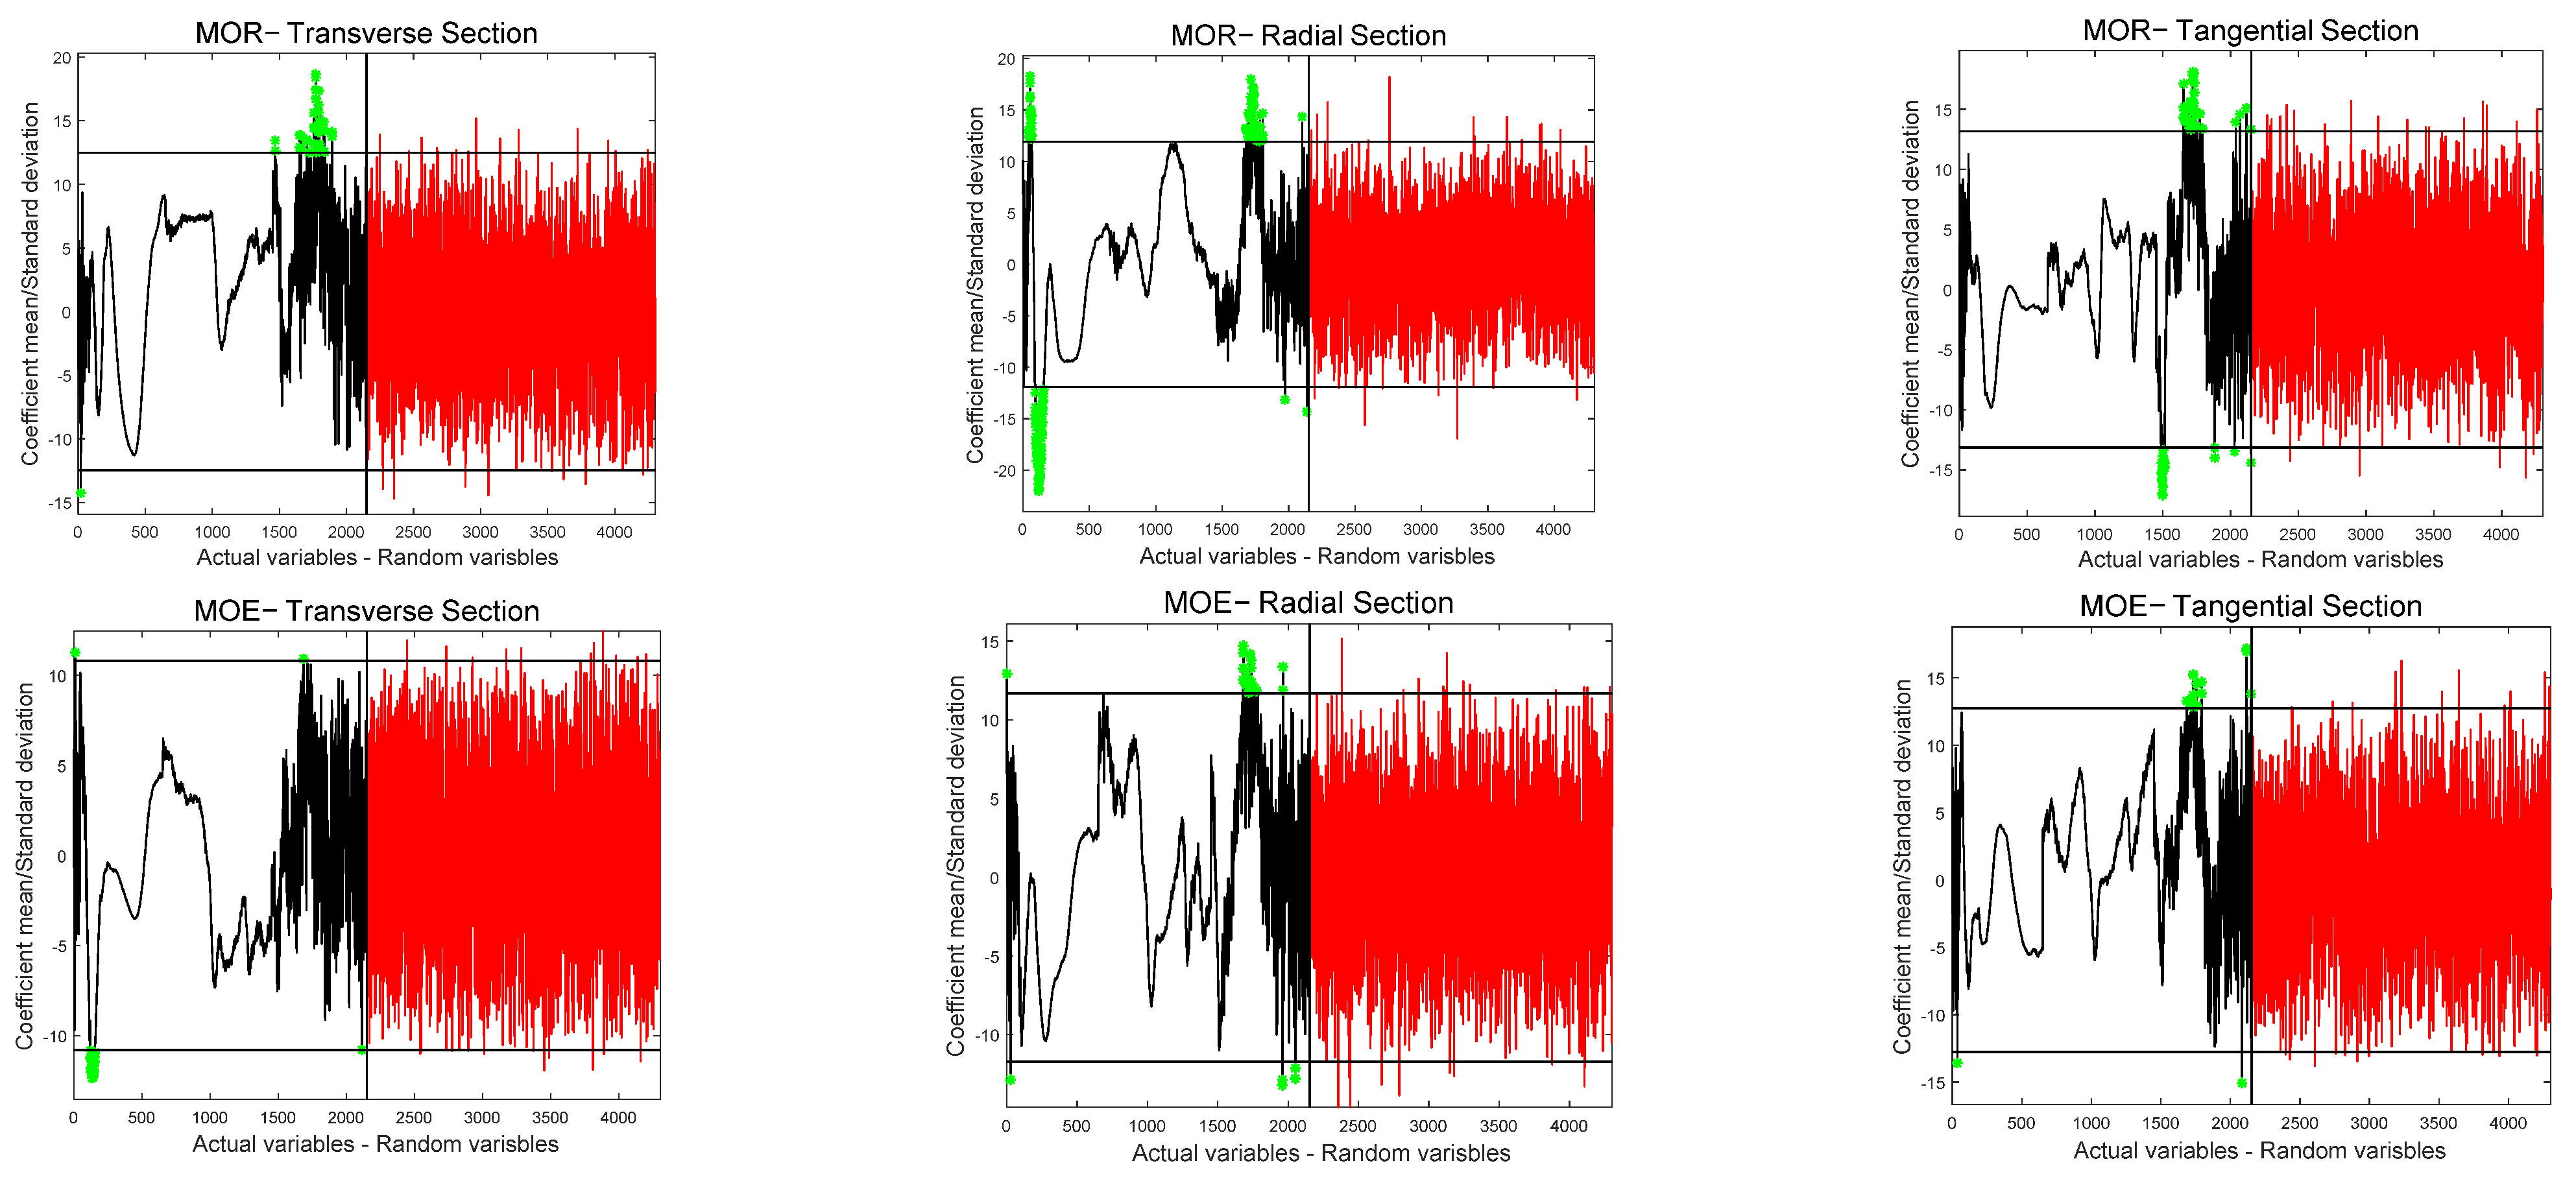
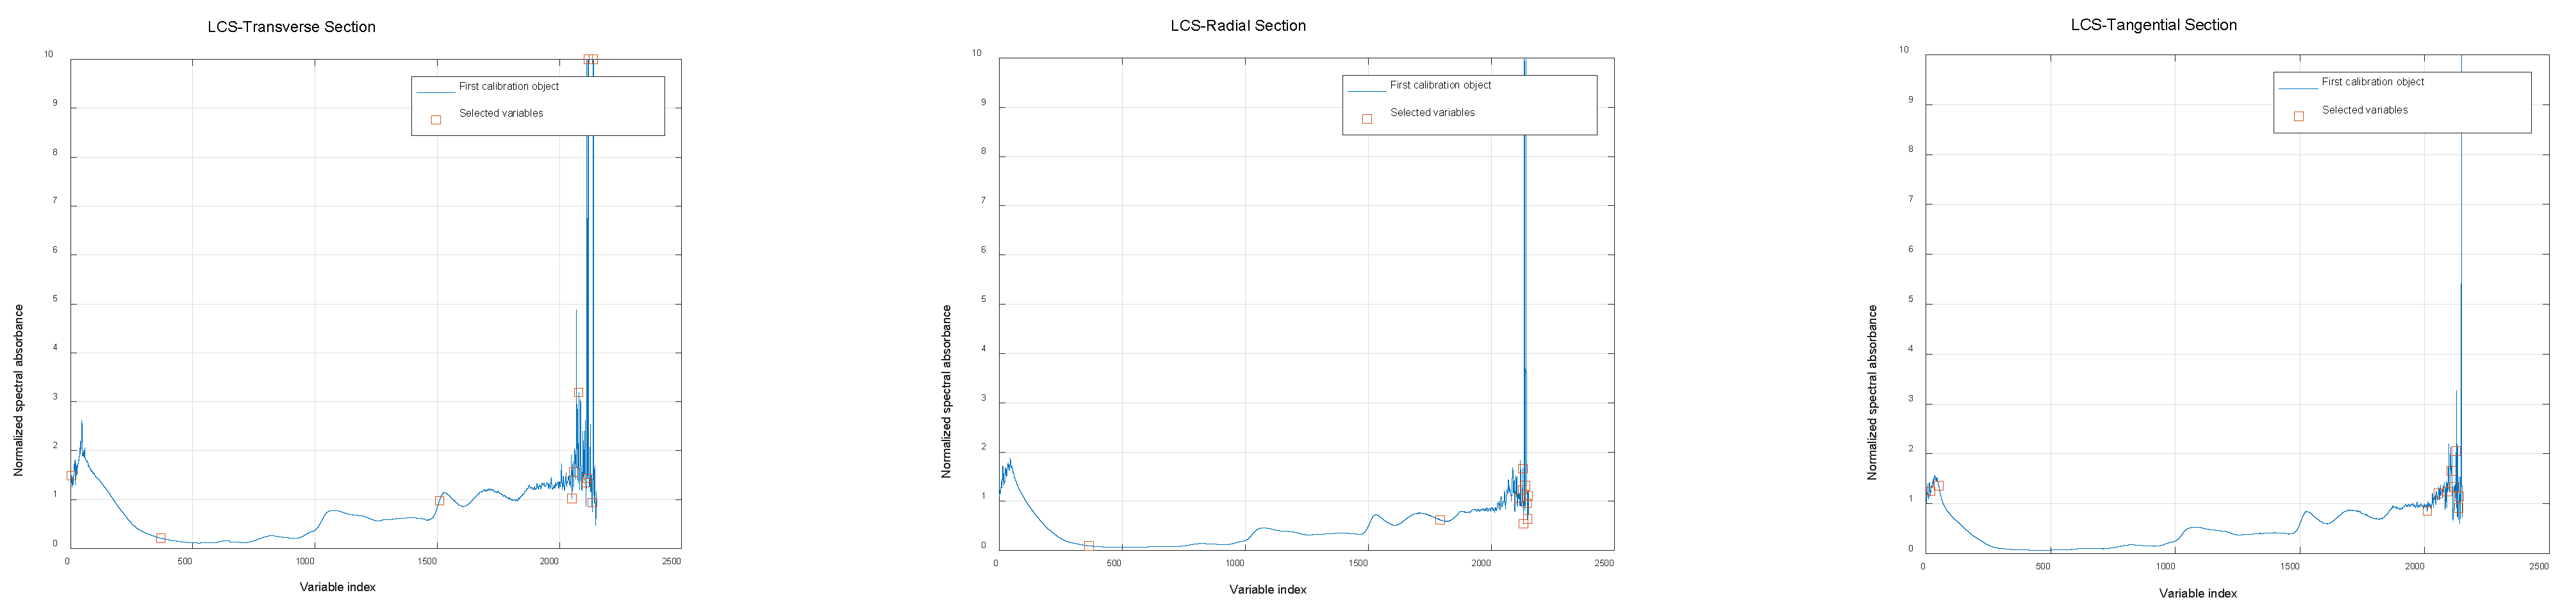
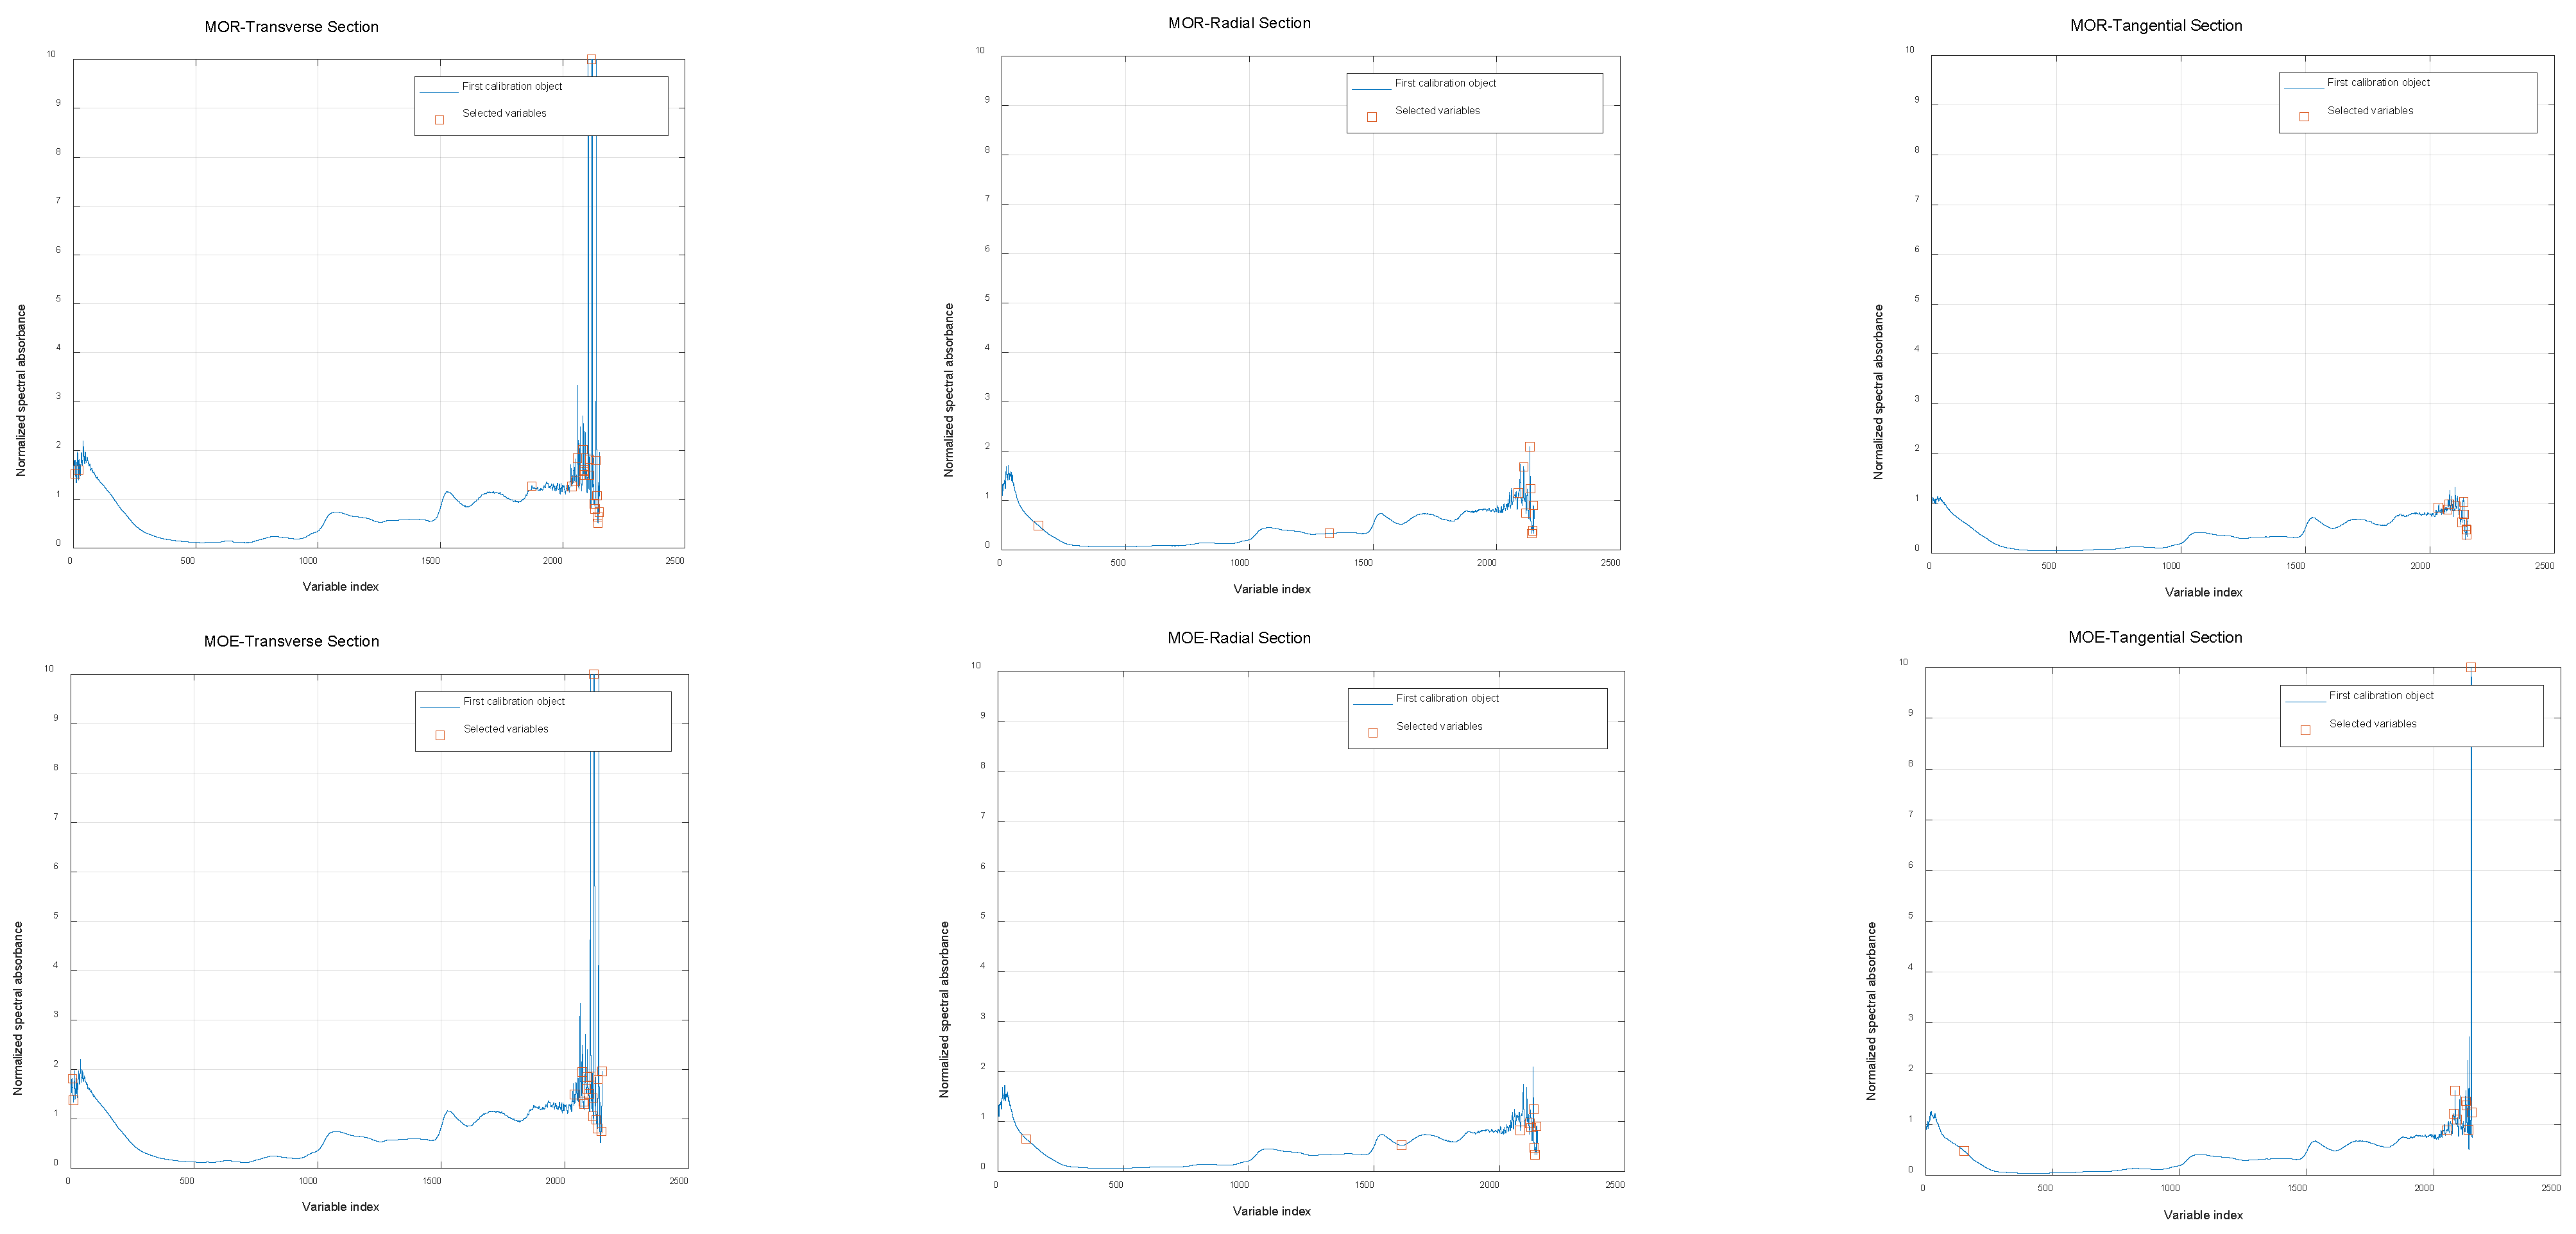
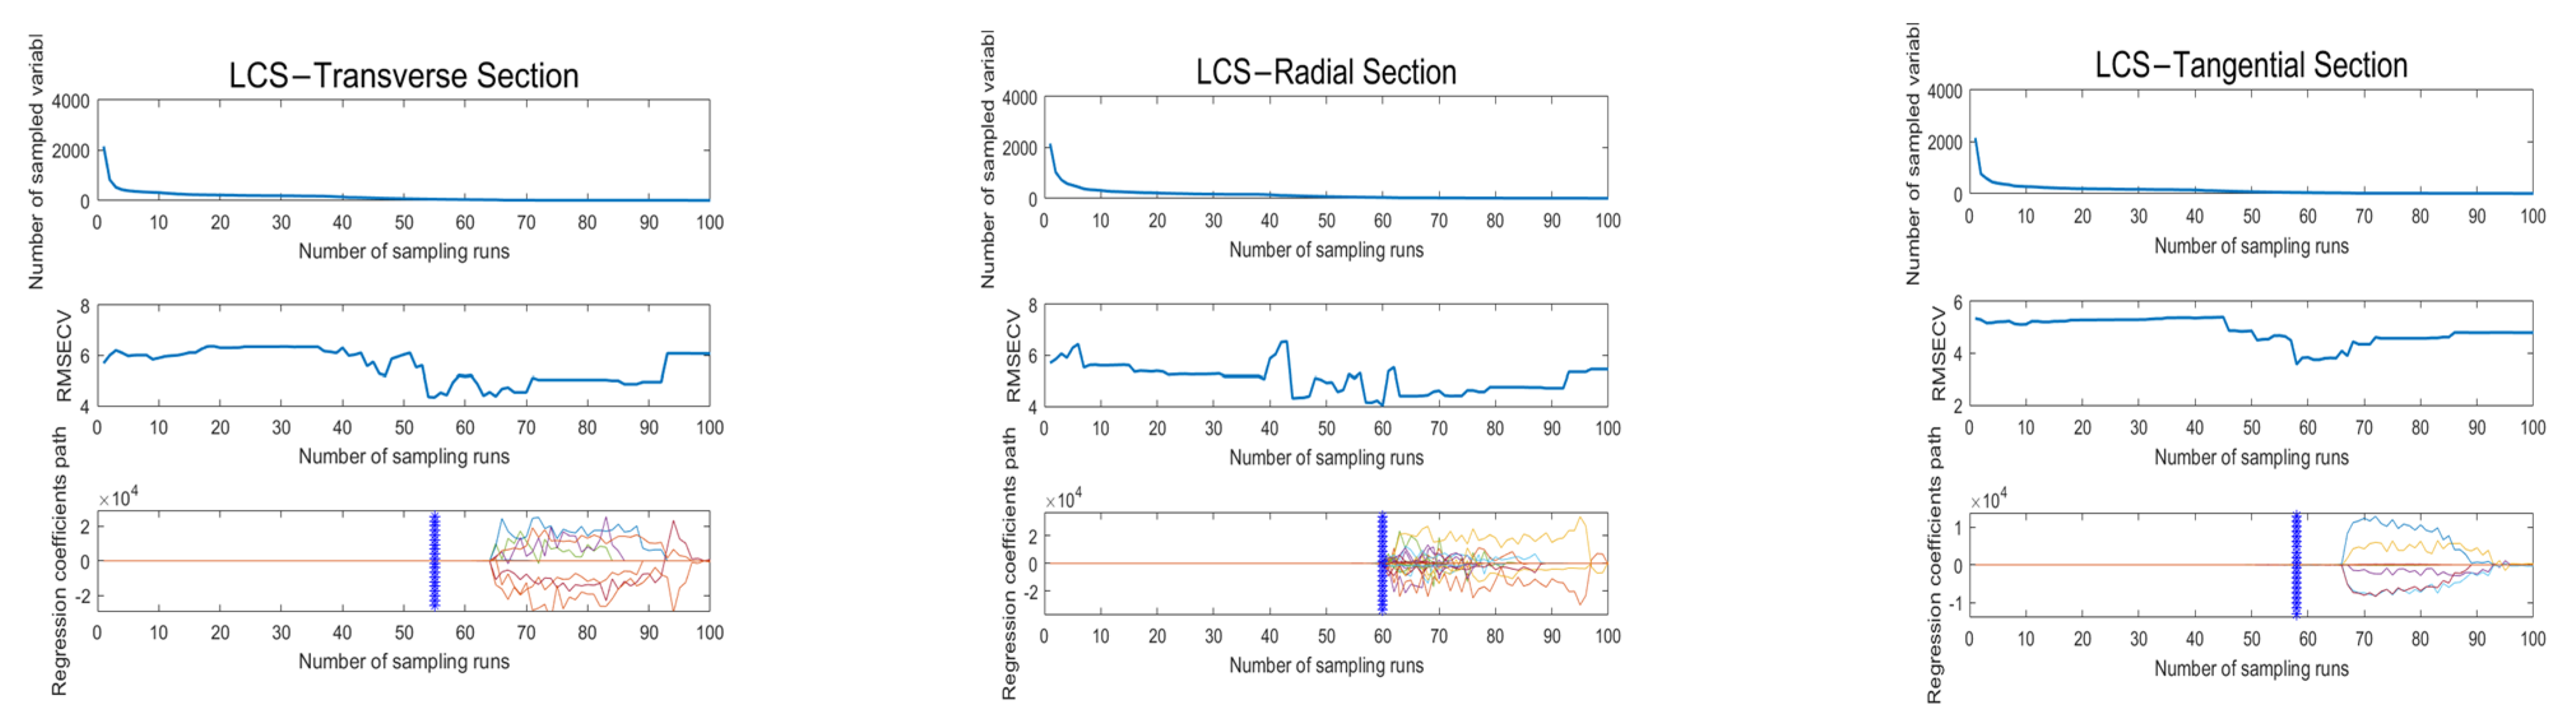
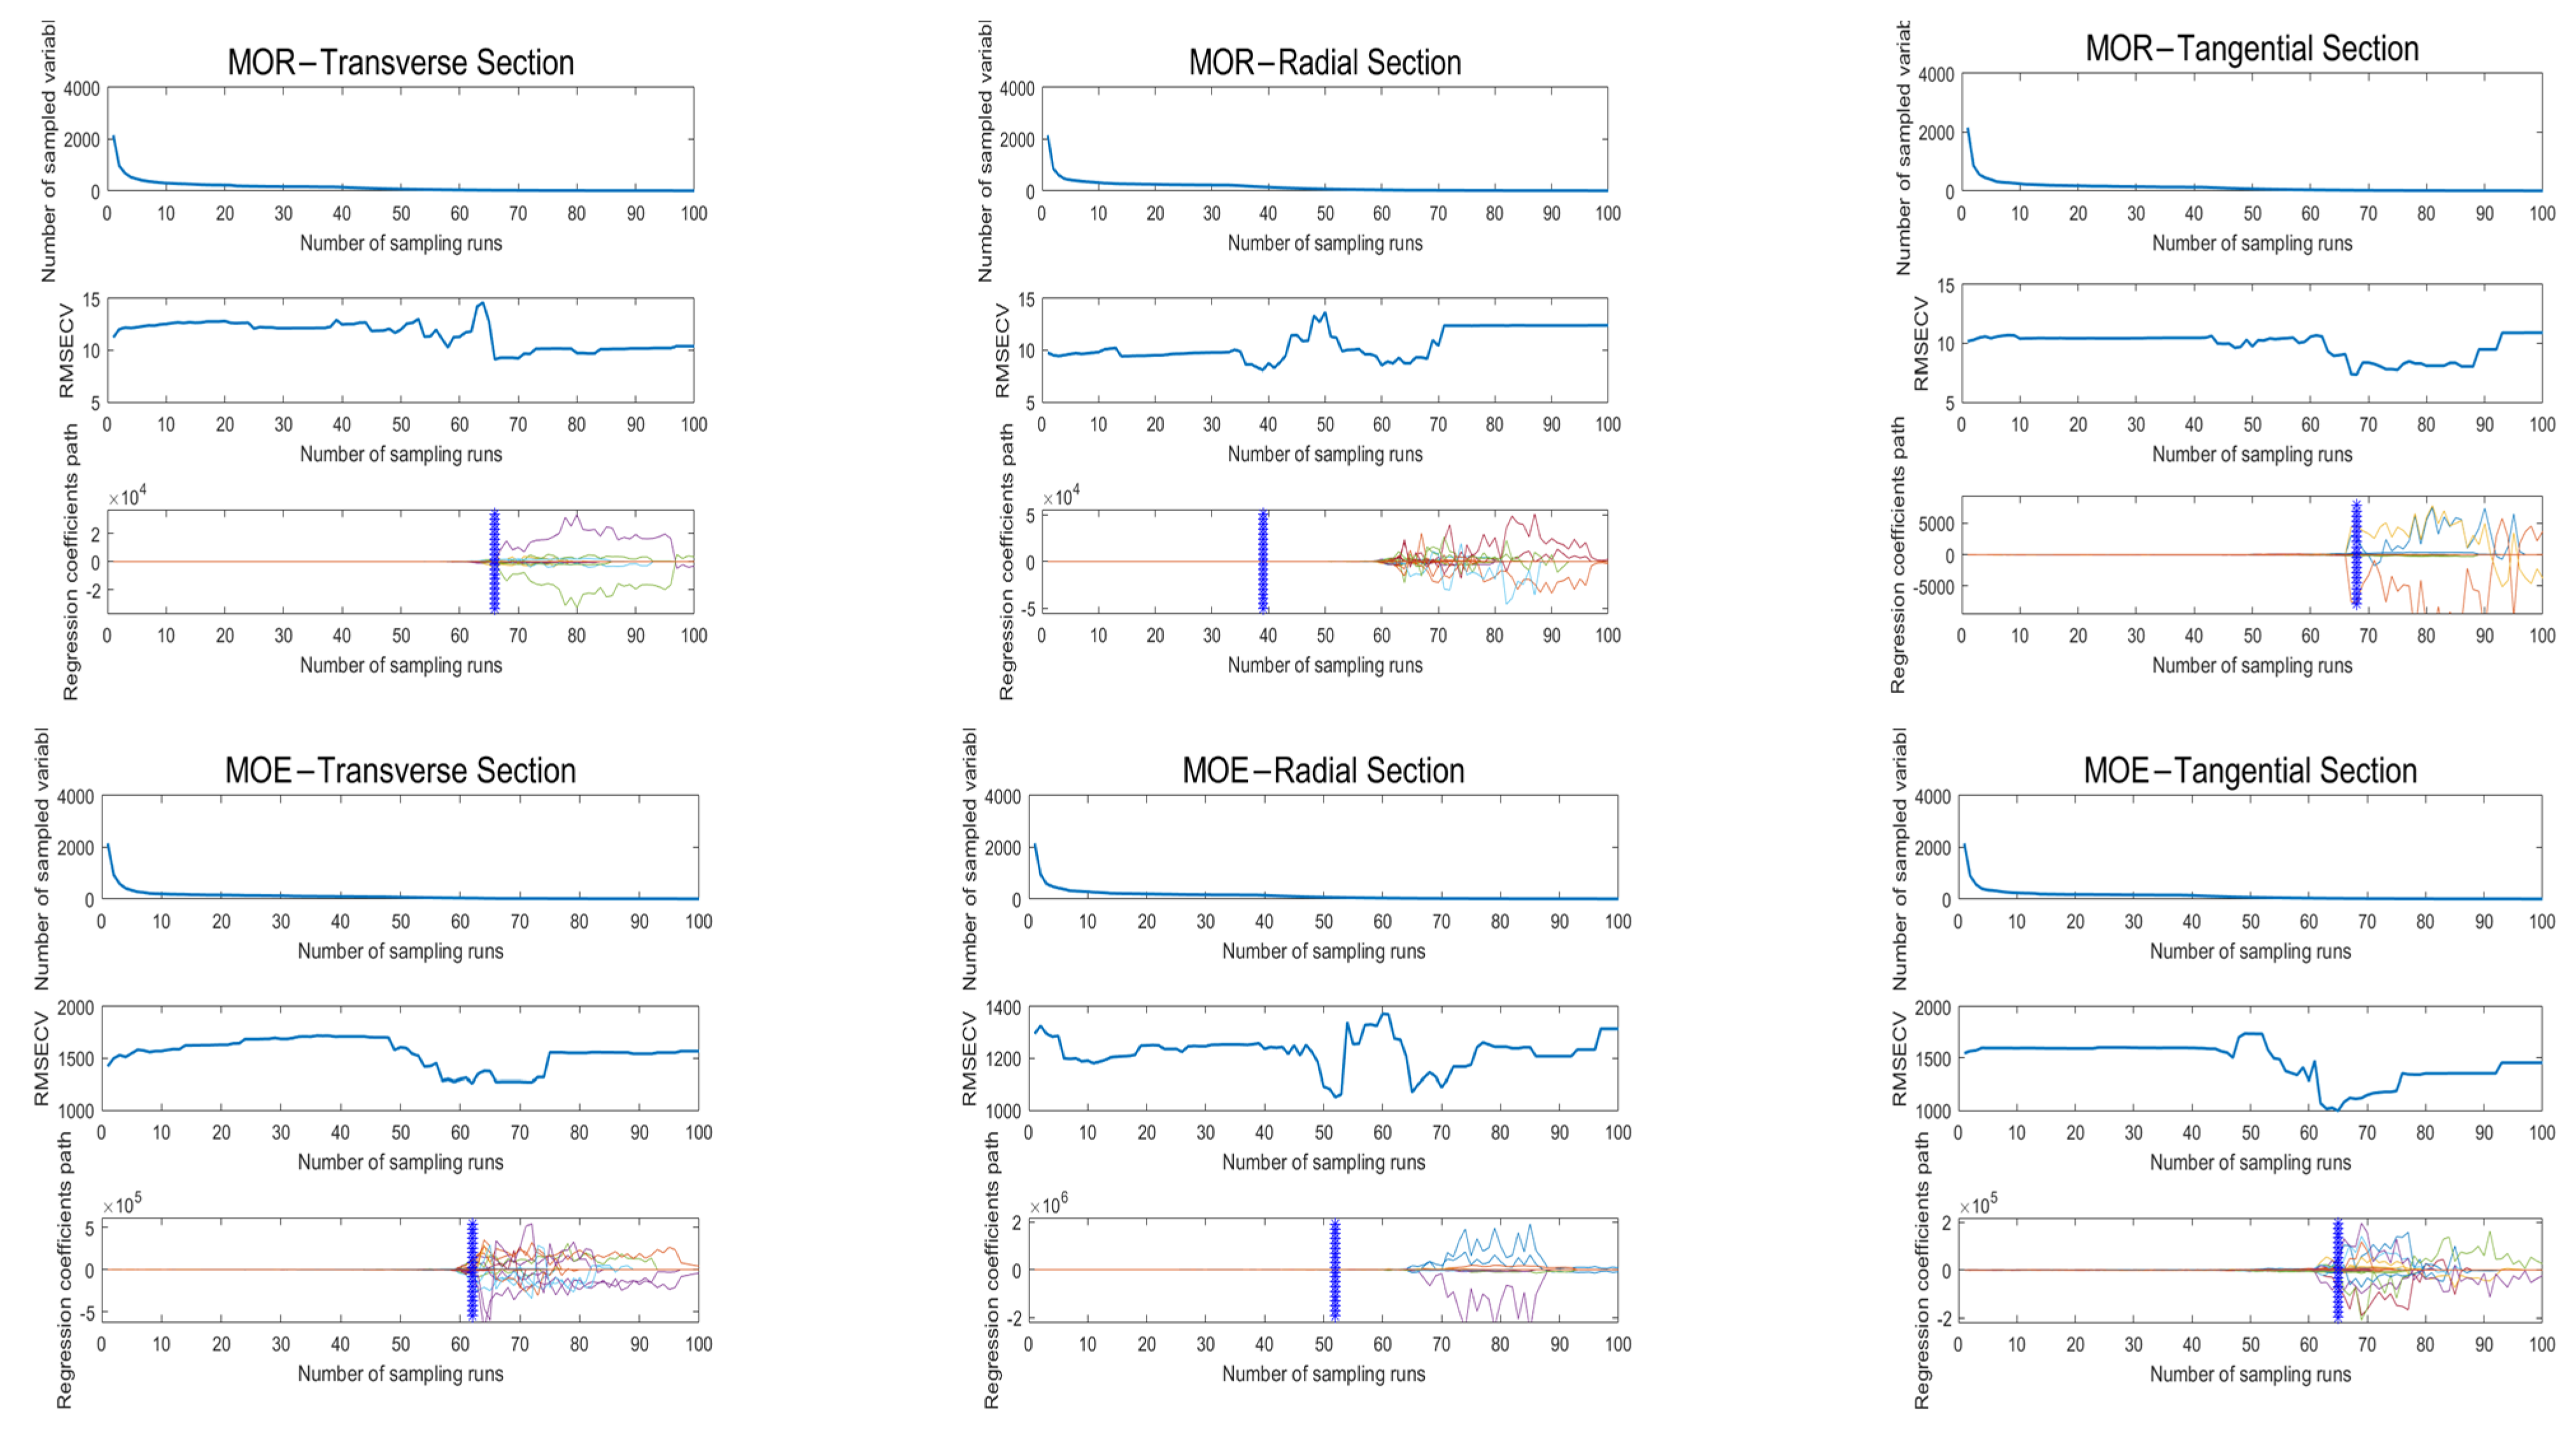
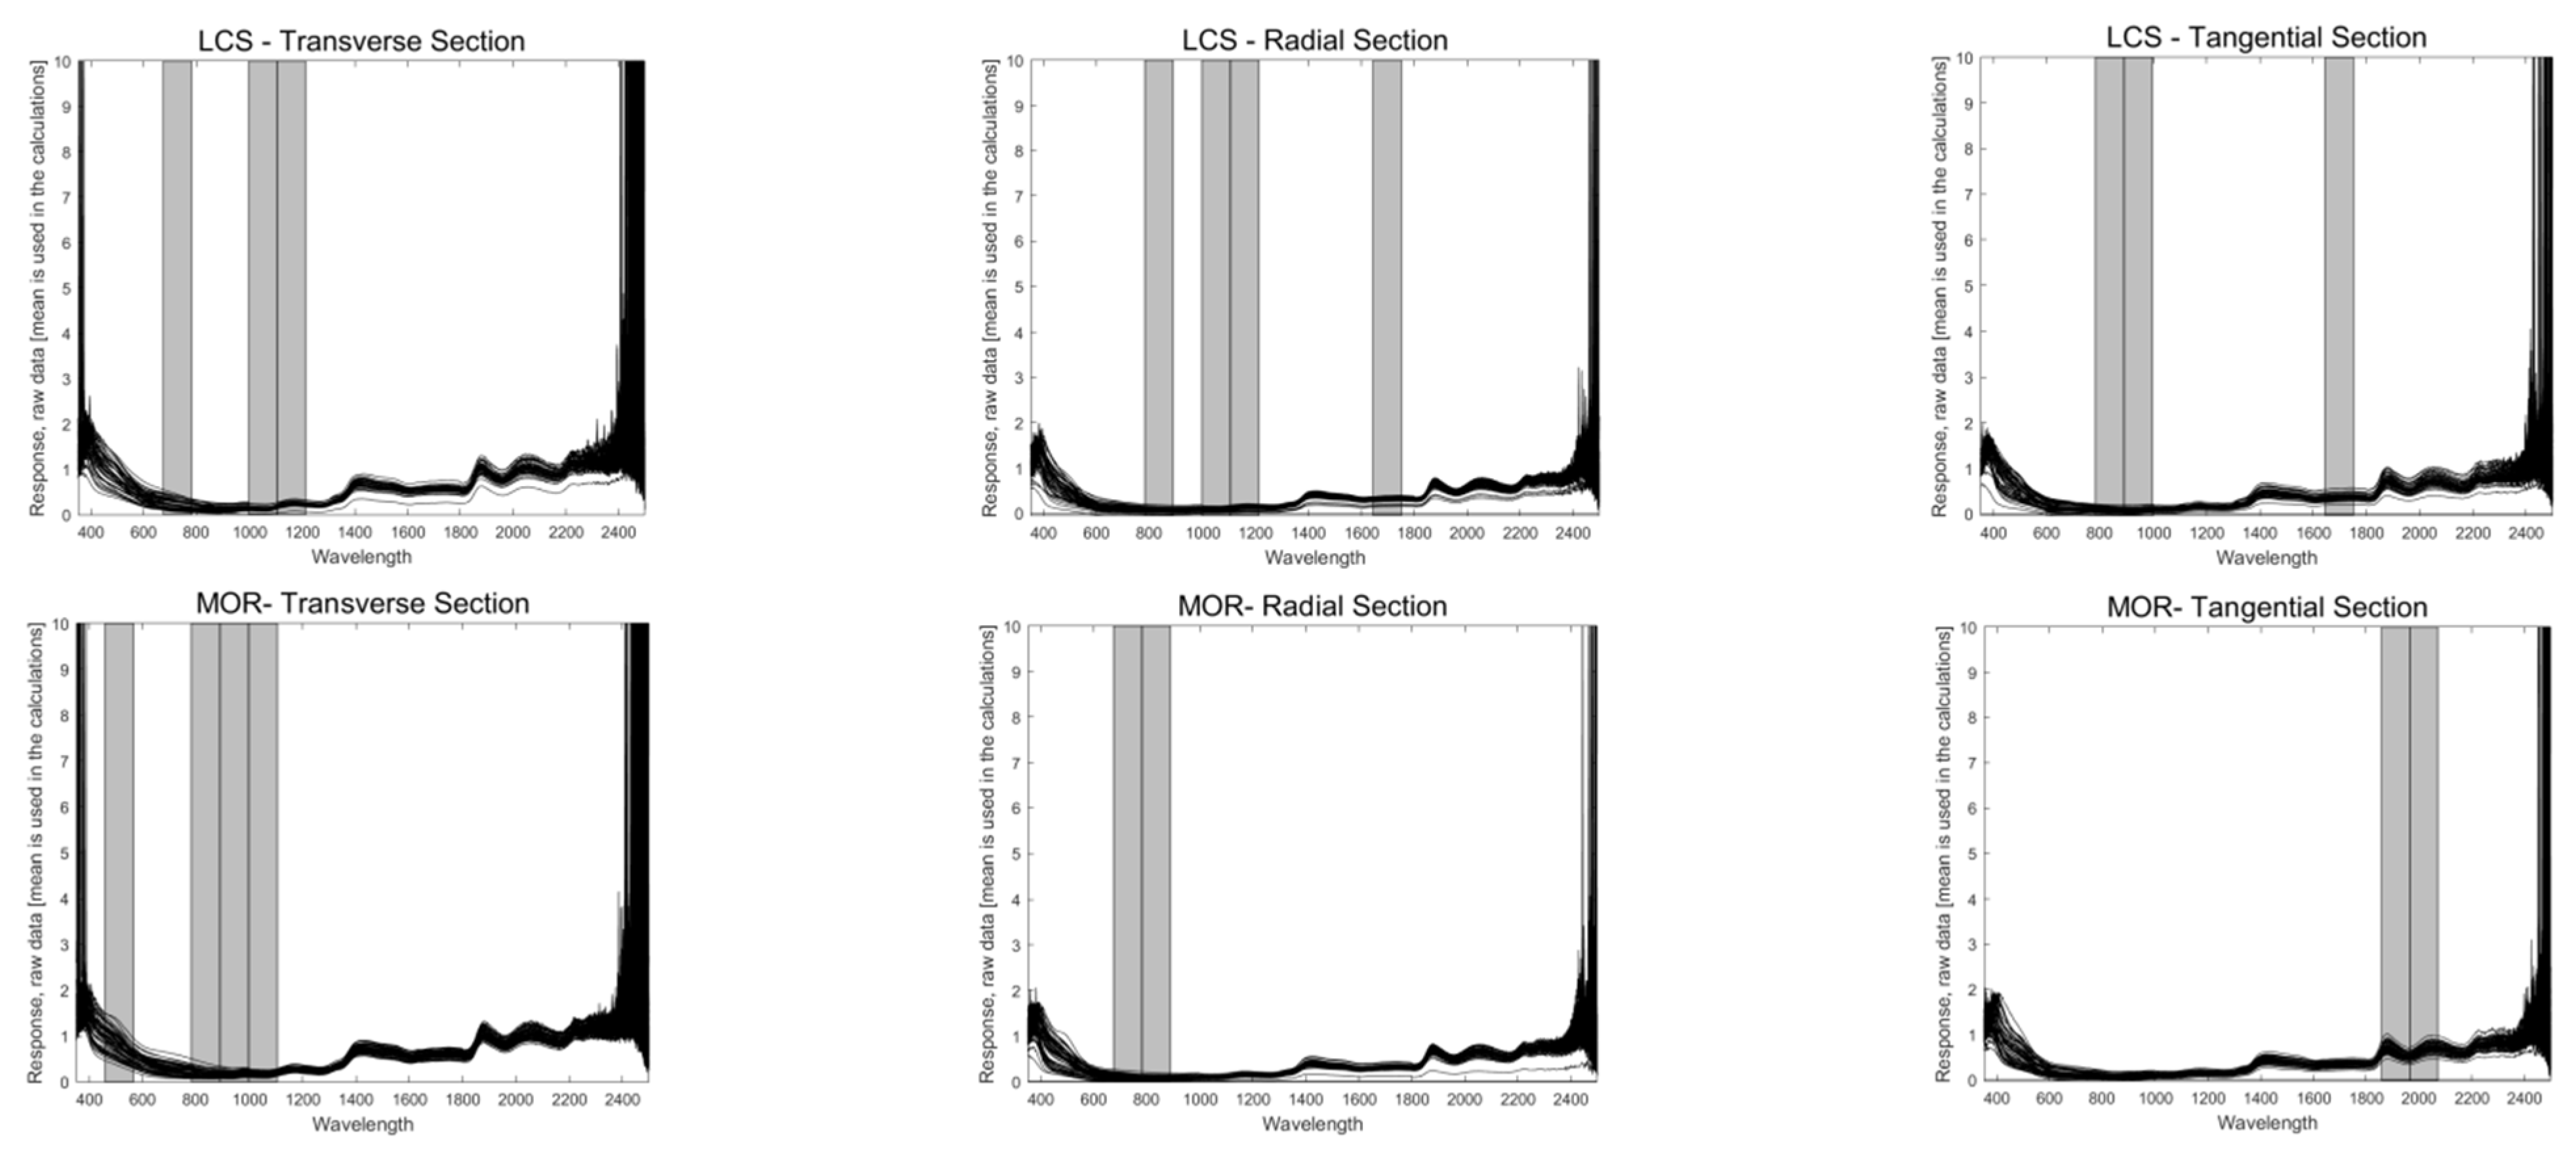
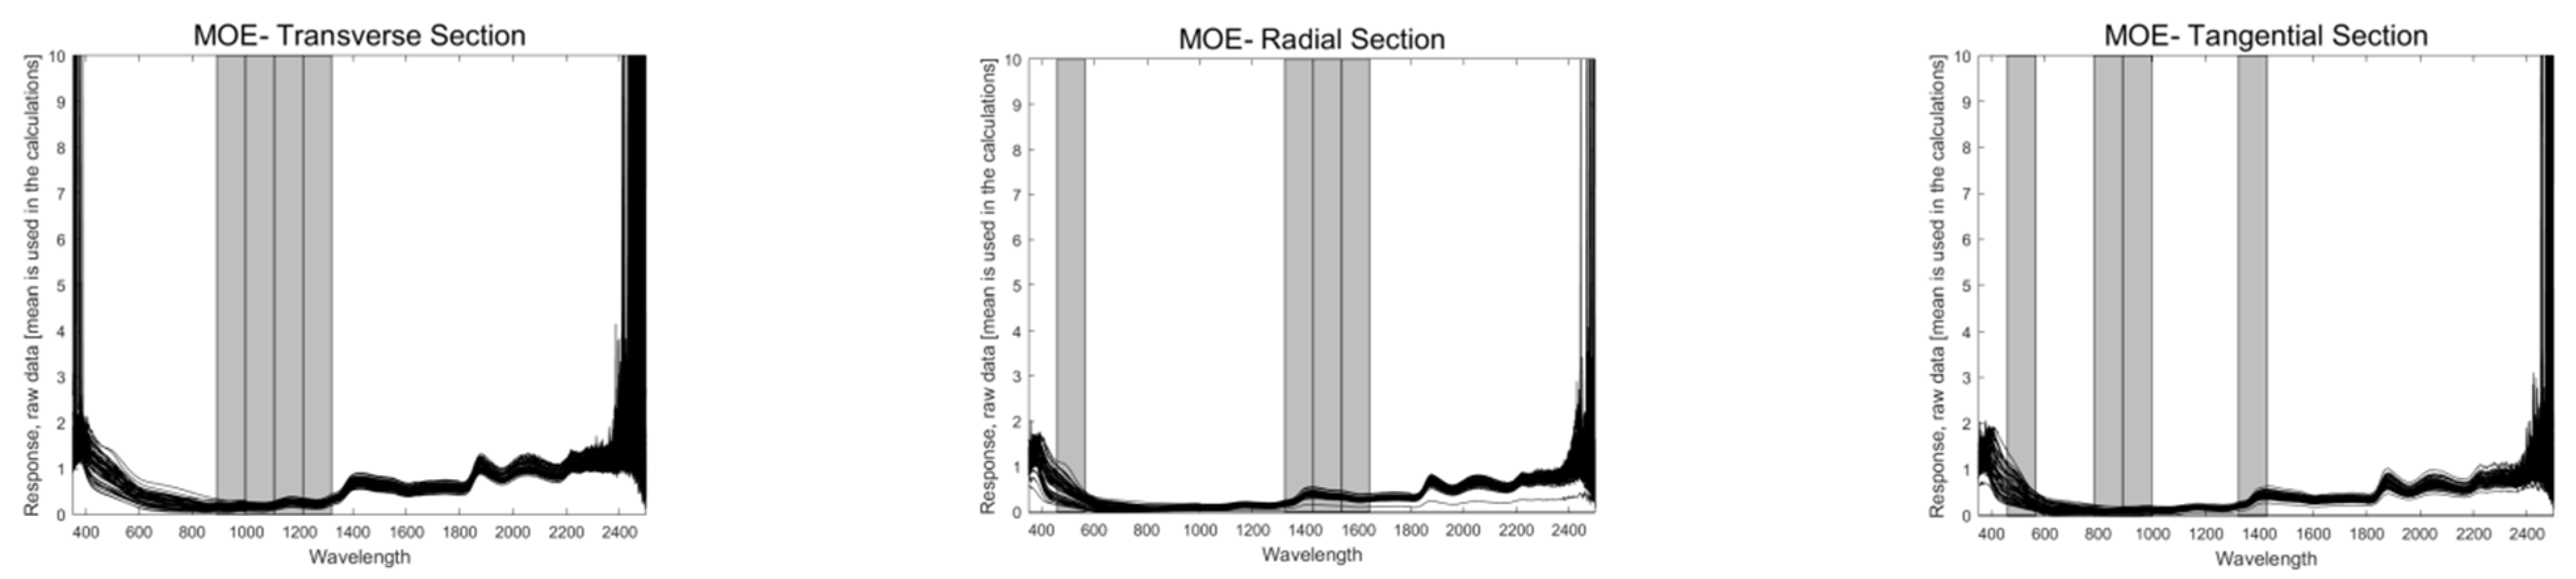
3.3. Wavelength Selection
4. Conclusions and Discussion
Author Contributions
Funding
Conflicts of Interest
References
- Li, J. A Brief Discussion of Preparing the Standard Volume Table of the Artificial Larch of the Daxing’anling Forestry Region in Inner Mongolia. Inn. Mong. For. Investig. Des. 2014, 37, 59–61,107. [Google Scholar] [CrossRef]
- Mu, C.; Sun, X.; Ni, Z.; Yang, M.; Zhang, N. Comprehensive Evaluation of the Effects Planting in Swamp-Forest in Daxing’an Mountains. Sci. Silvae Sin. 2007, 43, 51–58. [Google Scholar] [CrossRef]
- Xin, X.; Li, Y. Economy Analysis of Larix Gmelini. For. Sci. Technol. Inf. 2009, 41, 6–7. [Google Scholar] [CrossRef]
- Zhao, X. Study on the Strength Properties of Larch Dimension Lumber. Ph.D. Thesis, Chinese Academy of Forestry, Beijing, China, 2010. [Google Scholar]
- Sorensson, C.; Bian, R.; Wellauer, B.; Alley, R. Structural lumber conversion potential of clonal radiata. Proc. Wood Qual. 2004. [Google Scholar] [CrossRef]
- Huang, T.; Fu, Y.; Li, N. Physical and Mechanical Properties of Shorea chinensis Wood. J. Northwest For. Univ. 2013, 28, 160–163. [Google Scholar] [CrossRef]
- Huang, T.; Wang, J.; Luan, J.; Song, L.; Lei, F. Evaluation of Wood Physical and Mechanical Properties in Eucalyptus urophylla × E. grandis Clone Plantations at Different Ages. Chin. J. Trop. Agric. 2021, 41, 95–100. [Google Scholar] [CrossRef]
- Sun, X.; Chu, X.; Zhang, S.; Liu, J. Timber Evaluation on Physical and Mechanical Properties of Species and Hybrids of Larix. Sci. Silvae Sin. 2012, 48, 153–159. [Google Scholar] [CrossRef]
- Li, J. Wood Science Research; Science Press: Beijing, China, 2009; pp. 163–164. [Google Scholar]
- Li, C.; Zhao, J.; Li, Y.; Meng, Y.; Zhang, Z. Modeling and Prediction of Soil Organic Matter Content Based on Visible-Near-Infrared Spectroscopy. Forests 2021, 12, 1809. [Google Scholar] [CrossRef]
- Meng, Y.; Zhang, Y.; Li, C.; Zhao, J.; Wang, Z.; Wang, C.; Li, Y. Prediction of the Carbon Content of Six Tree Species from Visible-Near-Infrared Spectroscopy. Forests 2021, 12, 1233. [Google Scholar] [CrossRef]
- Chu, X.; Chen, P.; Li, J.; Liu, D.; Xu, Y. Progresses and Perspectives of Near Infrared Spectrocopy Analytical Technology. J. Instrum. Anal. 2020, 39, 1181–1188. [Google Scholar] [CrossRef]
- Li, Y.; Via, B.K.; Cheng, Q.; Zhao, J.; Li, Y. New Pretreatment Methods for Visible–Near-Infrared Calibration Modeling of Air-Dry Density of Ulmus pumila Wood. For. Prod. J. 2019, 69, 188–194. [Google Scholar] [CrossRef]
- Li, Y.; Via, B.K.; Young, T.; Li, Y. Visible-near infrared spectroscopy and chemometric methods for wood density prediction and origin/species identification. Forests 2019, 10, 1078. [Google Scholar] [CrossRef] [Green Version]
- Yu, H.; Zhao, R.; Fu, F.; Fei, B.; Jiang, Z. Prediction Mechanical Properties of Chinese Fir Wood by Near Infrared Spectroscopy. J. Northwest For. Univ. 2007, 22, 149–154. [Google Scholar] [CrossRef]
- Fernández-Cabanás, V.; Garrido-Varo, A.; Pérez-Marín, D.; Dardenne, P. Evaluation of pretreatment strategies for near-infrared spectroscopy calibration development of unground and ground compound feedingstuffs. Appl. Spectrosc. 2006, 60, 17–23. [Google Scholar] [CrossRef] [PubMed]
- Silalahi, D.D.; Midi, H.; Arasan, J.; Mustafa, M.S.; Caliman, J.-P. Robust generalized multiplicative scatter correction algorithm on pretreatment of near infrared spectral data. Vib. Spectrosc. 2018, 97, 55–65. [Google Scholar] [CrossRef]
- Yuan, Y.; Wang, W.; Chu, X.; Xi, M. Selection of Characteristic Wavelengths Using SPA and Qualitative Discrimination of Mildew Degree of Corn Kernels Based on SVM. Spectrosc. Spectr. Anal. 2016, 36, 226–230. [Google Scholar] [CrossRef]
- Tian, H.; Zhang, L.; Li, M.; Wang, Y.; Sheng, D.; Liu, J.; Wang, C. Weighted SPXY method for calibration set selection for composition analysis based on near-infrared spectroscopy. Infrared Phys. Technol. 2018, 95, 88–92. [Google Scholar] [CrossRef]
- Zhan, X.-R.; Zhu, X.-R.; Shi, X.-Y.; Zhang, Z.-Y.; Qiao, Y.-J. Determination of hesperidin in tangerine leaf by near-infrared spectroscopy with SPXY algorithm for sample subset partitioning and Monte Carlo cross validation. Spectrosc. Spectr. Anal. 2009, 29, 964–968. [Google Scholar] [CrossRef]
- Horvath, L.; Peszlen, I.; Peralta, P.; Kelley, S. Use of transmittance near-infrared spectroscopy to predict the mechanical properties of 1- and 2-year-old transgenic aspen. Wood Sci. Technol. 2014, 45, 303–314. [Google Scholar] [CrossRef]
- Fujimoto, T.; Yamamoto, H.; Tsuchikawa, S. Estimation of wood stiffness and strength properties of hybrid larch by near-infrared spectroscopy. Appl. Spectrosc. 2007, 61, 882–888. [Google Scholar] [CrossRef]
- Leblon, B.; Adedipe, O.; Hans, G.; Haddadi, A.; Tsuchikawa, S.; Burger, J.; Stirling, R.; Pirouz, Z.; Groves, K.; Nader, J.; et al. A review of near-infrared spectroscopy for monitoring moisture content and density of solid wood. For. Chron. 2013, 89, 595–606. [Google Scholar] [CrossRef]
- Thumm, A.; Meder, R. Stiffnes prediction of radiata pine clearwood test pieces using infrared spectroscopy. J. Near Infrared Spectrosc. 2001, 9, 117–122. [Google Scholar] [CrossRef]
- Guo, Z.; Wang, M.; Agyekum, A.A.; Wu, J.; Chen, Q.; Zuo, M.; El-Seedi, H.R.; Tao, F.; Shi, J.; Ouyang, Q. Quantitative detection of apple watercore and soluble solids content by near infrared transmittance spectroscopy. J. Food Eng. 2020, 279, 109955. [Google Scholar] [CrossRef]
- Zhang, P.; Shang, X.; Wu, Z. Difference in Wood Physical and Mechanical Properties of Five Kinds of Eucalyptus. J. Northwest For. Univ. 2020, 35, 184–190. [Google Scholar] [CrossRef]
- Li, S.; Shan, Y.; Fan, W.; Yin, Y.; Zhou, Z.; Li, G. Analysis of pH and Acidity of Honey by Near Infrared Spectroscopy Based on MCCV Outlier Dectection and CARS Variable Selection. Food Sci. 2011, 32, 182–185. [Google Scholar]
- Liu, Y.; Ying, Y.; Jiang, H. Rapid determination of maturity in apple using outlier detection and calibration model optimization. Trans. ASABE 2006, 49, 91–95. [Google Scholar] [CrossRef]
- Liu, C.; Hu, Y.; Wu, S.; Sun, X.; Dou, S.; Miao, Y.; Dou, Y. Outlier Sample Eliminating Methods for Building Calibration Model of Near Infrared Spectroscopy Analysis. J. Food Sci. Technol. 2014, 32, 74–79. [Google Scholar] [CrossRef]
- Xu, F.; Fu, D.; Wang, Q.; Xiao, Z.; Wang, B. Nondestructive detection of sugar content and acidity in Red Globe table grapes using visible near infrared spectroscopy based on Monte-Carlo cross validation-competitive adaptive reweighted sampling-random forest (MCCV-CARS-RF). Shipin Kexue Food Sci. 2018, 39, 149–154. [Google Scholar] [CrossRef]
- Yang, Z.; Xiao, H.; Zhang, L.; Feng, D.; Zhang, F.; Jiang, M.; Sui, Q.; Jia, L. Fast determination of oxide content in cement raw meal using NIR spectroscopy with the SPXY algorithm. Anal. Methods 2019, 11, 3936–3942. [Google Scholar] [CrossRef]
- Chen, Y.; Qi, T.; Huang, Y.; Wan, Y.; Zhao, R.; Qi, L.; Zhang, C.; Fei, T. Optimization method of calibration dataset for VIS_NIR spectral inversion model of soil organic matter content. Trans. Chin. Soc. Agric. Eng. 2017, 33, 107–114. [Google Scholar] [CrossRef]
- Mei, C.; Chen, Y.; Yin, L.; Jiang, H.; Chen, X.; Ding, Y.; Liu, G. Wavelength Selection by SiPLS-LASSO for NIR Spectroscopy and Its Application. Spectrosc. Spectr. Anal. 2018, 38, 436–440. [Google Scholar] [CrossRef]
- Gan, L.; Sun, T.; Liu, J.; Liu, M. Double Pulse LIBS Combined with Variable Screening to Detect Procymidone Content. Spectrosc. Spectr. Anal. 2019, 39, 584–588. [Google Scholar] [CrossRef]
- Huo, Y.; Zhang, C.; Li, Y.; Zhi, W.; Zhang, J.; Liu, J. Nondestructive detection for kiwifruit based on the hyperspectral technology and machine learning. J. Chin. Agric. Mech. 2019, 40, 71–77. [Google Scholar] [CrossRef]
- Zhang, Y.; Ren, D.; Han, Y.; Li, J. Air target reference spectrum selection based on characteristic wavelengths extracted by successive projections algorithm. Infrared Laser Eng. 2021, 50, 232–242. [Google Scholar] [CrossRef]
- Huang, P.; Li, Y.; Yu, Q.; Wang, K.; Yin, H.; Hou, D.; Zhang, G. Classification of Organic Contaminants in Water Distribution Systems Developed by SPA and Multi-Classification SVM Using UV-Vis Spectroscopy. Spectrosc. Spectr. Anal. 2020, 40, 2267–2272. [Google Scholar] [CrossRef]
- Sun, T.; Wu, Y.; Liu, X.; Mo, X.; Liu, M. Detection of Chromium Content in Soybean Oil by Laser Induced Breakdown Spectroscopy and UVE Method. Spectrosc. Spectr. Anal. 2016, 36, 3341–3345. [Google Scholar] [CrossRef]
- Miao, X.; Miao, Y.; Gong, H.; Tao, S.; Chen, Y.; Chen, Z. Determination of Moisture Content in Rice by Near Infrared Spectroscopy with Different Partial Least Squares. J. Anal. Sci. 2019, 35, 643–649. [Google Scholar] [CrossRef]
- Yang, H.; Zhu, M. Study of Rapid Detection of Soil Organic Matter Based on Characteristic Wavelength Selection of Visible-near Infrared Spectra. Infrared 2015, 36, 42–48. [Google Scholar] [CrossRef]
- Yang, Z.; Xiao, H.; Zhang, L.; Feng, D.; Zhang, F.; Jiang, M.; Sui, Q.; Jia, L. Fast determination of oxides content in cement raw meal using NIR spectroscopy combined with synergy interval partial least square and different preprocessing methods. Measurement 2020, 149, 106990. [Google Scholar] [CrossRef]
- Chen, Y.; Di, Y.; Tang, X.; Cui, X.; Gao, X.; Cao, J.; Li, S. Combination Weight COD Concentration Prediction Model Based on BiPLS and SiPLS. Spectrosc. Spectr. Anal. 2019, 39, 2176–2181. [Google Scholar] [CrossRef]
- Cheng, B.; Chen, D.; Wu, X. Near Infrared Spectral Wavelength Selection Based on Moving Window-Iterative Genetic Algorithm Method. Chin. J. Anal. Chem. 2006, 34, 123–130. [Google Scholar] [CrossRef]
- Shen, L.; Gao, M.; Yan, J.; Yao, Y. Estimation model of soil organic matter based on SVR and PLSR. China Agric. Inform. 2019, 31, 58–71. [Google Scholar] [CrossRef]
- Di Bucchianico, A. Coefficient of determination (R2). Encycl. Stat. Qual. Reliab. 2008, 1. [Google Scholar] [CrossRef]
- Hong, Y.; Yu, L.; Zhu, Y.; Li, S.; Guo, L.; Liu, J.; Nie, S.; Zhou, Y. Using Orthogonal Signal Correction Algorithm Removing the Effects of Soil Moisture on Hyperspectral Reflectance to Estimate Soil Organic Matter. Sci. Agric. Sin. 2017, 50, 3766–3777. [Google Scholar] [CrossRef]
- Liu, Z.; Cai, W.; Shao, X. Monte Carlo Cross Validation for Identification of Singular Samples in Near Infrared Spectroscopy. Sci. Sin. 2008, 38, 316–323. [Google Scholar] [CrossRef]
- Jia, M.; Li, W.; Wang, K.; Zhou, C.; Cheng, T.; Tian, Y.; Zhu, Y.; Cao, W.; Yao, X. A newly developed method to extract the optimal hyperspectral feature for monitoring leaf biomass in wheat. Comput. Electron. Agric. 2019, 165, 104942. [Google Scholar] [CrossRef]
- Zhang, Y.; Su, Y.; Li, C.; Men, H. Analysis of MOR and MOE prediction model of Quercus mongolica wood by near infrared spectroscopy. J. Beijing For. Univ. 2016, 38, 99–105. [Google Scholar] [CrossRef]
- Hu, M.; Wen, Z. A New Wavelength Selection Algorithm Based on the Fusion of Multiple Models. Spectrosc. Spectr. Anal. 2010, 30, 2088–2092. [Google Scholar] [CrossRef]

| Mechanical Property | Section | Before Screening | After Screening | ||||
|---|---|---|---|---|---|---|---|
| Sample Number | RMSE | R2 | Sample Number | RMSE | R2 | ||
| LCS | Trans Section | 81 | 3.8035 | 0.5690 | 77 | 3.3119 | 0.6406 |
| Rad Section | 81 | 5.5474 | 0.0831 | 78 | 5.0671 | 0.0929 | |
| Tang Section | 81 | 5.5111 | 0.0950 | 77 | 4.7498 | 0.1563 | |
| MOR | Trans Section | 99 | 10.4792 | 0.3535 | 91 | 9.1556 | 0.4415 |
| Rad Section | 99 | 9.9123 | 0.4215 | 90 | 8.0021 | 0.5668 | |
| Tang Section | 99 | 11.9027 | 0.1659 | 86 | 9.2123 | 0.2706 | |
| MOE | Trans Section | 99 | 1293.5190 | 0.3260 | 96 | 1066.2353 | 0.5132 |
| Rad Section | 99 | 1188.6372 | 0.4308 | 93 | 971.3656 | 0.5686 | |
| Tang Section | 99 | 1357.9858 | 0.2571 | 91 | 1177.7148 | 0.3269 | |
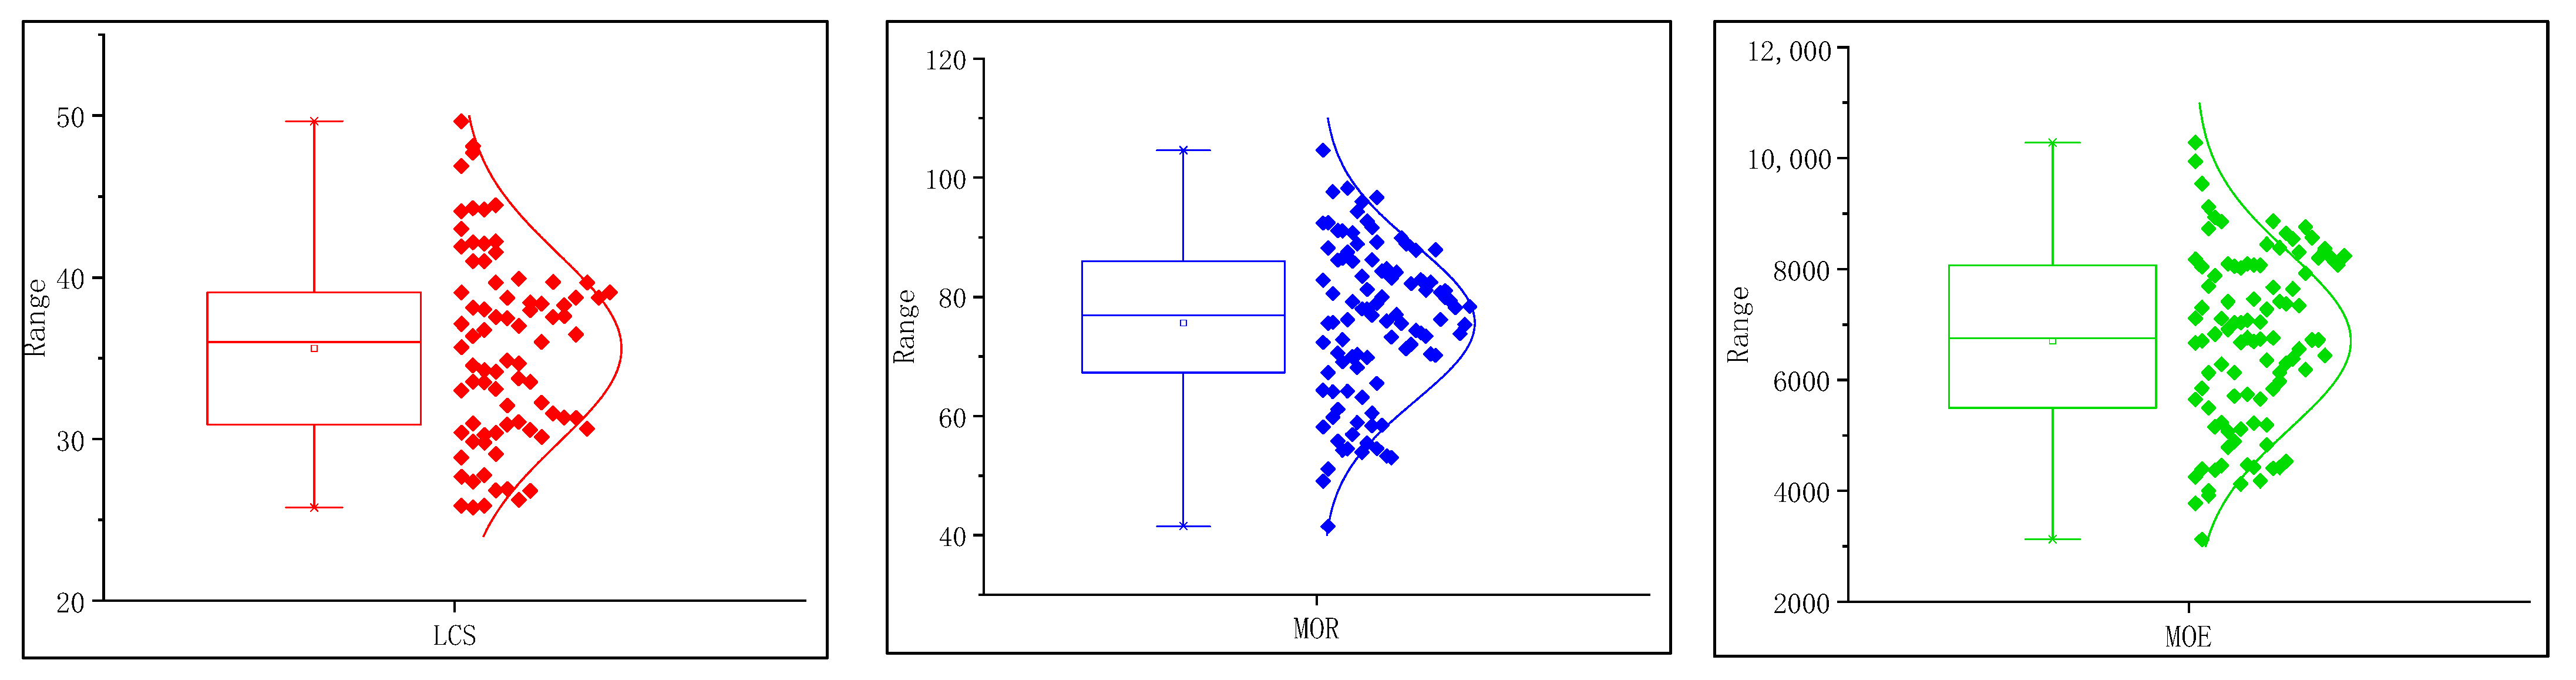
| Mechanical Property | Section | Sample Grouping | Number of Samples | Minimum (Mpa) | Maximum (Mpa) | Average (Mpa) | Standard Deviation (%) |
|---|---|---|---|---|---|---|---|
| LCS | Trans Section | cal | 51 | 25.76 | 49.65 | 36.25 | 5.84 |
| val | 26 | 26.8 | 44.19 | 34.31 | 4.82 | ||
| Rad Section | cal | 52 | 25.76 | 46.87 | 35.38 | 5.44 | |
| val | 26 | 25.87 | 44.19 | 34.57 | 5.22 | ||
| Tang Section | cal | 51 | 25.87 | 44.27 | 35.35 | 4.89 | |
| val | 26 | 25.76 | 44.46 | 34.18 | 5.80 | ||
| MOR | Trans Section | cal | 60 | 54.24 | 104.61 | 78.94 | 11.74 |
| val | 31 | 53.01 | 92.7 | 71.61 | 11.62 | ||
| Rad Section | cal | 60 | 41.5 | 95.99 | 74.89 | 12.87 | |
| val | 30 | 53.01 | 97.65 | 74.01 | 11.00 | ||
| Tang Section | cal | 57 | 53.92 | 98.25 | 76.51 | 11.21 | |
| val | 29 | 53.31 | 92.39 | 75.55 | 10.27 | ||
| MOE | Trans Section | cal | 64 | 3124.91 | 9942.79 | 6865.20 | 1558.43 |
| val | 32 | 4128.55 | 8642.89 | 6145.76 | 1393.05 | ||
| Rad Section | cal | 62 | 3124.91 | 9536.82 | 6527.45 | 1477.71 | |
| val | 31 | 4255.43 | 8931.31 | 7077.10 | 1460.16 | ||
| Tang Section | cal | 60 | 3777.54 | 9536.82 | 6762.04 | 1483.91 | |
| val | 31 | 4181.45 | 8544.13 | 6563.14 | 1375.92 |
| Wavelength Selection | Trans Section | Rad Section | Tang Section | ||||||||||
|---|---|---|---|---|---|---|---|---|---|---|---|---|---|
| Calibration Models | Validation Models | Calibration Models | Validation Models | Calibration Models | Validation Models | ||||||||
| RMSE | R2 | RMSE | R2 | RMSE | R2 | RMSE | R2 | RMSE | R2 | RMSE | R2 | ||
| LCS | -- | 3.0187 | 0.7274 | 2.3166 | 0.7596 | 5.0737 | 0.1119 | 4.8146 | 0.1140 | 4.2422 | 0.2315 | 4.0989 | 0.4807 |
| UVE | 4.3095 | 0.4444 | 2.8919 | 0.6253 | 3.9129 | 0.4718 | 2.1699 | 0.8200 | 4.4751 | 0.1448 | 3.2692 | 0.6696 | |
| SPA | 4.6143 | 0.3631 | 2.6337 | 0.6892 | 5.1146 | 0.0975 | 3.7034 | 0.4758 | 4.1448 | 0.2664 | 3.3530 | 0.6525 | |
| CARS | 1.6866 | 0.9149 | 0.6599 | 0.9805 | 2.3512 | 0.8093 | 3.4580 | 0.5430 | 2.6530 | 0.6994 | 1.5944 | 0.9214 | |
| SiPLS | 4.2458 | 0.4607 | 3.0068 | 0.5949 | 0.4484 | 0.9931 | 1.8195 | 0.8735 | 1.4138 | 0.9146 | 3.6286 | 0.5930 | |
| UVE-CARS | 3.6219 | 0.6076 | 3.3401 | 0.5002 | 4.8225 | 0.1977 | 3.1118 | 0.6299 | 4.1233 | 0.2740 | 3.1086 | 0.7013 | |
| SiPLS-UVE | 3.8154 | 0.5645 | 3.3771 | 0.4890 | 3.9434 | 0.4635 | 1.5985 | 0.9023 | 3.4262 | 0.4987 | 3.8762 | 0.5355 | |
| SiPLS-SPA | 3.2541 | 0.6832 | 3.0000 | 0.5968 | 2.7740 | 0.7345 | 3.2727 | 0.5906 | 3.7434 | 0.4016 | 2.7159 | 0.7720 | |
| SiPLS-CARS | 0.7017 | 0.9853 | 0.6771 | 0.9795 | 0.2242 | 0.9983 | 0.2010 | 0.9985 | 0.4762 | 0.9903 | 0.6005 | 0.9889 | |
| MOR | -- | 7.2867 | 0.6086 | 7.1487 | 0.6087 | 8.1888 | 0.5885 | 5.7562 | 0.7170 | 9.1872 | 0.3161 | 8.6206 | 0.2703 |
| UVE | 10.4640 | 0.1928 | 7.8751 | 0.5251 | 7.1141 | 0.6895 | 4.6872 | 0.8123 | 7.2857 | 0.5699 | 6.9493 | 0.5258 | |
| SPA | 10.9926 | 0.1092 | 9.3522 | 0.3302 | 9.2175 | 0.4787 | 5.2613 | 0.7635 | 9.1262 | 0.3251 | 8.4597 | 0.2973 | |
| CARS | 8.1744 | 0.5074 | 1.3085 | 0.9869 | 1.6556 | 0.9832 | 1.9667 | 0.9670 | 5.0289 | 0.7951 | 4.6230 | 0.7901 | |
| SiPLS | 6.7776 | 0.6614 | 5.7152 | 0.7499 | 6.2629 | 0.7593 | 5.2525 | 0.7643 | 5.5616 | 0.7494 | 7.7502 | 0.4102 | |
| UVE-CARS | 8.7328 | 0.4378 | 7.8751 | 0.5251 | 5.0520 | 0.8434 | 1.7270 | 0.9745 | 7.9975 | 0.4817 | 6.9493 | 0.5258 | |
| SiPLS-UVE | 6.6482 | 0.6742 | 5.9283 | 0.7309 | 7.6109 | 0.6446 | 5.4087 | 0.7501 | 7.6510 | 0.5257 | 6.3259 | 0.6071 | |
| SiPLS-SPA | 7.7680 | 0.5552 | 8.5603 | 0.4389 | 7.6952 | 0.6367 | 5.0751 | 0.7800 | 8.1958 | 0.4557 | 7.4592 | 0.4537 | |
| SiPLS-CARS | 0.8714 | 0.9944 | 1.1315 | 0.9902 | 0.4873 | 0.9985 | 0.7267 | 0.9955 | 0.8082 | 0.9947 | 1.2694 | 0.9842 | |
| MOE | -- | 782.2642 | 0.7440 | 567.9018 | 0.8284 | 922.2126 | 0.6041 | 803.4178 | 0.6872 | 1060.6739 | 0.4804 | 945.1786 | 0.5124 |
| UVE | 1173.5775 | 0.4239 | 1191.7883 | 0.2445 | 928.9296 | 0.5983 | 534.5773 | 0.8615 | 1112.7769 | 0.4281 | 861.5252 | 0.5949 | |
| SPA | 1374.5134 | 0.2098 | 917.1758 | 0.5525 | 972.4311 | 0.5598 | 575.7233 | 0.8394 | 1156.8858 | 0.3819 | 891.5219 | 0.5662 | |
| CARS | 760.5009 | 0.7581 | 474.2760 | 0.8803 | 262.2065 | 0.9680 | 306.3651 | 0.9545 | 717.4283 | 0.7623 | 176.4556 | 0.9830 | |
| SiPLS | 402.3331 | 0.9323 | 759.8211 | 0.6929 | 770.1811 | 0.7239 | 712.5736 | 0.7539 | 990.3318 | 0.5471 | 950.6278 | 0.5067 | |
| UVE-CARS | 1173.5775 | 0.4239 | 1191.7883 | 0.2445 | 928.9296 | 0.5983 | 534.5773 | 0.8615 | 1112.7769 | 0.4281 | 671.6445 | 0.7538 | |
| SiPLS-UVE | 951.5708 | 0.6213 | 668.1904 | 0.7625 | 864.6130 | 0.6520 | 800.3360 | 0.6896 | 1351.3077 | 0.1567 | 937.5018 | 0.5203 | |
| SiPLS-SPA | 1105.6073 | 0.4887 | 1154.8332 | 0.2906 | 730.6229 | 0.7515 | 778.6521 | 0.7061 | 1135.6491 | 0.4044 | 1052.0384 | 0.3959 | |
| SiPLS-CARS | 112.7340 | 0.9947 | 100.4788 | 0.9946 | 129.9646 | 0.9921 | 130.0499 | 0.9918 | 146.6291 | 0.9901 | 165.7741 | 0.9850 | |
| Mechanical Property | Section | Number of Interval Combinations | Calibration Models | Validation Models | ||
|---|---|---|---|---|---|---|
| RMSE | R2 | RMSE | R2 | |||
| LCS | Trans Section | 2 | 4.4797 | 0.3997 | 3.1738 | 0.5487 |
| 3 | 4.2458 | 0.4607 | 3.0068 | 0.5949 | ||
| 4 | 4.4279 | 0.4135 | 1.8014 | 0.8546 | ||
| Rad Section | 2 | 2.1382 | 0.8423 | 2.5097 | 0.7593 | |
| 3 | 2.5294 | 0.7793 | 1.7309 | 0.8855 | ||
| 4 | 0.4484 | 0.9931 | 1.8195 | 0.8735 | ||
| Tang Section | 2 | 2.2984 | 0.7744 | 3.2551 | 0.6725 | |
| 3 | 1.4138 | 0.9146 | 3.6286 | 0.5930 | ||
| 4 | 3.2874 | 0.5385 | 3.7984 | 0.5540 | ||
| MOR | Trans Section | 2 | 7.4541 | 0.5904 | 5.8208 | 0.7405 |
| 3 | 6.9913 | 0.6397 | 0.3208 | 0.9992 | ||
| 4 | 6.7776 | 0.6614 | 5.7152 | 0.7499 | ||
| Rad Section | 2 | 6.2629 | 0.7593 | 5.2525 | 0.7643 | |
| 3 | 8.4734 | 0.5594 | 4.9739 | 0.7887 | ||
| 4 | 7.3755 | 0.6662 | 4.9026 | 0.7947 | ||
| Tang Section | 2 | 5.5616 | 0.7494 | 7.7502 | 0.4102 | |
| 3 | 7.0872 | 0.5930 | 6.2916 | 0.6113 | ||
| 4 | 7.8786 | 0.4970 | 6.0092 | 0.6454 | ||
| MOE | Trans Section | 2 | 619.4787 | 0.8395 | 1106.1957 | 0.3491 |
| 3 | 435.2256 | 0.9208 | 754.0843 | 0.6975 | ||
| 4 | 402.3331 | 0.9323 | 759.8211 | 0.6929 | ||
| Rad Section | 2 | 903.7286 | 0.6198 | 803.3156 | 0.6443 | |
| 3 | 770.2608 | 0.7238 | 781.9038 | 0.7037 | ||
| 4 | 770.1811 | 0.7239 | 712.5736 | 0.7539 | ||
| Tang Section | 2 | 1034.6431 | 0.5056 | 1177.3204 | 0.2434 | |
| 3 | 1076.639 | 0.4647 | 970.9668 | 0.4854 | ||
| 4 | 990.3318 | 0.5471 | 950.6278 | 0.5067 | ||
Publisher’s Note: MDPI stays neutral with regard to jurisdictional claims in published maps and institutional affiliations. |
© 2022 by the authors. Licensee MDPI, Basel, Switzerland. This article is an open access article distributed under the terms and conditions of the Creative Commons Attribution (CC BY) license (https://creativecommons.org/licenses/by/4.0/).
Share and Cite
Li, C.; Li, Y.; Zhao, Y.; Zhang, Z.; Wang, Z. Mechanical Property Prediction of Larix gmelinii Wood Based on Vis-Near-Infrared Spectroscopy. Forests 2022, 13, 1995. https://doi.org/10.3390/f13121995
Li C, Li Y, Zhao Y, Zhang Z, Wang Z. Mechanical Property Prediction of Larix gmelinii Wood Based on Vis-Near-Infrared Spectroscopy. Forests. 2022; 13(12):1995. https://doi.org/10.3390/f13121995
Chicago/Turabian StyleLi, Chunxu, Yaoxiang Li, Yanzheng Zhao, Zheyu Zhang, and Zichun Wang. 2022. "Mechanical Property Prediction of Larix gmelinii Wood Based on Vis-Near-Infrared Spectroscopy" Forests 13, no. 12: 1995. https://doi.org/10.3390/f13121995